Featured Application
Intensive boreholes were drilled at the Guobo underground station to obtain a large number of rock cores in Chongqing, China. The mechanical properties and softening coefficients of the mudstone and sandstone were obtained by a series of tests. The in situ stresses were measured by the acoustic emission method with the core samples in the laboratory. Potential risks and suggestions were put forward for the underground station construction and operation.
Abstract
Chongqing is a mountain city in western China with a complex geological environment, which brings many difficulties to the construction of large sections of underground projects. In order to avoid serious problems in the construction of Guobo Station with large sections, intensive coring and laboratory tests were carried out to obtain the rock mass properties in detail. The boreholes reveal that the lithology of the rock mass in the project area consists mainly of mudstone and a small area of sandstone. The uniaxial compressive strength (UCS) and the Brazilian tensile strength (BTS) of mudstone are highly scattered, which are 4.43~42.43 MPa and 0.66~4.30 Mpa, respectively, but they all show a lognormal distribution. The average UCS of sandstone is 65.31 MPa, and the BTS is 3.06 MPa. Meanwhile, the softening coefficients of mudstone and sandstone are 0.33 and 0.73, which indicate that the water content has a great influence on the mechanical properties of the rock. For the in situ stress field, the relationship between the three principal stresses is as follows: the maximum horizontal principal stress > minimum horizontal principal stress > vertical principal stress, and the lateral pressure coefficient is 2.11~5.71. Based on the present experimental results, it is proposed that the potential risks of excavation include: (1) bias pressure (2) high in situ stress; (3) surrounding rock deterioration.
1. Introduction
Chongqing is one of the central cities in western China. It is also an important hub for the medium and long–term plans of China’s eight horizontal and eight vertical high–speed railway networks, and it occupies an important position in China’s railway transportation. It is located in the Ridge and Valley Province of Chuandong, and the landform is dominated by mountains and hills, of which mountains account for more than 76%, which is known as a mountain city. Thus, tunnels have become key projects in local engineering [1,2]. The main geological and environmental characteristics in the Chongqing region are as follows: interbedded deposits of mudstone and sandstone are widely distributed and belong to a typical red layer [3]; crustal movements are very active; rainfall is abundant and strong [4]. These geological and environmental characteristics may produce a complex in situ stress field. Meanwhile, the surrounding rock is dominated by soft rock, which is easily softened by water. Such landforms and poor geological conditions adversely impact the construction of tunnels, such as large deformation, which often leads to the failure of the surrounding rock and supporting structure of the tunnel [5,6]. For example, the Jiazhuqing tunnel [7], Yacambú–Quibor tunnel [8] and Simplon tunnel [9] all experience large deformations due to the soft surrounding rock and poor geology conditions. In addition to large deformations, tunnel collapse, water and mud inrush are also common geological disasters in soft rock tunnel construction [10,11]. Therefore, an in–depth study of the mechanical properties of rock masses is highly necessary for the typical difficult tunnel projects in this area. It will help estimate the possible risks of tunnel excavation, and it has important guiding significance for the design and construction of tunnels in similar geological areas.
Many scholars have conducted relevant studies on soft rock tunnels. Bizjak and Borut Petkovšek [12] studied and analyzed the tunnel rock behaviors of a large span tunnel in soft rock with a small to medium overburden. They found that the major displacement component of the tunnel walls was in the vertical direction and that the tunnel convergence was not stopped until the pipe ring was entirely closed with the inverted construction. Zhong et al. [13] studied the bottom heave of the Taoshuya tunnel and proposed that the main reasons for the bottom heave of the soft rock tunnel are the buckling and instability of the tunnel floor, the softening and expansion of soft rock in water, and the rheology of soft rock. Under different geological conditions, these three factors have different effects on floor heave. Piotr Małkowski et al. [14,15] analyzed the in situ measurement results of coal mine roadway measuring stations and proposed the calculation method for the floor heave. They found that, in the absence of an impact of geological factors on the stability of the excavation, the floor upheaval depends on the floor rock’s compressive strength σc and Young’s modulus E; in the case of rock mass, the condition affected by water depends on the rock’s compressive strength reduction after submerging rock in the water and, in the case of the fault, depends on the fault’s throw. It is worth mentioning that the time parameter is considered in the proposed calculation methods. In addition, a floor heave model, which covers a dry floor condition in which the parameters of the Hoek–Brown failure criterion are gradually lowered over time, and a waterlogged floor condition, in which the strength and strain parameters of the rocks are gradually reduced in line with their progressive saturation, is also presented. The consistency of the modeling and the observational results for the waterlogged roadway conditions is high. Hafeezur Rehman et al. [16] discussed the alternate bed of sandstone, siltstone and shale and their behavior in deep tunnels. Li. [17] used FLAC3D to calculate the distribution characteristics of the stress field, displacement field and seepage field of the surrounding rock of a double arch tunnel with or without the seepage effect. The results showed that the stress field of the surrounding rock without considering the seepage effect is generally larger than that with considering the seepage effect. The horizontal stress of the former is 20–30% higher than that of the latter, while the vertical stress is almost the same. The settlement of the tunnel crown is nearly twice as large as that without considering the seepage effect, and the horizontal displacement is not much different.
All the above studies refer to the tunnels that have been excavated or completed, and few scholars have conducted in–depth studies on the surrounding rocks in the project area before tunnel excavation.
Therefore, this paper will first conduct laboratory tests on a large number of rock cores obtained from the intensive boreholes in the project area to obtain the basic mechanical and softening properties of the surrounding rock. Meanwhile, the in situ stress field will be determined by the core repositioning technology and acoustic emission method. Finally, we will discuss the possible problems and corresponding suggestions for underground station excavation and operation in the near future.
2. Project Overview and Geological Conditions of the Area
The Ridge and Valley Province of Chuandong is located in the east of the Sichuan Basin. Affected by the distribution, geometric characteristics and fault boundary conditions of the rigid basement and brittle layer detachment layer in the Sichuan Basin, Ridge and Valley Province of Chuandong, has become the most orderly mountain range combination area in China and also the most Jura–type fold mountain in the world [18,19,20,21]. In this area, there are more than 30 northeast–southwest aligned parallel mountains. Figure 1a shows the location of the project, which illustrates that the project will be constructed under significantly difficult geological conditions between Huaying Mountain and Tongluo Mountain. Meanwhile, the stratum here is the red beds of the eastern Sichuan Basin, which are continental sedimentary rocks consisting of alternating red mudstone and celadon sandstone or silts [22,23].
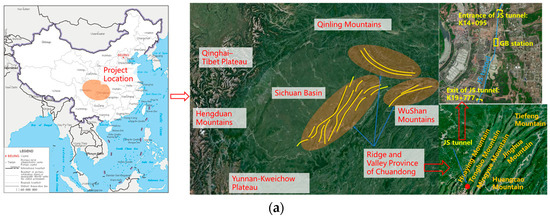

Figure 1.
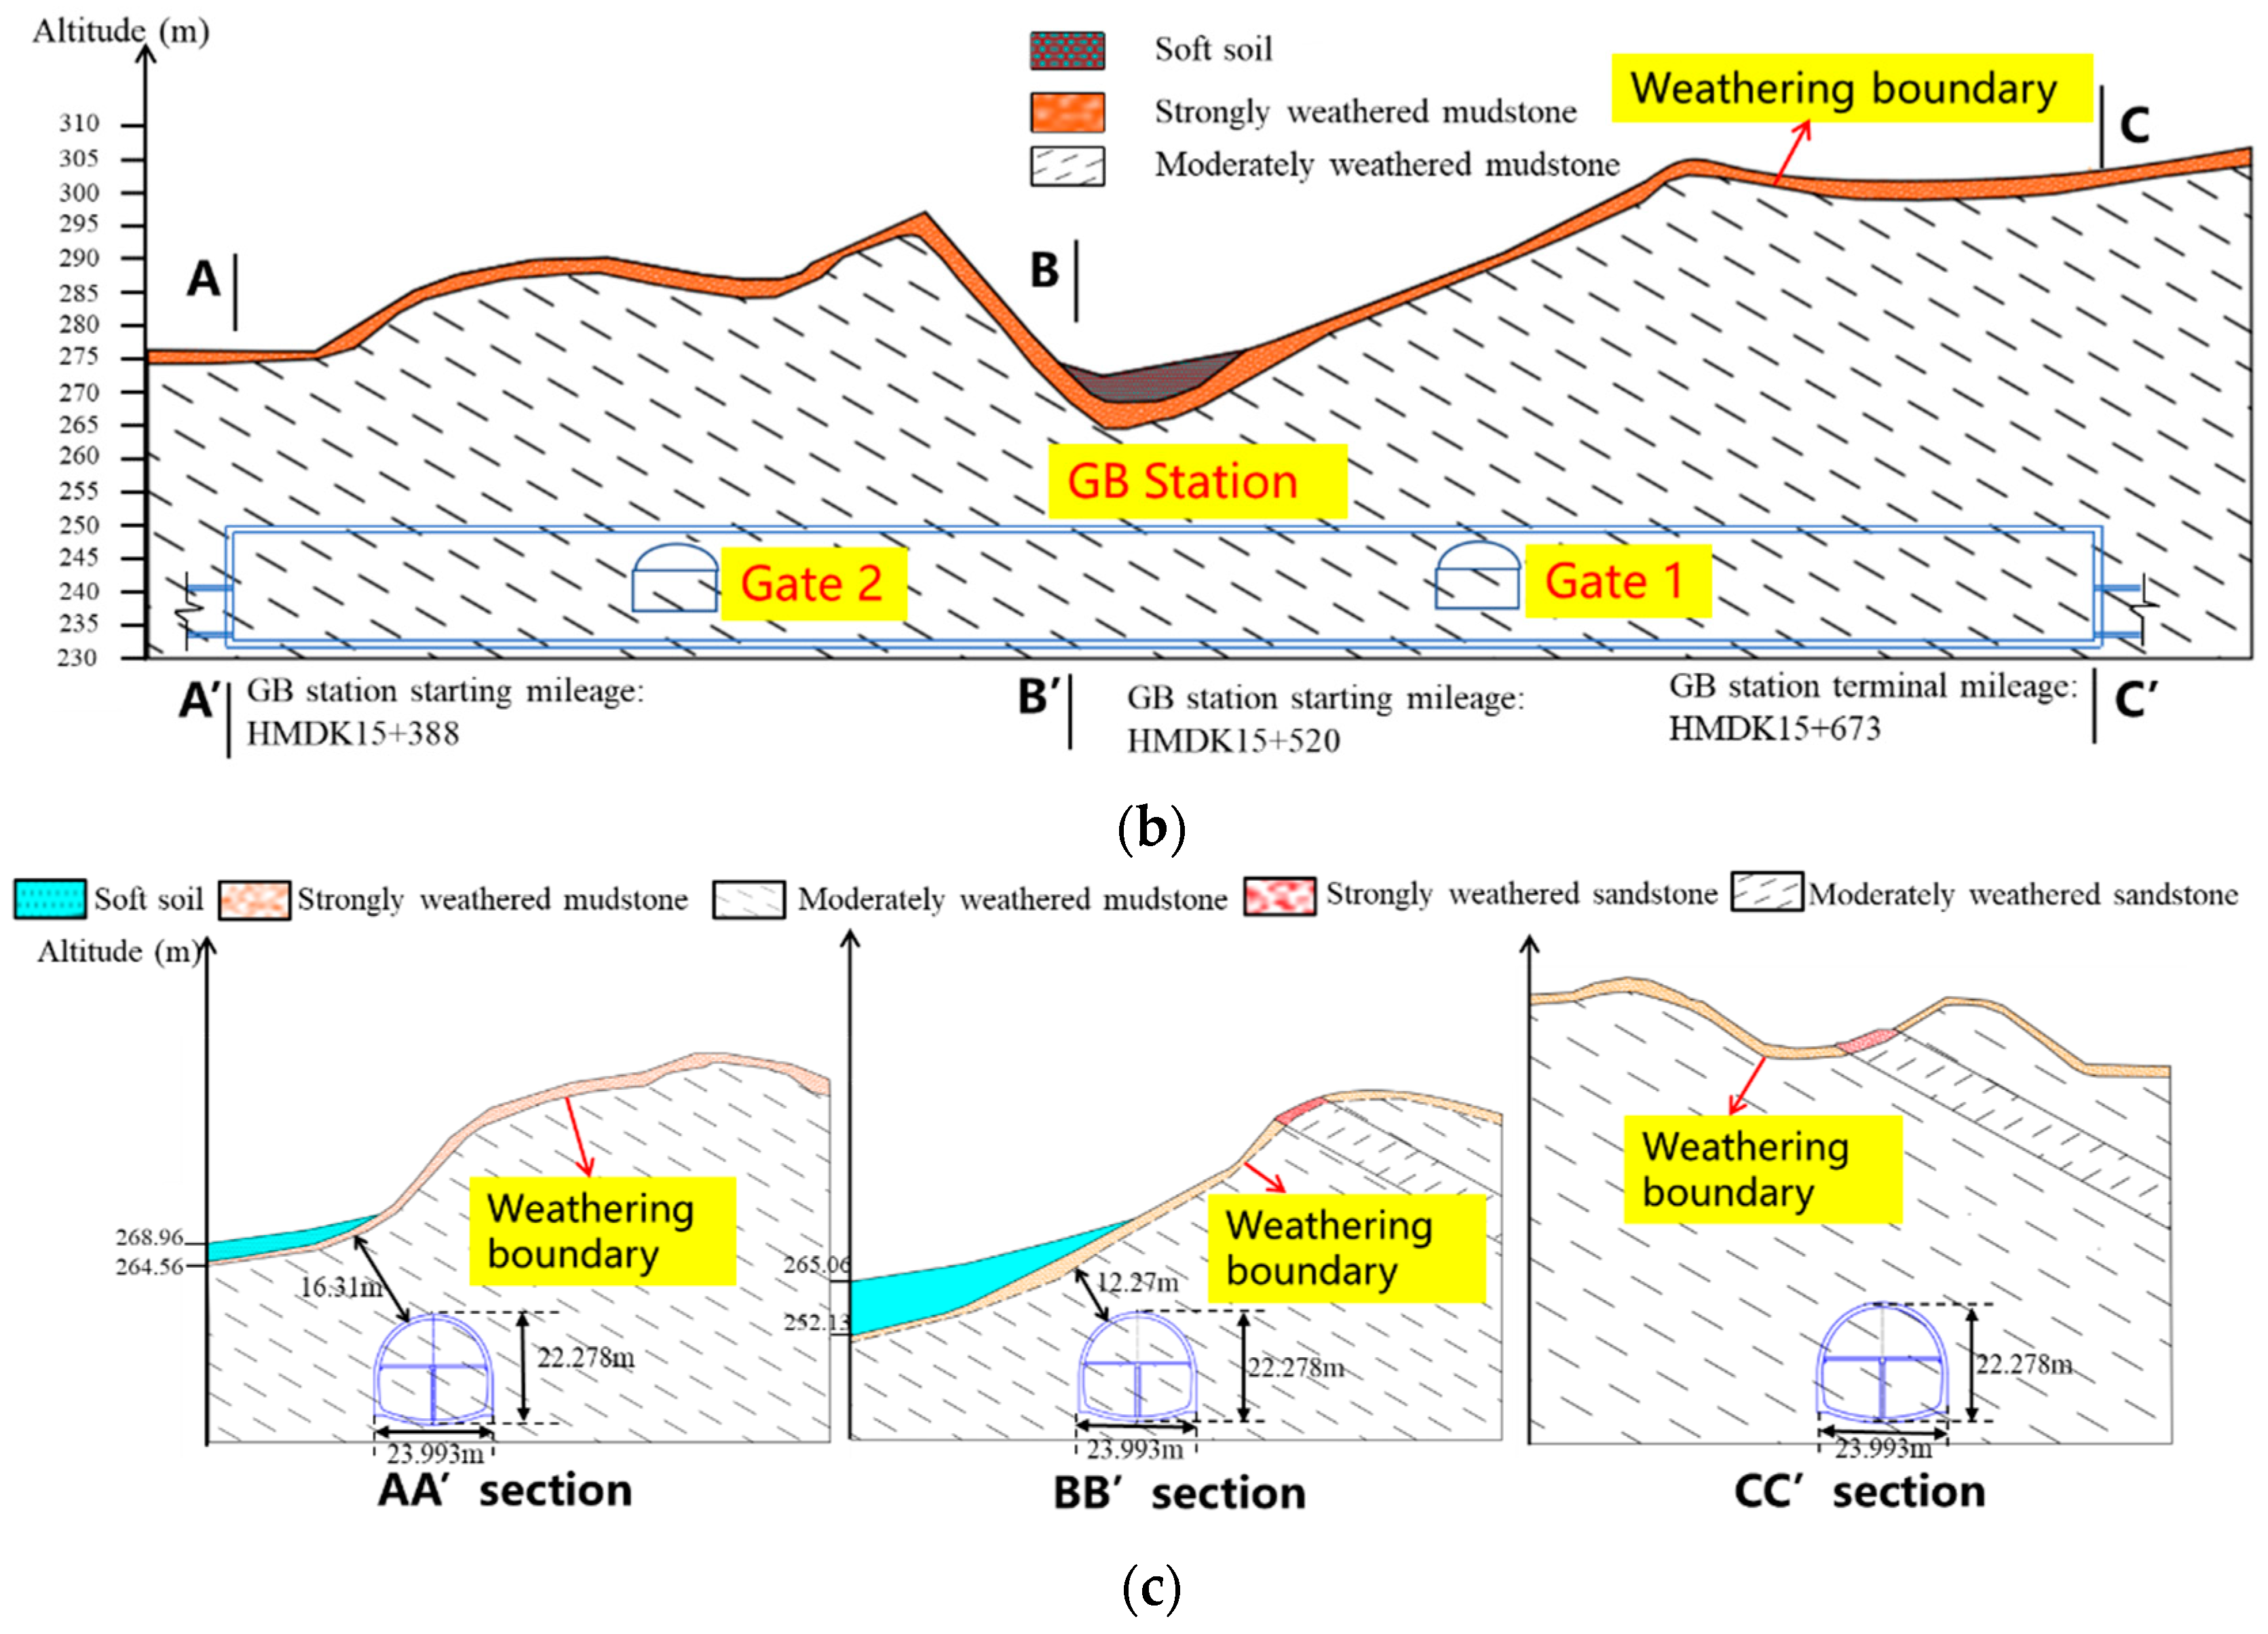
(a) Guobo underground station located in the complex geological environment of the Ridge and Valley Province of Chuandong; (b) longitudinal section and (c) typical X–sections and corresponding stratum of Guobo Station.
The Jinshan tunnel area has a low hill landform, with a ground elevation of 225~380 m and a relative elevation difference of 40~120 m. Meanwhile, the natural slope angle is between 10~30°, with some steep gullies. The Guobo underground station will be built along the Jinshan tunnel by employing the drilling and blasting method, which is a double–layer underground railway station with a total length of 284 m. Figure 1b shows the longitudinal section, typical X–sections and corresponding stratum of Guobo Station. The initial geological survey report indicates that the surrounding rock of the station’s project area belongs to grades IV~V, and the strata are mainly mudstone in the main body section and mudstone intercalated with sandstone in the portal section. From the inlet to the outlet, the dip of the rock stratum gradually turns to the northwest, then to the southwest, and finally to the northwest, and the dip angle of the rock stratum roughly slows down. Meanwhile, two sets of rock mass joints exist in the project area; their occurrences are N85°W/68°NE and N80°W/90°, respectively. From the X–section, it can be seen that the Guobo station belongs to a super large section with an excavation width of 23.993 m and an excavation height of 22.278 m. In the preliminary planning of the station, it is proposed to adopt the initial support mode of a combination of shotcrete and erecting steel arches. In addition, advanced support is also considered in some areas to improve the mechanical properties of the rock mass.
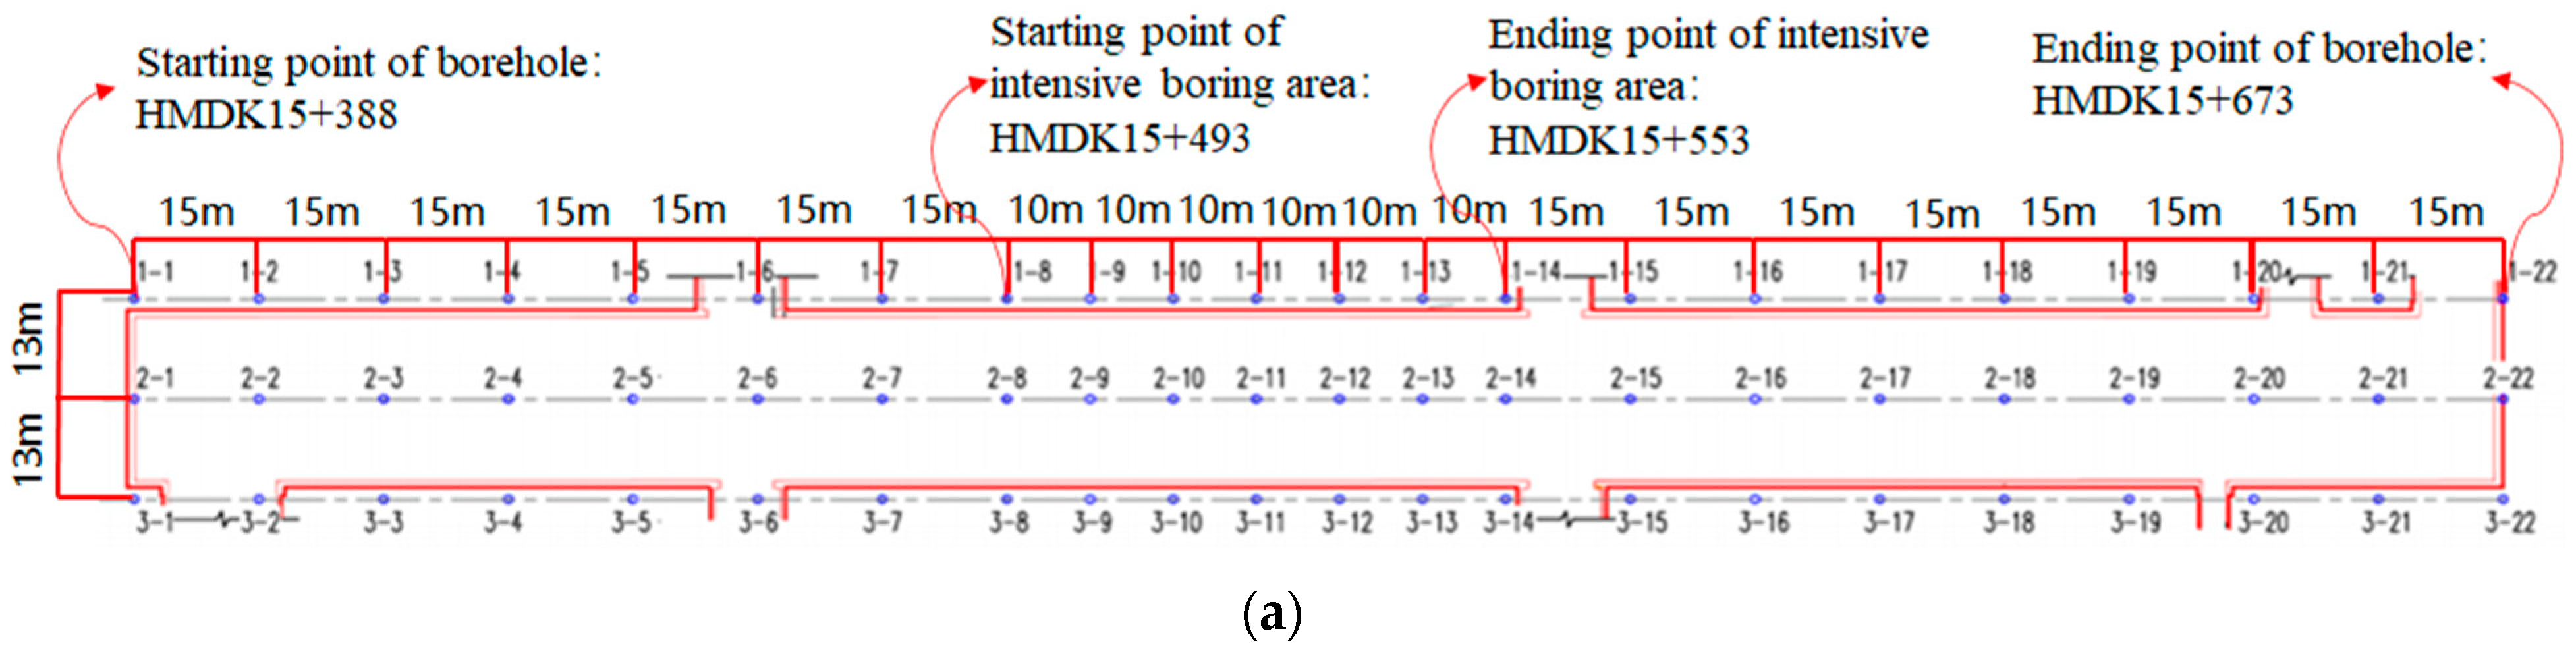
As shown in Figure 2, the boreholes in the project area of the station are divided into the body section and the portal section. The borehole range of the body section is from HMDK15 + 388 to HMDK15 + 673, including an intensive boring area from HMDK15 + 493 to HMDK15 + 553. Three rows of boreholes are arranged longitudinally; one row is arranged in the centerline of the tunnel, two rows are arranged at 13 m on each side of the centerline of the tunnel, and 22 boreholes are bored in each row. A total of 66 boreholes are drilled in less than 300 m, and the borehole density of the body section is extremely high. Meanwhile, there are two boreholes, 4–4 and 4–6, at the tunnel entrance section. The boreholes reveal that the lithology of the rock cores taken from borehole 4–4 is sandstone and that the lithology of the rock cores taken from the other boreholes is mudstone.
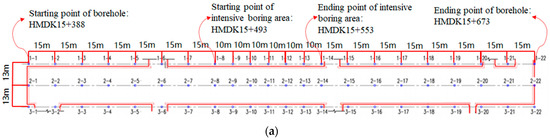
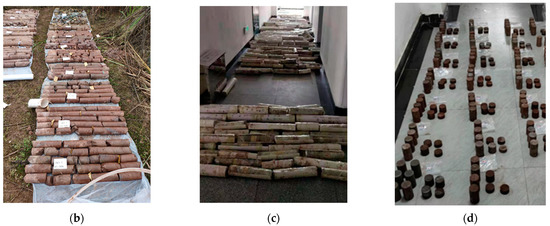
Figure 2.
Rock core drilling and specimen preparation: (a) borehole arrangements along the Guobo underground station; (b) rock cores from in situ boreholes; (c) transport to laboratory; (d) prepared rock specimens from rock cores.
3. Test Methods
In this paper, the comprehensive experimental studies on the mudstone and sandstone taken from boreholes were carried out according to “Methods for determining the physical and mechanical properties of coal and rock (GB/T 23561.10—2010)” [24], including an X–ray diffraction component analysis, uniaxial compression test (UCT), Brazilian splitting test (BST), softening coefficient test, and triaxial compression test (TCT). Meanwhile, the in situ stresses in the project area were also measured by the acoustic emission (AE) method.
3.1. Sample Preparation
The rock cores of each borehole were drilled, cored and ground to obtain standard samples, and the prepared samples from different boreholes are shown in Table 1 and Figure 2d. A semi–quantitative phase analysis using X–ray diffraction shows that the main components of mudstone included 34.3% quartz, 22.2% illite, 21.3% muscovite and 14.5% albite, and that of sandstone included 53.4% quartz, 14.7% albite, 14.7% sylvite and 13.0% anorthite.

Table 1.
Rock samples prepared from different boreholes.
3.2. Test Equipment and Materials
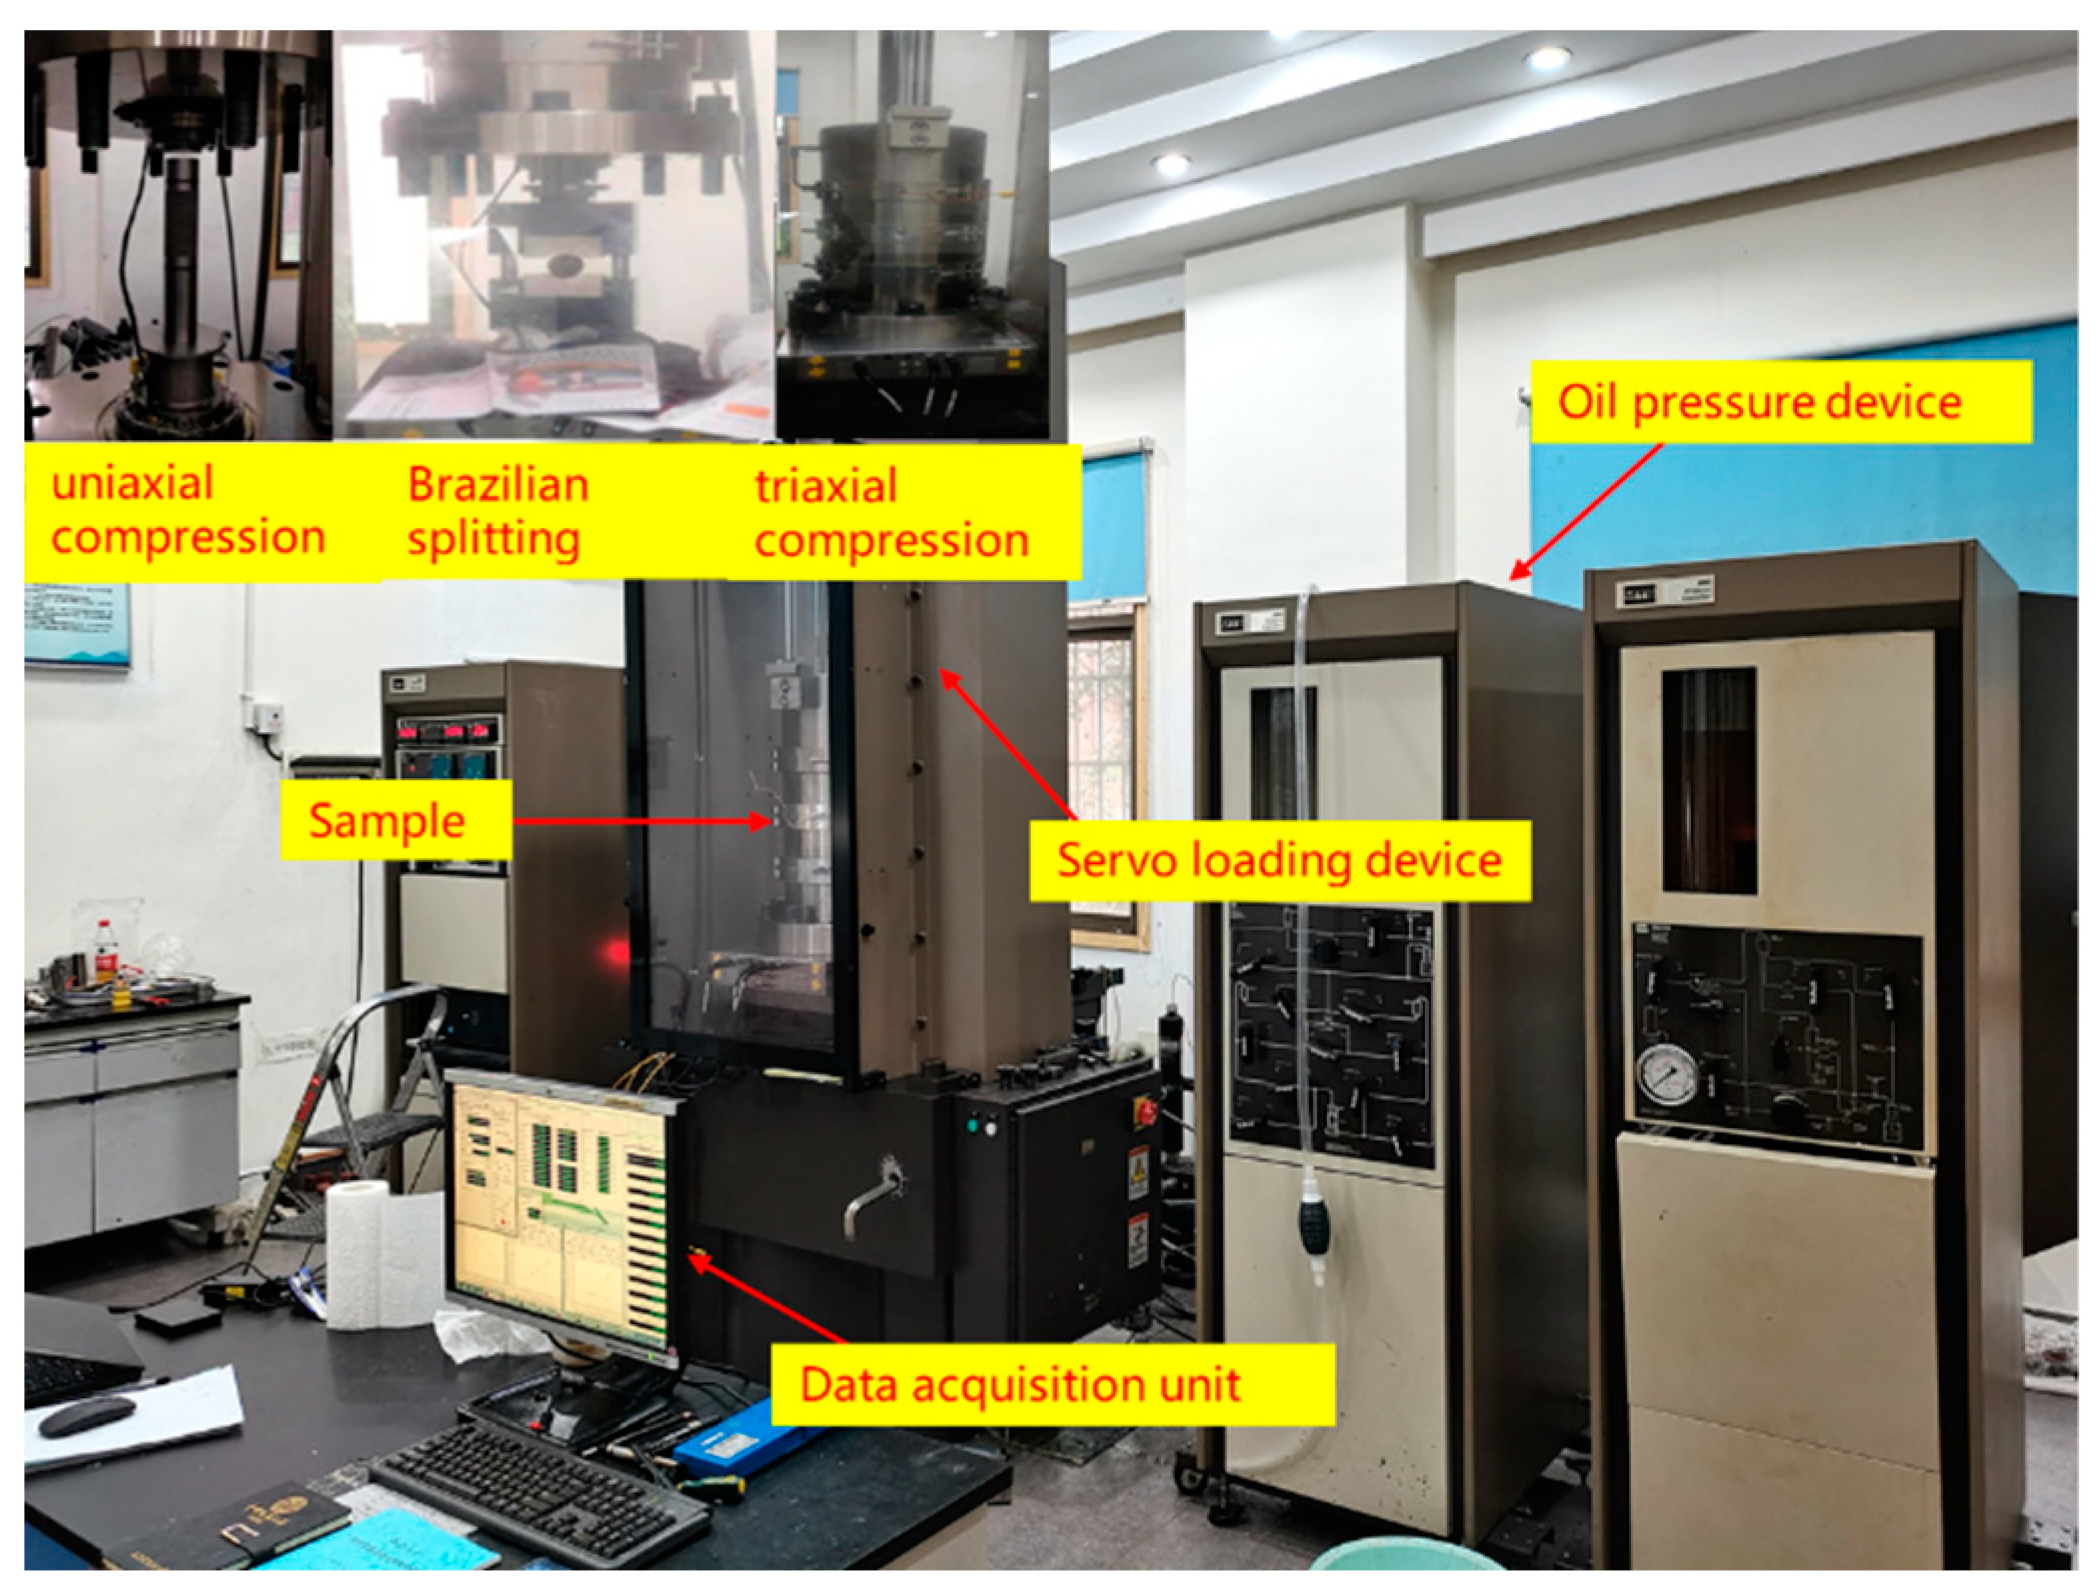
The UCT, BST and TCT were carried out using the MTS 815 triaxial physical property test system (Figure 3) developed by Mets Industrial Systems Co., Ltd. (Adachi, Tokyo) This servo–hydraulic system has high sensitivity and is an accurate and advanced piece of rock mechanics test equipment. The maximum uniaxial load can reach 4600 kN, the maximum triaxial load is 2600 kN, and the confining pressure can be increased to 140 MPa with only a 0.5% error. During the tests, the loading mode was set as the displacement control at a loading rate of 0.12 mm/min.

Figure 3.
MTS 815 triaxial test system.
The softening coefficient test was carried out by using the Instron 1346 electrohydraulic servo test machine (Figure 4). The samples were divided into a dried group and a saturated group before testing. The samples of the dried group were prepared by placing the samples into a 105 °C constant temperature oven for 24 h, and the method used for the saturation specimens was to soak the dried samples in water for 24 h (Figure 5). During the experiments, the loading mode was first set as the force control, at a loading rate of 30 kN/min for mudstone and 60 kN/min for sandstone, and then to the displacement control at a loading rate of 0.12 mm/min.
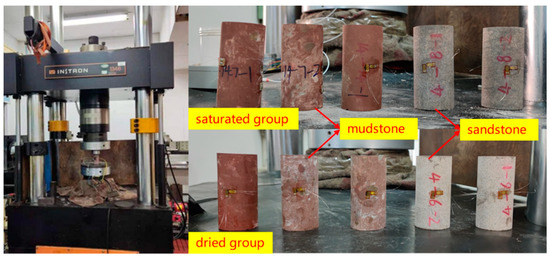
Figure 4.
Instron 1346 servo controlling test system and rock samples of saturated and dried groups.

Figure 5.
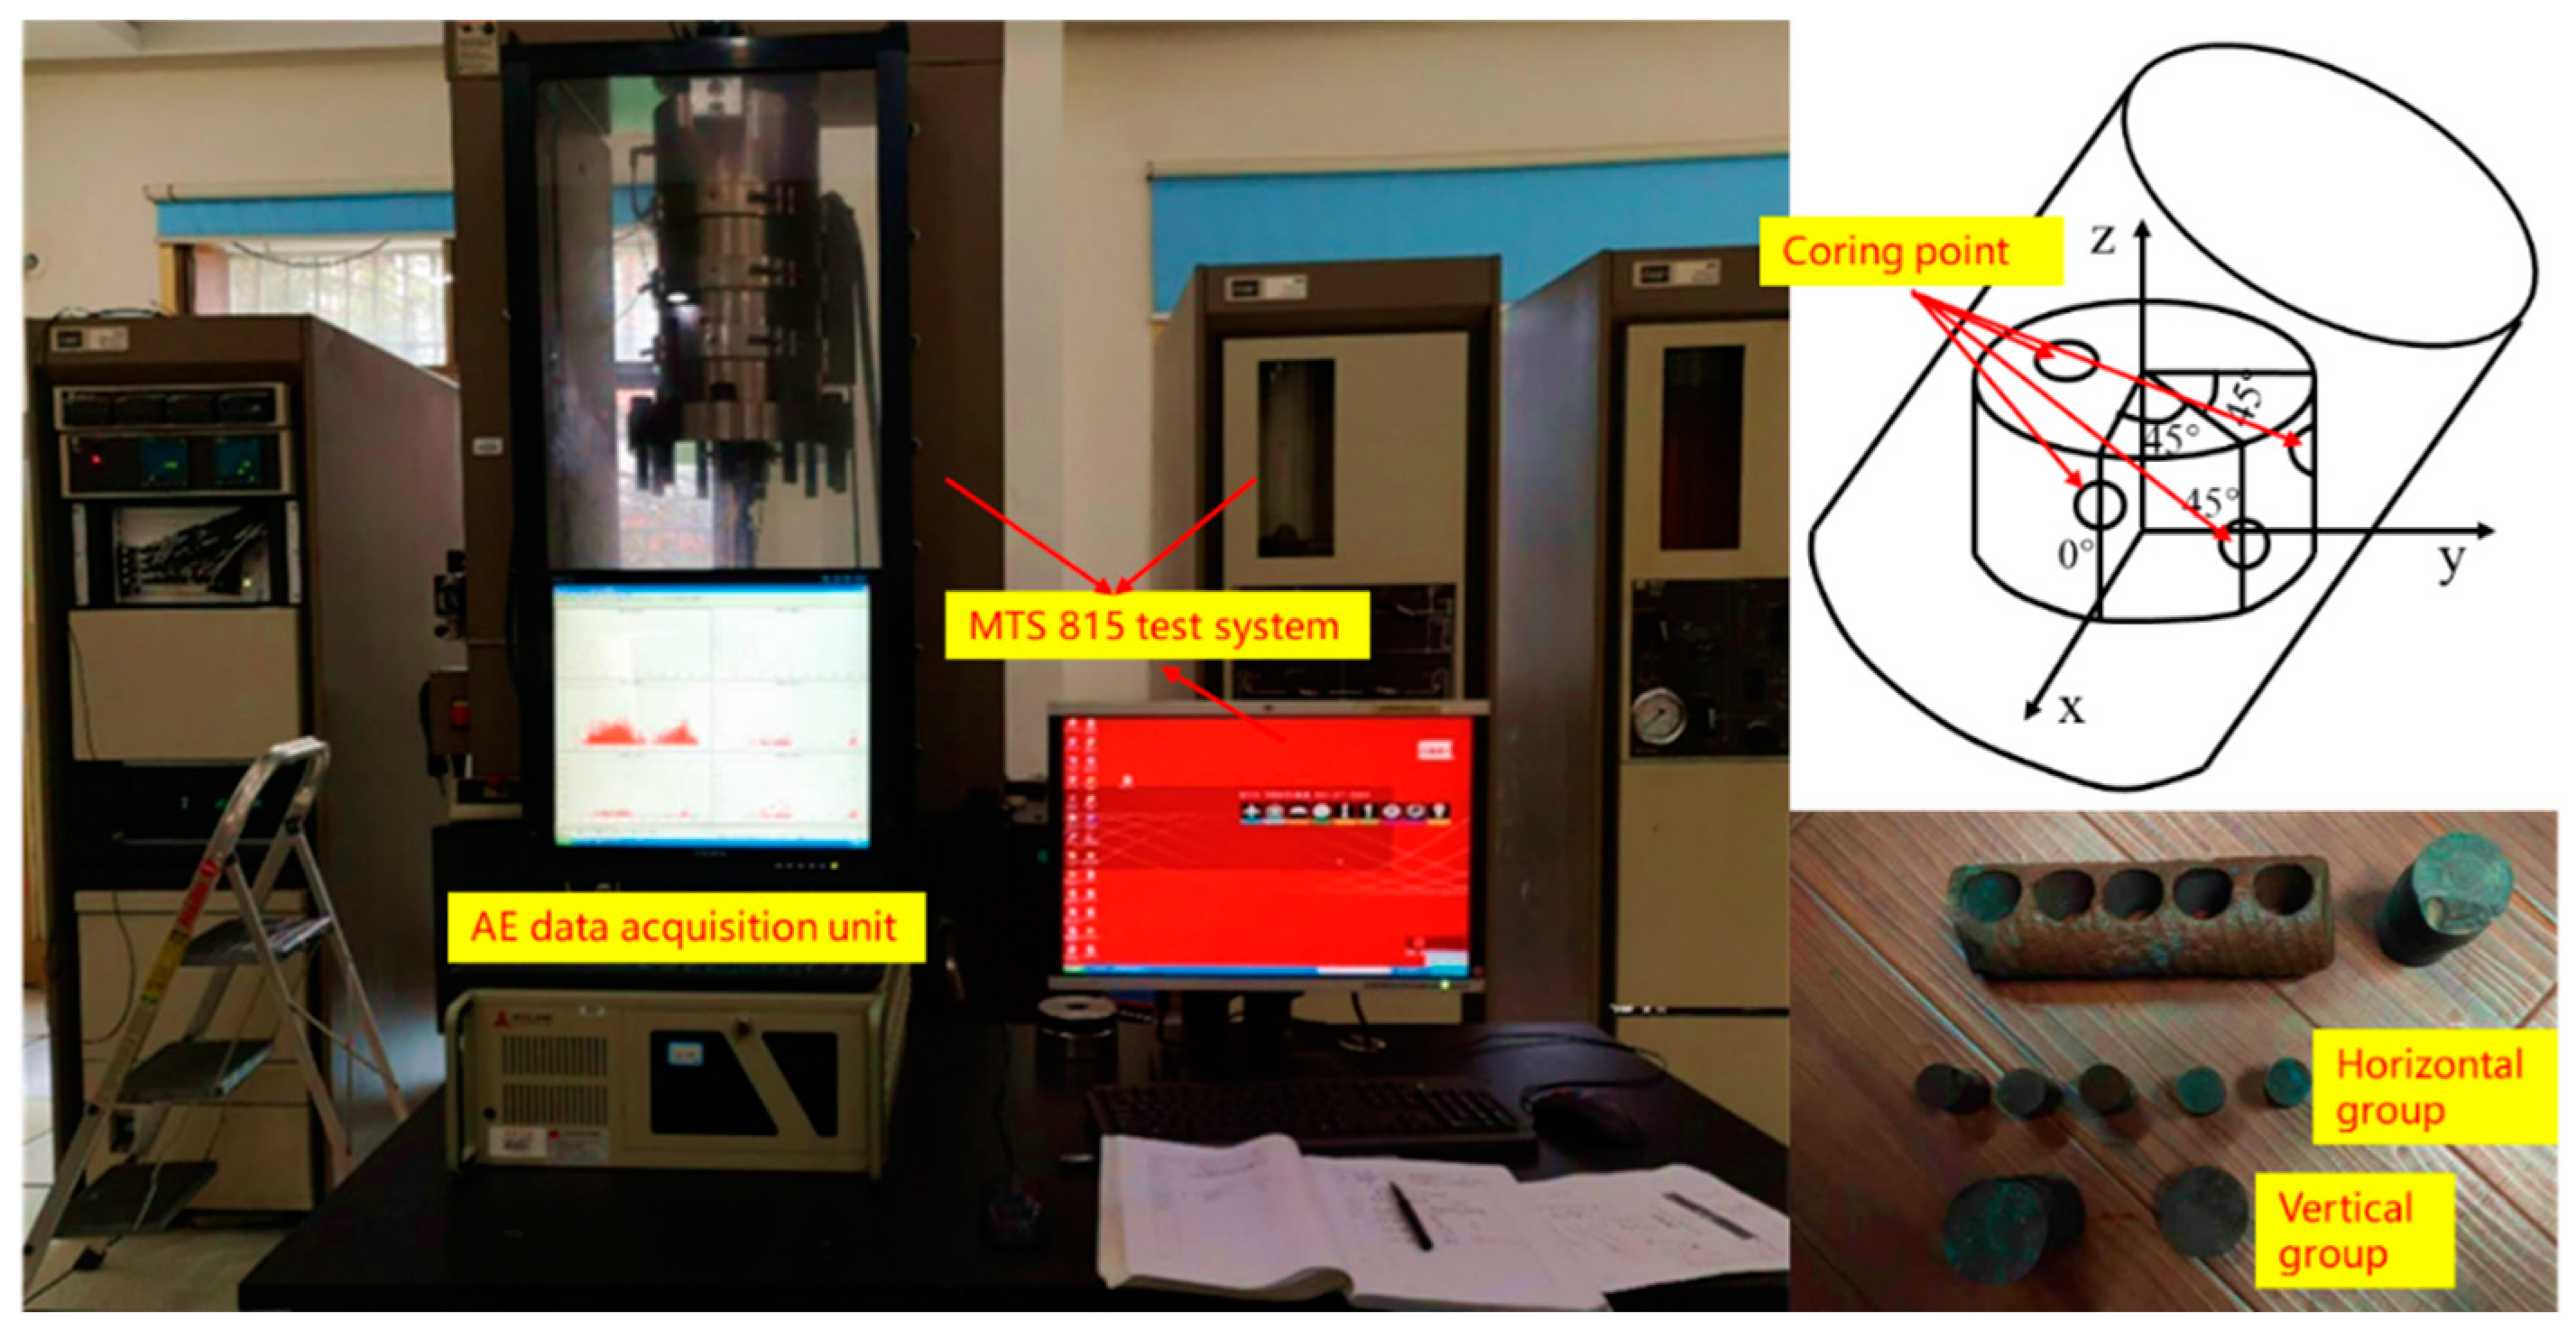
AE test system and in situ stress measurement samples.
The in situ stress measurement tests were carried out by the MTS 815 system and PCI–II multichannel acoustic emission instrument (Figure 5). The core specimens for the in situ stress measurement of the project area were obtained with a cover depth of approximately 60 m. For the selected cores, a new incorporating non–oriented core ground reorientation method was used to locate the surface accurately [25], and then the “four–direction method” was adopted to obtain samples (Figure 5). The four–direction method involves drilling three samples in the vertical direction to determine the vertical in situ stress by obtaining the Kasai points of the samples. Four samples are drilled at 45° intervals in the horizontal direction at three angles to determine the direction of the horizontal maximum principal stress, the horizontal minimum principal stress, and the horizontal principal stress by obtaining the Kasai points of the samples.
4. Test Results and Analysis
4.1. UCT and BST
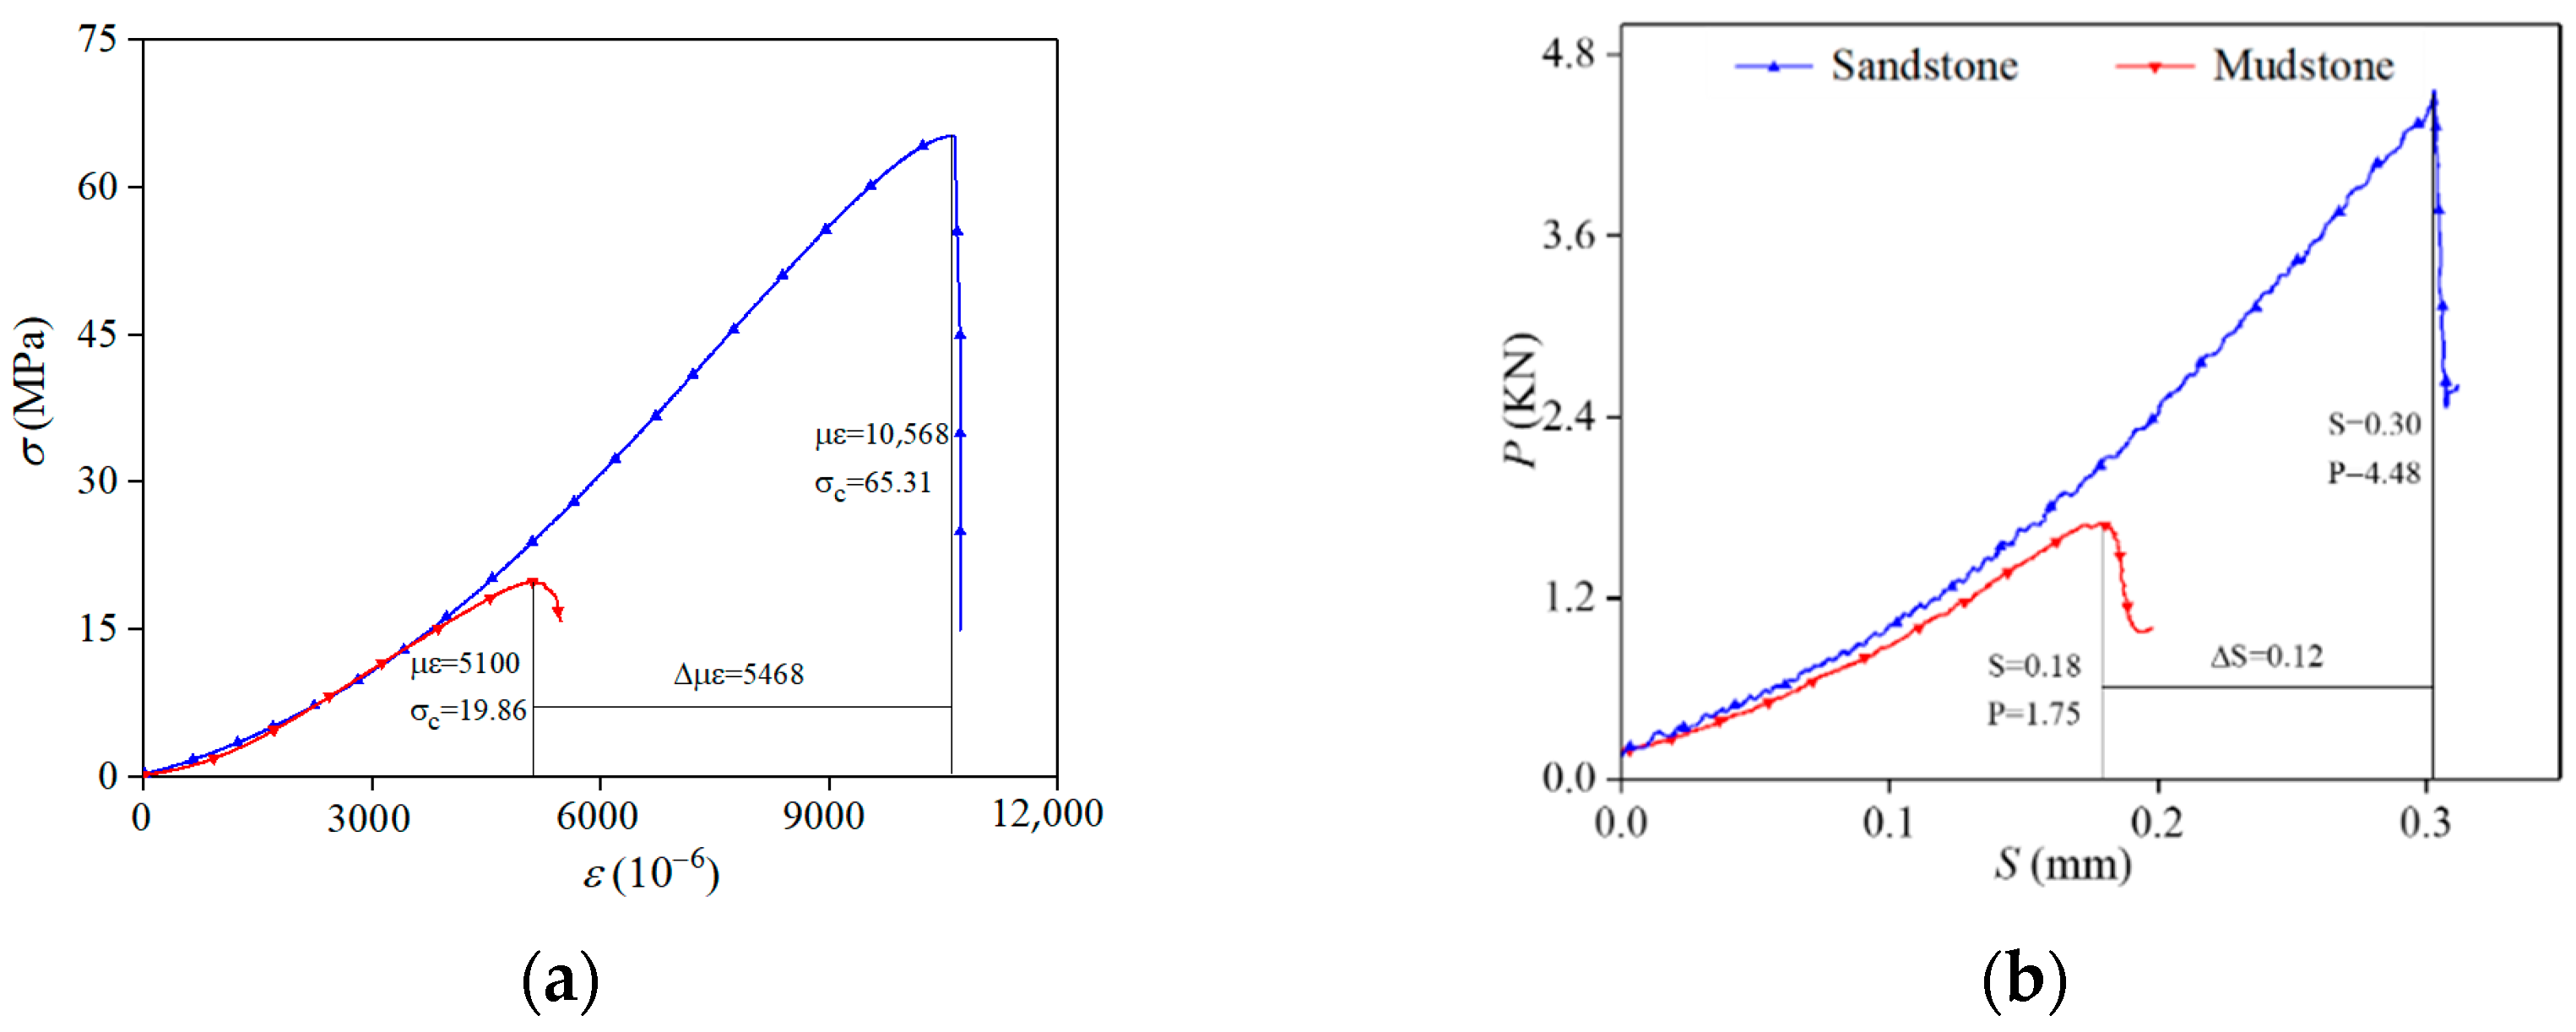
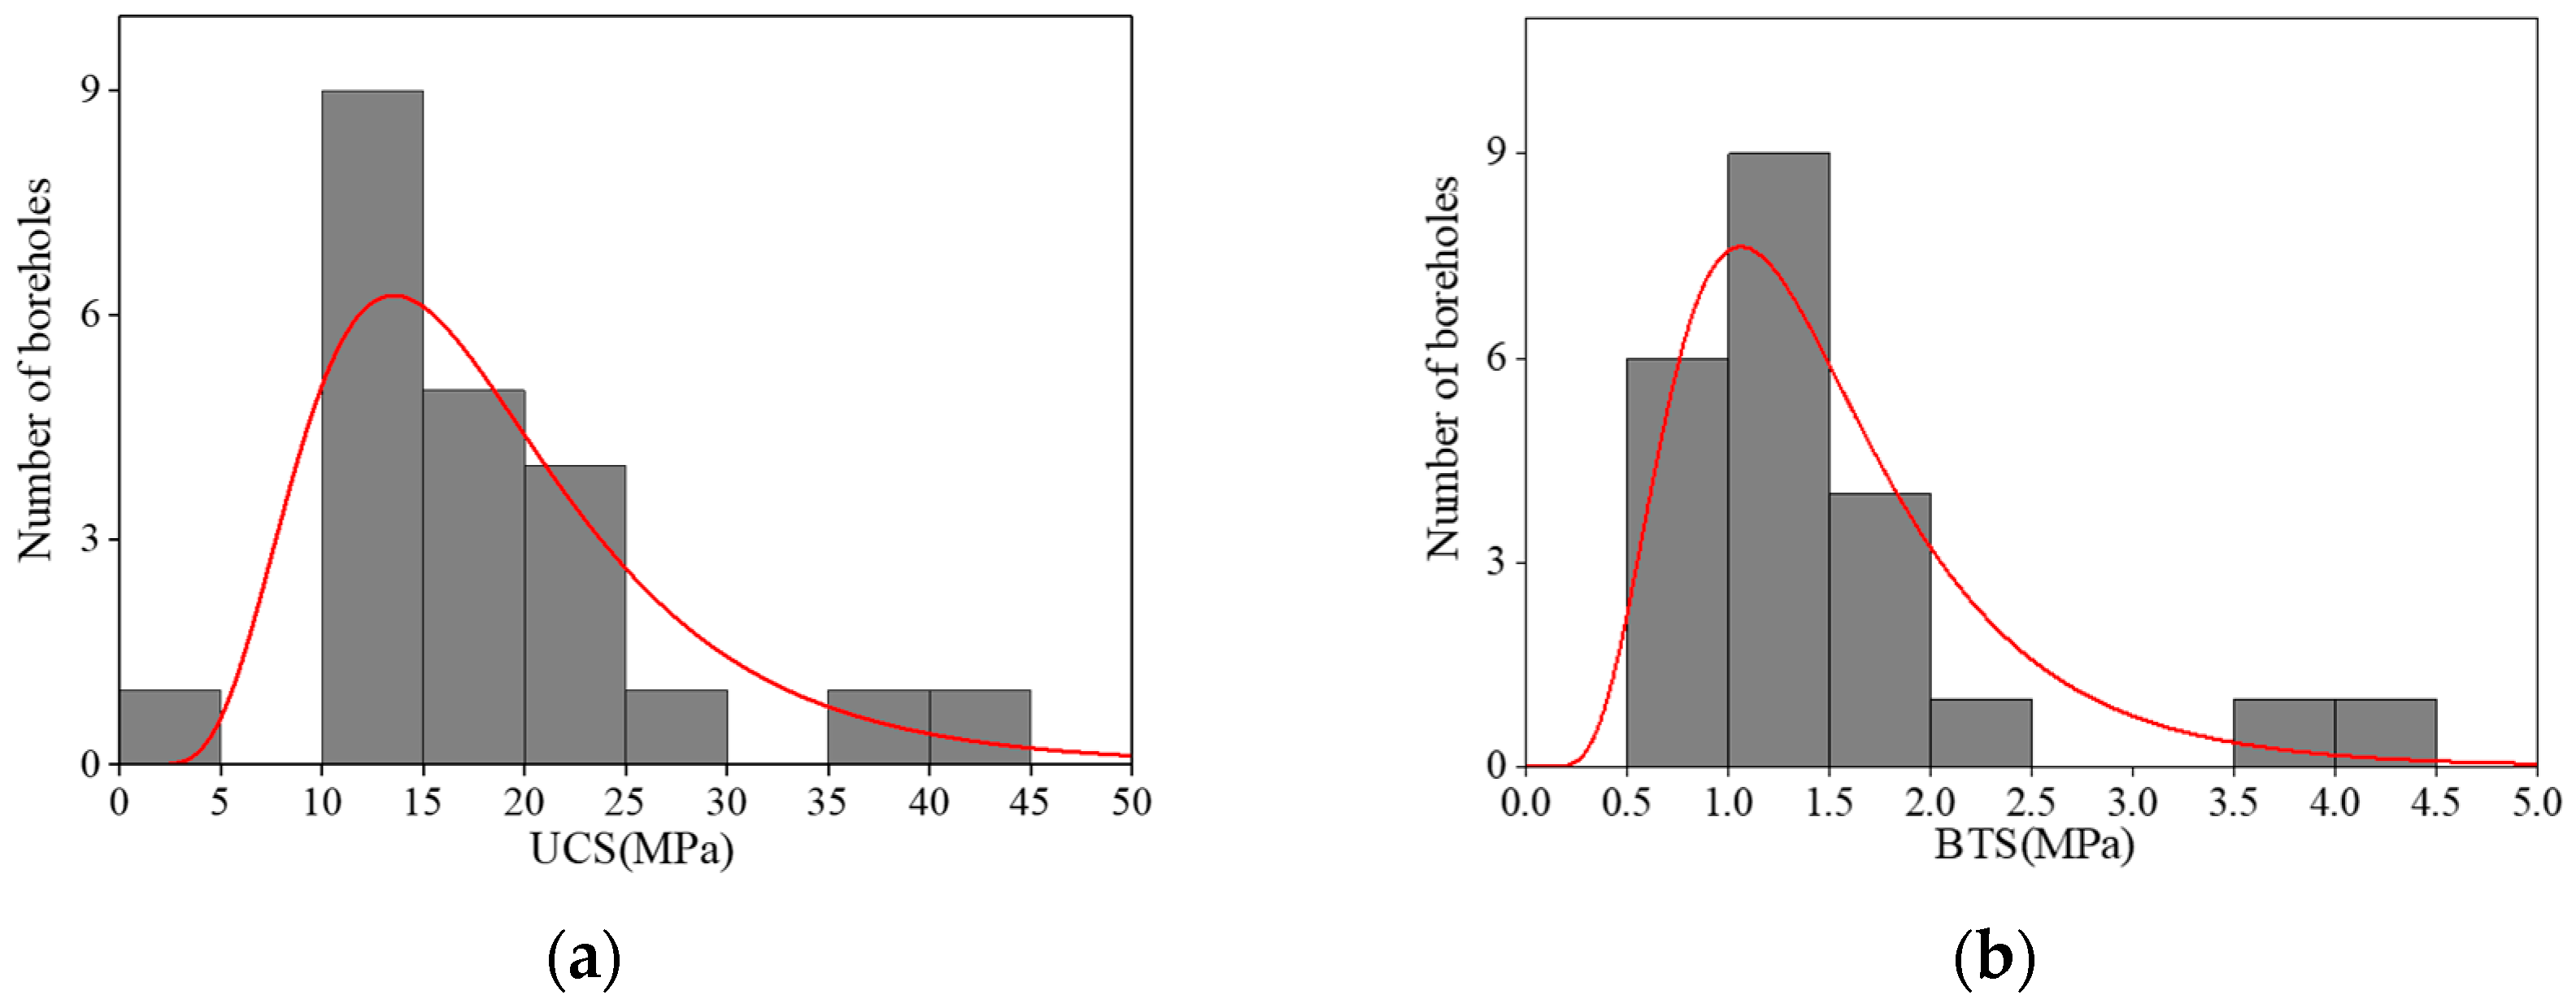
Figure 6 shows the complete stress–strain curves and the load–displacement curves of the mudstone and sandstone specimens in the natural state under the UCT and BST. The main mechanical properties of the samples are obtained, which are listed in Table 2. It can be seen that the stress–strain curves all have five stages: crack closure stage, elastic deformation stage, crack initiation and stable crack growth stage, unstable crack growth to failure stage and post–peak stage. Meanwhile, the ultimate deformation of sandstone is much greater than that of mudstone. Although the mudstone all drills from the project area, the strength of the samples varies greatly from the different boreholes. The uniaxial compressive strength (UCS) of mudstone ranges between 4.43~42.43 MPa, with an average UCS of 18.60 MPa, and the Brazilian tensile strength (BTS) ranges between 0.66~4.30 MPa, with an average value of 1.51 MPa. This indicates that the mechanical properties of the rock mass in the project area are highly scattered. After a statistical analysis of the results, as shown in Figure 7, it can be found that the distribution of the UCS and BTS of mudstone basically conforms to a lognormal distribution, and the ratio of the UCS to BTS is approximately 10. Meanwhile, the average UCS of sandstone is 65.31 MPa, and the BTS is 3.06 MPa. The former is approximately 21.34 times greater than the latter one.

Figure 6.
Typical stress–strain curves (a) and the load–displacement curves (b) of the mudstone and sandstone specimens under UCT and the BST.
Table 2.
Mechanical properties of rock specimens tested in a natural state.

Figure 7.
Distribution of UCS (a) and BTS (b) of mudstone specimens from the project area.
4.2. TCT
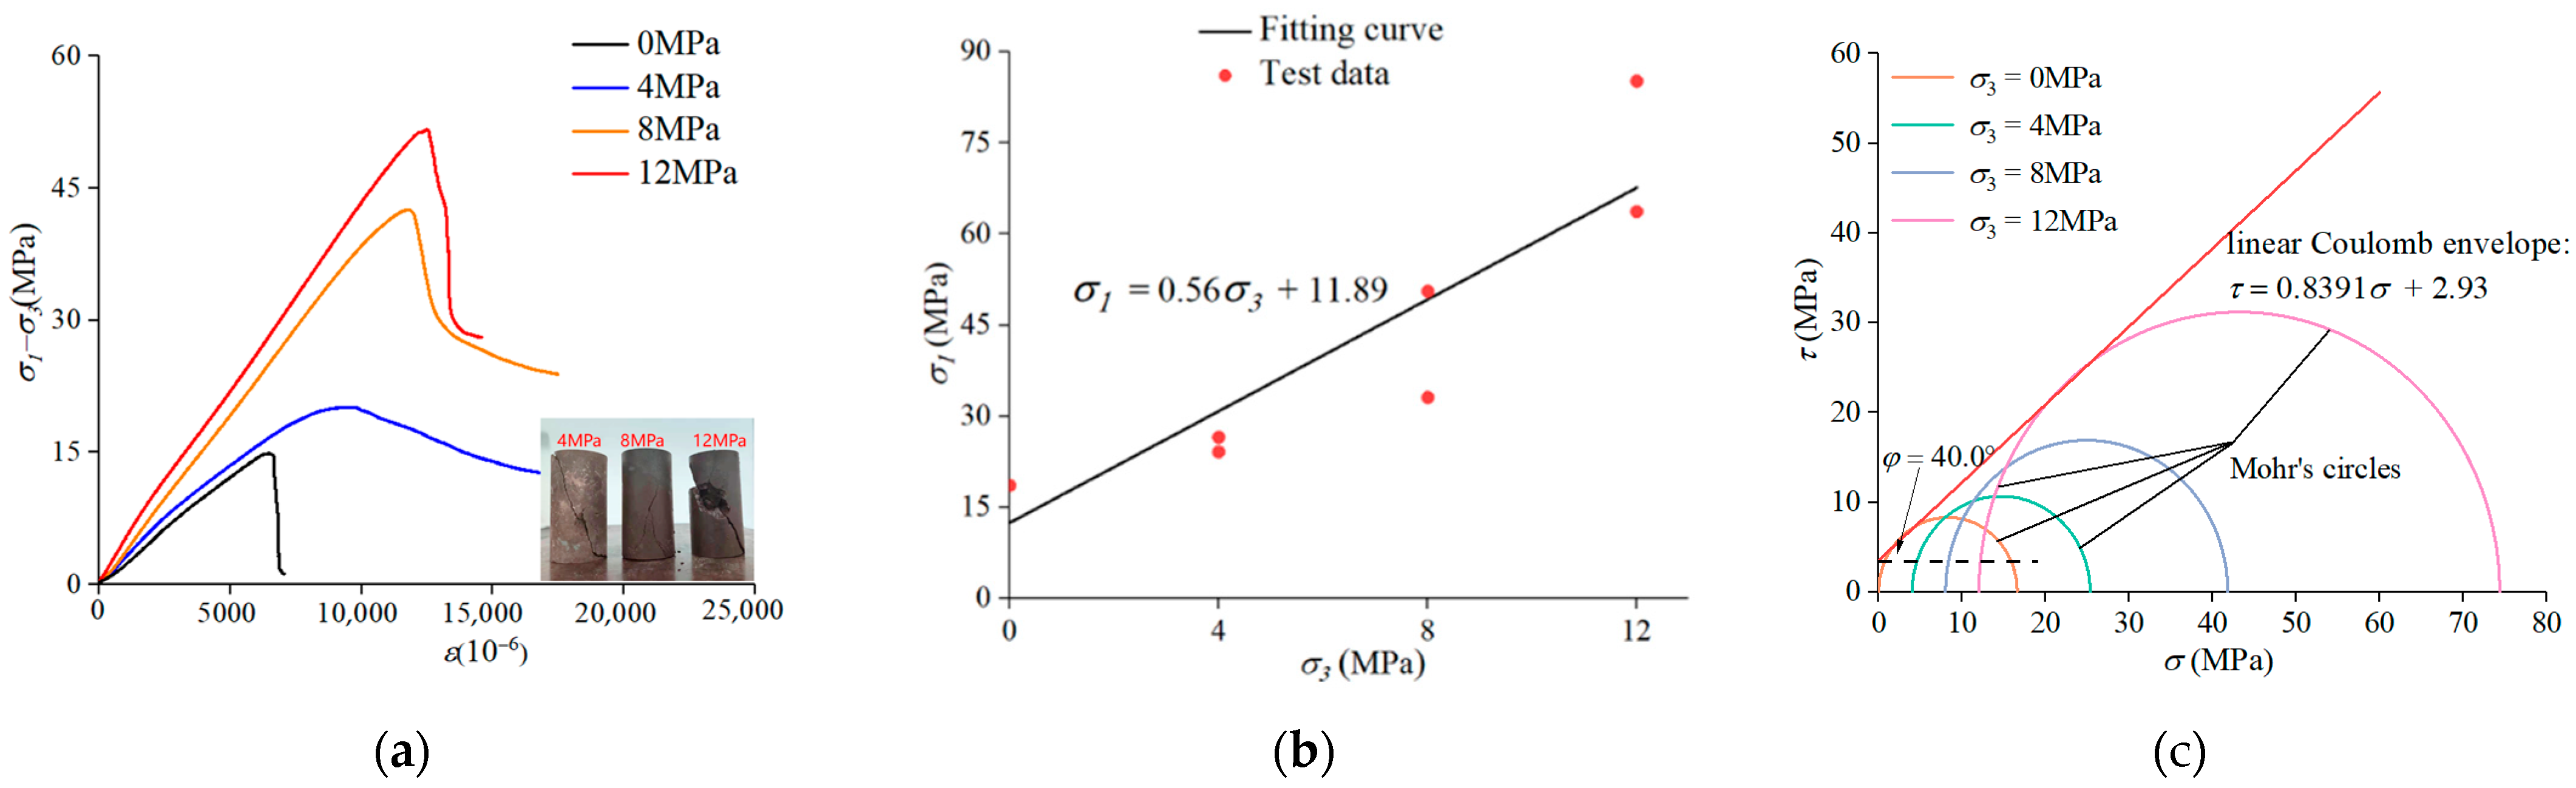
The TCT was only conducted for mudstone, which is widely distributed in the project area. To avoid the discreteness of the triaxial compressive strength, since the samples are taken from different boreholes, the TCT was conducted on samples whose strength was near the mean value of the UCS. The confining pressure is determined as four gradients of 0 MPa, 4 MPa, 8 MPa and 12 MPa according to the measured in situ stress results and uniaxial compressive strength. The triaxial compressive strength of mudstone conforms to the general law of previous studies on soft rock; that is, with increasing confining pressure, the triaxial compressive strength of the sample also increases. From the stress–strain curve (Figure 8a), it can be seen that the elastic modulus and residual strength of the samples also increase with increasing confining pressure. Figure 8b shows the Mohr–Coulomb strength curve of the mudstone. Figure 8c shows the Mohr’s circles obtained according to the mean value of the triaxial test. Through the linear Coulomb envelope, it can be calculated that the cohesion is 2.90 MPa, and the internal friction angle is 40.0°.
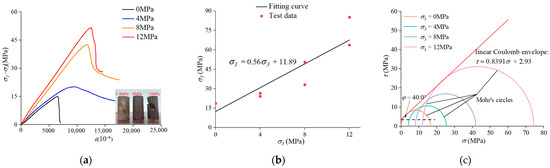
Figure 8.
Typical stress–strain curves and failure mode (a) of mudstone specimens under triaxial compression tests; (b) Mohr–Coulomb strength curve; (c) Mohr’s circles with a linear Coulomb envelope.
However, in rock masses, due to the existence of joints, fissures and weathering conditions in complex environments, the rock parameters obtained from laboratory tests cannot be directly adopted by the project. It is necessary to provide the mechanical parameters of rock mass in the project area based on the test parameters of intact rock in the laboratory by a reasonable model. The Hoek–Brown criterion is widely used in this process [26,27,28], and the expression is:
where and are the maximum and minimum principal stresses of the rock, and are the uniaxial compressive strength of the intact rock and rock mass, respectively, and are the Young’s modulus of the intact rock and rock mass, respectively, and are the Hoek–Brown constants of the rock mass and intact rock, respectively, and GSI is the geological strength index.
, , and can be obtained from the TCT. The initial survey results in the project area show that there is a strongly weathered layer in the surrounding rock of the project area, and the integrity coefficient KV is 0.66–0.72. The integrity of the rock mass is relatively good, but with severe weathering conditions. According to the quantified GSI rock mass classification system [29], the GSI value of the rock masses in the project area ranges between 40 and 50. Table 3 shows the mechanical parameters of the rock mass in the project area. With the increase in the GSI value, the UCS of the rock mass increases, but all of them are less than 1 MPa. The engineering mechanical properties of rock masses are very poor.
Table 3.
Mechanical parameters of rock mass.
4.3. Softening Coefficient Test
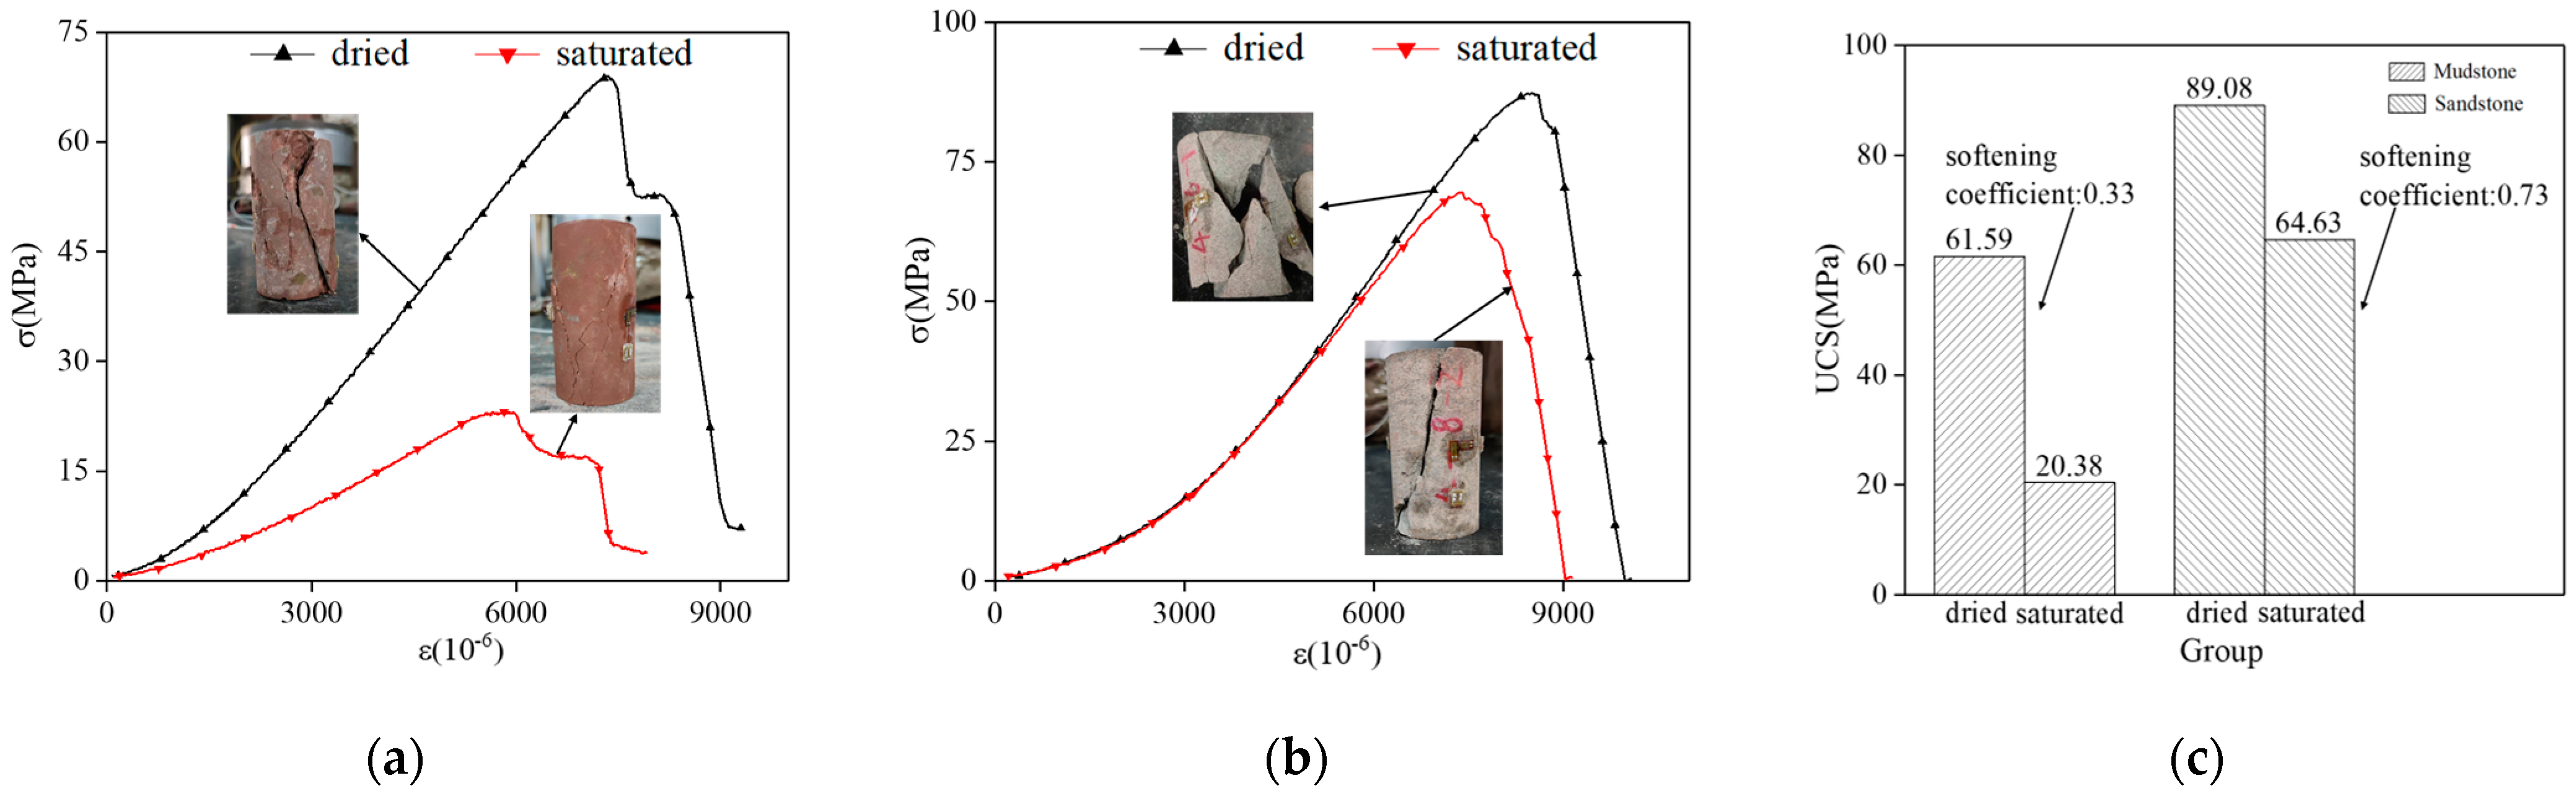
Table 4 shows the main softening characteristics of the mudstone and sandstone, which are obtained by the UCT of the dried and saturated samples. The softening coefficient of mudstone is as low as 0.33, which indicates that the moisture content has a significant effect on the strength of mudstone. The softening coefficient of sandstone is 0.73, which reveals that the moisture content also has a great effect on the strength of sandstone. In addition, the stress–strain curve also shows that the Young’s modulus of the saturated group is significantly lower than that of the dried group for mudstone, while this characteristic is not obvious for sandstone.
Table 4.
The softening coefficients of mudstone and sandstone samples.
Figure 9 shows the typical complete stress–strain curves and failure photos of the mudstone and sandstone samples. For mudstone, the curve of the dried group rises faster in the pre–peak area, and the ultimate strength is greater, but the brittleness is higher than that of the saturated group. The failure modes are all shear failures. For sandstone, the rising rate of the curve in the pre–peak area of the dried group and saturated group is close, and the brittleness is higher than that of mudstone. The ultimate strength of the dried group is higher than that of the saturated group. The failure mode of the dried group is a shear failure with a crisp sound and rock block collapse. However, the failure mode of the saturated group shows shear and splitting failures. It should be noted that, in the softening coefficient test, the strength of the mudstone samples in the saturated state is higher than the average value in the natural state shown in Section 4.1. On the one hand, the samples are taken from 1–14 boreholes, and the UCS in the natural state is higher than the average value. On the other hand, it also shows that the water content in the surrounding rock of the project area with shallow cover depth is close to the saturated state due to coring in the rainy season.
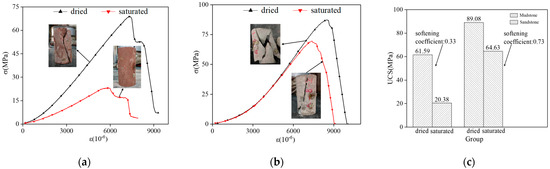
Figure 9.
Typical stress–strain curves and failure photos of mudstone (a) and sandstone specimens (b) under dry and saturated conditions; (c) softening coefficients.
In general, the strength of the surrounding rock of Guobo station is highly sensitive to water. In the construction and operation management of tunnels, the prevention and control of the risk caused by precipitation and groundwater should be carefully considered.
4.4. In Situ Stress Test
To obtain the in situ stress in the project area, the Kaiser points of the samples were obtained by the AE method. The Kaiser point of the samples in the vertical group is its vertical principal stress. The horizontal principal stress and the maximum principal stress direction are calculated from the three Kaiser points in the horizontal group by the principle of elasticity:
where , and are the Kaiser points in the directions of 0°, 45° and 90° of the horizontal group, and are the maximum and minimum principal stresses of the horizontal direction, and θ is the direction of the horizontal maximum principal stress.
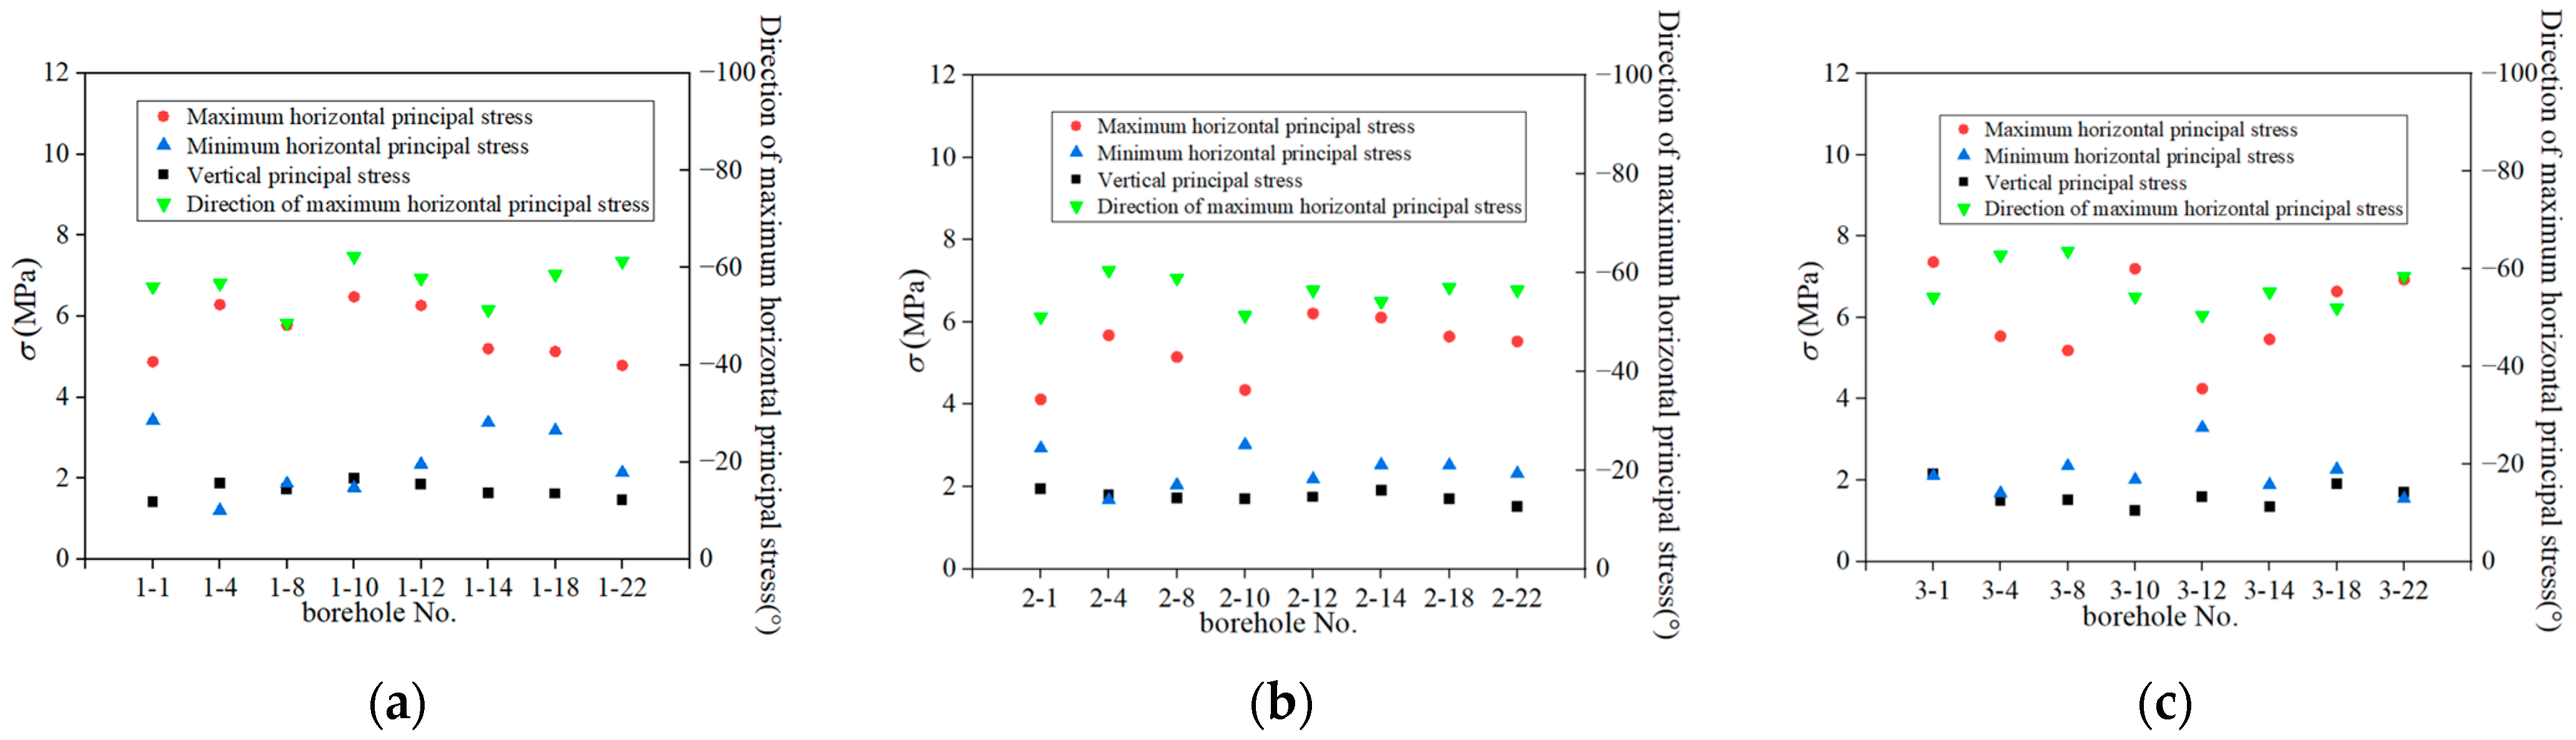
Figure 10 and Table 5 show the in situ stress distribution at each measuring point. Vertical stress is basically equivalent to gravitational stress. The relationship between the three principal stresses is as follows: the maximum horizontal principal stress () > minimum horizontal principal stress () > vertical principal stress (). The directions of the maximum horizontal principal stress are consistent; in the WNW direction, the azimuth is distributed in N 45° W~N 65° W, and ranges from 4.25 to 7.36 MPa. The ratio of the maximum horizontal principal stress to the vertical principal stress (lateral pressure coefficient) is from 2.11 to 5.71, with an average value of 3.39, which varies greatly in the project area. On the one hand, this is caused by the larger or smaller lateral pressure coefficient measured at a few boreholes. The lateral pressure coefficient measured at most boreholes is between 3.17 and 3.72. On the other hand, the lateral pressure coefficient may be related to the distribution of the major joints and local groundwater in the project area. The existence of the joints affects the stress transmission of the rock mass, and seepage of the rock mass also has a certain impact on in situ stress [30], which may lead to a local stress concentration. When the lateral pressure coefficient is large, a tensile stress concentration may occur on the side walls of the roadway (circular section > 3, square section > 1.2) after excavation, and the value and range of tensile stress will increase with the increase of the lateral pressure coefficient [30,31,32]. Since the tensile strength of the rock mass in the project area is extremely low, the stress on the side walls of the station shall be mainly considered to avoid large tensile stress concentration zones on the side walls after the excavation of the rock masses in the station. In addition, the absolute value of the in situ stress is not very high; however, compared with the mudstone with a low strength, which is widely distributed in the project area, the in situ stresses are relatively high. Therefore, it is an unfavorable factor to be considered during excavation.
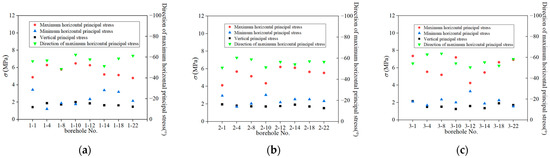
Figure 10.
In situ stress measurement results and the maximum horizontal principal stress direction: (a) the first row, (b) the second row, and (c) the third row at the Guobo station.
Table 5.
In situ stress measurement results of the project area.
5. Discussion
The lab test and initial geological survey show that the station project area is located in Yubei District, Chongqing, which is rich in seasonal precipitation. The terrain fluctuates greatly, and the surrounding rock is mainly mudstone with strong softening properties when encountering water. Meanwhile, the relative value of the in situ stress is high. Therefore, the possible risks in the station excavation and subsequent operation mainly include the following: (1) large bias pressures and asymmetric deformation of the surrounding rock; (2) high in situ stresses, which may lead to large deformation during excavation; (3) long–term water–rock interactions, which can result from the surrounding rock in deteriorating continuously, and engineering defects may occur in the service life.
5.1. Bias Pressures
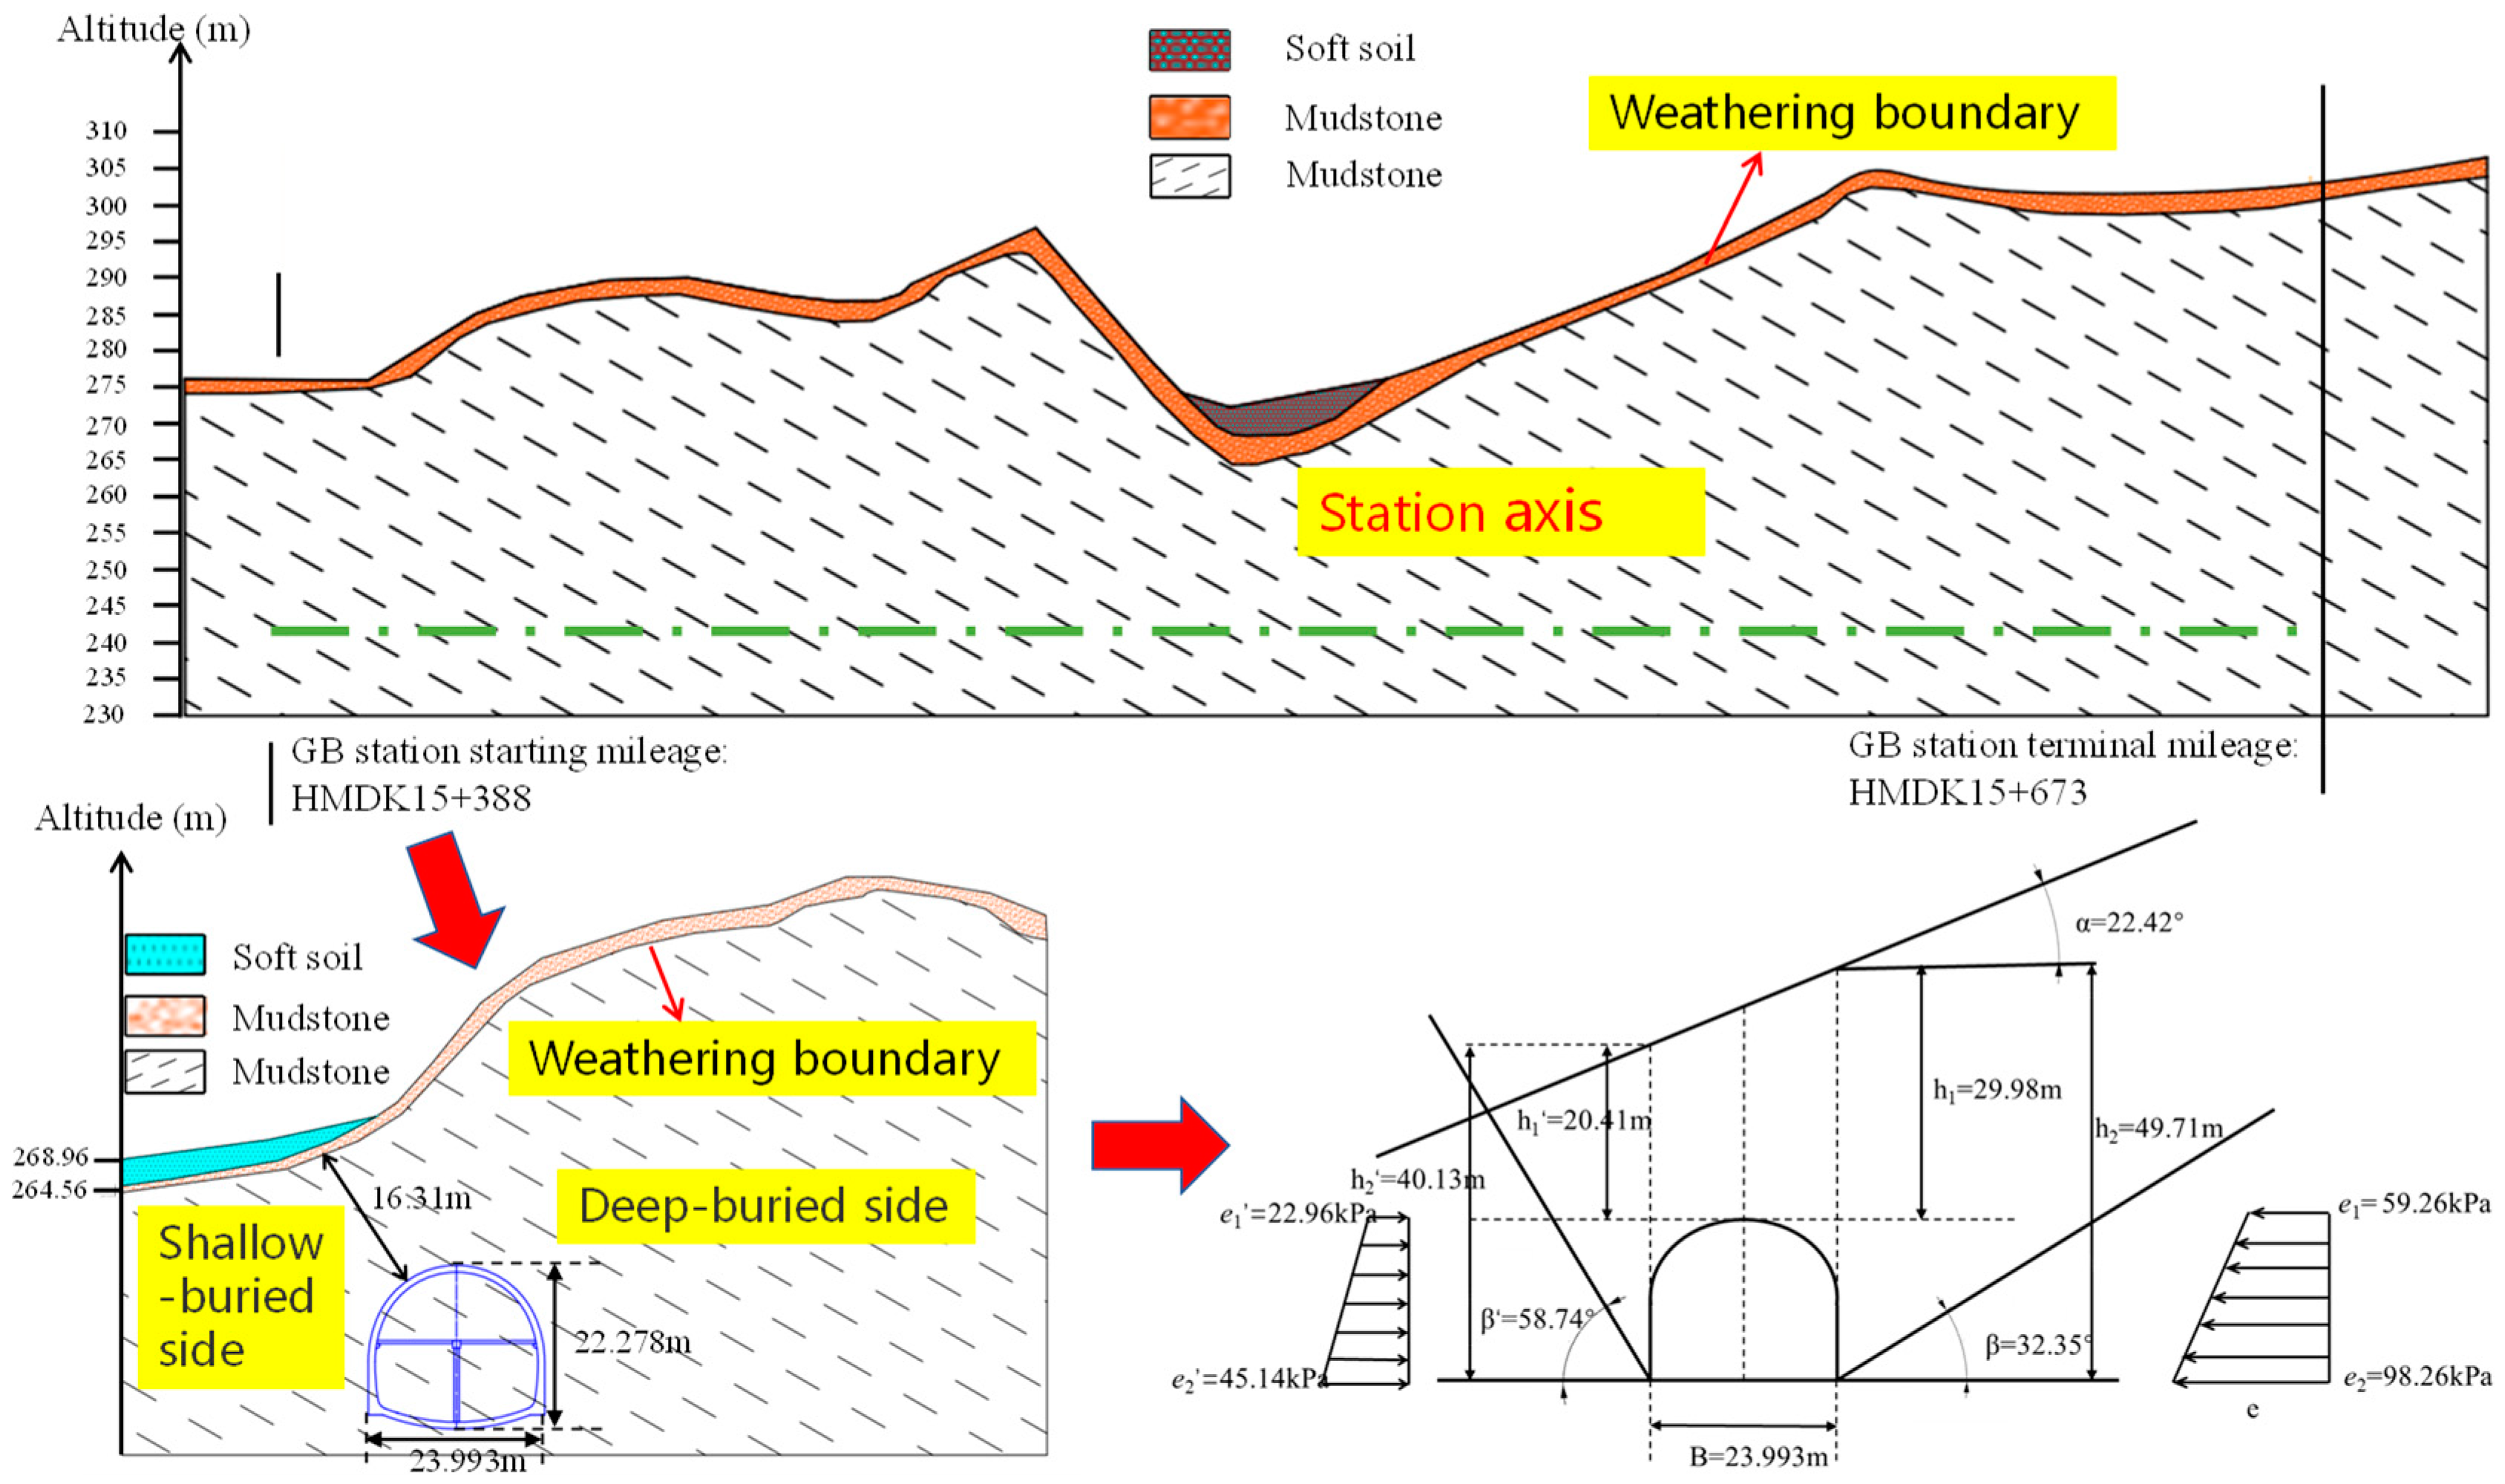
The geological section map of the project area shows that the terrain of the station excavation area fluctuates greatly. In some sections, the cover depth difference between the left and right sides of the station is large, causing the vertical pressure to be biased. Taking the entrance section as an example (Figure 11), a simplified diagram of the bias calculation is obtained based on the geological profile and the code for the design of railway tunnels [33]. The rock mass friction angle (φc) is taken as 23.52° when the GSI is 50, and the top plate friction angle (θ) is taken as 14.11°, which is 0.6 times φc. According to the same method, the bias pressure on three typical bias sections is calculated (Table 6). The data shows that in the sections HMDK15 + 388, HMDK15 + 520 and HMDK15 + 560, the differences between the loads on the vault of the deeply buried side and the shallow buried side are 36.30 kPa, 13.21 kPa and 29.47 kPa, respectively, and those on the arch bottom are 53.12 kPa, 21.10 kPa and 41.24 kPa, respectively. With increasing cover depth, the load difference on both sides of the tunnel increases obviously. Such a large difference indicates that the bias pressure cannot be ignored during excavation. Asymmetrical deformation of the surrounding rock in the working face and an unsymmetrical stress state of the primary support structure easily occur during bias pressure tunnel excavation [34]. Therefore, the pre–reinforcement method of pipe shed grouting should be adopted to improve the unfavorable stress state of the lining under bias pressure [35]. Considering the large excavation section, the double–side heading method with double–side supports also can be adopted to ensure stability during the excavation of Guobo station [36].
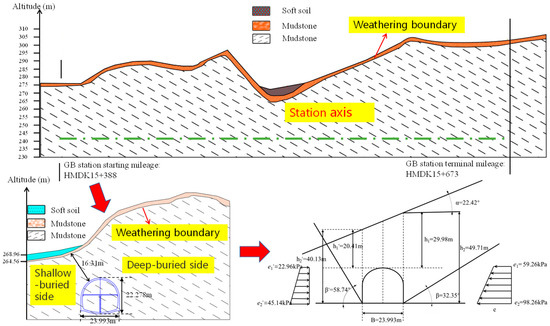
Figure 11.
Geological section map and bias pressure calculation map of the entrance section.
Table 6.
Bias load at some typical sections of the Guobo station.
5.2. High In Situ Stresses
High in situ stresses will lead to engineering problems for the construction of a large section tunnel. Some scholars believe that an in situ stress greater than 30 MPa is an extremely high in situ stress, and others think that the high in situ stress should be defined from the perspective of the strength–stress ratio, that is, the ratio of the maximum principal stress of the surrounding rock and its strength, and in situ stress should be lower than a certain value, which can be regarded as high in situ stress [37]. However, no matter how high in situ stress is defined, research and engineering practices show that when the strength–stress ratio is lower than a certain value, the tunnel is prone to large deformation during excavation. The strength–stress ratio of the surrounding rock in the Guobo station project area is 0.12~0.21 (GSI = 50), the grade of large deformation is serious, and serious large deformation may occur during excavation [38]. Based on the experience of similar working conditions, circular yielding support technology can be used to control the tunnel displacement by making the elastic–plastic deformation of the pressure device absorb and consume energy [39,40].
5.3. Surrounding Rock Deterioration
The water–rock interaction is a problem faced in almost all tunneling projects [41]. A large number of studies have shown that long–term water–rock interactions in soft rock tunnels are an important cause of tunnel damage during their construction and operation, with many tunnels suffering from water softening of mudstone [42]. The softening coefficient test has shown that the surrounding rock of the station is sensitive to water. In the seasonally precipitation–rich area, the shallow buried surrounding rock will be subjected to the repeated action of wetting and drying for a long time, which will reduce the mechanical properties of the surrounding rock. The Laifosi Tunnel in Chongqing, with its geological conditions very similar to those of Guobo Station, was found to have a number of serious to severe defects approximately 4 years after opening for operation. Then, the first remediation of the tunnel defects was carried out in 2010. Unfortunately, after approximately 10 years of treatment, tunnel defects continued to develop, and disease treatment had to be resumed again in 2020. One of the main reasons for the continuous development of the tunnel defects was the continuous deterioration of the mudstone caused by long–term water–rock interactions. Lessons learned from the past can guide one in the future. This reminds us that when building the Guobo station with a larger section, we must reinforce the surrounding rock more effectively. Furthermore, we should also take more careful waterproofing and drainage measures, not only during the construction period but also during the entire service life of the station, to ensure that the station will not suffer from damage.
6. Conclusions
- (1)
- The rock mass in the Guobo station project area is mainly mudstone, and sandstone is only found at borehole 4–4. The UCS of mudstone in the natural state is 4.43~42.43 MPa, with an average value of 18.60 MPa. The BTS is 0.66~4.30 MPa, and the average value is 1.51 MPa. The strength of the mudstone specimens differs greatly from different boreholes, but both the UCS and BTS obey lognormal distributions. The average UCS of sandstone in the natural state is 65.31 MPa, and the average BTS is 3.06 MPa.
- (2)
- The softening coefficients of mudstone and sandstone are 0.33 and 0.73, respectively, which indicates that the water content has an important impact on the strength of both mudstone and sandstone but has a greater effect on mudstone.
- (3)
- The in situ stress field in the project area is affected by horizontal tectonism. The relationship of the principal in situ stresses is: σH > σh > σV. In the area with a cover depth of approximately 60 m, the maximum horizontal principal stress ranges between 4.25~7.36 MPa. The azimuth is distributed between N45°W~65°N°W, and the lateral pressure coefficient is 2.11~5.71, with an average value of 3.39. A large lateral pressure coefficient may cause a tensile stress concentration on the side walls of the station after excavation.
- (4)
- The uniaxial compressive strength of the rock mass at Guobo station does not exceed 1 MPa. The strength–stress ratio of the surrounding rock is only 0.12~0.21 when the GSI is 50, which indicates that the tunnel is prone to large deformation during excavation.
Based on the present experimental results and risk analysis results, we propose the following suggestions for the excavation and support methods of the station: (1) in terms of the excavation method, the double–side heading method with double–side supports may be the best excavation method; (2) in terms of the support methods, the pre–reinforcement method of pipe shed grouting should be adopted to improve the unfavorable stress state of the lining under bias pressure. Aside from this, it is also advisable to reserve enough deformation space, to improve the strength of the initial support and to perform waterproofing during the whole life cycle of the station.
Author Contributions
Conceptualization, D.L.; Investigation, D.L., A.Z. and Y.C.; Methodology, D.L., L.W. and C.M.; Project administration, L.W.; Resources, C.M.; Supervision, D.L.; Validation, A.Z.; Writing—original draft, A.Z.; Writing—review and editing, D.L. and A.Z. All authors have read and agreed to the published version of the manuscript.
Funding
This research was funded by the National Natural Science Foundation of China, grant number U1934211.
Institutional Review Board Statement
Not applicable.
Informed Consent Statement
Not applicable.
Data Availability Statement
The data presented in this study are available on request from the corresponding author.
Conflicts of Interest
The authors declare no conflict of interest.
References
- Tomar, M.S.; Khurana, S. Impact of passive fire protection on heat release rates in road tunnel fire: A review. Tunn. Undergr. Space Technol. 2019, 85, 149–159. [Google Scholar] [CrossRef]
- Xiong, Z.; Guo, J.; Xia, Y.; Lu, H.; Wang, M.; Shi, S. A 3D Multi–scale geology modeling method for tunnel engineering risk assessment. Tunn. Undergr. Space Technol. 2018, 73, 71–81. [Google Scholar] [CrossRef]
- Wang, J.; Qiu, Z.; Deng, W. Shear Strength of a Crushed Sandstone–Mudstone Particle Mixture. Int. J. Archit. Eng. Technol. 2014, 1, 33–37. [Google Scholar] [CrossRef]
- Zhang, Q.; Zhao, W.; Gao, Y.; Li, X.; Li, Y.; He, X. Experimental Study on the Mechanical Properties of Rock Slope Collapse. Fresenius Environ. Bull. 2017, 26, 8166–8175. [Google Scholar]
- Bian, K.; Liu, J.; Liu, Z.; Liu, S.; Ai, F.; Zheng, X.; Ni, S.; Zhang, W. Mechanisms of large deformation in soft rock tunnels: A case study of Huangjiazhai Tunnel. Bull. Eng. Geol. Environ. 2019, 78, 431–444. [Google Scholar] [CrossRef]
- Xue, Y.; Liu, H.; Bai, C.; Su, M.; Qiu, D.; Zhou, B.; Yu, Y.; Jiang, X. Extension prediction model of soft rock tunnel deformation grade based on entropy weight method and rough set. Environ. Earth Sci. 2022, 81, 1–13. [Google Scholar] [CrossRef]
- Wu, K.; Shao, Z.; Qin, S.; Wei, W.; Chu, Z. A critical review on the performance of yielding supports in squeezing tunnels. Tunn. Undergr. Space Technol. 2021, 115, 103815. [Google Scholar] [CrossRef]
- Hoek, E.; Guevara, R. Overcoming Squeezing in the Yacambú–Quibor Tunnel, Venezuela. Rock Mech. Rock Eng. 2009, 42, 389–418. [Google Scholar] [CrossRef]
- Steiner, W. Tunnelling in squeezing rocks: Case histories. Rock Mech. Rock Eng. 1996, 29, 211–246. [Google Scholar] [CrossRef]
- Li, D.; Li, X.; Li, C.C.; Huang, B.; Gong, F.; Zhang, W. Case studies of groundwater flow into tunnels and an innovative water–gathering system for water drainage. Tunn. Undergr. Space Technol. 2009, 24, 260–268. [Google Scholar] [CrossRef]
- Xue, Y.; Li, X.; Li, G.; Qiu, D.; Gong, H.; Kong, F. An Analytical Model for Assessing Soft Rock Tunnel Collapse Risk and its Engineering Application. Geomech. Eng. 2020, 23, 441–454. [Google Scholar]
- Bizjak, K.F.; Petkovšek, B. Displacement analysis of tunnel support in soft rock around a shallow highway tunnel at Golovec. Eng. Geol. 2004, 75, 89–106. [Google Scholar] [CrossRef]
- Zhong, Z.; Liu, X.; Wang, D.; Zheng, C.; Huang, M. Mechanism Analysis of Floor Heave in Taoshuya Tunnel and its Prevention Techniques. Chin. J. Geotech. Eng. 2012, 34, 471–476. [Google Scholar]
- Małkowski, P.; Ostrowski, Ł.; Bednarek, Ł. The Effect of Selected Factors on Floor Upheaval in Roadways—In Situ Testing. Energies 2020, 13, 5686. [Google Scholar] [CrossRef]
- Małkowski, P.; Ostrowski, Ł.; Stasica, J. Modeling of Floor Heave in Underground Roadways in Dry and Waterlogged Conditions. Energies 2022, 15, 4340. [Google Scholar] [CrossRef]
- Rehman, H.; Naji, A.M.; Nam, K.; Ahmad, S.; Muhammad, K.; Yoo, H.-K. Impact of Construction Method and Ground Composition on Headrace Tunnel Stability in the Neelum–Jhelum Hydroelectric Project: A Case Study Review from Pakistan. Appl. Sci. 2021, 11, 1655. [Google Scholar] [CrossRef]
- Li, D. Analysis of Coupling Effect of Stress Field and Seepage Field in Surrounding Rock of Expressway Multi Arch Tunnel. Master’s Thesis, Central South University, Changsha, China, 2006. [Google Scholar]
- He, W. Features and Formation Mechanism of the Eastern–Sichuan—Western–Hunan–Hubei Fold–Thrust Belt in South China. Ph.D. Thesis, China University Of Petroleum (Beijing), Beijing, China, 2018. [Google Scholar]
- Xie, G.; Jia, D.; Zhang, Q.; Wu, X.; Shen, L.; Lv, Y.; Zou, X. Physical Modeling of the Jura–Type Folds in Eastern Sichuan. Acta Geol. Sin. 2013, 87, 773–788. [Google Scholar]
- Pei, Y.; Sheng, S.; Miao, Z.; Mou, Y.; Su, N.; Guo, W.; Feng, B.; Wang, J.; Liang, H.; Xie, L. Sandbox physical modelling with multiple detachment layers and its implication on structural evolution of East Sichuan Fold Belt. J. China Univ. Pet. (Ed. Nat. Sci.) 2022, 46, 38–49. [Google Scholar]
- Yan, D.-P.; Zhou, M.-F.; Song, H.-L.; Wang, X.-W.; Malpas, J. Origin and tectonic significance of a Mesozoic multi–layer over–thrust system within the Yangtze Block (South China). Tectonophysics 2003, 361, 239–254. [Google Scholar] [CrossRef]
- Zhang, M.; Yin, Y.; Huang, B. Mechanisms of rainfall–induced landslides in gently inclined red beds in the eastern Sichuan Basin, SW China. Landslides 2015, 12, 973–983. [Google Scholar] [CrossRef]
- Xu, R.; Zhou, J. Red Bed and Dam; China University of Geosciences Press: Wuhan, China, 2010. [Google Scholar]
- GB/T 23561.10–2010; General Administration of Quality Supervision, Inspection and Quarantine of the People’s Republic of China; Standardization Administration of the People’s Republic of China. Methods for Determining the Physical and Mechanical Properties of Coal and Rock. Standards Press of China: Beijing, China, 2009.
- Li, X.; Chen, J.; Ma, C.; Huang, L.; Li, C.; Zhang, J.; Zhao, Y. A novel in–situ stress measurement method incorporating non–oriented core ground re–orientation and acoustic emission: A case study of a deep borehole. Int. J. Rock Mech. Min. Sci. 2022, 152, 105079. [Google Scholar] [CrossRef]
- Hoek, E.; Wood, D.; Shah, S. A Modified Hoek–Brown Failure Criterion for Jointed Rock Masses. In Proceedings of the Rock Characterization: ISRM Symposium, Eurock’92, Chester, UK, 14–17 September 1992; Thomas Telford: London, UK, 1992. [Google Scholar]
- Hoek, E.; Brown, E.T. Empirical Strength Criterion for Rock Masses. J. Geotech. Geoenviron. Eng. 1980, 106, 1013–1035. [Google Scholar] [CrossRef]
- Hoek, E.; Brown, E.T. The Hoek–Brown Failure Criterion and GSI–2018 Edition. J. Rock Mech. Geotech. Eng. 2018, 11, 445–463. [Google Scholar] [CrossRef]
- Marinos, P.; Hoek, E. GSI–A Geologically Friendly Tool for Rock Mass Strength Estimation. In Proceedings of the ISRM International Symposium, Melbourne, Australia, 19–24 November 2000; OnePetro: Salzburg, Austria, 2000. [Google Scholar]
- Wu, S. Rock Mechanics; Higher Education Press: Beijing, China, 2021; pp. 232–238. [Google Scholar]
- Zhao, G.; Yang, S. Analytical solutions for rock stress around square tunnels using complex variable theory. Int. J. Rock Mech. Min. Sci. 2015, 80, 302–307. [Google Scholar] [CrossRef]
- Zhang, N.; Fang, Q.; Li, Y.; Zhang, D. Mechanical Analysis of Secondary Lining of High–Speed Railway Tunnel. KSCE J. Civ. Eng. 2017, 22, 2384–2389. [Google Scholar] [CrossRef]
- State Railway Administration. Code for Design of Railway Tunnel; China Railway Press: Beijing, China, 2017. [Google Scholar]
- Lei, M.; Peng, L.; Shi, C. Model test to investigate the failure mechanisms and lining stress characteristics of shallow buried tunnels under unsymmetrical loading. Tunn. Undergr. Space Technol. 2015, 46, 64–75. [Google Scholar] [CrossRef]
- Wang, Y. Comparison and Selection of Advanced Supporting Methods and Asymmetric Optimization Analysis for Shallowly Buried Biased Tunnel. Railw. Constr. Technol. 2022, 5, 159–163. [Google Scholar]
- Lu, G.; Zhou, B.; Xu, F.; Shangguan, W.; Wang, G.; Zhang, S. Stability Analysis and Construction Mechanics of Shallow Buried Bias Tunnel Openings. J. Shangdong Univ. 2021, 51, 61–70. [Google Scholar]
- Chen, F.; He, C.; Deng, J. Concept of High Geostress and its Qualitative and Quantitative Definitions. Rock Soil Mech. 2015, 36, 971–980. [Google Scholar]
- Ma, D.; Sun, Y.; Wang, W.; Jin, L. Key Technologies for Controlling Large Deformation of Soft Rock Tunnels with High Geostress. Tunn. Constr. 2021, 41, 1634–1643. [Google Scholar]
- Lei, S.; Zhao, W. Study on Mechanism of Circumferential Yielding Support for Soft Rock Tunnel with Large Deformation. Rock Soil Mech. 2020, 41, 1039–1047. [Google Scholar]
- Wu, G.; Chen, W.; Tian, H.; Jia, S.; Yang, J.; Tan, X. Numerical evaluation of a yielding tunnel lining support system used in limiting large deformation in squeezing rock. Environ. Earth Sci. 2018, 77, 439. [Google Scholar] [CrossRef]
- Guo, Q.; Su, H.; Jing, H.; Zhu, W. Effect of Wetting–Drying Cycle on the Deformation and Seepage Behaviors of Rock Masses around a Tunnel. Geofluids 2020, 4237163. [Google Scholar] [CrossRef]
- Cui, T.; Du, S.; Zhang, W.; Yang, S. Cause Analysis of Longitudinal Cracks of Secondary Lining in railway Soft Rock Tunnel. Rainway Eng. 2018, 58, 74–77. [Google Scholar]


Publisher’s Note: MDPI stays neutral with regard to jurisdictional claims in published maps and institutional affiliations. |
© 2022 by the authors. Licensee MDPI, Basel, Switzerland. This article is an open access article distributed under the terms and conditions of the Creative Commons Attribution (CC BY) license (https://creativecommons.org/licenses/by/4.0/).