Article

Development and Application of Methodology for Quantification of Overbreaks in Hard Rock Tunnel Construction

by
Zoran Berisavljević
1,
Dragoljub Bajić
1 and
Vojkan Jovičić
2,*
1
Faculty of Mining and Geology, University of Belgrade, 11000 Belgrade, Serbia
2
Faculty of Civil and Geodetic Engineering, University of Ljubljana, 1000 Ljubljana, Slovenia
*
Author to whom correspondence should be addressed.
Appl. Sci. 2023, 13(3), 1379; https://doi.org/10.3390/app13031379
Submission received: 19 November 2022 / Revised: 15 January 2023 / Accepted: 16 January 2023 / Published: 20 January 2023
(This article belongs to the Special Issue Advances in Developing Underground)

Abstract

:
A methodology for determining overbreaks in hard rock tunnel construction using the drill-and-blast technique is presented in this paper. The methodology was developed for and applied to crystalline medium- to thick-bedded limestone, but it can be used in any jointed hard rock mass. Overbreaks are inevitable in hard rock tunnelling in a low-confinement environment (shallow tunnels up to several hundred meters deep) as a result of wedge failures along unfavourably oriented discontinuities caused by blasting. It is widely accepted in engineering practise that overbreaks will be inevitable even if smooth contour blasting is applied. If not controlled, overbreaks can result in extreme financial and time costs; and determining, predicting, and mitigating them is the key to successful tunnel construction in hard rock. Technological overbreaks, which are caused by the inappropriate use of drill-and-blast excavation, are not easily distinguished from the inevitable overbreaks dictated by the geological conditions with which they interfere and overlap. A methodology was developed with the aim of distinguishing the two causes of overbreaks, which can be applied in any phase of tunnel construction for evaluation or mitigation. The analysis of key inputs, including geological face mapping, shear strength tests along discontinuities of the rock mass, and their spatial orientation relative to tunnel advancement and survey overbreak measurements, is presented in this paper. Due to the stochastic and statistical nature of the problem, a probabilistic concept was also applied as part of the method so that the probability of failure around unprotected tunnel sections could be determined. The so-called stability criterion is introduced to distinguish between stable and unstable sections in terms of the probabilistic safety factor. The quantification of overbreaks, including the threshold value distinguishing technological from geological overbreaks, is proposed. The application of the methodology, demonstrated on an 8.1 km long section of a 12 km long pressure tunnel in hard rock, is presented in the paper.

1. Introduction

Drill-and-blast excavation is commonly used in hard rock tunnel excavation due to its economic feasibility and adaptability to changing rock mass conditions in both mining and civil engineering. In civil engineering, drill-and-blast is often used as part of the New Austrian Tunnelling Method (NATM), in which the primary support of the tunnel is made of predominantly shotcrete lining and radial rock bolts [1]. In the NATM, the purpose of installing a primary support is to achieve equilibrium in the interaction with the rock mass so that ideally a secondary lining can be constructed free of any additional external load.
The economic evaluation of the NATM significantly relies on the precision of the geometry of excavation, particularly for tunnels in hard rock, in which the primary shotcrete lining is not usually reinforced and entirely follows the contour of excavation. Overbreaks, which generally result from drill-and-blast excavation, cause rough and irregular contours. If overbreaks are superfluous in terms of occupied surface and volume, they significantly increase the consumption of shotcrete as well as the consumption of cast-in-place concrete needed for the secondary lining, both at substantial cost.
In engineering practise, the problem of overbreaks has been addressed mainly from a technological point of view, with an aim to evaluate blasting quality and improve efficiency. Typically, a smooth contour blasting technique [2] is used to reduce the damage to the rock mass surrounding the underground excavation. This technique involves drilling a number of closely spaced boreholes along the final excavation contour; low-charge density-decoupled charges are installed in the boreholes. The detonation of the contour charges is triggered simultaneously after the detonation of the main charges located in the blast holes at the face of the excavation, with the aim of obtaining as smooth a contour as possible. Sometimes presplitting blasting, in which the peripheral holes are detonated prior to the main boreholes, is used for the same purpose, but it typically has lower efficiency [3].
With some exceptions [4], geological conditions, which are a key cause of overbreaks, are seldom evaluated in the context of blasting efficiency [5]. The key question during mining and tunnelling excavations is whether overbreaks were caused by inappropriate blasting practice or unfavourable rock mass characteristics. However, the response to this question differs in the mining and civil engineering industries. In mining, the functional role of a secondary tunnel lining is rarely needed, and the focus is on critically evaluating the technological factors influencing blast damage to achieve better fragmentation and, thus, more efficient access to mineral resources [6]. In civil engineering, the focus is on the quality of blasting but not on fragmentation. Instead, the efficiency of blasting is measured by the reduction of inevitable overbreaks, which must comply with the required pace of tunnel drift, so in this case, the rock mass characteristics are the most significant factor.
An understanding of rock mass characteristics is necessary to determine the explosive properties and blast design parameters necessary to obtain optimum results. However, as emphasised by Sing and Xavier [5], the heterogeneity of the rock mass material is in fact rarely considered during blast design. At the same time, it is commonly accepted that rock mass discontinuities have a controlling influence on the outcome of a blast. Most formulas in blasting are designed based on controllable parameters such as burden, spacing, bench height, hole diameter, stemming, decking, firing pattern, quantity of explosive, etc. However, according to Chandrahas et al. [7], many researchers have reported that uncontrollable parameters such as joints and bedding planes, and rock compressive and tensile strength also significantly affect blast performance. This implies that some overbreaks can be attributed to technological aspects of the blasting operation, which are referred to as technological overbreaks, whereas others are caused by unfavourable geological conditions, which are referred to as geological overbreaks.
In terms of geological overbreaks, local geological conditions have a significant role, whereas the single most important consideration is the geological structure. The system of discontinuities, dips and strikes of bedding planes, and their relative position to the direction of the tunnel drift are decisive factors for the success of the blasting process and infrequent occurrence of overbreaks. In particular, it is commonly observed that the joint orientation and patterns can influence both fragmentation and overbreak in a blast [8]. The presence of joints affects the attenuation of the stress wave induced by blasting, which is minimal when the angle of occurrence is parallel or perpendicular to the face and increases to a maximum when the angle is between 15° and 45° [9]. Thus, if dominant joints are parallel to the face or inclined at an acute angle, there can be blocky fragmentation and severe endbreak. On the contrary, when the dominant joint direction is perpendicular to the face, no overbreak should occur when the fragmentation is poor, as block breakage can be expected. Other authors also reported that spatial alterations in joint angles will have a significant effect on the blast results [10,11], as well as joint intensity [12].
The influence of the aperture of discontinuities on overbreaks was studied by Paswan et al. [13], who concluded that increasing joint surface separation severely decreases the quality of the final excavation profile as a result of increased cratering of joints. Tariq and Worsey [14] showed that a joint aperture as small as 3 mm acts as a free face, reflecting back the explosive energy and reducing the efficiency of blasting. The frequency of discontinuities in highly fractured rock mass is the critical factor in the incidence of overbreak; Singh and Xavier [5] emphasised that a drilling pattern wider than the joint spacing for a frequency of 2–3 joint planes per spacing could have an adverse effect on perimeter control and cause large and consistent overbreaks.
It should be stressed that geological overbreaks are more pronounced in hard rock tunnelling within a low-confinement environment (shallow tunnels up to several hundred meters deep) due to the incidence of wedge failures along unfavourably oriented discontinuities. In order to analyse the stability of the wedges, the parameters of the shear strength of the discontinuities need to be evaluated as part of the overbreak assessment.
The aim of this study was to develop an objective methodology for quantifying the extent of geological overbreaks by evaluating unstable wedges along the tunnel layout based on a deterministic and probabilistic concept. This was further expanded to establish a criterion that can be used to quantify excavation overbreaks that are a consequence of technology overbreaks in terms of volume, so that the two can be compared. The application of the methodology on the excavation of an 8.1 km long section of pressure tunnel built in limestone is presented, but it is formulated so that it can be used for any tunnel in hard, jointed rock.

2. Methodology

2.1. Outline

The applied methodological approach involves step-by-step quantification of overbreaks around the contour of the unsupported tunnel excavation. In the first step, a deterministic approach is applied to determine the positions and dimensions of unstable wedges around the contour. This procedure is based on an analysis of the shear strength characteristics of the discontinuities and their orientation relative to the position of the excavation in three dimensions. Block theory, which was developed by Goodman and Shi [15,16], can be applied in hard, jointed rock masses in which the kinematic conditions for the movement of blocks occur as a result of the unfavourable orientation of the discontinuities. This theory was implemented in the UnWedge software package (Rocscience, Inc., Toronto, ON, Canada), which was used in the analysis described in some detail in the next section.
In the second step, a probabilistic approach which considered the stochastic nature of the geological structure of incipient blocky rock and blocky rock was used. This approach is used to define the probability of occurrence of unwanted consequences, that is, the level of acceptable risk. It should be regarded as complementary to the deterministic approach, in which the positions, dimensions, and safety factors of the block wedges are clearly defined. Instead, the analysis considers the probability of failure of block wedges, with consideration of the uncertainty and variability of the input parameters, which are inevitable in natural geological conditions. In addition to the probability of failure around the contour of the underground excavation, the analysis is used to determine the magnitude of the probabilistic safety factor. Based on the combination of the probability of failure and the probabilistic safety factor, the so-called stability criterion is used to indicate risk.
In the third and final step, the results of the deterministic and probabilistic analyses are generalised across the length of the tunnel, with the aim of quantifying the overbreak volume. This is conducted with consideration of all relevant influencing parameters (rock mass quality estimated via RMR values, number of sets of joints, and their orientation), without having to directly evaluate the shear strength of the joints.
The gradual application of the methodology summarised above enables practicing engineers to draw conclusions about the nature and possible amount of geological overbreaks in relation to technological overbreaks by analysing only the crucial data. The theoretical background of the deterministic and probabilistic approaches to evaluating block instability around a tunnel excavation is presented in the next section, followed by quantification analysis, which is a synthesis of both.

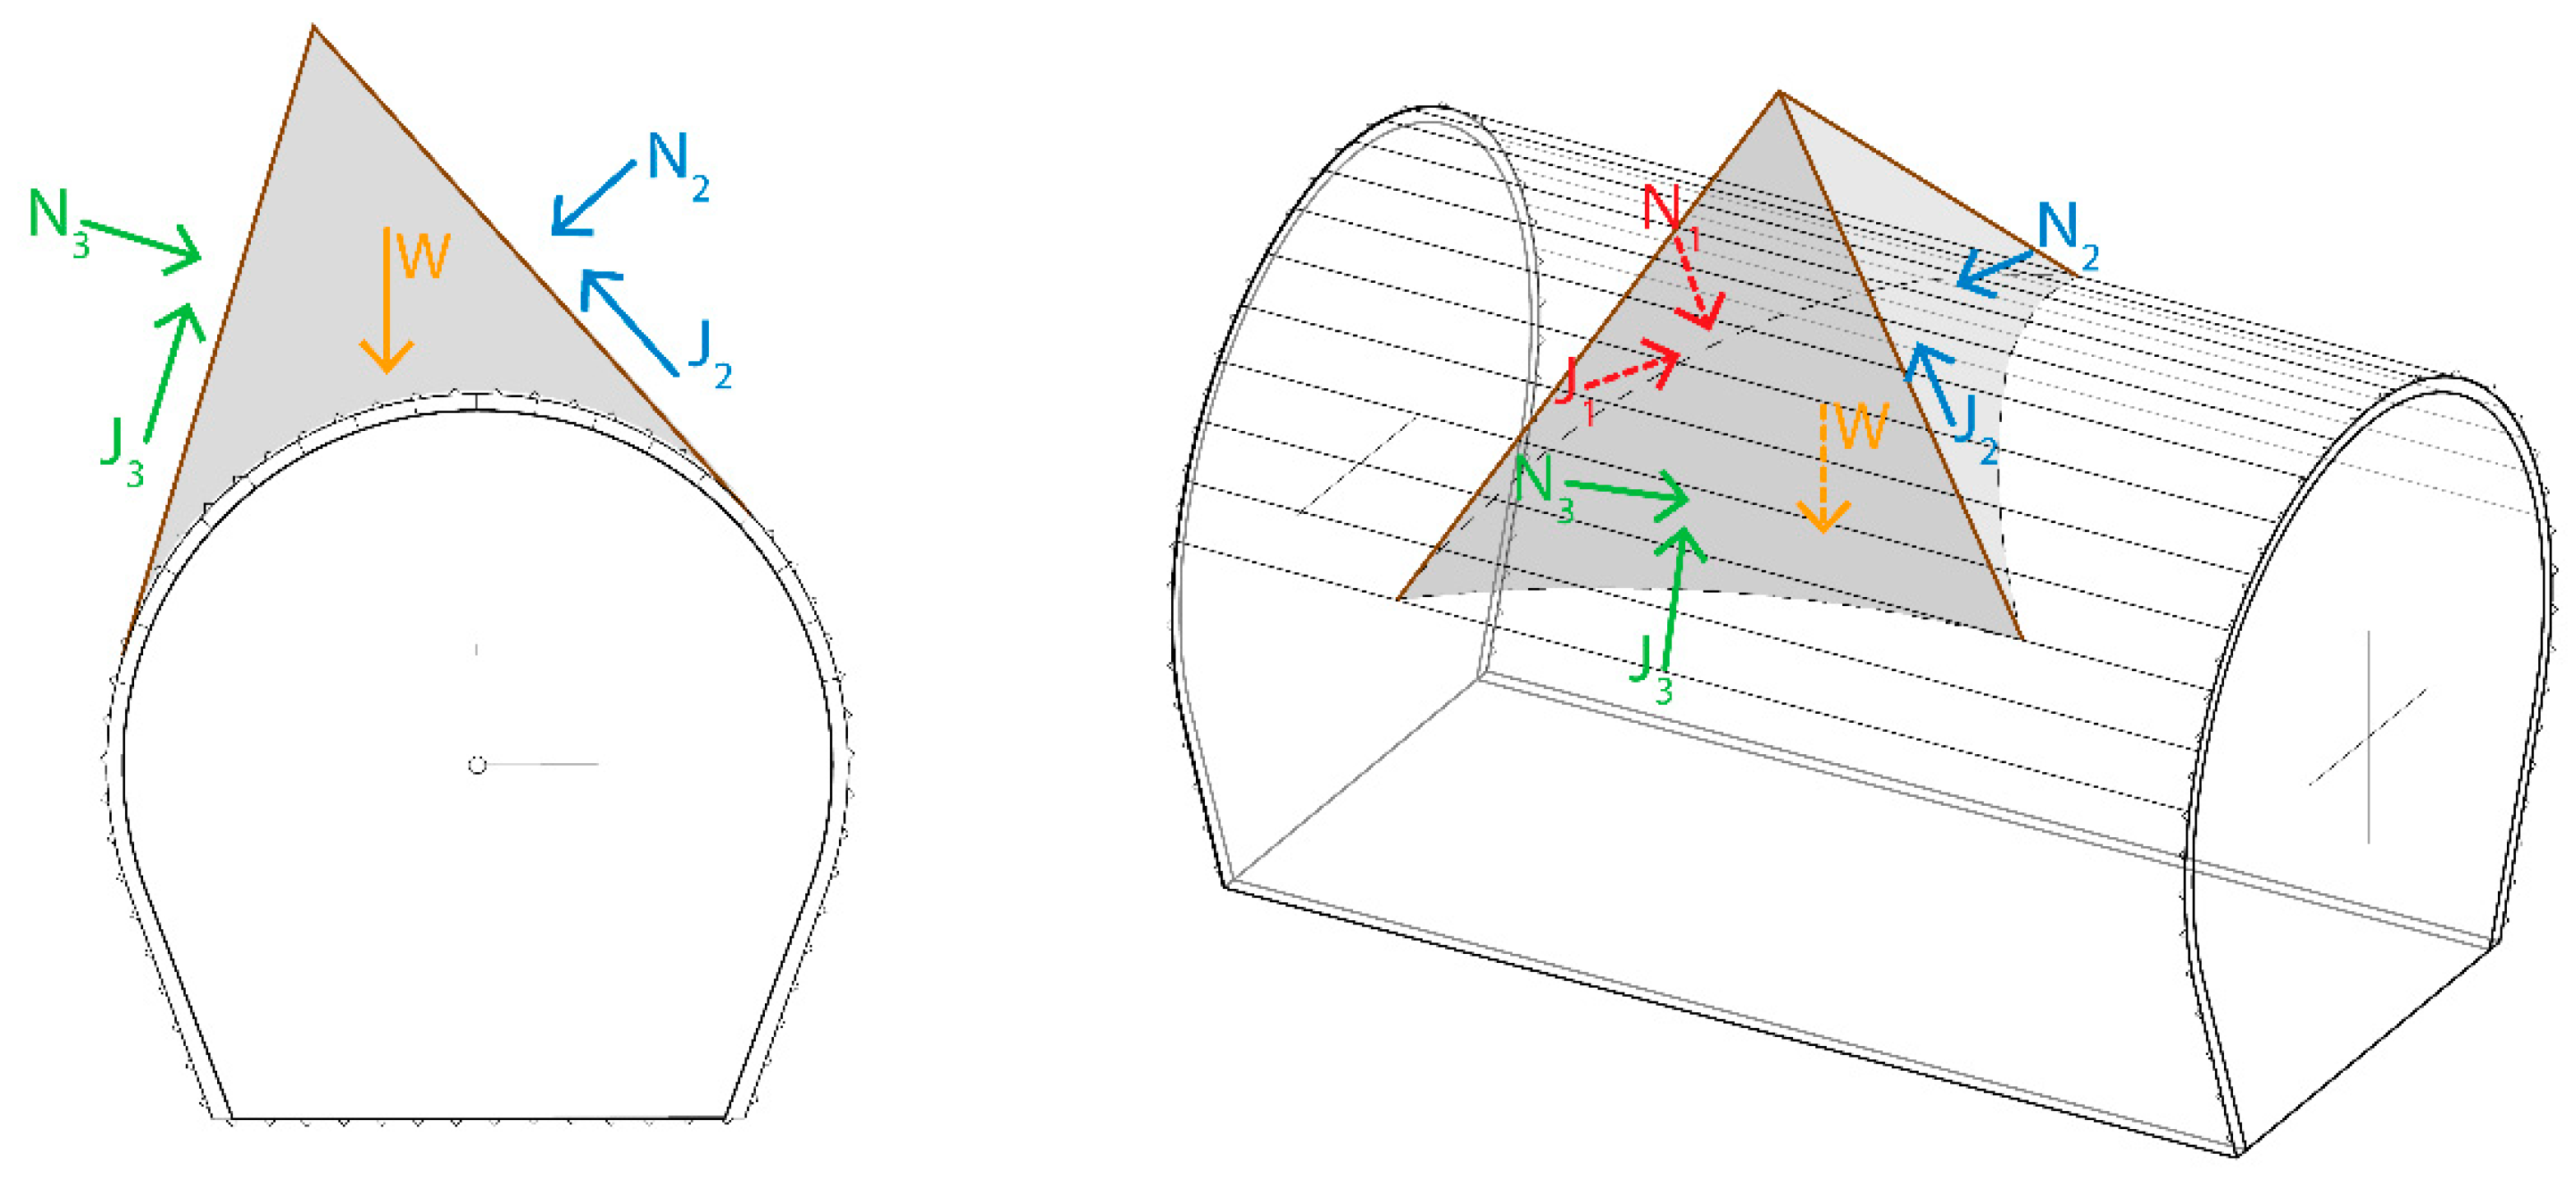
2.2. Analysis of Instability around the Contour of an Underground Excavation Leading to Overbreak

2.2.1. Deterministic Method

The deterministic method is based on the theory of block stability in jointed rock mass [15,16]. Block theory is based on a geometric analysis of the possible occurrence of “key” blocks of a certain size and position in relation to the geometry of the excavation, and it considers three spatial dimensions. A key block can be defined as a block for which there is the possibility of movement towards the contour of the tunnel excavation, and which is unstable if not supported.
The dip, strike, and azimuth of discontinuities are recorded at each step of tunnel excavation during geological mapping, along with other significant joint characteristics from the perspective of block theory analysis. Once available, these data can be effectively used to conduct block analysis for each tunnel cross-section during the tunnel drive. In order to apply block theory, it is necessary to isolate an intersection of at least three sets of joints in the rock mass. The joint sets present along the unsupported tunnel section form wedges in the shape of a tetrahedron, the dimensions and position of which depend on the orientation and spatial location of joints and the orientation and geometry of the tunnel contour. Depending on the shear strength parameters along the discontinuities, the factors of safety against failure can be determined for each wedge. In the scenario in which four or more sets of joints are present in the rock mass, it is possible to analyse combinations of any three sets and thus determine the most critical wedge. The analysis is usually repeated with different combinations of joint sets so that all potentially unstable blocks around the contour can be duly assessed.
The dimensions of the wedges depend on the persistence of the joints and the length of the unsupported excavation. In the case of persistent joints and an infinite excavation length, the critical size of the block is limited by the key block size. The key block size can be calculated from the geometry of the largest pyramidal surface in the intersection of sets of joints and the contour of excavation. To obtain realistic dimensions of wedges for each analysed tunnel section, the length of the unsupported excavation is taken to coincide with the length of the tunnel excavation step. The persistence of the joints is interpreted on the basis of geological mapping, which is usually based on the rock mass rating (RMR) classification initially proposed by Bieniawski [17,18].
Three-dimensional block theory is based on vector analysis, in which the stability of the wedge around the contour of the underground excavation is determined following several predetermined steps that are integrated in the UnWedge software package (Rocscience, Inc., Toronto, ON, Canada). In the first step, the geometry and position of the wedge are determined, as illustrated in Figure 1, so that the volume, surface area of each side, and vectors normal to each plane of the wedge can be determined. Once all forces acting on the wedge are determined, the results of active (driving) and passive (resisting) forces can be evaluated. Based on the equilibrium of active and passive forces, the direction of sliding of the wedge as well as the normal forces acting on the sides of the wedge are determined.
The resulting active force vector (A) is obtained as
A = W + C + X + U
where W is the weight vector of the wedge, C is the weight vector of the shotcrete lining, X is the vector of active pressure on the wedge, and U is the water pressure vector.
The resulting passive vector (P) is obtained by the addition of component vectors:
P = H + Y + B
where H is the shear resistance vector of the shotcrete, Y is the passive resistance vector, and B is the vector of the resultant force from the anchor, if used.
The sliding direction of the wedge is determined from the result of the active forces (vector A, Equation (1)). For a tetrahedron-shaped wedge (bordered by three sets of joints and the excavation contour surface), there are seven possible directions along which slide failure can occur. Sliding can be a consequence of gravitational fallout or movement along one of the three sets of joints or along the intersection of two sets of joints.
In the first step of calculating the sliding direction, all seven possible directions are considered, after which, in the second step, it is determined which of the seven directions is valid. This calculation is conducted by establishing vector inequalities for each individual case. If a certain direction meets all vector inequalities, it represents the sliding direction; otherwise, if all seven possible sliding directions are not directions along which sliding can occur, the wedge is regarded as unconditionally stable.
The normal forces acting on the planes along which wedge sliding can occur (one in the case of sliding along the joint and two in the case of sliding along the section line) are determined depending on the previously defined sliding direction (Figure 1). These are necessary to calculate the normal stress (force/area) on the slide plane and the shear strength along a discontinuity.
To define the shear strength of the discontinuity, the Barton–Bandis (BB) failure criterion [19], which is defined by the following equation, is used:
τ = σ n tan [ JRC · log 10 ( JCS σ n ) + φ r ]
where JRC is the joint roughness coefficient, JCS is the joint wall compressive strength, σn is the normal stress acting on the joint wall, and φr is the residual friction angle.
The residual friction angle φr can be determined from the following equation:
φ r = ( φ b 20 ) + 20 ( r / R )
where r is the rebound number, which is measured using a Schmidt hammer for natural (altered and/or wet) discontinuity; R is the rebound number, which is measured with a Schmidt hammer for unaltered and dry joint surface; and φb is the base angle of friction.
The roughness coefficient and compressive strength of the joint walls are affected by scale and are dependent on the size of the considered joint plane. According to Barton and Bandis [20], the dependencies on which the correction of JRC and JCS is based, with consideration of the scale effect, are as follows:
JRC n = JRC 0 [ L n L 0 ] 0 . 02 · JRC 0 JCS n = JCS 0 [ L n L 0 ] 0 . 03 · JRC 0
where coefficients with the index 0 refer to samples of reference length (L0 = 10 cm), and coefficients with the index n correspond to the natural size of the observed joint of the rock mass (in the analysed case, the adopted block joint length was 3 m).
The resistance force (Ji), which is a consequence of the engagement of shear strength along the discontinuity and acts in the direction opposite to the sliding direction, can be determined by the following equation:
J i = τ i α i cos Θ i
where τi is the shear strength of the ith discontinuity, αi is the surface of the ith discontinuity, and θi is the angle between the sliding direction and the ith discontinuity.
The resisting forces are determined as an integral of shear strength along the discontinuity planes. In the last step, the size of the safety factor is determined as the ratio of resisting and driving forces. The magnitude of the safety factor, in the case of an unsupported excavation, is determined according to the principle of the limit equilibrium method based on the following equation:
Factor   of   safety   ( FOS ) = Resisting   forces   ( shear   strength ) Driving   forces   ( weight   of   wedge )
Wedge failure is indicated when the calculated wedge safety factor is less than or equal to 1.0 (FoS ≤ 1.0). When determining the size of the safety factor, only the force equilibrium in the sliding direction is considered, whereas the equilibrium condition of moments is ignored. This is justified given that the failure surface is planar and neglecting the moment equilibrium does not affect the result.
The deterministic method comprises the following steps:
(1)
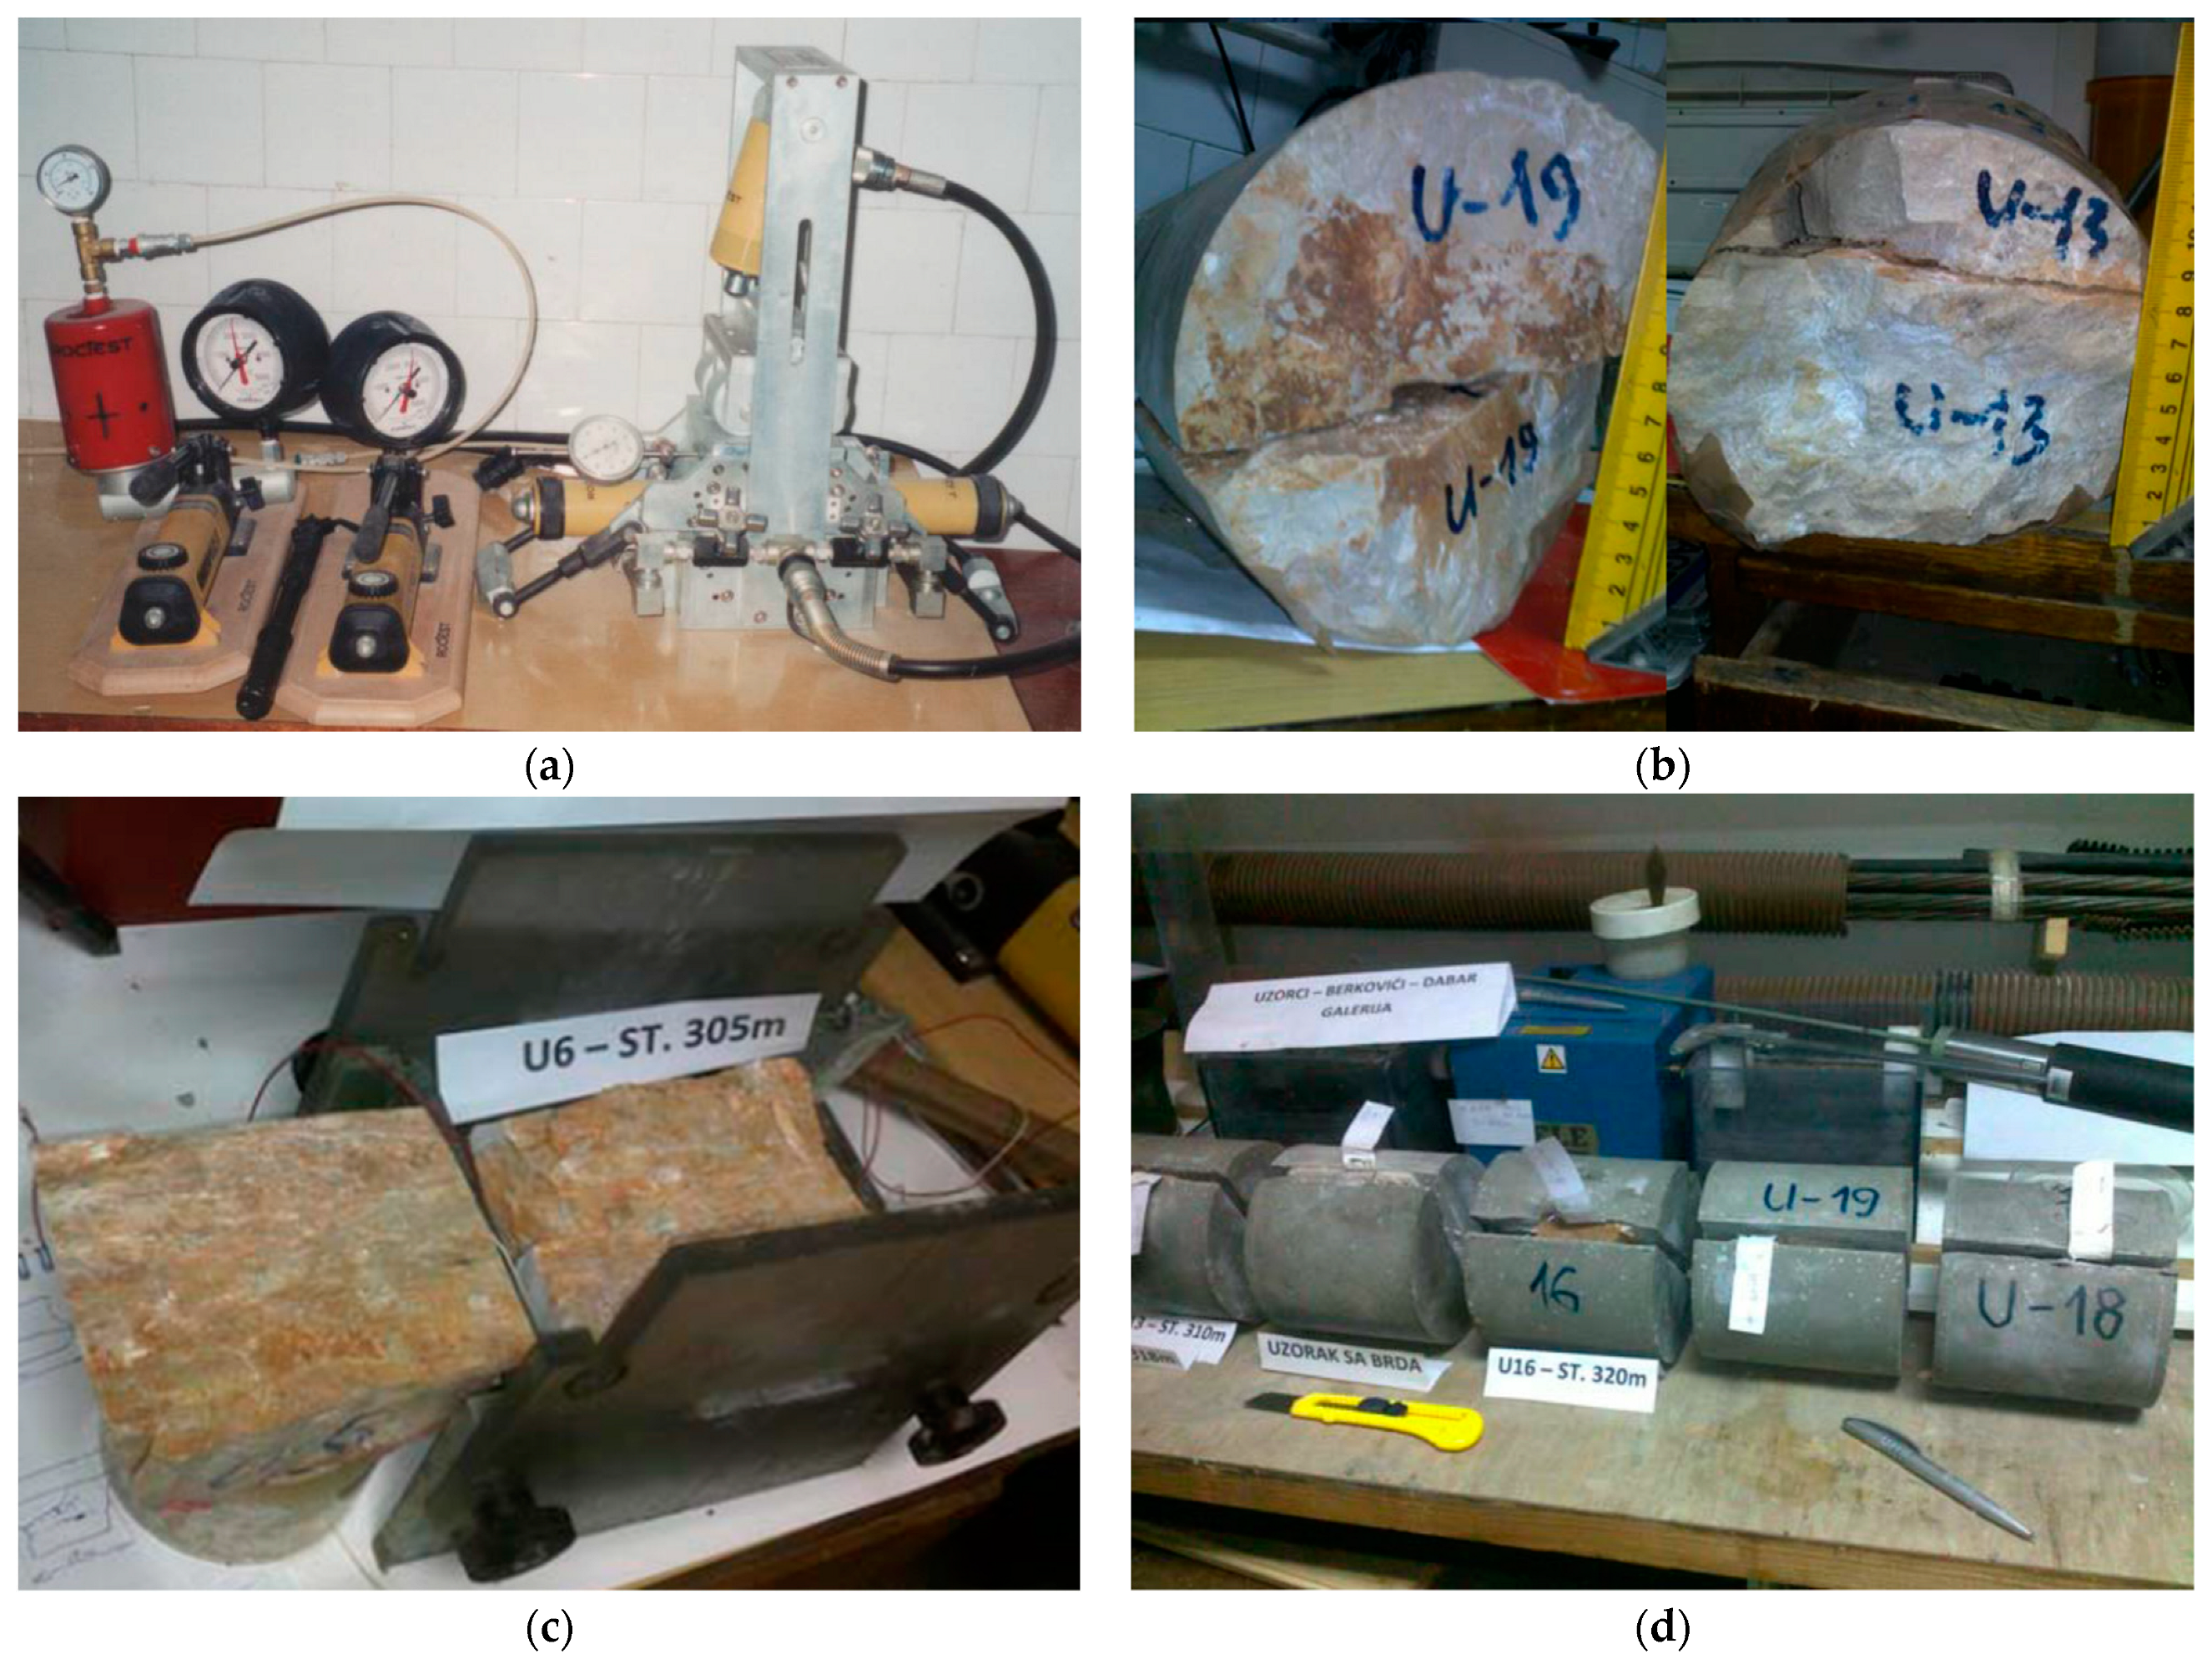
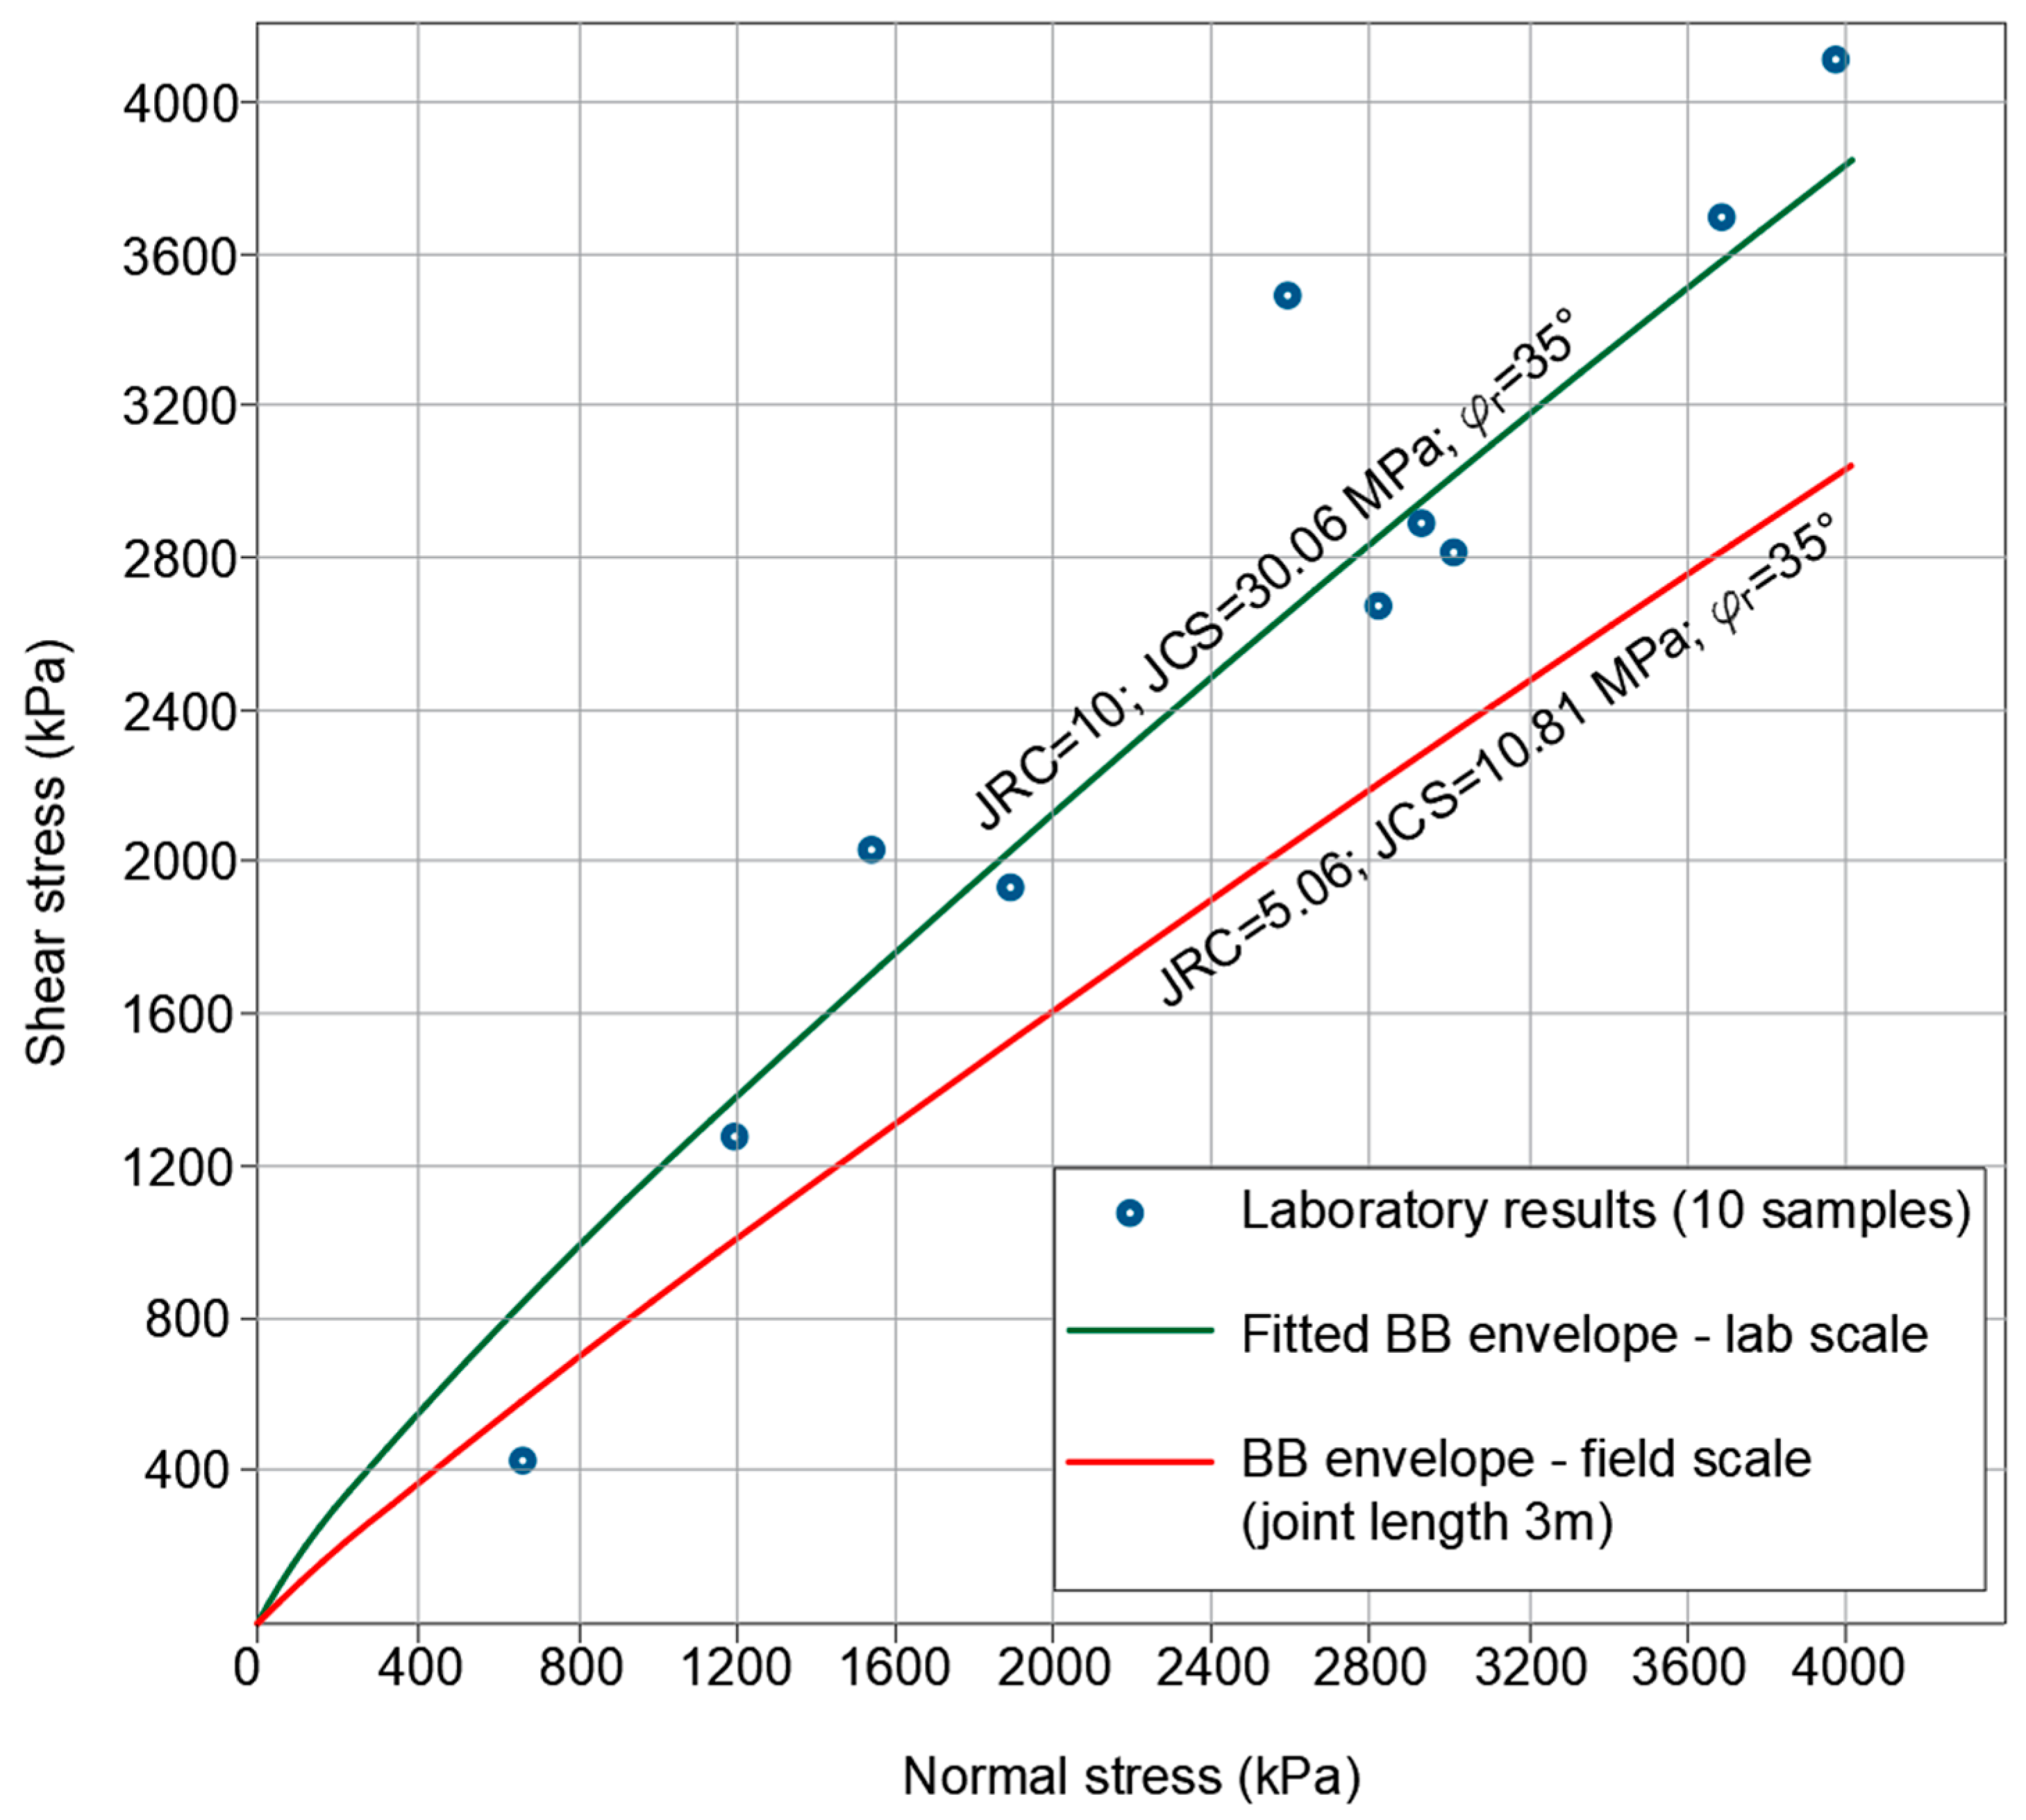
Estimate the shear strength parameters of the discontinuities (extrapolated to the field scale);
(2)
Determine their spatial orientation (obtained from the tunnel face mapping data);
(3)
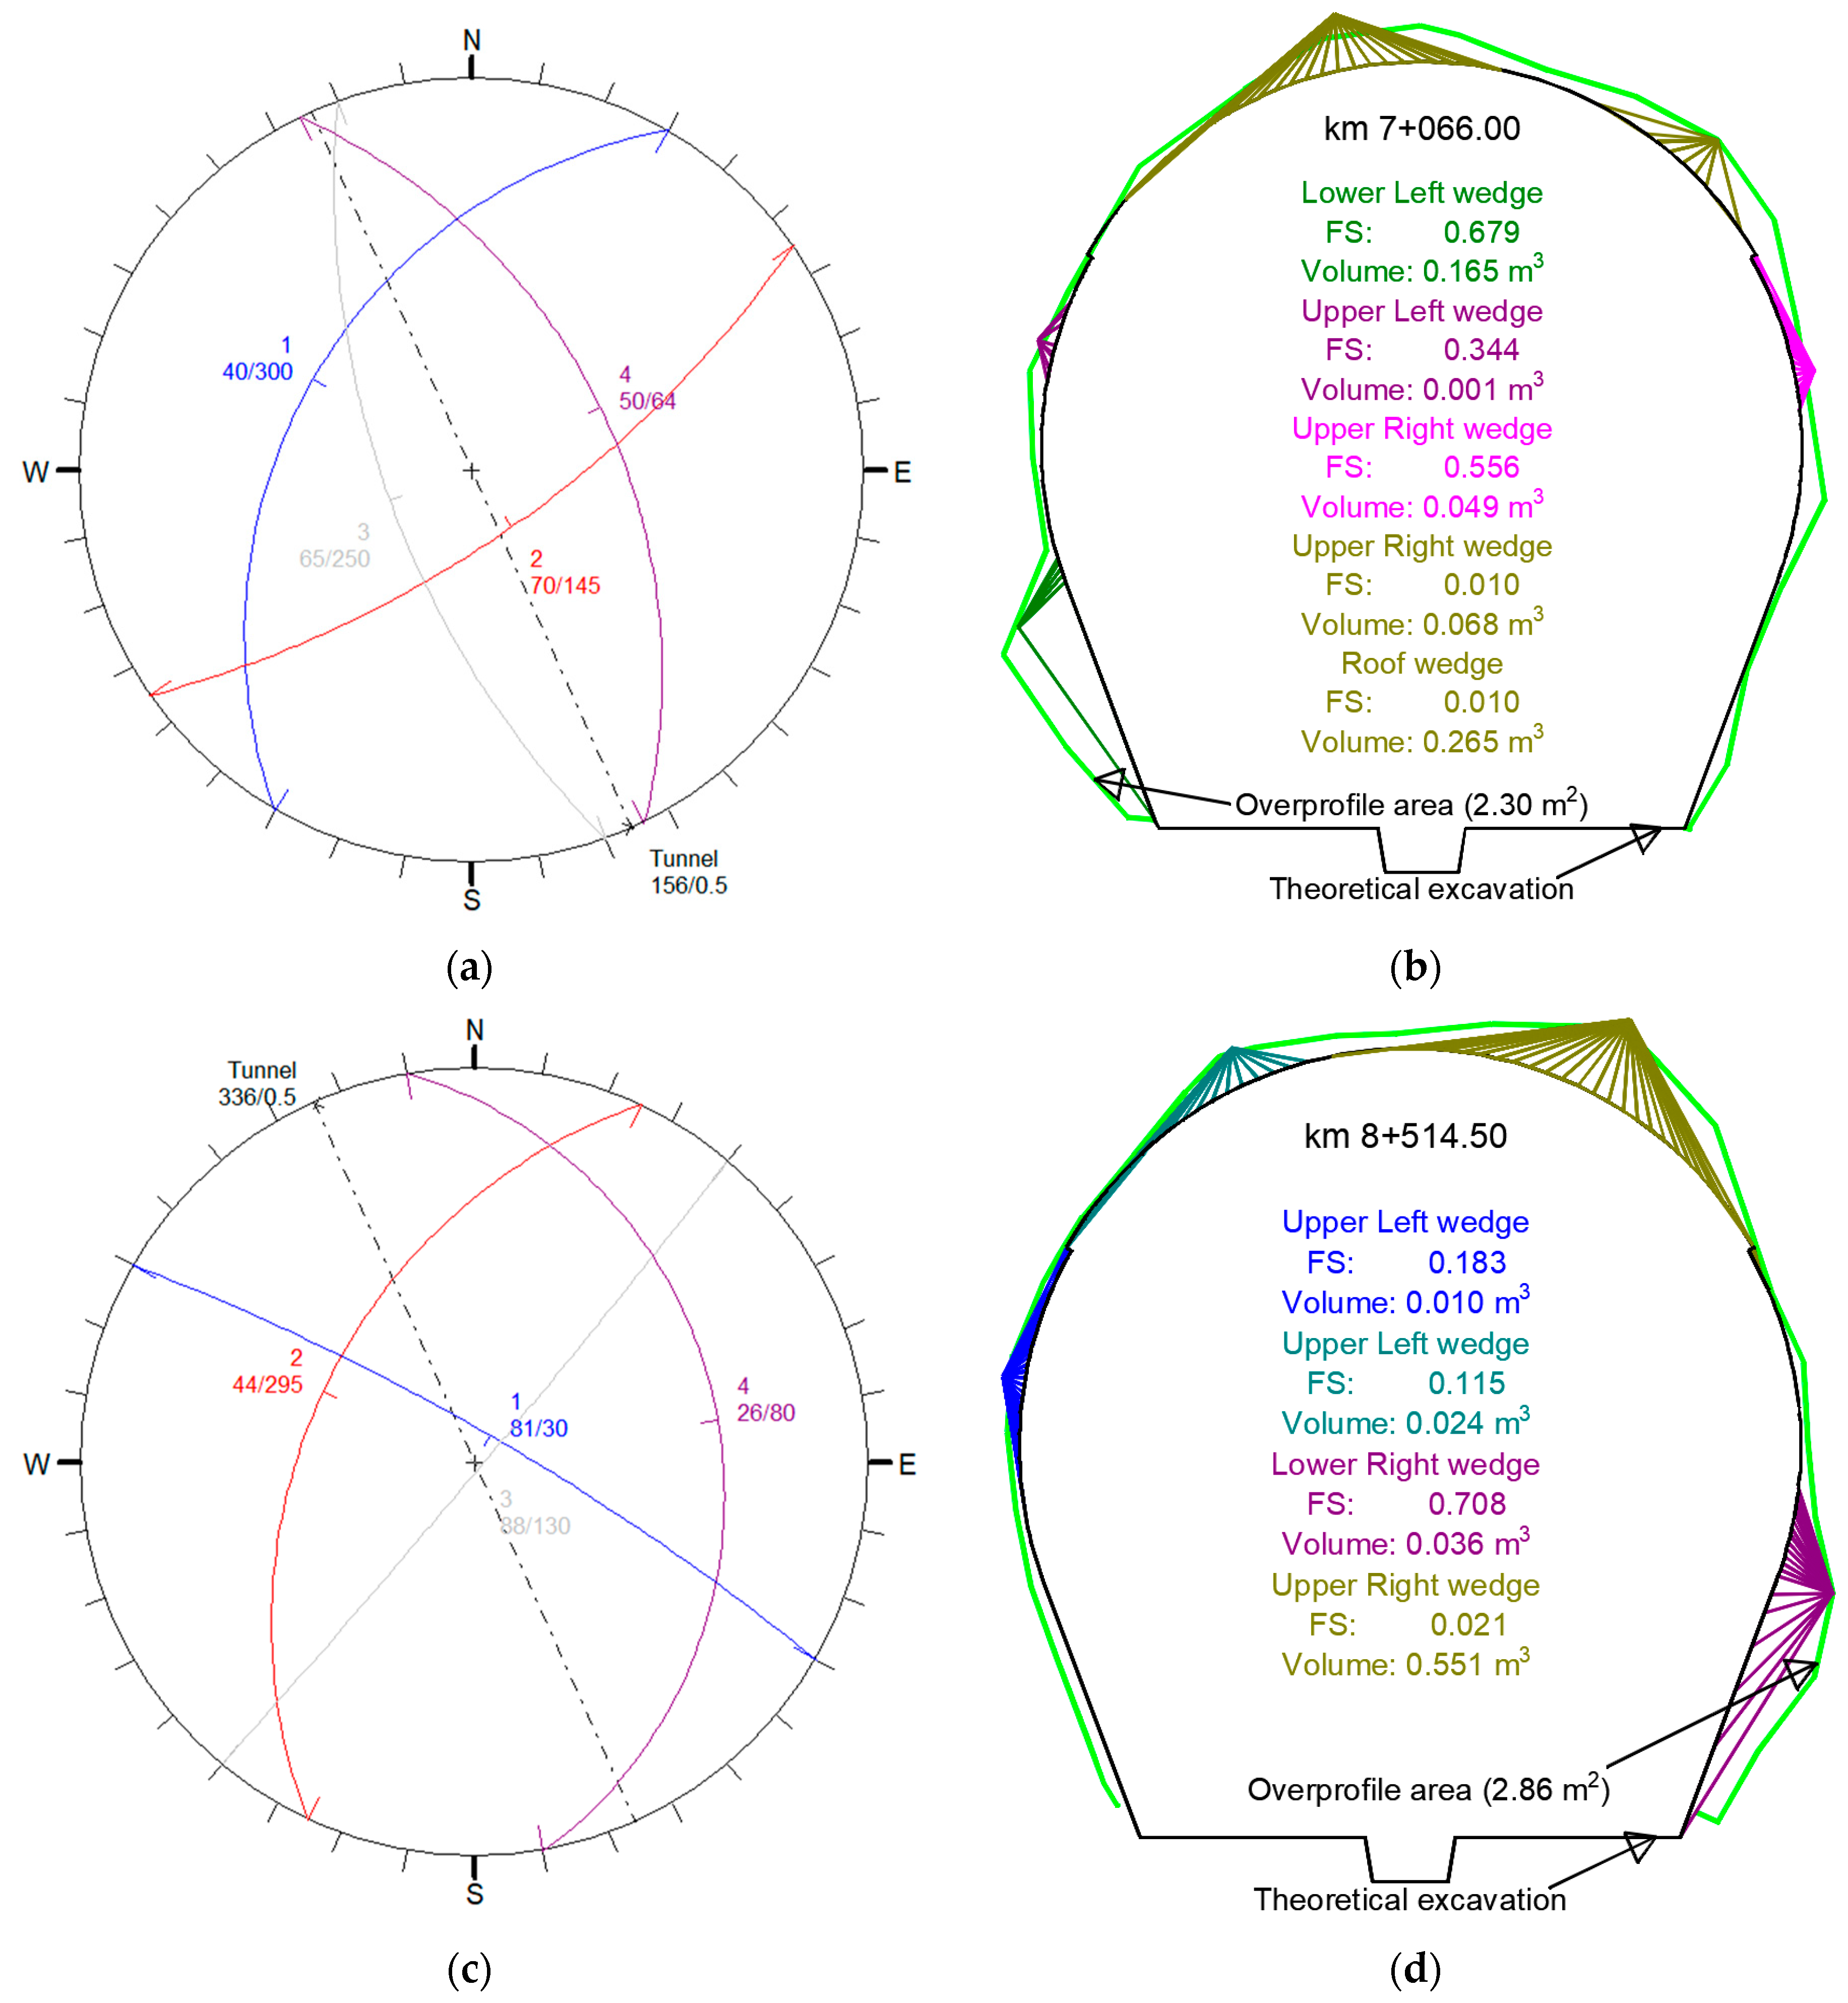
Calculate the stability of the wedges determined around the contour of the unsupported excavation using key block theory.
During the application of this method, the following must be considered. (a) Consider only unstable wedges that fall out immediately after excavation to determine the overbreaks. In the evaluation process, the length of the unsupported excavation corresponds to a single step of tunnel drive length. (b) Perform wedge stability calculations considering the full length of the tunnel for randomly chosen sections. Sections in which significant overbreaks occurred that were geodetically mapped (data on shape, position, and volume are assumed to be available) should be specifically checked to compare the difference between front and back analyses. (c) Repeat this procedure for several iterations until good agreement is achieved between calculated and observed overbreaks along the full length of the tunnel.

2.2.2. Probabilistic Method

The limitations of the deterministic method explained above are reflected in the fact that it does not consider the uncertainty of the input parameters. For a long tunnel and a large amount of processed data, it is necessary to address this limitation. With the aim of better quantifying overbreaks, the probabilistic approach is introduced to calculate the probability of wedge failure and quantify the associated risk. In the probabilistic method, instead of using one (deterministic) value for each parameter, a probability distribution is used to describe the range of possible parameter values and the probability of their occurrence. Phoon et al. [21] stated that the selection of probability distributions is site- and parameter-specific, and that there is no universally “best” distribution of ground properties. Considering the central limit theorem for sample variance, we can assume that as the sample size gets larger (e.g., >30), the distribution of sampling means approaches a normal distribution. Given the large number of samples in this study (i.e., thousands), a normal distribution of random variables was considered throughout.
Instability of the contour of underground excavation is defined using the probability of failure variable, Pf. The probabilistic method comprises the following steps:
(1)
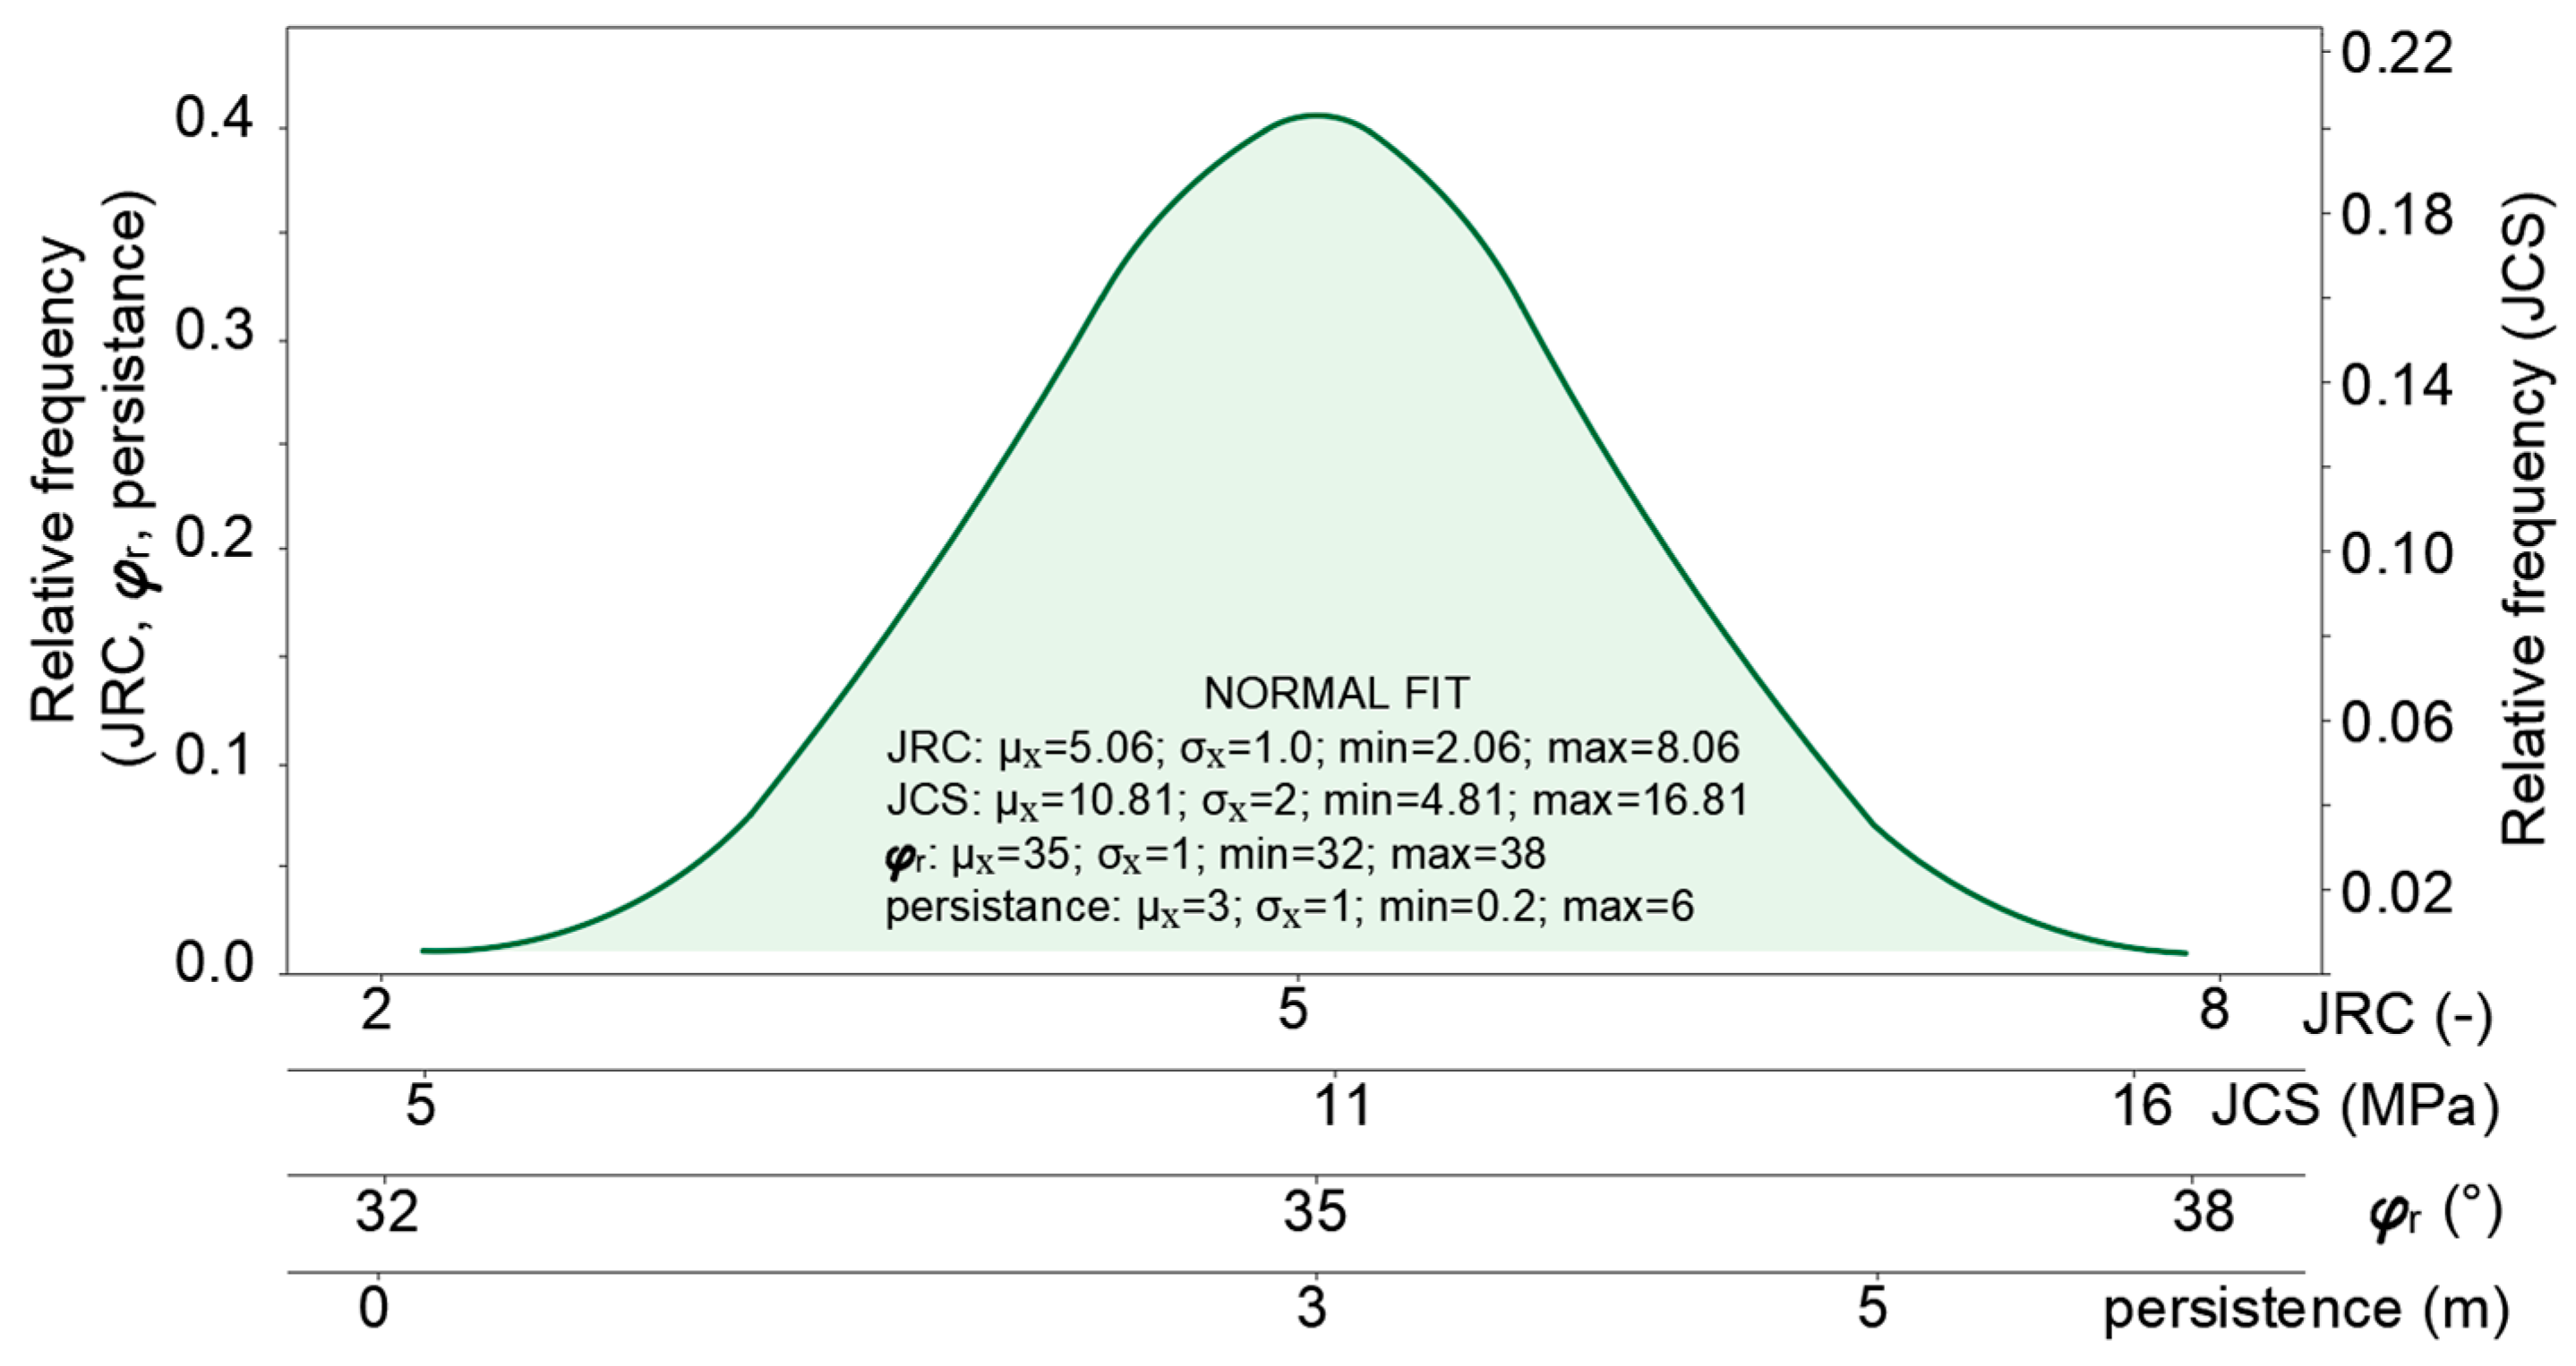
Identify the input parameters, which are treated as random variables with a normal probability distribution function (PDF);
(2)
Apply a probabilistic method to obtain appropriate PDFs and statistical parameters of the limit state function (factor of safety);
(3)
Evaluate the probability of failure (Pf) based on the results of the analysis in step 2.
After defining the random variables and their distributions, the sampling method is used to determine how the statistical input distributions for the random variables will be evaluated [22,23]. For a large number of samples, Monte Carlo simulation is appropriate, by which up to 10,000 samples can be generated for each analysis. By successive execution of Monte Carlo (MC) simulations, the safety factor is obtained for each trial. Finally, the probability density function and the probability distribution of the safety factor (FoS) are calculated to determine the probability of failure (Pf). In other words, based on the known PDF of the variables, it is possible to determine the probability that the calculated safety factor for wedge failure will be lower than a given value, which in our case is FoS ≤ 1.0.
The probability of failure in the analysis of contour instability of tunnel excavation is defined as the ratio of the number of iterations in which the value of the safety factor is less than one and the total number of iterations. This can be represented by the following equation:
P f = Number   of   unstable   wedges   ( where   FoS   <   1 ) Total   number   of   analysed   wedges   ( number   of   all   iterations )
Finally, it is necessary to evaluate the range of failure probability associated with a particular event, which, in our case, is the occurrence of overbreaks. Depending on the geotechnical and/or mining engineering application, the admissible failure probability value can have a considerable range (e.g., [24,25]). When evaluating overbreaks, the question is reversed, so that the values of the probability of failure (0 < Pf < 1.0) and the probabilistic safety factor around the contour of the excavation (minimum values) were obtained as output data. Although the interpretation of the deterministic analysis is more than clear, with FoS < 1.0 indicating failure, for the probabilistic analysis, Pf > 0.07 (upper limit of 7%) is regarded as a critical probability [26], which should be understood as a more than 7% chance of instantaneous wedge failure around the contour of the unsupported excavation.
In the synthesis of deterministic and probabilistic methods, the so-called criterion of stability is defined. According to the criterion, the stability of a certain segment of the contour of the tunnel excavation is assured only if the probability of failure Pf is <7% and the critical FoS is >1.0. With any other combination of these two parameters, part of the excavation contour will be considered to be unstable, which means that geological overbreaks will inevitably occur.

2.3. Quantification Overbreak Analysis

Synthesising the deterministic and probabilistic methods enables evaluation of the high possibility of overbreaks along the analysed tunnel section. Although the probabilistic approach defines the degree of probability, the deterministic approach allows us to accurately locate the position and dimensions of unstable wedges. In this respect, a comparison of the volume of unstable wedges and overbreaks, for one excavation step, could indicate which overbreaks were caused by geological conditions (i.e., geological overbreaks), and which were a consequence of the technology, such as blasting (i.e., technological overbreaks). In other words, because both deterministic and probabilistic methods deal with geological input data, the following can be concluded: (a) if they coincide along the tunnel section, the overbreaks are geological; and (b) if they do not coincide along the tunnel section, the overbreaks are technological (e.g., caused by inadequate blasting). As a high probability of occurrence does not necessarily mean accomplishment, there is surely the possibility of overlapping or combined technological and geological overbreaks in certain sections. As will be further explained in the case example, the areas of possible overlap of the two types should be isolated and treated separately using more detailed assessment.
The procedure for quantifying overbreaks should be implemented along the full length of the tunnel, which is somewhat impractical for an exceptionally long tunnel due to the need to perform an extreme number of complicated analyses. In this regard, it is necessary to establish another, broader way to evaluate the quantity of overbreaks and determine their type.
The quantification procedure involves statistical processing of data obtained from the tunnel face-mapping record and is firmly based on the results of deterministic and probabilistic analyses explained above. Statistical analyses are based on the comprehensive application of the RMR classification system, as it is an integral element of block theory as part of the deterministic method. Based on a detailed analysis of the influencing factors and their combinations, a threshold value in terms of volume is determined to separate technological from geological overbreaks. The volume threshold value is then extrapolated along the full length of the tunnel so that the appropriate cumulative quantity of overbreaks can be calculated. The determination of the threshold value is explained in detail in Section 3.3. for the application of the methodology in the presented case example.

3. Applying the Methodology to the Example of Dabar Power Tunnel

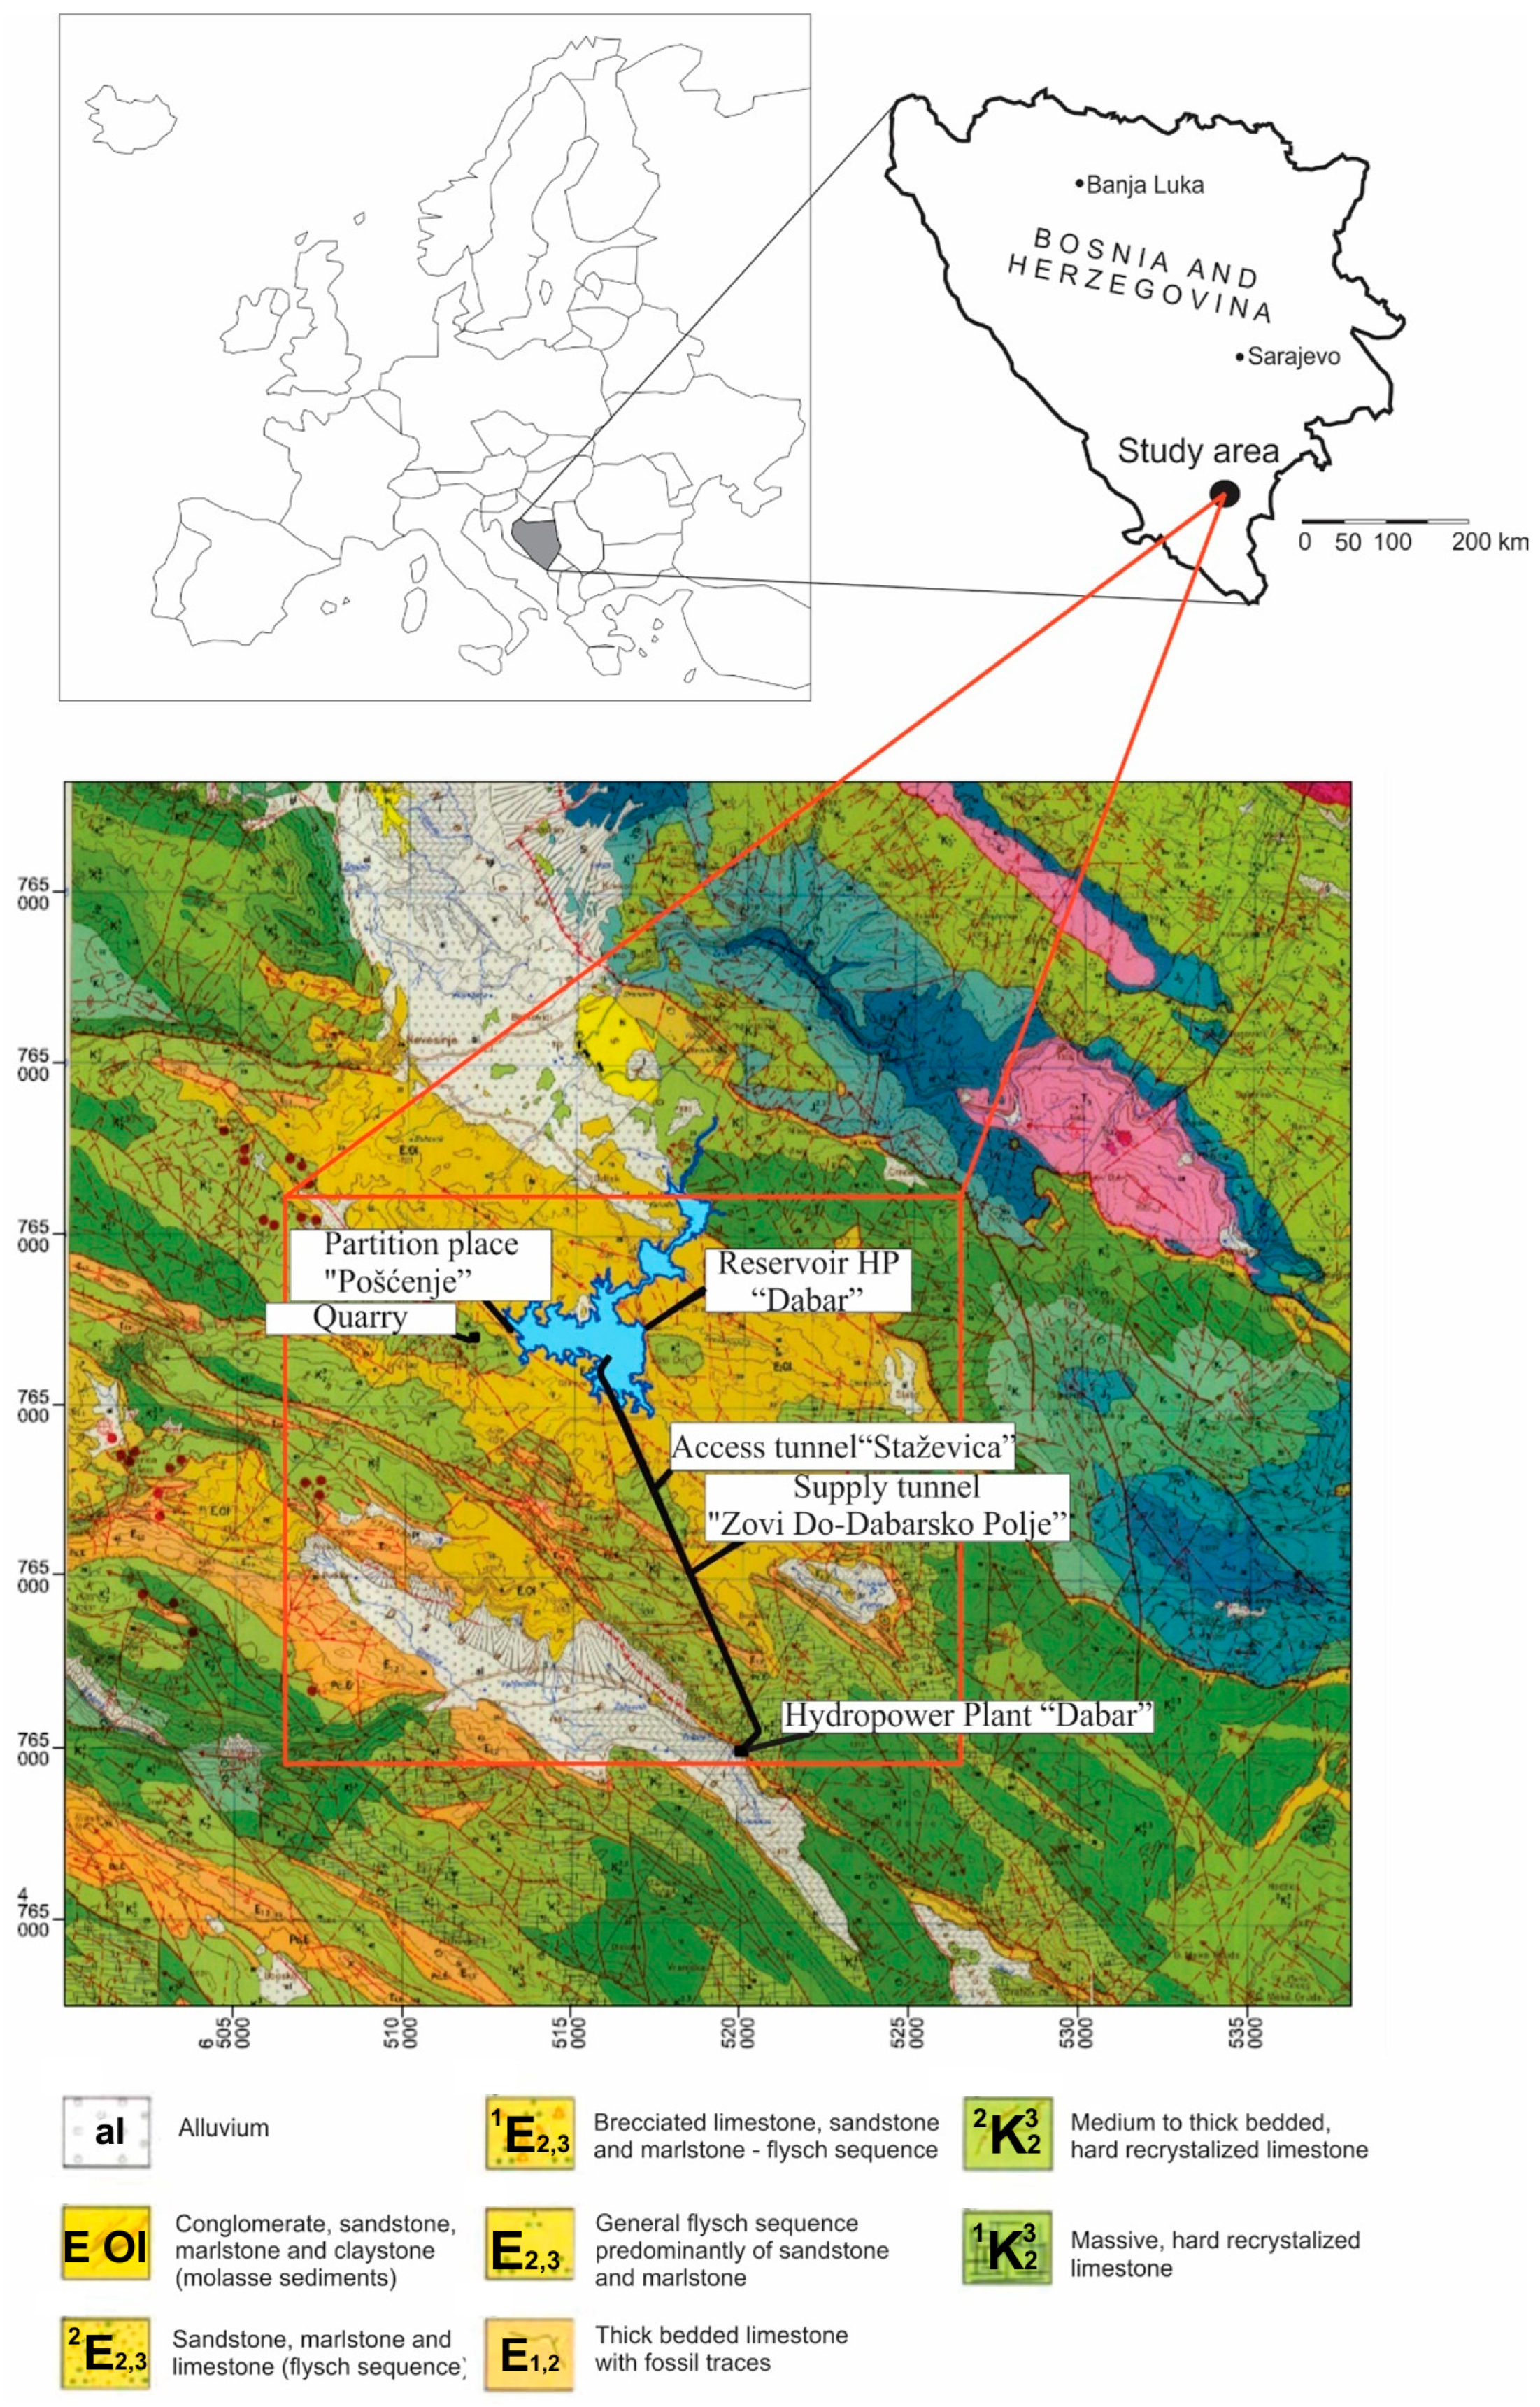
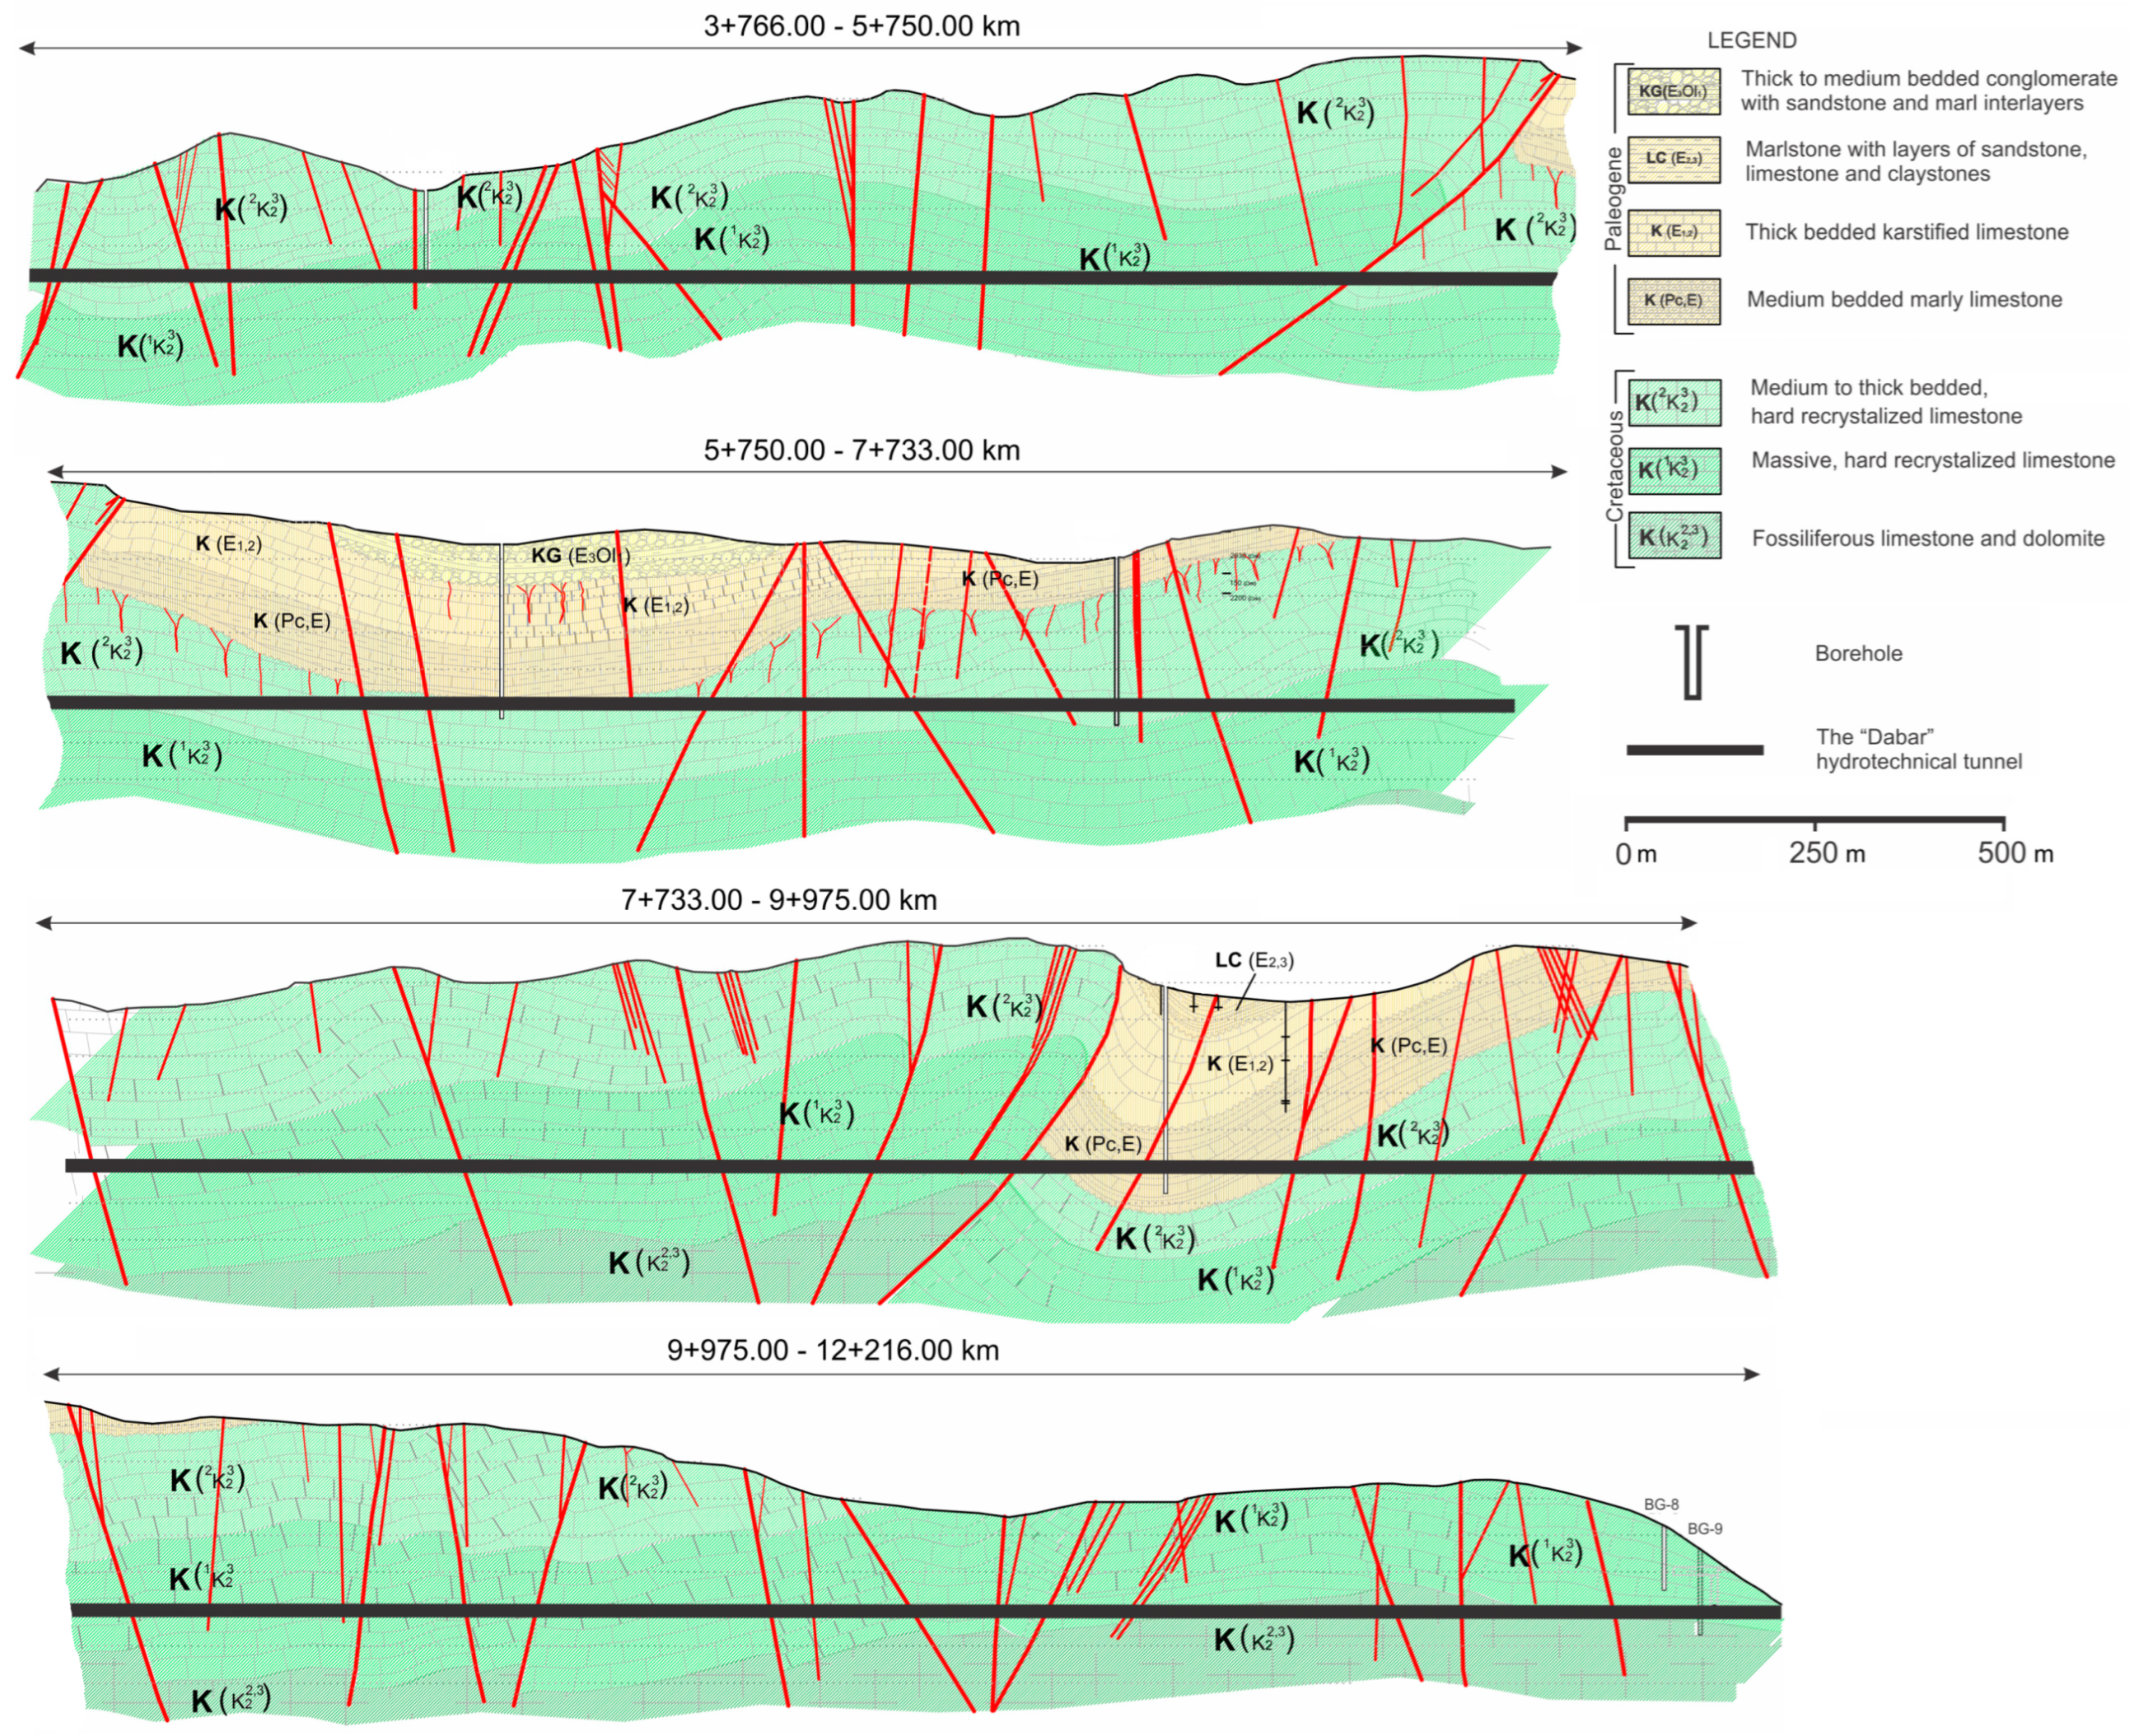
3.1. Geological Setting and Problem Statement

The Dabar hydrotechnical tunnel, which has a total length of 12 km, is located in the south-eastern zone of the Republic of Srpska, in Bosnia and Herzegovina. It is used as a derivation pressure tunnel as part of a hydropower station of the same name, which is one of the power plants in the Trebišnjica River hydroelectric system.
The terrain in the wider zone of the tunnel is a high mountain area with average altitudes between 800 and 1100 m above sea level, featuring prominent mountain massifs, among which are located separated karst fields. The mountains and karst fields have an elongated shape in the direction of the Dinaric extension, northwest to southeast. The karst fields, which gradually descend towards the Adriatic Sea, are divided into four horizons. The degree of karstification of the limestone rock mass differs significantly on the horizons depending on the lithological composition, structure, age, and tectonic and non-tectonic movement at the localities. The locations of Dabar accumulation and Dabar tunnel and the geological map of the area with key information are presented in Figure 2.
Geological investigations of the terrain in the tunnel area were conducted in several phases, starting in 1962. The emphasis was first placed on the regional tectonic complex and hydrogeology of the wider research area. In the later phase preceding the main design, six exploratory boreholes were drilled with a total length of 692 m. Lugeon’s tests were conducted within the boreholes, and piezometers were installed for long-term monitoring of underground water levels between 1985 and 2001. Samples were taken for laboratory testing and sedimentological, petrological, and micropaleontological analyses. In the next phase of project development, a total of 10 exploratory boreholes (950 m in total) were sunk, seven of which were equipped with piezometers. In addition, in three boreholes, pressuremeter tests were conducted in order to determine the deformable properties of the rock mass.
Remote sensing techniques were applied to determine the geological structure in the area of the tunnel on a 1:5000 scale map to locate faults, folds, and instability phenomena, whereas satellite images were used for the analysis of regional faults at a larger scale. A total of 20 samples were taken from an additional single 320 m deep borehole for strength and deformability tests (compressive and tensile strength, moisture content and density, velocity of wave propagation Vp and Vs, and modulus of elasticity of intact samples). Additionally, one research gallery was excavated in which tests were conducted in situ using a hydraulic jack to determine the stiffness parameters of the rock mass in field conditions. The geophysical investigation was conducted to interpolate the measurement results between the boreholes. This contributed to the formation of the geological model along the axis of the tunnel.
Based on the results of all investigations, a geotechnical model of the terrain with 18 geotechnical units was formed; the section in limestone is shown in Figure 3. As seen in the figure, the four geological units, with a total length of some 8.1 km in the layout of the Dabar tunnel, mostly pass through Cretaceous limestone (K23). The remaining 4 km of the tunnel (not shown in Figure 3 due to clarity) passes through molasse sediments, represented by conglomerates, sandstones, marls, and clays of the Eocene–Oligocene age (E3,Ol1). Within the limestone section, the tunnel also passes through Eocene limestone sediments (Pc,E) for a total length of approximately 350 m. This geological unit has different geotechnical properties from the Cretaceous limestone and was not considered in this study.
The initial circular cross-section of the tunnel (5.20 m in diameter) was redesigned to a horseshoe shape, due to a change in the excavation method from tunnel boring machine (TBM) to New Austrian Tunnelling Method (NATM) with the drill-and-blast method used for excavation. The old and new shapes of the tunnel, including the example of the supporting system comprising shotcrete and rock bolts, are shown Figure 4. Depending on the quality of the rock mass, several standard support types were designed, including shotcrete lining, reinforcing mesh as appropriate, and radial anchors.
A tunnel section of about 8.1 km in limestone rock mass from the Cretaceous age (from chainage km 3 + 766.00 to km 12 + 216.00, with the exception of Eocene limestone sediments) played a dominant role in this study (Figure 3). Continuous mapping of the excavation face and occasional control point load and uniaxial strength tests confirmed that the rock mass was relatively uniform over the entire considered length of the tunnel. The mechanical characteristics of this rock can be characterised with the following parameters: uniaxial compressive strength σci within the range of 50 to 100 MPa and geological strength index (GSI) [27] between 50 and 75, which roughly correspond to RMR values within the range of 55 to 80. This hard rock is jointed and predominantly features two to three sets of joints and, rarely, one or two.
A geodetic survey of the convergence movement caused by the excavation was conducted during the excavation of the tunnel together with a geometric survey of the contours. The geodetic survey showed almost no convergence movements (or they were negligibly small), which clearly indicated that the rock mass was globally stable in response to the excavation. However, the formation of over-profiles, and the consequent increased consumption of sprayed concrete, was excessive and hampered the efficiency and progress of the work.
For this reason, early in the project, it was necessary to evaluate the quantity of overbreaks and improve the blasting technique. However, even after the blasting technique was improved and adapted to the characteristics of the rock mass, the high volumes of overbreaks persisted. This required making an objective assessment of the causes of overbreaks and distinguishing which ones could be attributed to geological conditions (geological overbreaks) and which ones to deficiencies in blasting (technological overbreaks). The methodology described in previous sections was developed for this purpose, and its application to the case of Dabar tunnel is presented here.

3.2. Instabilities around the Contour Leading to Overbreaks

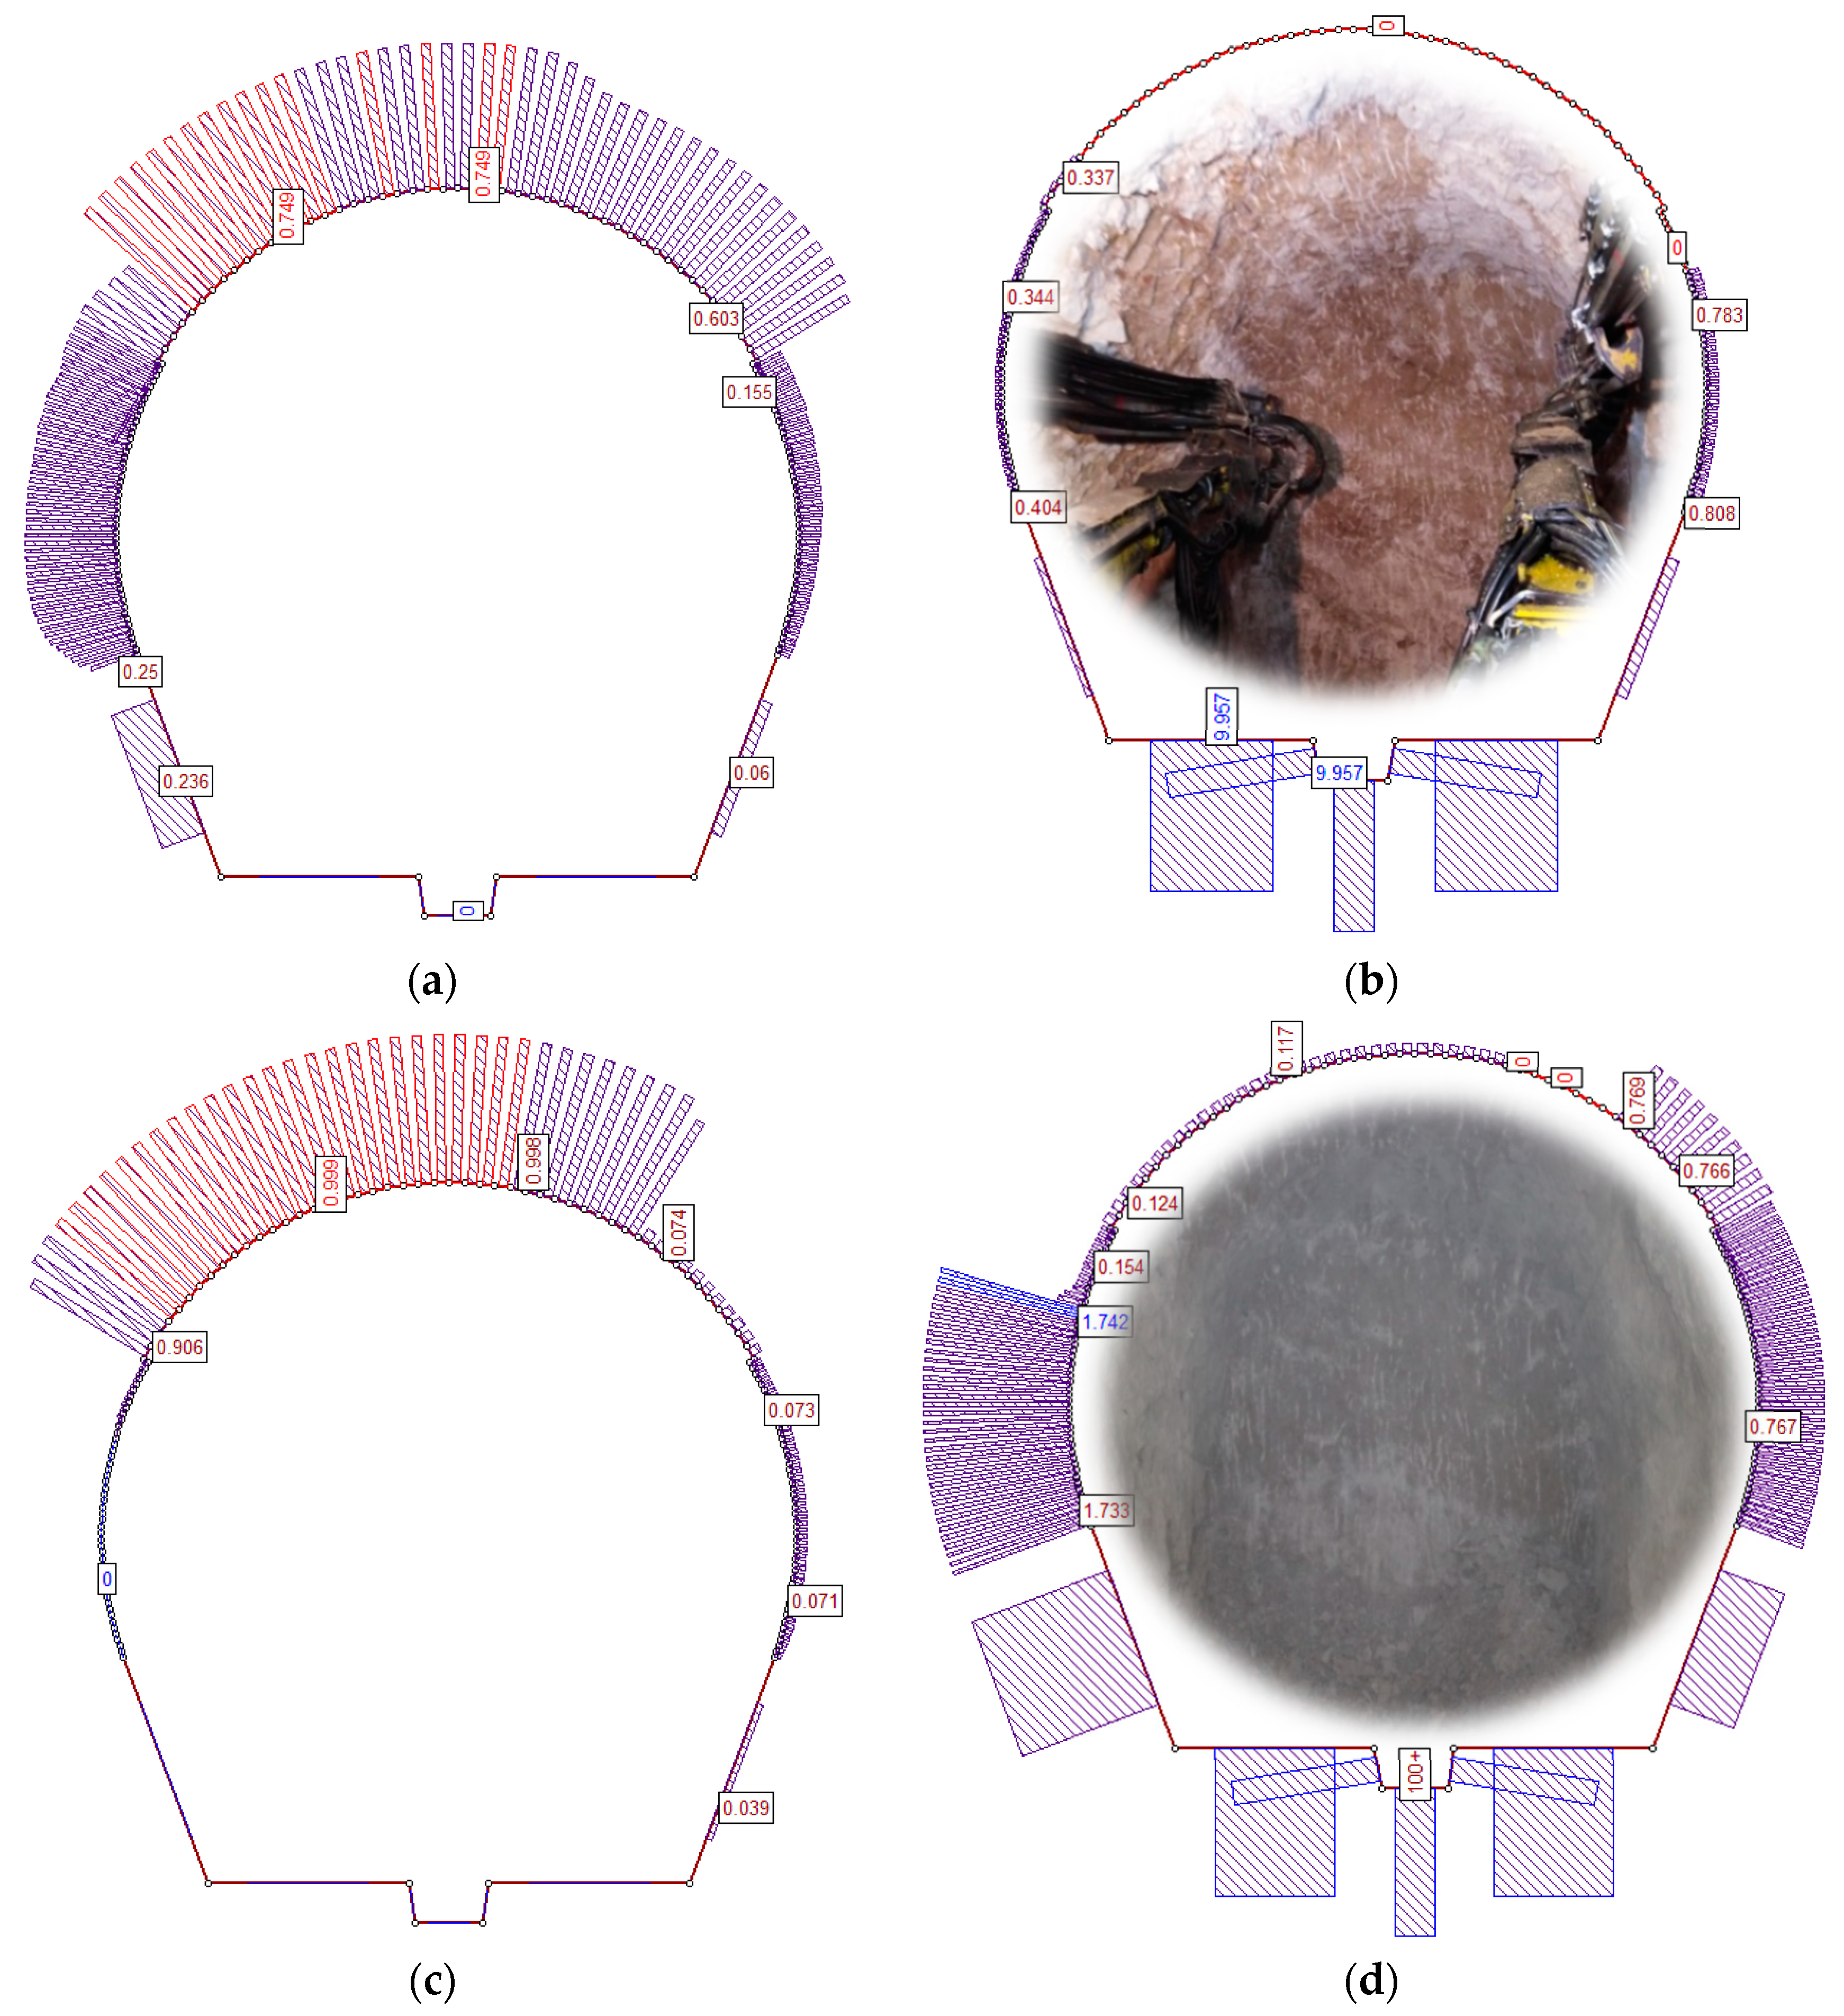
3.2.1. Deterministic Analysis

The results of deterministic evaluation are critically dependent on the shear strength parameters of discontinuities. According to the BB criterion [19] defined by Equations (3) and (4), the main factors affecting the shear strength of discontinuities are friction on the surface, compressive strength, geometry of the surface (roughness), and the presence of filling and/or water pressure.
A total of 10 samples (taken from the gallery) were tested to determine the shear strength along the rock joints. In addition, four samples from outcrops were taken for laboratory shear testing. However, after detailed evaluation, the outcrop data were excluded from further analysis as the rocks were heavily affected by weathering and were regarded as non-representative of the geological conditions in the vicinity of the tunnel.
Laboratory investigations [28] to determine the shear strength along the discontinuities were conducted according to valid standards [29], as well as recommendations of the International Society for Rock Mechanics [30]. Prior to performing the tests, all joints and samples were inspected and characterised as appropriate. Joint compressive strength (JCS) was defined using a Schmidt hammer and Barton’s profilometer to determine the joint roughness coefficient (JRC). Both parameters were used as control parameters in the evaluation of the shear strength envelope according to the BB criterion [19]. The direct shear test device (Hoek’s shear box), which is shown in Figure 5, was used to determine the shear strength along the joints. The original design of the apparatus was adapted to accept samples extracted from drill cores with a diameter of up to 145 mm. The shear box consists of two halves: the upper connected to two rams for reversible shearing action and the lower connected to a ram for normal load application.
The sample preparation, which is also presented in Figure 5, included engineering–geological inspection and evaluation of joints, measuring of the openings, and appropriate cementing in the mould. The shearing plane in all tested samples was placed parallel to the direction of the appliance of the tangential load. After the cement hardened, each sample was subjected to a single shear testing procedure in several steps. First, vertical load was applied, which was maintained as constant for the duration of the shearing, for which tangential load was applied in steps, with interval readings of applied load and displacement. Shearing was continued after peak shear strength was achieved to obtain the value of residual shear strength. The interpretation considered the applied load with respect to the area of the surface of the discontinuity for which shear strength parameters were tested.
On the basis of the test results, the parameters for the BB criterion envelope [31] were evaluated with considerations for the peak shear stress of all tested samples using the RSData software package (Rocscience, Inc., Toronto, ON, Canada). The test results and failure envelope are shown in Figure 6, together with the envelope of shear strength scaled to the natural size of joints at dimensions observed in the tunnel (see Equation (5)).
After the repeatability of the results was established and a detailed inspection of the discontinuities of the samples was conducted, it was concluded that the measured shearing resistance could be regarded as representative of most joints and joint systems in the rock mass. Due to the relatively high homogeneity of the Cretaceous limestone, it was further assumed that this would be valid for a given rock mass and required for the entire tunnel section within the realistic low margin of discrepancy.
The previously described deterministic method based on key block theory was applied to determine the unstable wedges around the contour of the unsupported excavation. Only unstable wedges along the length of the unsupported section, which corresponded to 3 m on average, were considered.
Deterministic stability analyses were conducted on dozens of arbitrarily selected cross-sections with the aim of establishing a general pattern. The typical results of wedge stability analysis at two selected tunnel sections together with the measured contours of the over-profiles are presented in Figure 7. It can be observed that the contours of the unstable wedges and the measured contours of the over-profile excavation are in good agreement. Evidently, the agreement in this respect cannot be exactly due to the limitations of the approximations associated with numerical analysis and the simplification of geological conditions, which are more complex than can be objectively ascertained by descriptive mapping.

3.2.2. Probabilistic Analysis

The range of values of the input parameters for probabilistic analysis, including JRC, JCS, ϕr, persistence, azimuth, and dip angle (Table 1), were defined from the geological mapping and laboratory testing. As previously discussed, a normal distribution function was assumed for all variables.
The value of the standard deviation of individual parameters was estimated to enable a realistic dispersion of the data around the expected (mean) value. The minimum and maximum values of the parameters, which define the limits of the set for the value ± three standard deviations, cover 99.7% of the possible values of a considered parameter. The coefficients of variation of individual parameters indicate that the dispersion of data is relatively small and within the limits found in the literature [32]. The orientation of the discontinuity is defined in such a way that the azimuth is allowed to vary by ±9° and the dip angle by ±3° around the mean value of the corresponding discontinuity. This is a plausible assumption considering the (in)accuracy of measuring the angles while mapping the face of the tunnel excavation, as well as the spatial change of their orientation.
According to Harr [33], coefficients of variation below 10% are considered low, between 15 and 30% are medium high, and above 30% are high. It can be concluded, according to Harr’s criteria, that the values of coefficients of variation of the adopted parameters are low to medium high. This implies that the adopted range of each individual parameter is reasonable given their dispersion around a mean value. The normal distribution functions and characteristic values of each parameter are shown in Figure 8.
As with the application of the deterministic method, the analyses were performed on dozens of arbitrarily selected cross-sections. The typical results are presented in Figure 9 for chainages km 7 + 066.00 and km 8 + 514.50, which are the same ones used in the deterministic analysis. The results of the probabilistic stability analysis shown in Figure 9 are also reproduced in Table 2.
It can be seen that at chainage km 7 + 066.00, the stability criterion is not met around the entire contour of the underground excavation (note that the probability of failure is less than 7% in the lower portion of the right shoulder, and the safety factor criterion is not met). This points to the conclusion that the documented overbreak in this tunnel section is most likely the result of the fallout of smaller blocks of rock mass. At section km 8 + 514.50, the probability of failure is less than 7% in the left shoulder, and the safety factor value is higher than >1.0, which indicates that in this section, the left side of the tunnel excavation is expected to be stable. In both deterministic and probabilistic analyses of this tunnel section, it can be observed that there is almost no overbreak in the area of the left shoulder, which is in good agreement with the results of the geodetic survey. All of this indicates that the input data are well determined for both analyses.
As mentioned earlier, the overbreak quantification, in terms of volume and shape, could be assessed in the deterministic analysis process by performing a calculation in the zone of each excavation face to determine the volume of unstable wedges and comparing it with the volume of measured overbreak excavation along the length of the advancing step. However, in this case, it would be necessary to perform a large number of complex analyses (cca 8100/3 = 2700), which is impractical. Therefore, as discussed before, the quantification of overbreaks was based on an upgrade of the methodology by performing statistical analysis of a large amount of available data on the mapping of the face of the tunnel excavation.

3.3. Quantitative Analysis

3.3.1. Input Data

Whereas overbreak quantities could be determined using deterministic analysis along the entire length of the tunnel, it was not plausible from a practical point of view to perform an extreme number of complicated analyses to achieve a quantitative evaluation. As discussed before, a more comprehensive method of utilising geological mapping and considering RMR parameters was needed in order to quantify overbreaks and determine their causes. Factors that are considered to quantify overbreaks and separate the technological from geological types are (a) rock mass quality (RMR value), (b) discontinuity orientation, and (c) number of joint sets. These parameters were analysed within each mapped face of the excavation, totalling 1601 analyses.
The RMR classification was used to evaluate tunnel sections in which the occurrence of overbreak excavation was a consequence of unfavourable geological conditions. According to the RMR classification, very favourable and favourable orientations of discontinuities relative to the tunnel excavation are scored with 0 and −2 points. Unfavourable and very unfavourable orientations are scored with −5, −10, and −12 points, depending on the severity of consequences for the excavation. These criteria were comprehensively used in order to distinguish probable and not probable wedge instability. In addition, the number of joint sets was evaluated for each section. This is a critical parameter in key block theory, as unstable wedges can form only if there are three or more sets exposed on the surface of the excavation.
The statistical processing of all acquired data (geodetic survey, results of geological mapping, and RMR characterisation) was conducted in order to evaluate mutual dependencies, which enables distinguishing between the two overbreak types. As will be shown below, the results of the statistical analyses were used to establish a criterion for calculating the amount of technological overbreaks.

3.3.2. Statistical Analysis
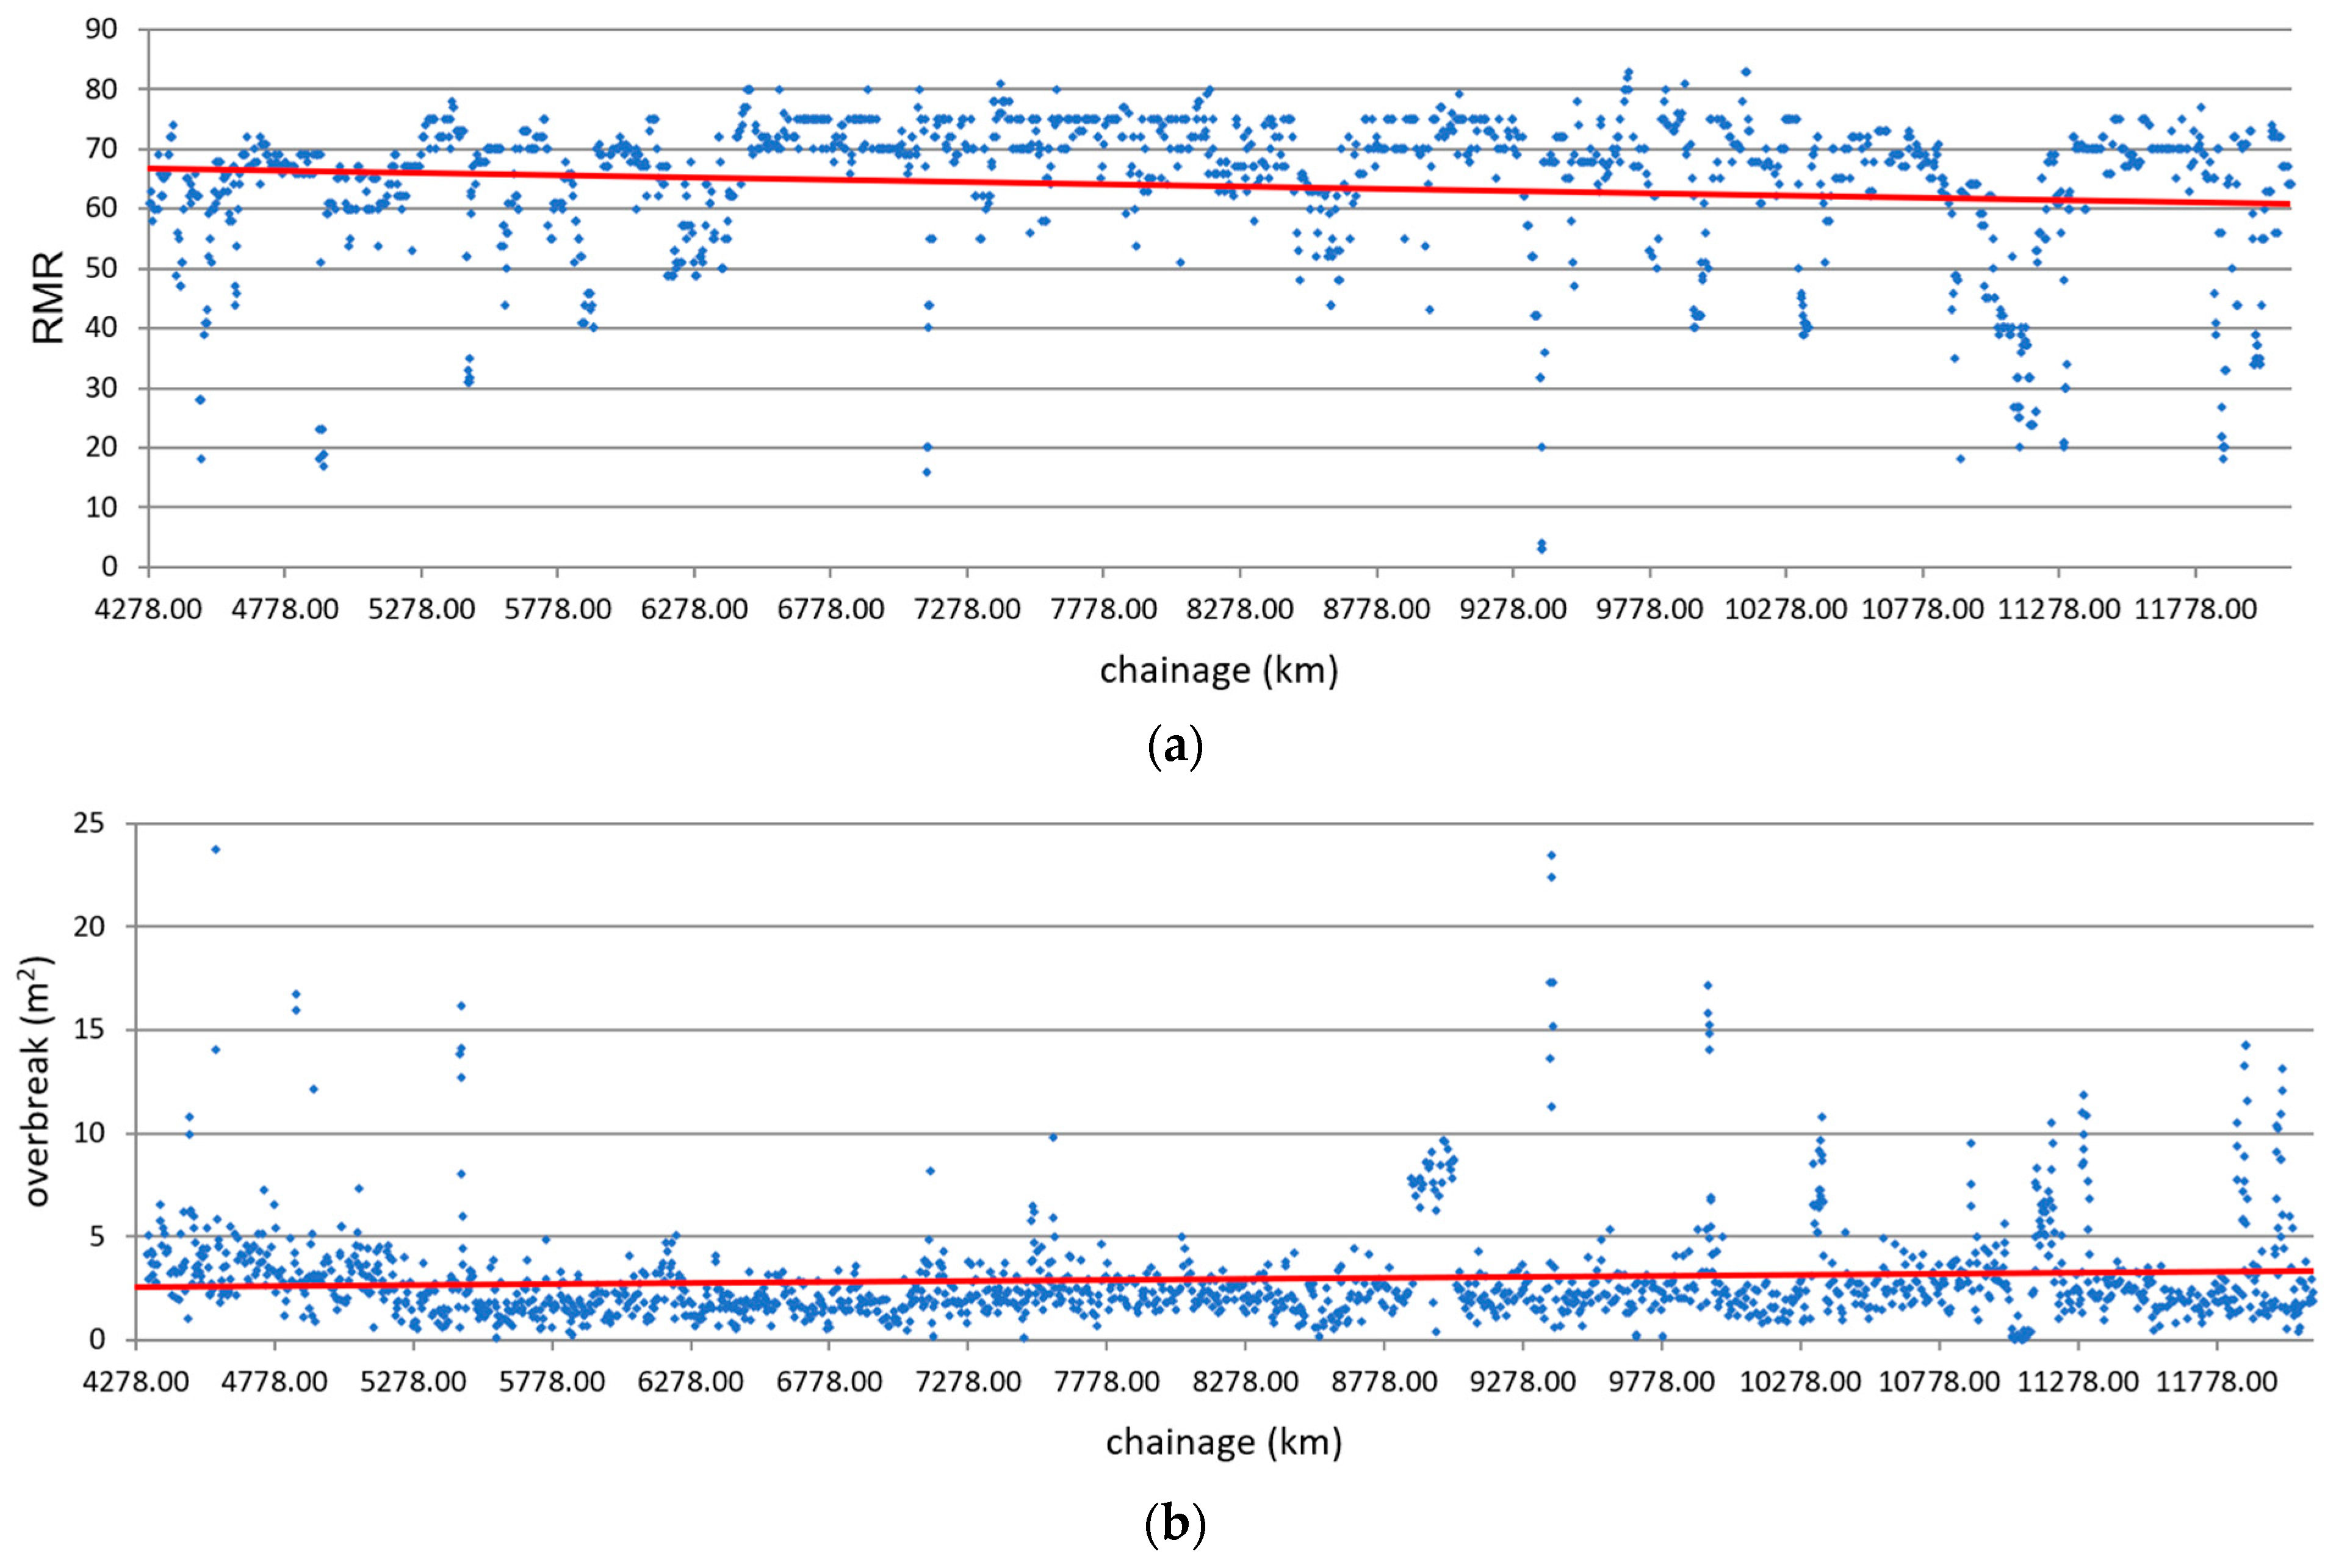
A total of 1601 pieces of data on the analysed length of the tunnel were processed, so that the corresponding dependencies between all relevant parameters could be assessed. Figure 10a shows the variation in RMR along the analysed section of the tunnel. It can be seen that the largest proportion of RMR scores falls in the range of 60 to 80. The general trend of RMR values, indicated by a straight line showing the average values (red line in Figure 10a), is a slight decrease, but they are always between 60 and 70. Figure 10b shows the overbreaks in square meters (per meter of tunnel length) along the analysed tunnel sections. It can be seen that the majority of overbreaks are within the range of 0–5.0 m2, with an average size of 2.5 m2.
Figure 11a shows the dependence of overbreak excavation on RMR values for all analysed data. It can be seen from the figure that with increased RMR value, the overbreak area decreases, which is the expected general trend.
Figure 11b shows the dependence of overbreak excavation on RMR values for data in which geological overbreaks undoubtedly occurred and were duly mapped and geodetically surveyed in detail. The decrease in overbreaks with increased RMR shown in Figure 11 can be represented by a logarithmic function (evaluated using the linear least squares regression tool in MS Excel). The logarithmic function has an advantage over other functions (e.g., linear or exponential) due to the highest obtained value of determination coefficient (R2). Even though the indicative correlation between the two variables can be considered relatively low (R2 = 0.301 for overbreaks overall and R2 = 0.53 for geological overbreaks), it is assumed to be in fair agreement considering the similarity in shape of both lines, the complexities related to the geological nature of the problem, and the necessary simplifications introduced during the engineering–geological data collection. A similar trend line, seen in Figure 11a,b, indicates that the majority of overbreaks must have had a geological cause, which is reflected in the direct interconnectedness with RMR values on the two diagrams.
Figure 12 shows histograms of the frequency of overbreaks in the analysed section of the tunnel comprising the following intervals: 0–2.5, 2.5–5.0, 5.0–7.5, 7.5–10.0, 10.0–12.5, 12.5–15.0, 15.0–17.5, 17.5–20.0, 20.0–22.5, and 22.5–25.0 m2. It can be seen from Figure 12a that the highest frequency of occurrence of overbreaks is within the interval of 0–2.5 m2 (910 out of 1601 pieces of analysed data), followed by the frequency of occurrence of overbreaks within the range of 2.5–5.0 m2 (518 out of 1601 pieces of data). Figure 12b shows a histogram (for the same interval ranges as in Figure 12a) for 72 recorded geological overbreaks. Here, the largest number of overbreaks is in the interval of 2.5–5.0 m2, followed by 0–2.5 m2.
The main findings and the interpretation of the statistical analysis can be summarised as follows:
(a)
Generally, from Figure 10a, it can be concluded that the geology is predominantly uniform, without significant deviations in the quality of the rock mass. Along the analysed tunnel section, the RMR value is in the range of 60 to 80, with an average of 65.
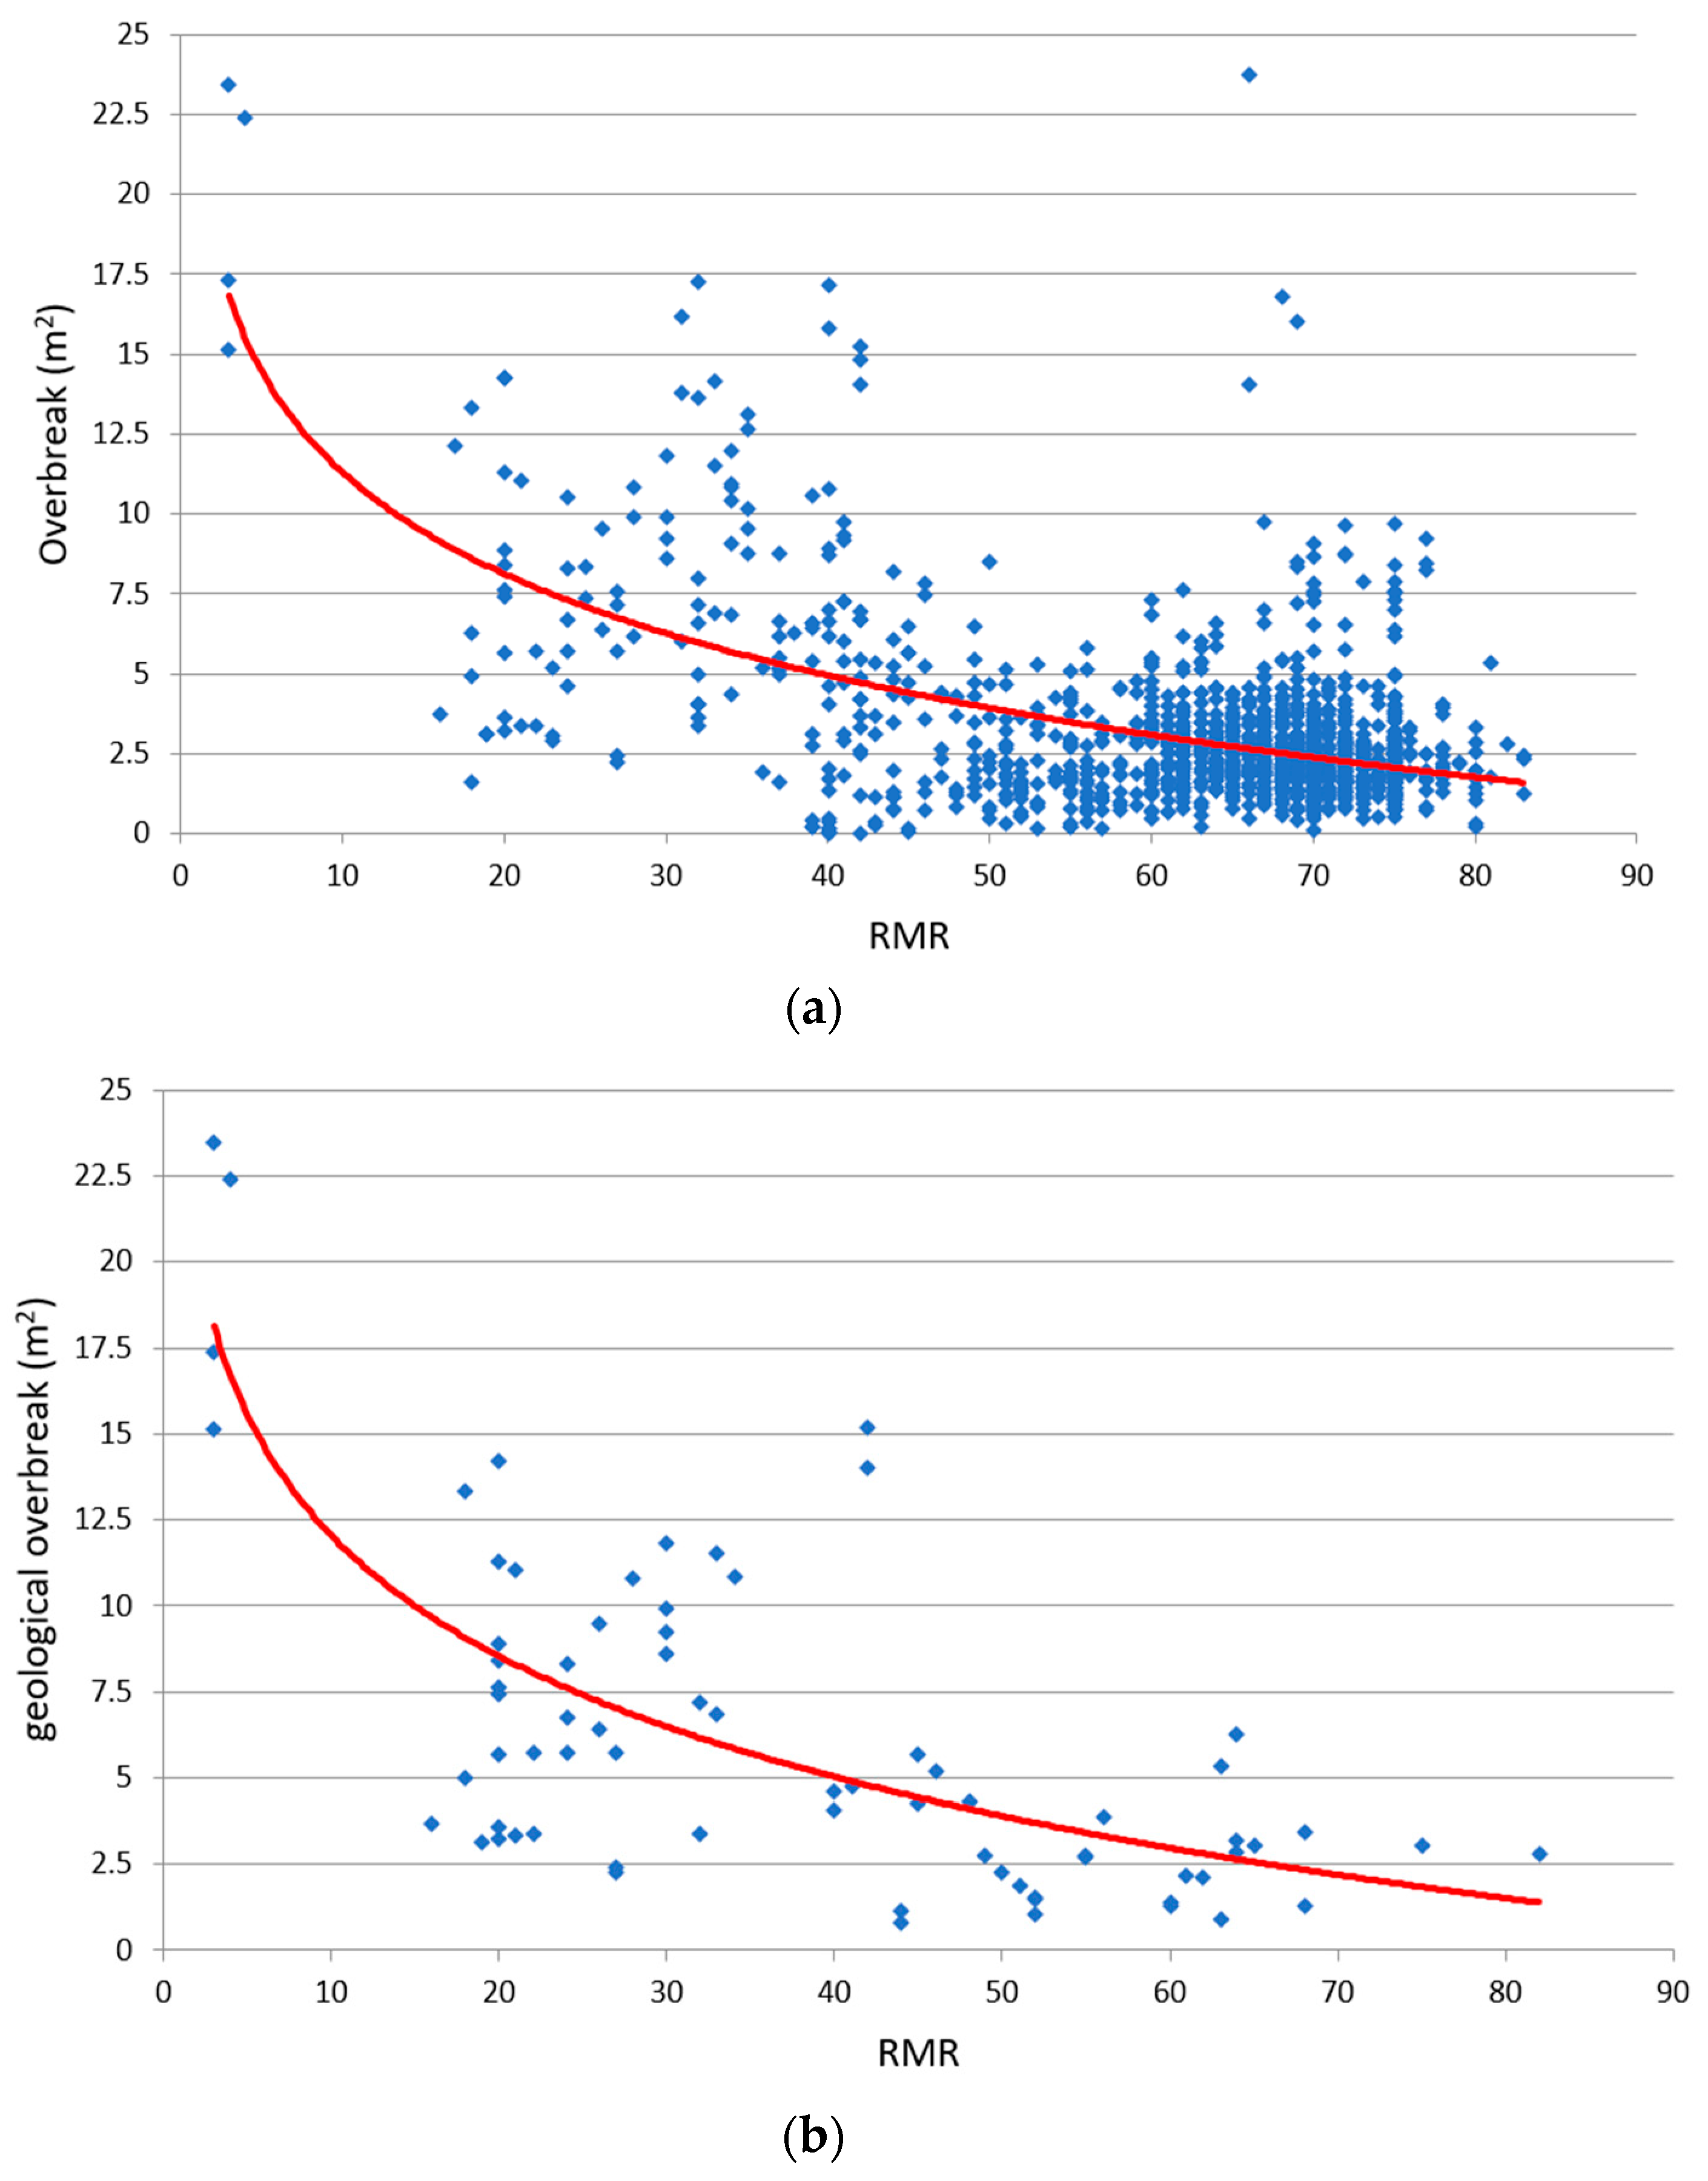
(b)
The largest proportion of overbreaks per meter length falls in the range of 0–5.0 m2 (Figure 11a).
(c)
Undoubtedly, the geological overbreaks that were geodetically surveyed in detail have the same general decreasing trend with increasing RMR value as the overbreaks in general (Figure 11a,b). This leads to the conclusion that the majority of overbreaks must have been a consequence of unfavourable geological conditions. It can also be concluded from Figure 11b that geological overbreaks are regularly recorded for high RMR values (RMR > 60), for which they fall in the range of 0–2.5 m2.
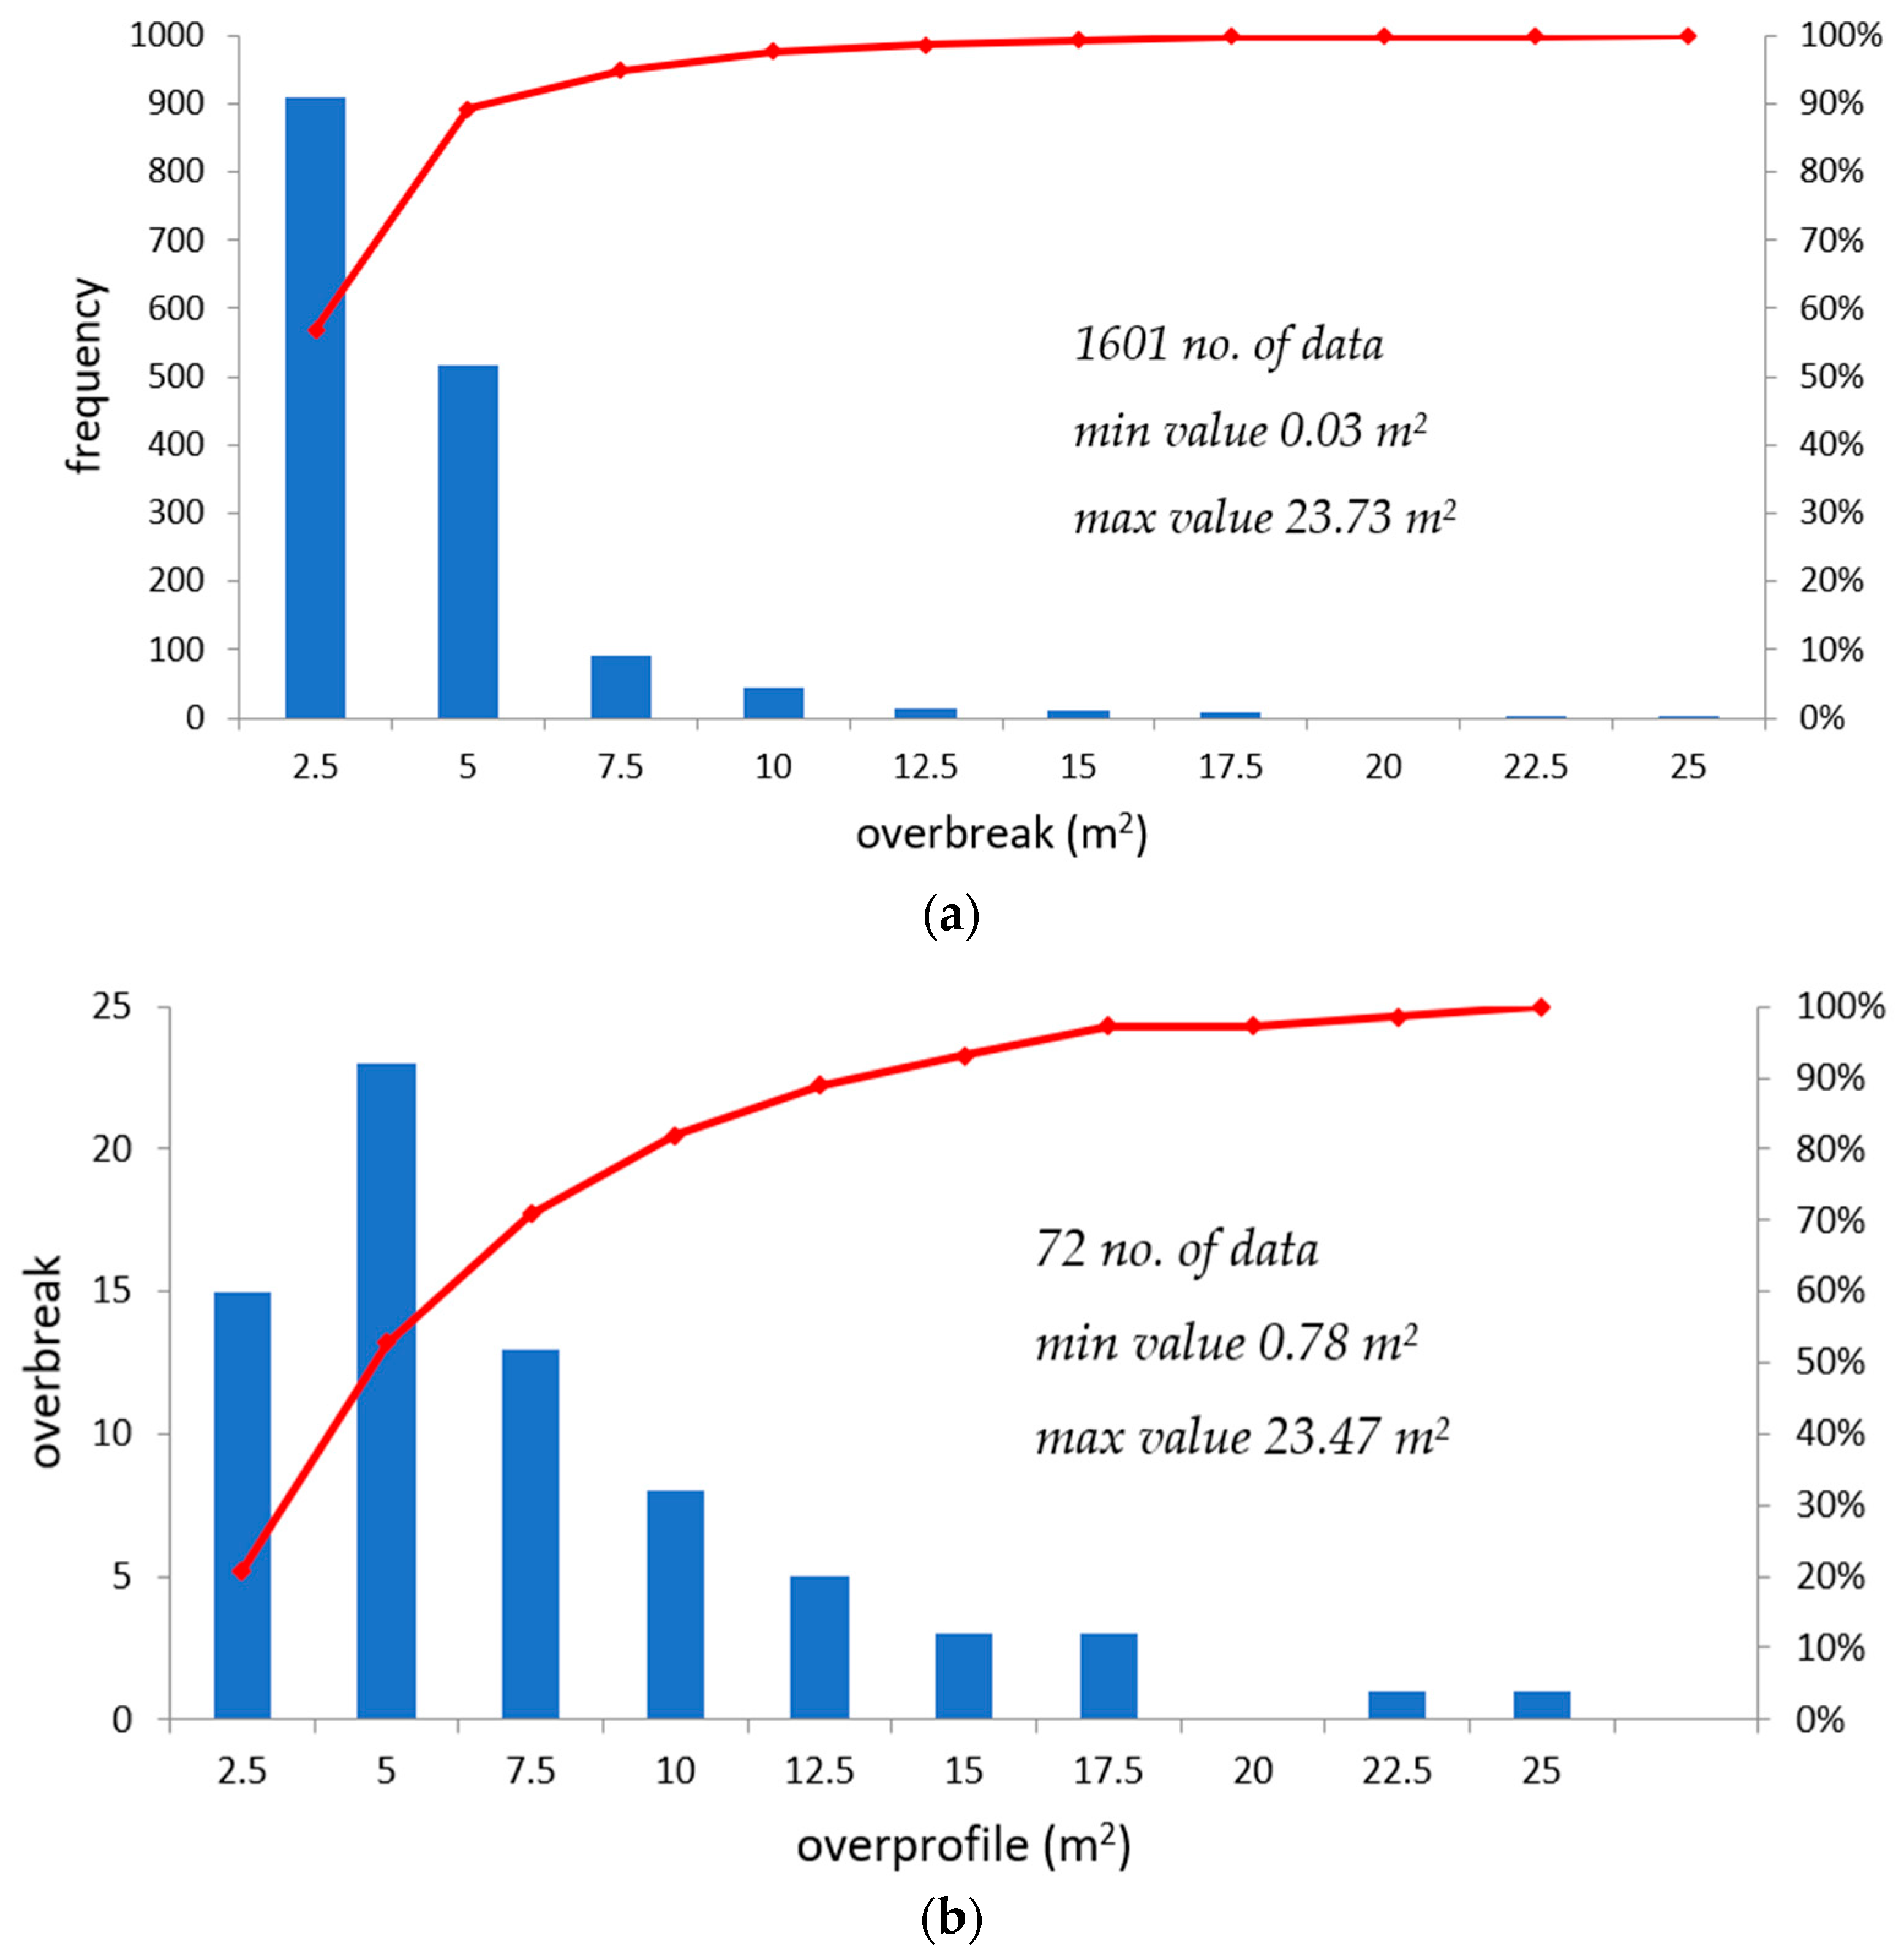
(d)
From the histogram shown in Figure 12a, it can be concluded that the frequency of occurrence of overbreaks in the range of 0 to 5.0 m2 accounts for the largest proportion, and it constitutes almost 90% of the analysed data (among which, 0–2.5 m2 constitutes 56% of the total data). In the case of registered geological overbreaks (Figure 12b), overbreaks of 0–5.0 m2 make up 52% of the measured data.
The interpretation of the statistical analysis clearly indicates that any overbreak larger than 2.5 m2 can be treated as geological and occurs in the condition in which the benchmark RMR value is below 60. Consequently, overbreaks smaller than 2.5 m2 must be analysed in more detail in order to distinguish between technological and geological overbreaks.

3.3.3. Derivation of Threshold Values in Terms of Overbreak Volume

The key criterion to distinguish the type of overbreak is that a favourable orientation of the discontinuity combined with a high quality of rock mass cannot lead to a geological overbreak. In that case, the overbreak would be characterised as technological.
In the next step, all mapped sections with RMR values greater than 60 were divided into two categories: those with a favourable orientation of discontinuity (0 and −2 points from the RMR classification) and those with an unfavourable orientation of discontinuity (−5, −10, and −12 points). The locations of all mapped excavation faces with a favourable discontinuity orientation and with one or two sets of joints were isolated. In these sections, due to the favourable orientation of discontinuities, the occurrence of overbreaks was characterised as technological, with an average volume of 1.60 m2. This was considered the threshold value to distinguish between technological and geological overbreaks for RMR values greater than 60. This means that for all cases with RMR > 60 and overbreaks ≤1.60 m2, the cause is of a technological nature, as indicated in Table 3.
Based on the established threshold values (2.5 m2 and above for geological overbreaks and 1.6 m2 and below for technological overbreaks), the total volume of over-profile excavation can be calculated for the length of the unsupported tunnel excavation, which in our case was 3.0 m. In sections in which the measured overbreaks were greater than 1.60 m2 and less than 2.5 m2, a detailed inspection of geodetic measurements was conducted. The trends generally showed that even in the wider area encompassing neighbouring sections, at a length of approximately 3 m, the overbreak excavation was always greater than 1.60 m2, which implied the geological type of overbreak for most cases.
In sections in which the measured overbreaks were less than 1.60 m2, a detailed inspection of geodetic measurements was conducted to calculate the overbreak volume along the 3 m length (if the overbreak excavation was slightly larger than 1.60 m2 at any station in the previous 3 m, it was given a value of 1.60 m2).
The total volume (m3) of technological overbreaks was obtained as an integral of the volume attributed to technological causes along the tunnel layout. In certain cases, in which there was a mismatch between the location of geodetic surveying and geological mapping, some adjustment and extrapolation of the data were necessary. However, given the statistical nature of the analysis, the inaccuracies which were noted were regarded as negligible for the final estimate.
The calculated areas of overbreaks per meter length of the tunnel for different threshold values (below 1.6 m2, between 1.6 and 2.5 m2, and above 2.5 m2) are presented in Table 4. The calculated volume of technological overbreaks, according to the previously defined procedure, is also presented in Table 4. The volume of geological overbreaks was calculated by subtracting the volume of technological overbreaks from the total volume of overbreaks.

4. Summary and Conclusions

The research presented in this paper was motivated by the lack of a methodology to determine the probability of overbreaks, which inevitably occur during drill-and-blast excavation in hard rock, and to quantify them. Overbreaks of up to several hundred meters regularly occur in hard rock tunnelling in low-confinement conditions and can severely undermine tunnel construction. Evaluating the causes of occurrence and quantifying overbreaks should be conducted as a valuable engineering practise during tunnel construction to optimise the excavation and avoid significant financial and time losses.
The occurrence of overbreaks is typically attributed to poor drill-and-blast technology, which is inappropriately applied in given rock conditions. In mining engineering, the focus on drill-and-blast efficiency is related to good fragmentation, and overbreaks are of less interest because there is typically no need to install secondary lining. In civil engineering, this problem is reversed: even with completely adequate drill-and-blast technology, superfluous overbreaks can occur, significantly increasing the consumption of shotcrete for primary lining and cast-in-place concrete for secondary lining.
Inevitable geological overbreaks are dictated by geological conditions, which are defined by the state of hard rock mass discontinuities, that is: (a) the spatial layout of sets of discontinuities relative to the direction of advancing tunnel and the shape of the tunnel contour and (b) the shear strength along the surface of discontinuities. Along elongated tunnels, the problem must be regarded as not only deterministic but also stochastic due to large quantities of relevant data coming from the natural environment. For this reason, the proposed methodology has two components: (a) deterministic evaluation of the typical types of overbreaks and their quantification and (b) probabilistic analysis to extrapolate the probability of failure established by the deterministic method along the tunnel route. The methodology works as a synergetic combination of deterministic and probabilistic components so that inevitable overbreaks can be quantified using statistical analysis, including an evaluation of the threshold value to distinguish between geological and technological causes (e.g., inadequate use of drill-and-blast technology).
The application of the methodology, demonstrated on the example of an 8.1 km long tunnel section in hard rock, led to the following conclusions:
  • Using deterministic evaluation, the position and size of unstable wedges (for a safety factor of less than 1.0) was adequately defined. This analysis showed that the positions and sizes of the considered wedges were in good agreement with the contours of the geodetic measured overbreaks in analysed sections.
  • Probabilistic analysis was conducted in the same sections as the deterministic evaluation, and the results showed that the probability of failure is high and often exceeds 90%.
  • Based on the combination of deterministic and probabilistic analysis results, the “stability” criterion was defined: a wedge is stable if the safety factor is greater than 1.0 and probability of failure is less than 7%. Based on this criterion, it was possible to distinguish stable from unstable parts of an unsupported tunnel excavation along the tunnel route.
  • The analyses confirmed that the main cause of overbreaks was of a geological nature, i.e., unfavourable orientation of discontinuities and relatively low values of the shear strength parameters at relevant joints.
  • The findings of the deterministic evaluation and probability analysis enabled a quantification of overbreaks using statistical analysis considering the large amount of data obtained for each mapped face: (a) rock mass quality (RMR value), (b) spatial discontinuity orientation, and (c) number of joint sets.
  • The interpretation of significant trends of the statistical analysis led to the conclusion that any overbreak larger than 2.5 m2 can be treated as geological, whereas overbreaks smaller than 2.5 m2 had to be analysed in more detail to determine the interplay between technological and geological overbreaks.
  • The threshold value of 1.6 m2 for technological overbreaks was statistically determined if the favourable orientation of the discontinuity coincided with the high quality of the rock mass (e.g., high RMR greater than 60).
  • In sections in which measured overbreaks were greater than 1.60 m2 and less than 2.5 m2, a detailed inspection of geodetic measurements on adjacent profiles showed that overbreaks that were always greater than 1.60 m2 implied the geological type in most cases.
  • The volume of technological overbreaks was obtained by combining the volumes attributed to technological causes along the tunnel layout, whereas the volume of geological overbreaks was derived by subtracting the volume of technological overbreaks from the total volume.
One of the aims of the deterministic and probabilistic analyses developed as part of the methodology was to check the reliability of the input data that had been gathered during the excavation of the tunnel. It was demonstrated on key examples that the input data gave reliable indications of the types and forms of wedge failure. This was a necessary pre-condition to extrapolate these findings and statistically evaluate the volume quantities for the whole tunnel. In that sense, the reliability of the method was confirmed for the presented case example. In cases in which the input data are poor and/or unreliable, the proposed methodology would establish a poor relationship between calculated and observed behaviour, and the inevitable conclusion would be that the statistical evaluation would not give reliable results and would not be conducted.
It can be concluded that the developed methodology was successfully utilised for the given case example of tunnel construction in hard rock. Both deterministic and probabilistic analyses required high-quality site investigation data, including direct shear tests along the representative discontinuity planes. The case for extrapolating the results was based on the relative homogeneity of the rock mass, whereas the accuracy of the methodology was supported by the good agreement between deterministic and probabilistic analyses. Finally, the good compliance of the application enabled quantification by statistical analyses, which considered large amounts of data to calculate overbreak volume by determining the threshold between geological and technological overbreaks.

Author Contributions

Conceptualisation, Z.B. and V.J.; methodology, Z.B. and D.B.; software, Z.B.; validation, Z.B. and D.B.; formal analysis, Z.B.; investigation, Z.B. and D.B.; resources, D.B.; data curation, Z.B., D.B. and V.J.; writing—original draft preparation, Z.B.; writing—review and editing, V.J.; visualisation, Z.B. and D.B.; supervision, V.J. All authors have read and agreed to the published version of the manuscript.

Funding

This research received no external funding.

Institutional Review Board Statement

Not applicable.

Informed Consent Statement

Not applicable.

Data Availability Statement

Not applicable.

Acknowledgments

The authors express their gratitude to the Ministry of Education, Science and Technological Development of the Republic of Serbia for supporting scientific research, which is essential for the advancement of a knowledge-based society. The authors are thankful to Milorad Jovanovski and Igor Peševski at the University of Skopje for providing the results of direct shear tests presented in [28].

Conflicts of Interest

The authors declare no conflict of interest.

References

  1. Rabcevicz, L.V. The new Austrian Tunelling Method (Part 1 and Part 2). Water Power, 1964; Volume 16, 19–24, 511–515. [Google Scholar]
  2. Zou, D. Contour Blasting for Underground Excavation. In Theory and Technology of Rock Excavation for Civil Engineering; Springer: Singapore, 2017; pp. 503–508. [Google Scholar]
  3. Zhou, Z.; Cheng, R.; Cai, X.; Jia, J.; Wang, W. Comparison of Presplit and Smooth Blasting Methods for Excavation of Rock Wells. Shock Vib. 2019, 3743028. [Google Scholar] [CrossRef] [Green Version]
  4. Pomasoncco-Najarro, A.; Trujillo-Valerio, C.; Arauzo-Gallardo, L.; Raymundo, C.; Quispe, G.; Dominguez, F. Pre-split blasting design to reduce costs and improve safety in underground mining. Energy Rep. 2022, 8, 1208–1225. [Google Scholar] [CrossRef]
  5. Singh, S.P.; Xavier, P. Causes, impact and control of overbreak in underground excavations. Tunn. Undergr. Space Technol. 2005, 20, 63–71. [Google Scholar] [CrossRef]
  6. Singh, S.P. Blast damage control in jointed rock mass. Fragblast 2005, 9, 175–187. [Google Scholar] [CrossRef]
  7. Chandrahas, N.S.; Choudhary, B.S.; Teja, M.V.; Venkataramayya, M.S.; Prasad, N.S.R.K. XG Boost Algorithm to Simultaneous Prediction of Rock Fragmentation and Induced Ground Vibration Using Unique Blast Data. Appl. Sci. 2022, 12, 5269. [Google Scholar] [CrossRef]
  8. Aziznejad, S.; Esmaeili, K. Effects of joint intensity on rock fragmentation by impact. In Proceedings of the 11th International Symposium on Rock Fragmentation by Blasting, Sydney, Australia, 24–26 August 2015; pp. 377–385. [Google Scholar]
  9. Danell, R.E.; Lewandowski, T.; Mai, V.K.L. Influence of discontinuities on presplitting effectiveness. Fragblast 1997, 1, 27–39. [Google Scholar] [CrossRef]
  10. Singh, P.K.; Roy, M.P.; Paswan, R.K.; Sarim, M.; Kumar, S.; Jha, R.R. Rock fragmentation control in opencast blasting. J. Rock Mech. Geotech. Eng. 2016, 8, 225–237. [Google Scholar] [CrossRef]
  11. Silva, J.; Worsey, T.; Lusk, B. Practical assessment of rock damage due to blasting. Int. J. Min. Sci. Technol. 2019, 29, 379–385. [Google Scholar] [CrossRef]
  12. Li, J.; Ma, G. Analysis of Blast Wave Interaction with a Rock Joint. Rock Mech. Rock Eng. 2010, 43, 777–787. [Google Scholar] [CrossRef]
  13. Paswan, R.K.; Roy, M.P.; Shankar, R.; Singh, P.K. Blast Vibration and Fragmentation Control at Heavily Jointed Limestone Mine. Geotech. Geol. Eng. 2021, 39, 3469–3485. [Google Scholar] [CrossRef]
  14. Tariq, S.M.; Worsey, P.N. An investigation into the effects of some aspects of jointing and single decoupled blast holes on pre-splitting and boulder blasting. In Rock Fragmentation by Blasting; CRC Press: Boca Raton, FL, USA, 1996. [Google Scholar]
  15. Goodman, R.E.; Shi, G. Block Theory and Its Application to Rock Engineering; Prentice-Hall: London, UK, 1985. [Google Scholar]
  16. Goodman, R.E. Block theory and its application. Geotechnique 1995, 45, 383–423. [Google Scholar] [CrossRef]
  17. Bieniawski, Z.T. Geomechanics classification of rock masses and its application in tunneling. In Proceedings of the Third International Congress of the International Society for Rock Mechanics, Denver, CO, USA, 1–7 September 1974; pp. 27–32. [Google Scholar]
  18. Bieniawski, Z.T. Engineering Rock Mass Classifications; John Wiley & Sons: New York, NY, USA, 1989. [Google Scholar]
  19. Barton, N.; Bandis, S. Review of predictive capabilities of JRC-JCS model in engineering practice. In Rock Joints, Proceedings of the Regional Conference of the International Society for Rock Mechanics, Loen, Norway, 4–6 June 1990; CRC Press: Boca Raton, FL, USA, 1990; pp. 603–610. [Google Scholar]
  20. Barton, N.; Bandis, S. Effects of block size on the the shear behaviour of jointed rock. In Proceedings of the 23rd U.S Symposium on Rock Mechanics (USRMS), Berkeley, CA, USA, 25–27 August 1982; pp. 739–760. [Google Scholar]
  21. Phoon, K.; Nadim, F.; Uzielli, M.; Lacasse, S. Soil variability analysis for geotechnical practice. In Characterisation and Engineering Properties of Natural Soils; Taylor & Francis: Philadelphia, PA, USA, 2006. [Google Scholar]
  22. Robert, C.P.; Casella, G. Monte Carlo Statistical Methods; Springer: New York, NY, USA, 2004. [Google Scholar]
  23. El-Ramly, H.; Morgenstern, N.R.; Cruden, D.M. Probabilistic slope stability analysis for practice. Can. Geotech. J. 2002, 39, 665–683. [Google Scholar] [CrossRef]
  24. Read, J.; Stacey, P. Guidelines for Open Pit Slope Design; CSIRO Publishing: Canberra, Austrilia, 2009. [Google Scholar]
  25. Fell, R. Landslide risk assessment and acceptable risk. Can. Geotech. J. 1994, 31, 261–272. [Google Scholar] [CrossRef]
  26. Jovanovska, T.; Togo, I.; Gacevski, V. One method for defining an acceptable level of risks in tunneling. Facta Univ.-Ser. Archit. Civ. Eng. 2019, 17, 315–325. [Google Scholar] [CrossRef]
  27. Hoek, E.; Brown, E.T. Empirical strength criterion for rock masses. J. Geotech. Geoenviron. Eng. 1981, 106, 1013–1035. [Google Scholar] [CrossRef]
  28. Jovanovski, M.; Peshevski, I.; Papic, J.; Susino, B. Report on Laboratory Tests of Shear Strength along Joints of Samples from Investigation Gallery in the Zone of Powerhouse and Pressure Tunnel H.P.P. Dabar; Faculty of Civil Engineering, Cyril and Methodius University: Skopje, North Macedonia, 2012. [Google Scholar]
  29. Buocz, I.; Rozgonyi-Boissinot, N.; Török, Á.; Görög, P. Direct shear strength test on rocks along discontinuities, under laboratory conditions. Pollack Period. 2014, 9, 139–150. [Google Scholar] [CrossRef]
  30. ISRM. The Complete ISRM Suggested Methods for Rock Characterization, Testing and Monitoring: 1974–2006; International Society for Rock Mechanics, Commission on Testing Methods: Lisbon, Portugal, 2007. [Google Scholar]
  31. Barton, N.; Choubey, V. The shear strength of rock joints in theory and practice. Rock Mech. 1977, 10, 1–54. [Google Scholar] [CrossRef]
  32. Myers, D.E. Reliability and Statistics in Geotechnical Engineering. Technometrics 2005, 47, 103–104. [Google Scholar] [CrossRef]
  33. Harr, M. Reliability-Based Design in Civil Engineering; McGraw-Hill Book Company: New York, NY, USA, 1987. [Google Scholar]
Figure 1. Example of a wedge in two and three dimensions around contour of underground excavation with forces acting on it. Ni—normal component of force; Ji—shear component of force; W—weight of wedge.
Applsci 13 01379 g001
Figure 2. Geological map of terrain showing location of Dabar tunnel (not to scale).
Applsci 13 01379 g002
Figure 3. Longitudinal cross-section along tunnel axis in Cretaceous limestone with major geological units.
Applsci 13 01379 g003
Figure 4. Initial TBM (round shape) and changed NATM tunnel cross-section of implemented tunnel support type.
Applsci 13 01379 g004
Figure 5. Procedure for shear testing along discontinuities: (a) shear device used for testing; (b) engineering–geological inspection and evaluation of joint samples; (c) placing of samples in mould prior to cementing; and (d) cemented samples prepared for testing [28].
Applsci 13 01379 g005
Figure 6. Envelope of BB failure criterion at discontinuities at laboratory scale (green line) and field scale block of rock mass with side lengths of 3–5 m (red line).
Applsci 13 01379 g006
Figure 7. Results of deterministic analysis at two selected sections: km 7 + 066.00 and km 8 + 514.50 (a,c) Measured orientation of wedges on contour diagram; (b,d) dimensions and positions of unstable wedges and overlap with observed excessive excavation (green line) for the two sections.
Applsci 13 01379 g007
Figure 8. Normal distribution function of input variables (joint roughness coefficient, joint compressive strength, residual angle of shear resistance and joint persistence) and characteristic values.
Applsci 13 01379 g008
Figure 9. Results of probabilistic analysis at two selected sections: km 7 + 066.00 and km 8 + 514.50. (a,c) Probability of failure of different segments around tunnel contour; (b,d) probabilistic safety factor value around tunnel contour.
Applsci 13 01379 g009
Figure 10. (a) RMR values along tunnel section; (b) overbreaks along tunnel, per meter length.
Applsci 13 01379 g010
Figure 11. Measured overbreaks (m2) depending on RMR value for (a) all analysed data (1601 pieces of data) and (b) data for which geological overbreaks were confirmed by mapping (72 pieces of data).
Applsci 13 01379 g011
Figure 12. Histograms showing frequency of occurrence of overbreaks for (a) entire analysed length of tunnel and (b) stations in which geological overbreaks were identified by mapping.
Applsci 13 01379 g012
Table 1. Input parameters for probabilistic stability analysis.
ParameterMean Value (μx)Standard Deviation (σx)Variation Coefficient (cov)Minimum ValueMaximum Value
JRC5.0610.202.068.06
JCS (MPa)10.8120.194.8116.81
ϕr (°)35.010.0332.038.0
Persistence (m)310.330.2 6
Dip direction (°)XX 3XaXX − 9XX + 9
Dip (°)XXX1XpuXXX − 3XXX + 3
XX indicates azimuth value in degrees; XXX indicates dip direction angle in degrees; Xa, Xpu represent values of variation coefficient of azimuth and dip direction angle, respectively; minimum adopted value of persistence is 0.2 m.
Table 2. Results of probabilistic analysis at CH 7 + 066 and CH 8 + 514.5.
ChainageProbability of Failure (%)Probabilistic Safety Factor ValueStability Criterion
60–75% crown<1.0 crownPf < 7%
FoS > 1.0
7 + 06623–47% left side<1.0 left side
6–15% right side<1.0 right side
>99% top heading<1.0 top headingPf < 7%
FoS > 1.0
8 + 514.50% left shoulder >1.0 left shoulder
3.9–7.4% right shoulder<1.0 right shoulder
Table 3. Threshold values for determining technological overbreaks.
RMR (%)>60
Overbreak area (m2)<1.6
Table 4. Calculated technological and geological overbreak area and volume.
Threshold Value (m2)Overall<1.61.6–2.5>2.5
Total overbreak area (m2)470341610863201
Total overbreak volume (m3)22,880
Technological overbreak volume (m3)3322
Geological overbreak volume (m3)19,558
Disclaimer/Publisher’s Note: The statements, opinions and data contained in all publications are solely those of the individual author(s) and contributor(s) and not of MDPI and/or the editor(s). MDPI and/or the editor(s) disclaim responsibility for any injury to people or property resulting from any ideas, methods, instructions or products referred to in the content.

