Article

Research on Key Technologies of Super-Resolution Reconstruction of Medium and Long Wave Maritime Infrared Image

1
School of Computer Science and Technology, Changchun University of Science and Technology, Changchun 130022, China
2
State Key Laboratory of Applied Optics, Changchun Institute of Optics, Fine Mechanics and Physics, Chinese Academy of Sciences, Changchun 130033, China
3
Institute of Space Optoelectronic Technology, Changchun University of Science and Technology, Changchun 130022, China
4
Muti-Media Communication Research Laboratory, University of Ottawa, Ottawa, ON K1N 6N5, Canada
*
Author to whom correspondence should be addressed.
Appl. Sci. 2022, 12(21), 10871; https://doi.org/10.3390/app122110871
Submission received: 26 September 2022 / Revised: 22 October 2022 / Accepted: 23 October 2022 / Published: 26 October 2022

Abstract

:
Complex illumination, solar flares and heavy smog on the sea surface have caused difficulties to accurately obtain high-quality imaging and multi-dimensional information of marine monitoring targets, such as oil spill, red tide and underwater vehicle wake. The principle of existing imaging mechanism is complex, and thus it is not practical to capture high-resolution infrared images efficiently. To combat this challenge by utilizing new infrared optical materials and single point diamond-turning technology, we designed and processed a simple, light and strong condensing ability medium and long wavelength infrared imaging optical system with large relative aperture, which can obtain high-quality infrared images. On top of this, with the training from a combination of infrared and visible light images, we also proposed a super-resolution network model, which is composed of a feature extraction layer, an information extraction block and a reconstruction block. The initial features of the input images are recognized in feature extraction layer. Next, to supply missing feature information and recover more details on infrared image extracted from a dense connection block, a feature mapping attention mechanism is introduced. Its main function is to transfer the important feature information of the visible light images in the information extraction block. Finally, the global feature information is integrated in the reconstruction block to reconstruct the high-resolution infrared image. We experimented our algorithm on both of the public Kaist datasets and self-collected datasets, and then compared it with several relevant algorithms. The results showed that our algorithm can significantly improve the reconstruction performance and reveal more detail information, and enhance the visual effect. Therefore, it brings excellent potential in dealing with the problem of low resolution of optical infrared imaging in complex marine environment.

1. Introduction

Due to challenging weather and difficulties in monitoring, maritime emergencies and marine disasters usually occur in the coastal waters around the globe, causing serious harm to the development of marine economy. In order to achieve a cost-effective solution for intelligent ocean observation and detection in a complex background, many factors should be taken into consideration, such as “real-time”, “clear” and “low-cost” etc. It is urgent to research new imaging mechanisms to achieve multi-dimensional and high-resolution monitoring of Marine Targets under complex sea conditions [1]. With the rapid development of science and technology, infrared imaging technology has received high attention worldwide, particularly when involving with the medium and long wavelength bands that are utilized for wide range of practical applications due to their extraordinarily strong radiation ability. The medium and long wave dual band infrared imaging technology can simultaneously obtain the infrared radiation information on two atmospheric windows of the medium and long wave, and thus obtain more effective information of the target for improving the adaptability of the photoelectric system under various complex environmental conditions. Practically, it has wide and important applications in coastal monitoring military, medicine and other fields [2].
Compared with the visible light imaging system, the reliability and stability of the current infrared imaging system still have drawbacks as its performance can be greatly affected by the environment. For example, Gaussian noise caused by thermal noise, temperature noise and amplifier noise of the detector during signal acquisition, optical blur caused by optical components, etc., can all affect the quality of infrared image. However, with the continuous development of image display technology, it is entirely possible that infrared technology can also achieve high image quality. To meet the urgent demand from the industry side, researchers have never stopped searching for better ways that enhance the quality of infrared images and improve the resolution of infrared images. At the beginning, the super-resolution reconstruction method based on machine learning establishes a high-resolution (HR) and a low-resolution (LR) database for categorizing images in pairs, and machine training and learning are then carried out to establish a mapping relationship between the two images. For the LR images of each input target, the HR images of each output target can be directly obtained using a trained mapping relationship between HR and LR [3]. As new methods continuous to evolve, image super-resolution reconstruction based on deep learning has become a research hotspot. Dong et al. [4] first proposed a convolutional neural network for super resolution (SRCNN) in 2014. It can iteratively optimize all reconstruction processes except interpolation preprocessing, for reasonably good reconstruction results. In order to quickly and effectively realize super-resolution models at different scales, Dong et al. [5] proposed an accelerated version of neural network super-resolution model (FSRCNN), which uses deconvolution operation to up sample images at the last layer of the network, and changes the dimension of intermediate features by adding mapping layers and reducing convolution kernels, and sharing intermediate mapping layer parameters. When training super-resolution models at different scales, it is only necessary to fine tune the parameters of the deconvolution layer, and thus the training complexity can be reduced. Although the increase of convolution layer is conducive to mine useful detail information, the feature image generated by continuous operation at the convolution layer will become smaller and smaller, and the loss of image gradient will also increase. In order to reduce the gradient loss caused by this network deepening, in 2016, Kim et al. [6] proposed a very deep super-resolution convolutional network (VDSR), which uses 20 convolution layers to extract the features of the input image and introduces residual learning to ensure that the detailed features can be retained for a long distance. Kim et al. [7] also proposed another deep recursive convolutional network (DRCN) to learn the differences in detail between HR images and LR images. Each layer of DRCN adopts a supervised recursive layer, which obtains high-frequency information by constantly cycling the recursive layer and uses a jump connection structure to reduce the disappearance of the gradient of the network. In order to improve the overall performance of the network, Lai et al. [8] designed a deep Laplacian pyramid network for fast and accurate super resolution (LapSRN). This algorithm searches for multi-scale feature information by gradually up sampling the network and sharing the feature map and adopts the Laplacian pyramid structure to up sample layer by layer and fuse the residual image features, thereby obtaining a reconstructed super-resolution image. The model adopts the structure of step-by-step up sampling and does not need interpolation in the preprocessing stage, thus greatly reducing the complexity of network calculation. In order to make use of the channel information of the image, Zhang et al. [9] proposed a super-resolution algorithm based on channel attention networks (RCAN). This algorithm overcomes the disadvantage of existing convolutional neural networks by treating each channel feature equally and gives a certain attention weight to group each channel feature into new features. As a result, the attention mechanism can mine more channel and location information and draws a new research focus on super-resolution reconstruction network.
However, these above-mentioned deep learning algorithms for image super-resolution reconstruction are generally aimed at natural images, and there is little research conducted on the super-resolution of infrared images, especially on the medium and long wave maritime infrared image. Infrared images have the disadvantages due to their low resolution, low contrast, and low signal-to-noise ratio. There are also problems such as little information given on edge texture, unclear gray level of images, poor noise suppression ability but much calculation of algorithms required to perform. Therefore, it is necessary and significant to research super-resolution reconstruction technology in the field of infrared imaging.
In this research, we utilized new infrared optical materials and single-point diamond turning technology to design and process a medium and long wavelength infrared imaging optical system capable to provide a simple, light yet strong focusing ability using an equipped large relative aperture. The image results obtained from the system within the medium and long infrared spectrum are relatively clear [10]. We also proposed a super-resolution network model combining infrared and visible light images, which includes a feature extraction layer, an information extraction block and a reconstruction block. The model fuses the feature information extracted from visible light images and the infrared images and utilizes the important feature information on the edge and texture of the visible light image to compensate the detail of the infrared image and reconstructs the high-definition infrared image.

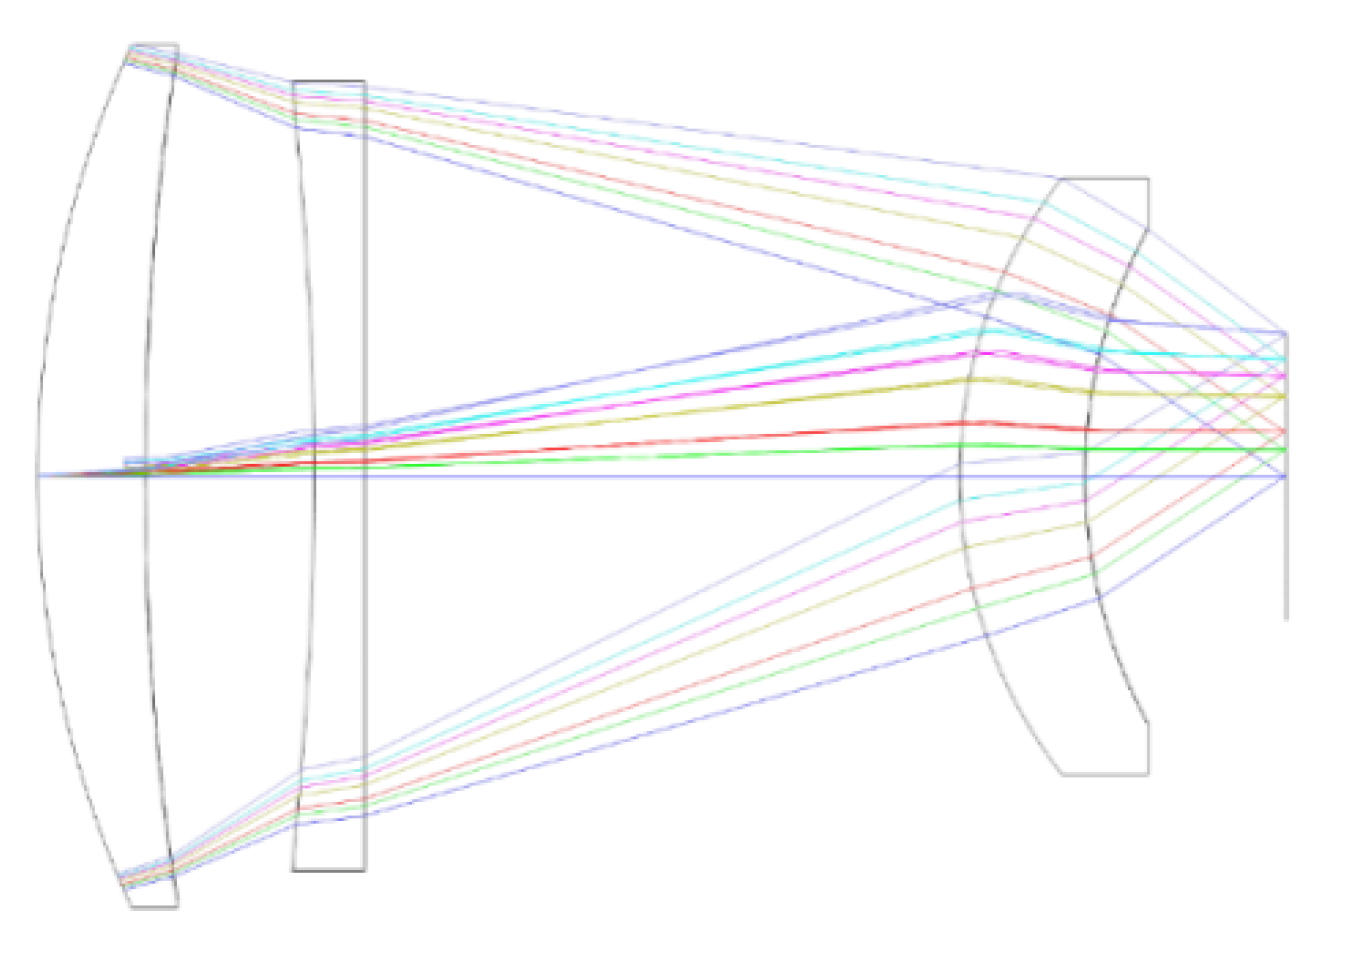
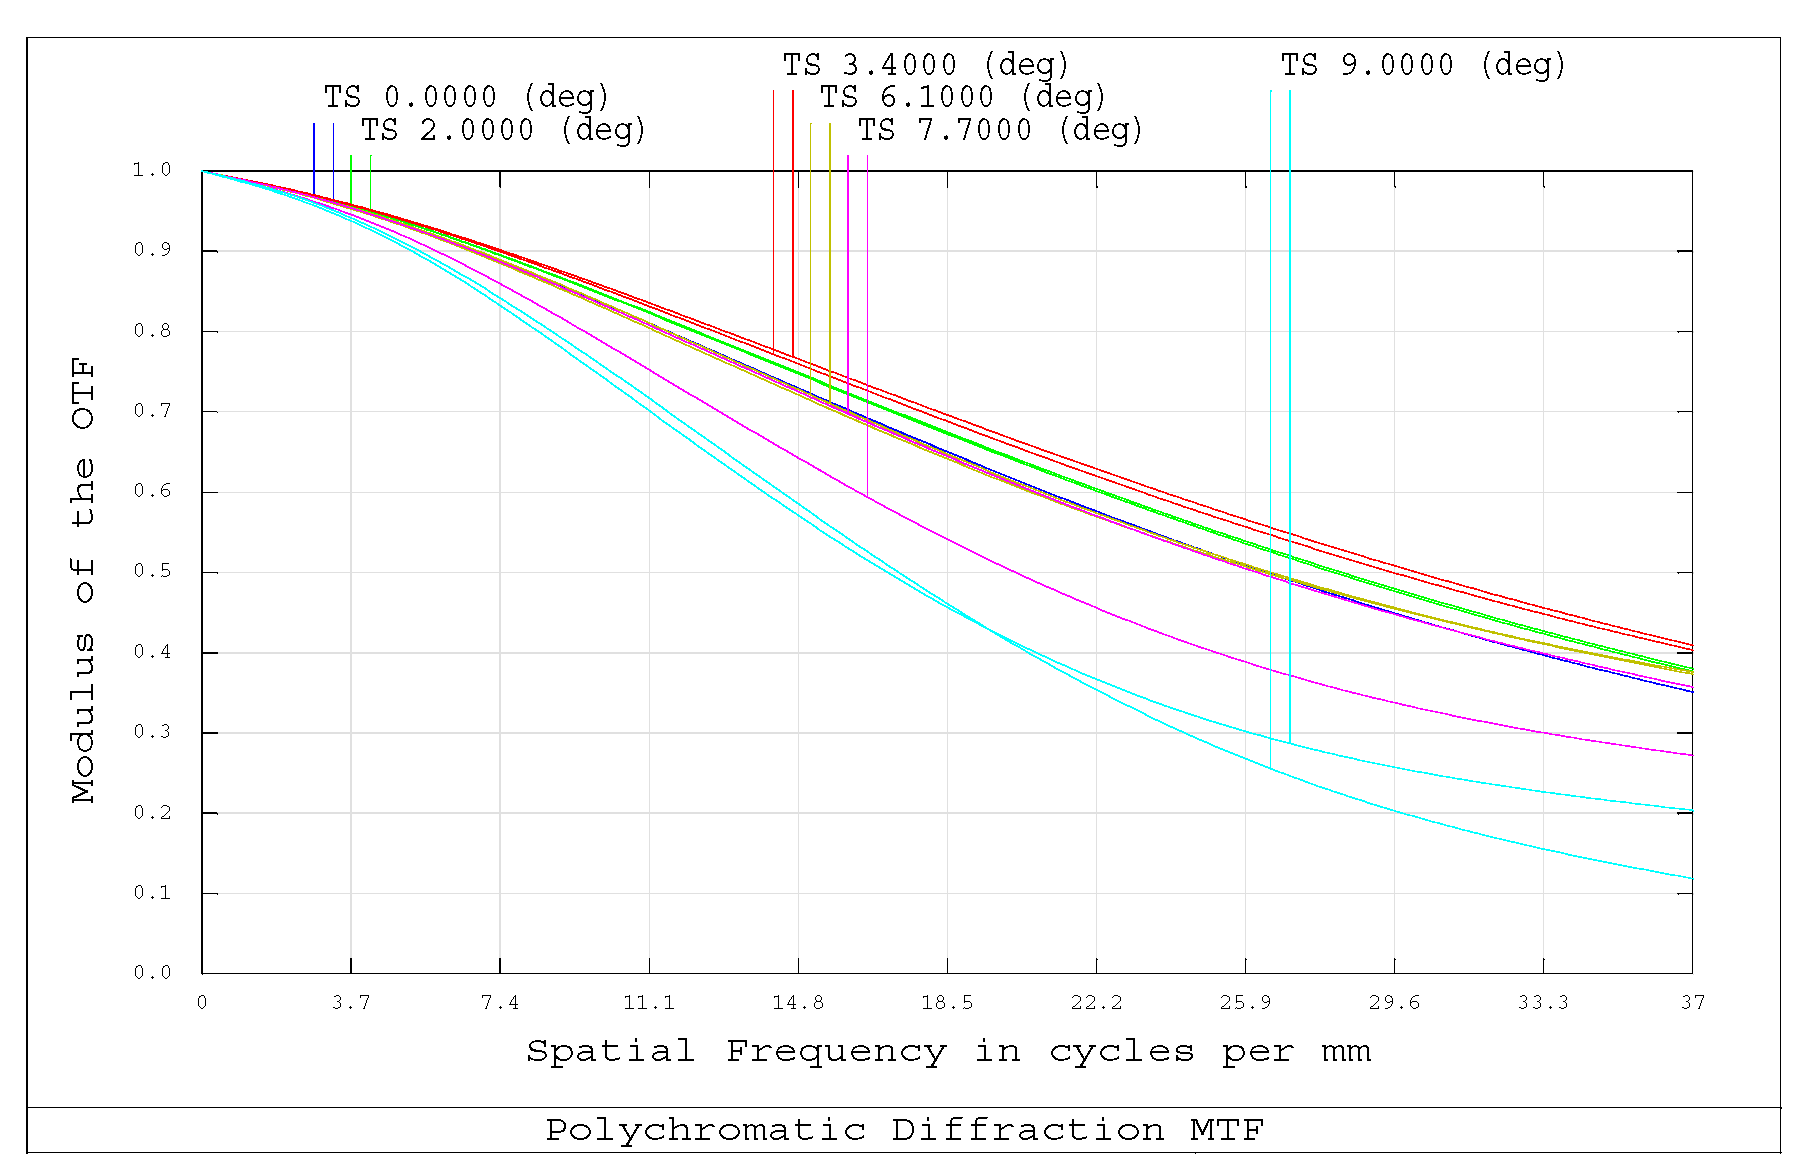
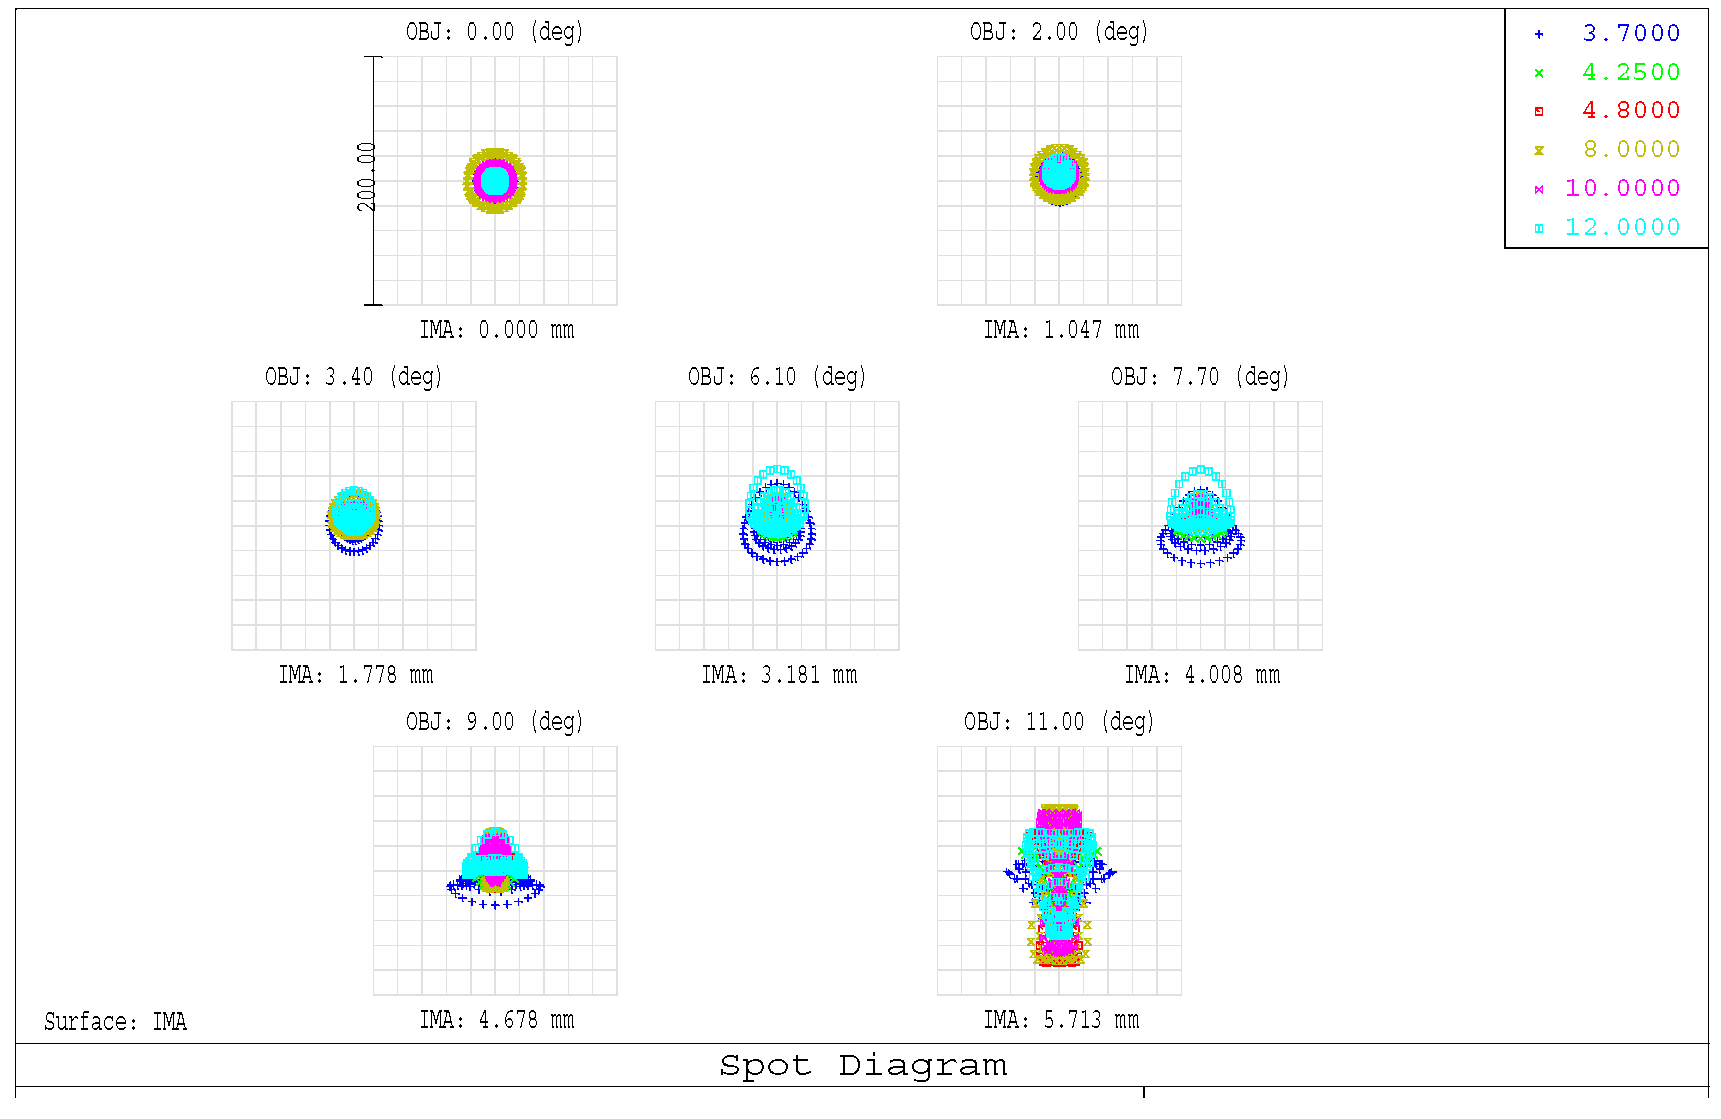
2. The Designed Infrared Optical Imaging System

We designed a wide band infrared optical imaging system with large relative aperture. The ratio F of focal length to aperture of the optical system reaches 0.9. The parameters of broadband infrared optical system are shown in Table 1. The focal length f of the system is 30 mm, and the pixel size D of the detector is 15 μm. The resolution is W × H = 640 × 512. The field of view can be calculated by the following formula:
2 w = d × W 2 + H 2 f = 23.2
The infrared optical material has a high absorption coefficient. In order to improve the transmittance of the infrared optical system, the lens should be simplified as much as possible, thus an even aspheric surface shape is used to correct the aberration caused by large aperture and large field of view. Even degree aspherical surface can be expressed by the following formula:
z = c r 2 1 + 1 ( k + 1 ) c 2 r 2 + i = 1 j a i r 2 i
where: r = x 2 + y 2 is the incident height of light on aspheric surface, c is the radius of curvature at the vertex, k is the cone constant, and a i is the high-order aspheric coefficient.
In the actual manufacturing process, the aspheric surface of infrared material can be machined by single point diamond turning. We choose a three-piece structure, in which the first piece of lens material is AMTIR1, the second piece is ZnS, and the third piece is Ge. AMTIR1 is a kind of synthetic material that can transmit light from near-infrared to long-wavelength infrared, and it can achieve very good achromatic effect in the infrared band. The second and sixth surfaces are even-degree aspherical surfaces. The first lens has a large aperture and large off-axis aberration. Aspherical surfaces are introduced on the back surface of the first lens. The fourth and sixth order coefficients are 8.0502 × 10⁻⁷ and 1.0185 × 10⁻⁹ respectively. Due to achromatic aberration, the third lens has a large power. In order to avoid excessive high-order aberration, an aspheric surface is introduced behind it. The fourth and sixth order coefficients are 3.1083 × 10⁻⁶ and −5.128 × 10⁻¹² respectively.
When designing the initial structure, a series of aberration equations are established according to the linear relationship between the primary aberration and the structure parameters, and then the linear equations are solved to obtain the initial structure giving the aberration requirements. The aberration calculation formulas used in this design are as follows:
i = 1 n 1 h i j = 1 n 2 φ j = 1
C = i = 1 n 1 h i 2 j = 1 n 2 φ j ν j = 0
S = 3 h 4 φ 3 P = 0
S = 3 h 3 h z φ 3 P + J 3 h 2 φ 3 W = 0
wherein, P = ( Δ u j Δ ( 1 n j ) ) 2 Δ u j n j , W = ( Δ u j Δ ( 1 n j ) ) Δ u j n j ,   Δ u j = u j u j ,   Δ u j n j = u j n j u j n j .   n1 is the number of lens groups, defined as 3 in this paper, n2 is the number of faces in the lens group, defined as 2 in this paper, h i and hz are the height of the first and second paraxial rays on each lens group, φ j and nj are the normalized power and refractive index of each surface of the lens, vj is the Abbe number of each single lens glass, j is the Lagrange invariant of the optical system, uj and uj are the incident light angle and exit angle on each surface of the lens group. Formula (3) is used for achromatic aberration, and Formulas (4) and (5) are used for spherical aberration and coma aberration respectively.
After completing the initial structure calculation, we release the curvature radius and aspheric coefficient of each surface for optimization. The final system optical path diagram is shown in Figure 1. It can be seen from the modulation transfer function in Figure 2 and the dot plot in Figure 3 that the MTF of the system at all wavelengths is better than 0.3 at the cutoff frequency of 1/2d(33 lp/mm), and the RMS diameter is less than 15 microns, that is, less than one pixel, except for the maximum field of view. The maximum field of view is actually the four corners of the detector. Thus, a slight drop in image quality has little impact on the overall imaging effect. The illumination of the full image plane is greater than 95%, which can ensure good imaging quality. Figure 4 shows the assembled wide band infrared lens. The broadband infrared detector is used in the imaging system, and its parameters are as follows: Operating spectrum: 3~5 μm, 6.8–14 μm. Pixel size: 25 μm. Resolution: 384 × 288. NETD: 40 mk@25 Hz. Frame rate: ≤50 Hz. Imaging mode: standard, frame difference, fusion. Pseudo color display: eight kinds.

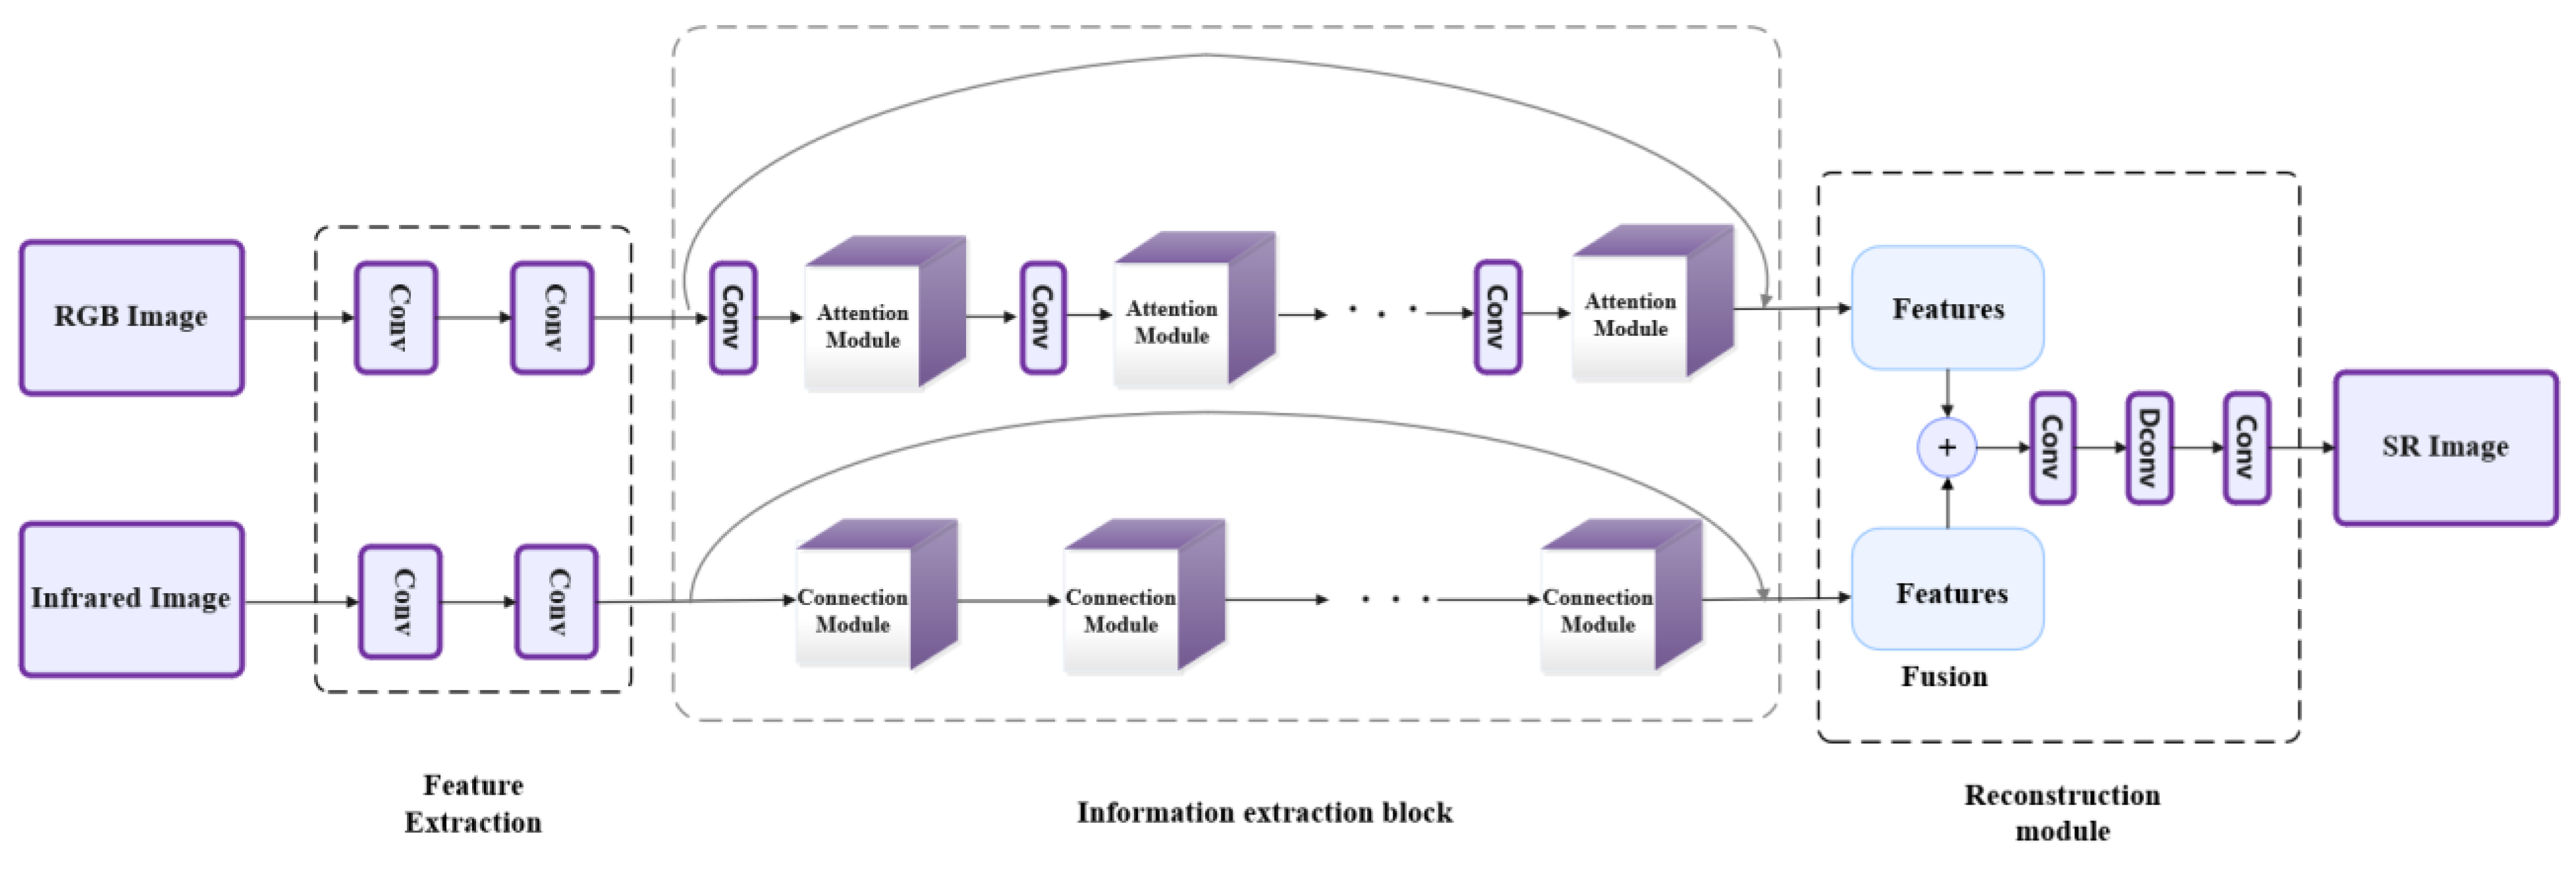
3. The Proposed Network Model

The model is set as a two-line operation on visible light image (RGB) and corresponding infrared image (IR). As shown in Figure 5, it is composed of a feature extraction layer, an information extraction block and a reconstruction block. The feature extraction layer extracts the shallow features of the original low-resolution image and the visible light image by two 3 × 3 convolution operations followed by activation functions. The information extraction block introduces the feature mapping attention mechanism in the RGB line to extract the important feature information from the visible light image and transfer it between channels to supplement the missing information of IR. The dense connection module is introduced in the IR line to extract image features, which can more fully extract IR edge, texture and other information. Finally, the extracted RGB and IR feature information are fused in the reconstruction block, and the global feature information is integrated to complete the IR reconstruction.

3.1. Feature Extraction Layer

The RGB and IR color spaces are used as the two inputs of the network, and two 3 × 3 convolution kernels are deployed respectively. The output is a 64-channel convolution operation for preliminary feature extraction of the picture. We define two input expressions, I R G B and I I R , f ( ) for the shallow extraction operation function, and two outputs F and F ˜ for the extracted shallow features. This operation can be expressed by the following formula:
F = f ( I R G B ) , F ˜ = f ( I I R )

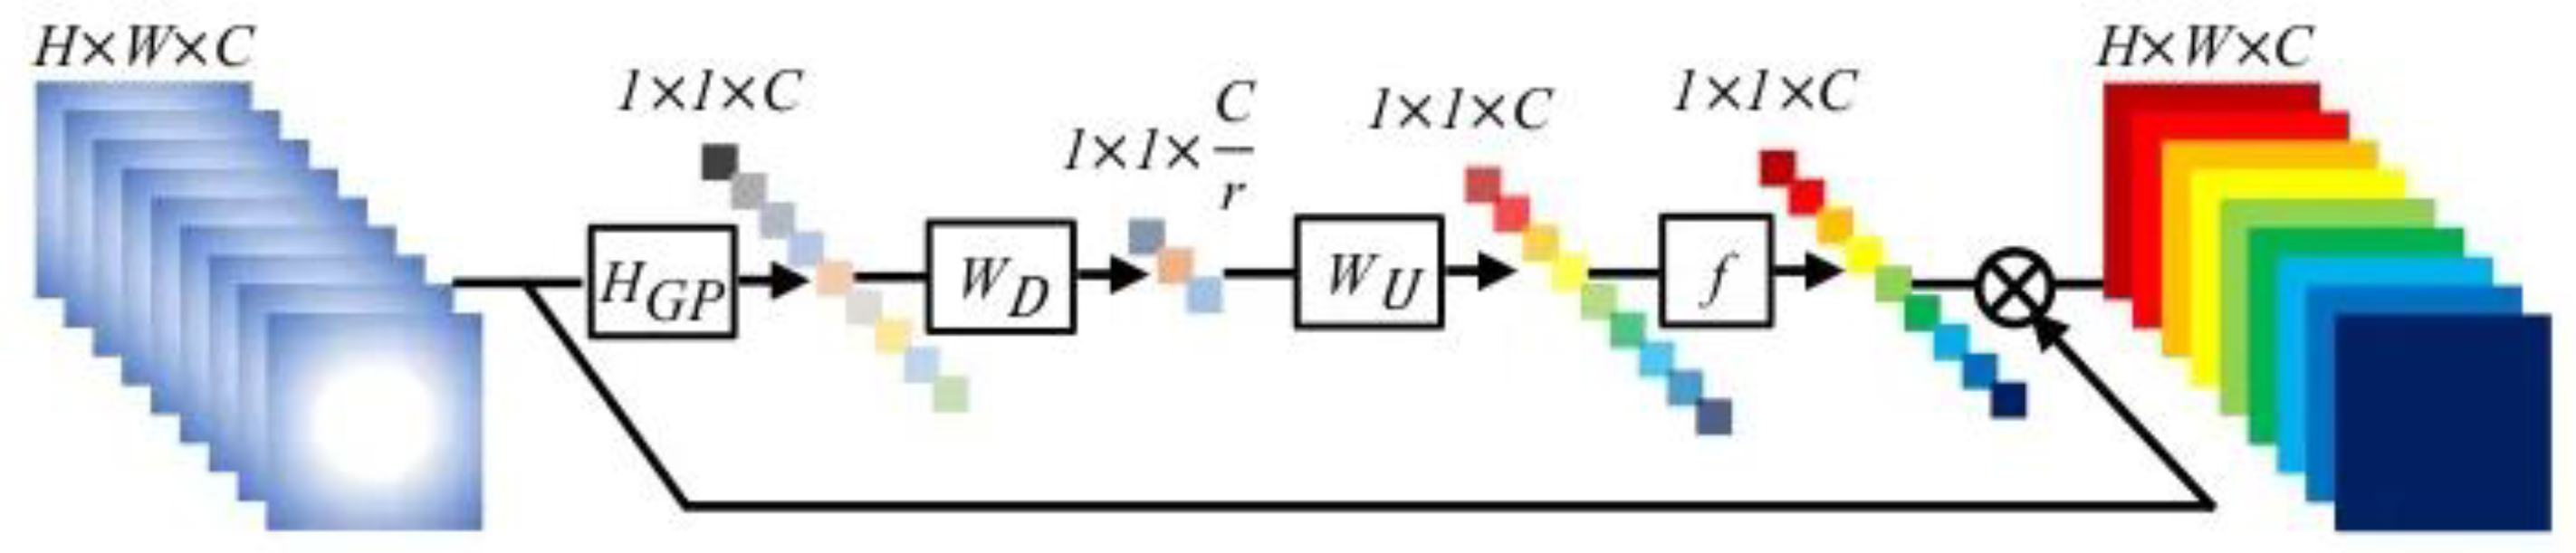
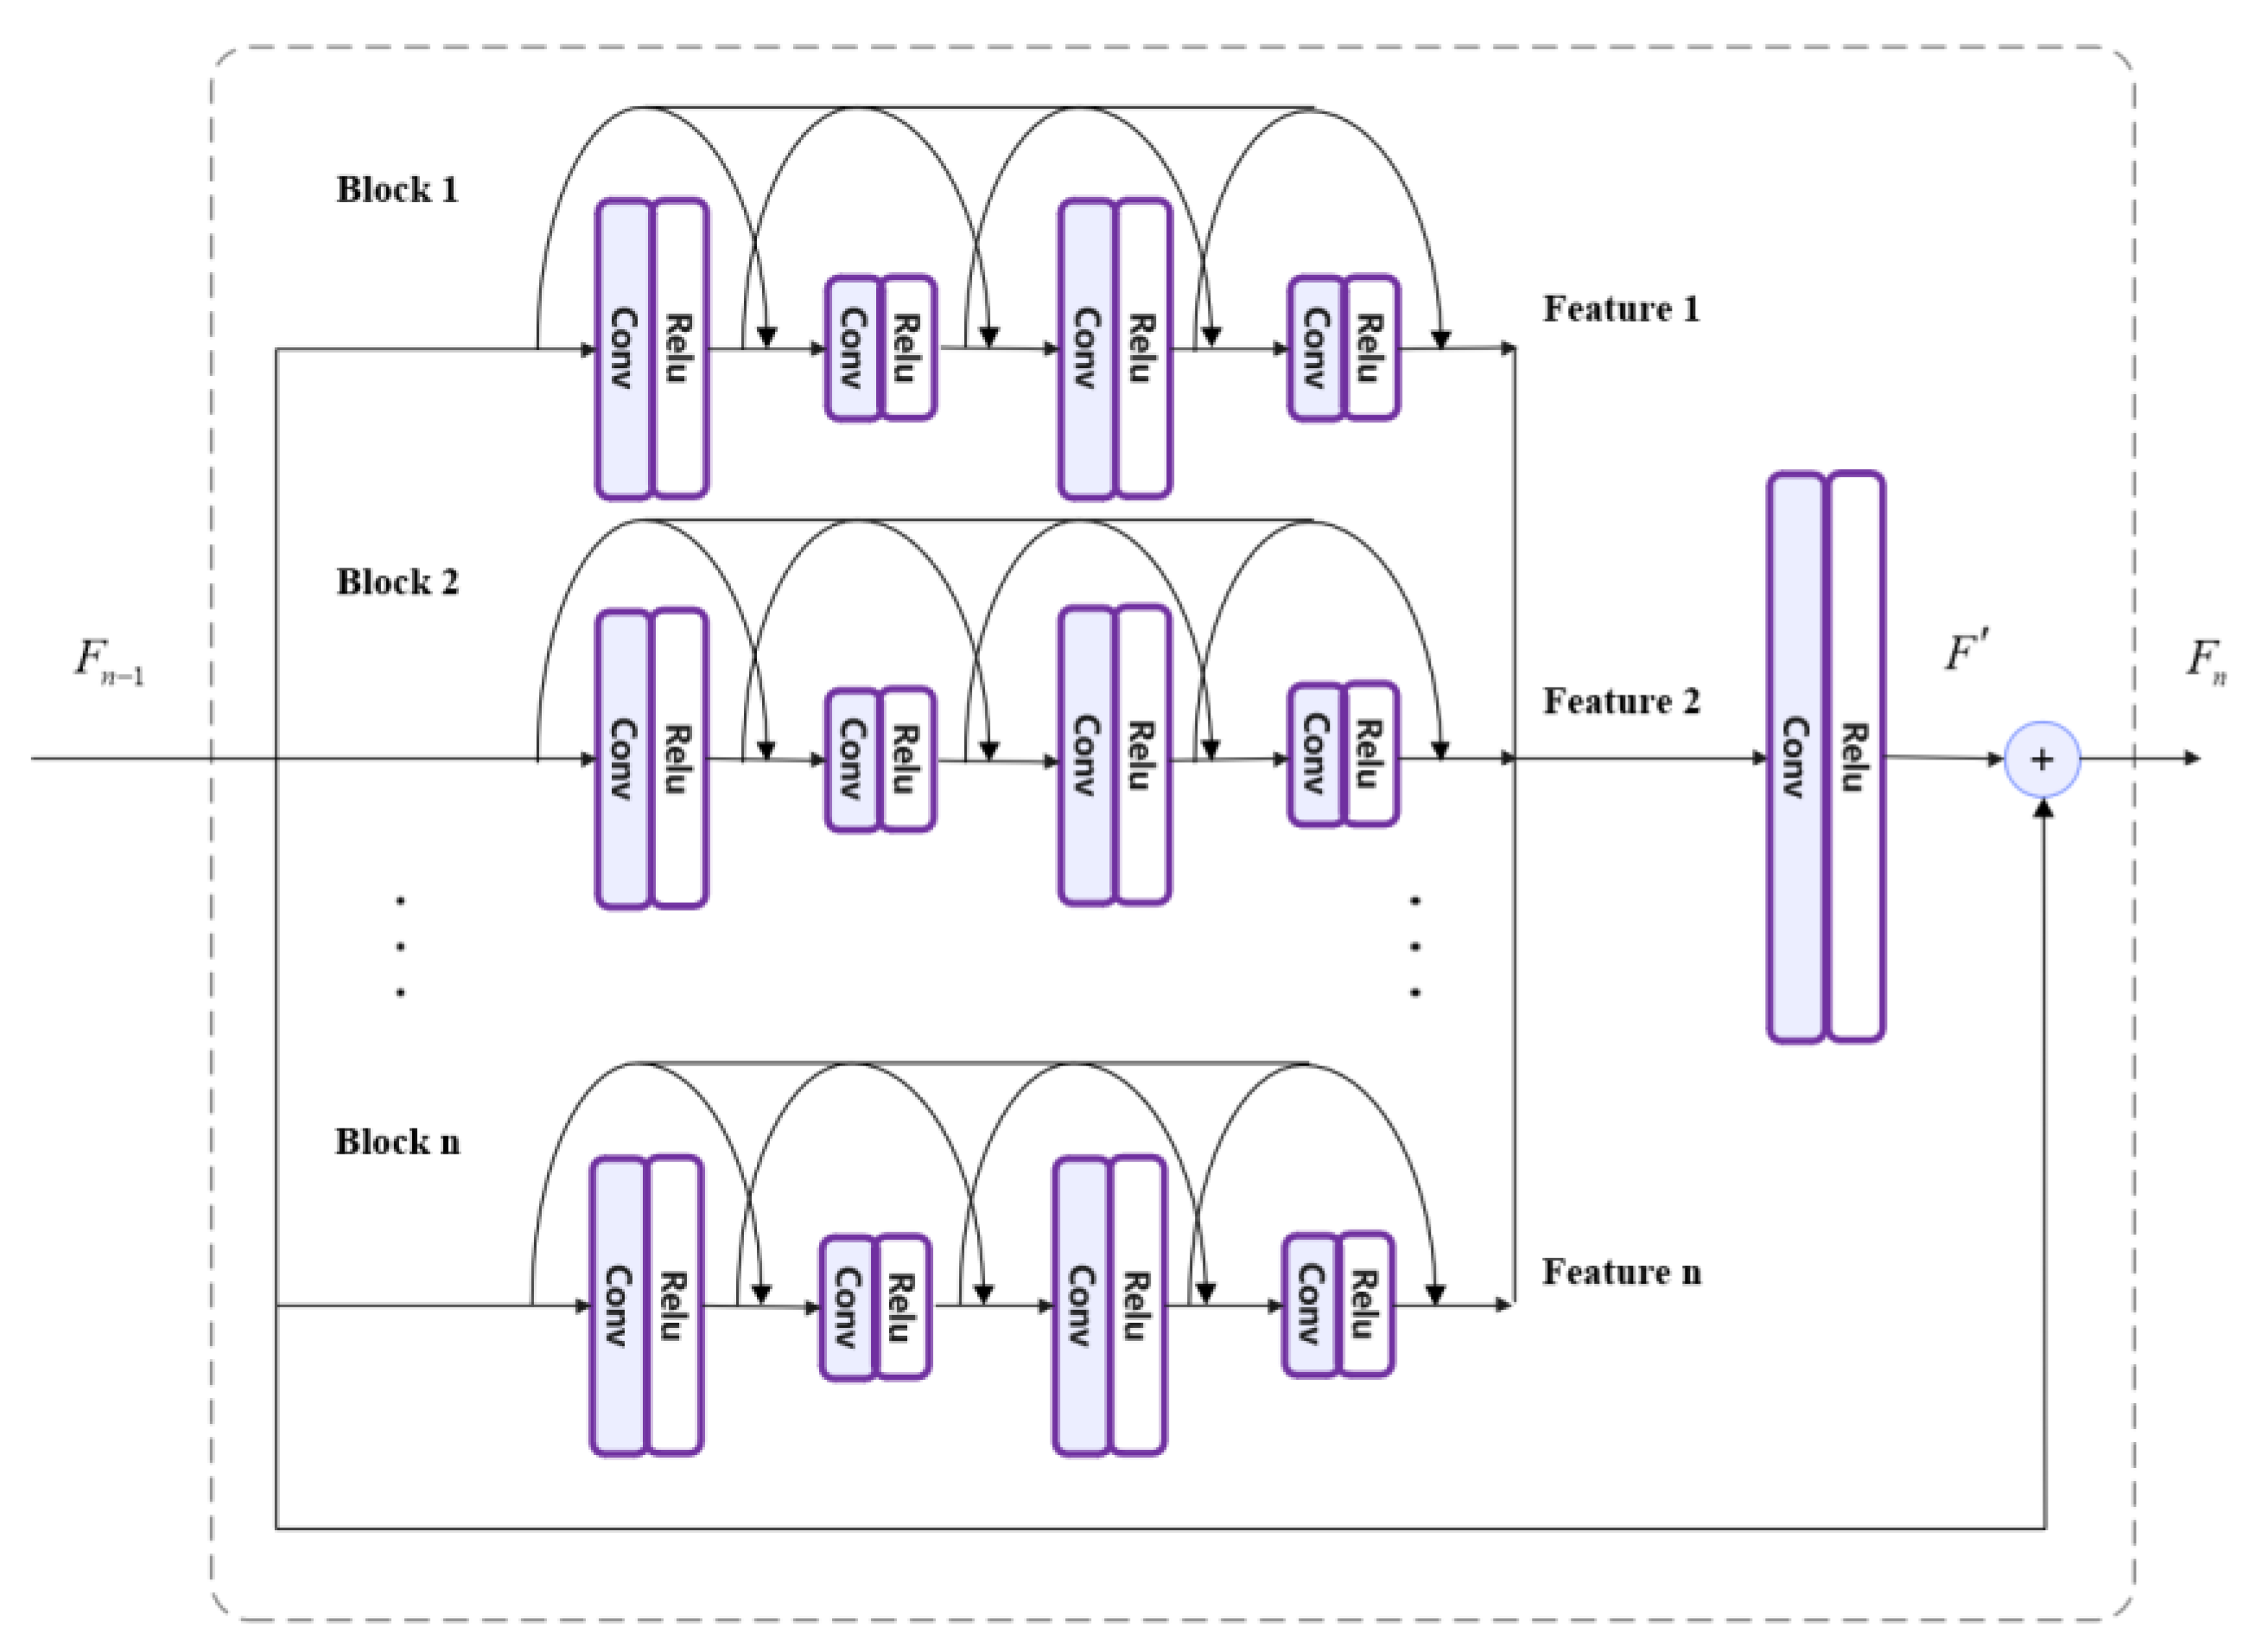
3.2. Information Extraction Layer

Information enters the information extraction module. For RGB images, the red channel parameters of the image are taken as important information, and the attention mechanism module is introduced. Hu et al. [11] first proposed the concept of channel attention mechanism in 2018, explicitly modeling the interdependence between feature channels, learning to obtain the importance of each feature channel, and then promoting useful features according to their importance levels, and suppressing features that are not used for the current task. In this way the feature expression ability of the network can be significantly improved. In related studies, the attention mechanism has been widely used for deep learning in various application fields, including natural language processing [12,13], image segmentation [14], fog computing [15] and machine learning [16,17]. These models take advantage of the selective attention mechanism of human vision [18], quickly select target areas to browse global information, and guide more attention to suppress other less useful information. It is to our advantage that channel attention mechanism module can be easily added to the existing network structure, to improve the accuracy of the original network in image classification and scene classification tasks. Specifically, the channel attention mechanism distinguishes the importance of image channels by learning to give different weights to image channels, so that the network pays more attention to channels containing rich information, and thus enhancing the feature extraction ability of the network, which is also enlightening for image super-resolution tasks. Therefore, this paper applies the channel attention mechanism to support the process of image super-resolution reconstruction. Zhang et al. [19] first applied the channel attention mechanism to the field of image super-resolution reconstruction, proving the high effectiveness of the channel attention mechanism for image super-resolution tasks. As shown in Figure 6, let X = [ x 1 , x 2 , , x c , , x C ] as input, Where C stands for the characteristic graphs of size H × W , and the channel statistic z Rc can be obtained by contracting X . Then the calculation of the cth z is as the following:
z c = H G P ( x c ) = 1 H × W i = 1 H j = 1 W x c ( i , j )
where, x c ( i , j ) represents the value of the cth feature x c at the position ( i , j ) , H G P ( ) represents the global average pooling function, then we use the scaling mechanism to adjust the image features:
s = f ( W 2 δ ( W 1 z ) )
x ^ c = s c x c
In order to increase the nonlinearity of the network, two full connection layers instead of one are selected to form the bottleneck layer to flexibly capture the nonlinear interaction relationship between channels. As shown in Formula (9), W 1 represents channel dimension reduction operation, and then W 2 represents channel dimension upgrading operation, The correlation between feature channels is displayed by parameter W , and generates weight s for each feature channel. Among them, s c and x c represent the scaling factor and characteristic map of the cth channel respectively and listed as Formulas (8)–(10). The final output of the channel attention mechanism can be obtained as x ^ CA = [ x ^ 1 , x ^ 2 , , x ^ c , , x ^ C ]
In IR, as shown in Figure 7, a set connection module is added. Each module is composed of several diversity dense connection blocks, local feature fusion and local residual learning. The dense connection module refers to the connection mode in Densenet [20], which creates multiple connection blocks by changing the size, arrangement and proportion of each convolution core in the module. For each connection block, the mapping of the ith layer S i can be expressed as:
S i = σ ( w i [ S 1 , S 2 , , S i 1 ] + b i )
w i and b i respectively represent the weights and offsets of the ith layer, S 1 , S 2 , , S i 1 represent the feature maps extracted by each layer before the ith layer, and σ ( ) is a set of Relu activation functions. We define F n 1 as the input of the nth subnetwork, then F n = F + F n 1
The difference in convolution kernel size and arrangement order leads to different feature maps being extracted from each module. In order to obtain more abundant features at the same level, multiple modules are connected in a multi-path manner. In this paper, we set I to 3, and then by changing the kernel size and convolution order, we can obtain modules with multiple functions to extract various feature maps. The convolution kernel size of each line is set to 5 × 5 and 3 × 3 respectively. The operation in the dense connection module introduces residual learning, which can further improve the information flow in the network, promote the transmission of information and gradients, and prevent the disappearance and explosion of gradients.

3.3. The Reconstruction Layer

The basis of SR reconstruction of reconstructed layer image is the information correlation between LR and HR images. It is very important to make full use of the hierarchical features extracted from LR space. Therefore, a reconstruction layer is established in the network. The texture features of RGB images are extracted, weighted, and fused with IR features to make up for the lack of IR feature information. Since the main body of the super score is IR, we adjusted the weight proportion of IR to 0.7 when fusing. The effect of the adjustment on the weight parameters in this way on subsequent experiments is obvious. The feature map of the reconstructed HR image can be expressed as:
F H R = R ( w 1 F R G B + w 2 F I R )
where w1 and w2 are weight parameters, F R G B and F I R are the final output results of the two lines before fusion, and R ( ) are the reconstruction convolution operation functions before output.

3.4. Framework of the Whole Algorithm

The entire framework contains several modules with dedicated functionalities, including initial pre-estimation of IR, detection of correlation area and introduction of auxiliary information. The general flow of the algorithm is as follows:
(1).
Two-line input, one is low resolution IR and the other is registered high-resolution RGB image. First, we use bicubic interpolation to up sample the infrared image to the same size as RGB.
(2).
The most IR related channel of the RGB image is selected.
(3).
Next, we perform preliminary information extraction on the two images.
(4).
Taking the high-resolution RGB image as a guide, the main features such as edge texture are extracted by convolution.
(5).
The corresponding low-resolution IR is used to extract the main features such as edge texture by convolution.
(6).
Fuse the values of (4) and (5), we compare the fused results with the high-definition IR corresponding to the training and calculate the loss function.
(7).
Back propagation is used to update the network weight parameters and to constantly optimize the network model.
(8).
We then judge whether all images have been executed. If yes, the training is stopped. If not, loop back to step 1.
(9).
Finally, the network model of training optimization is obtained.

4. Experiments and Comparisons

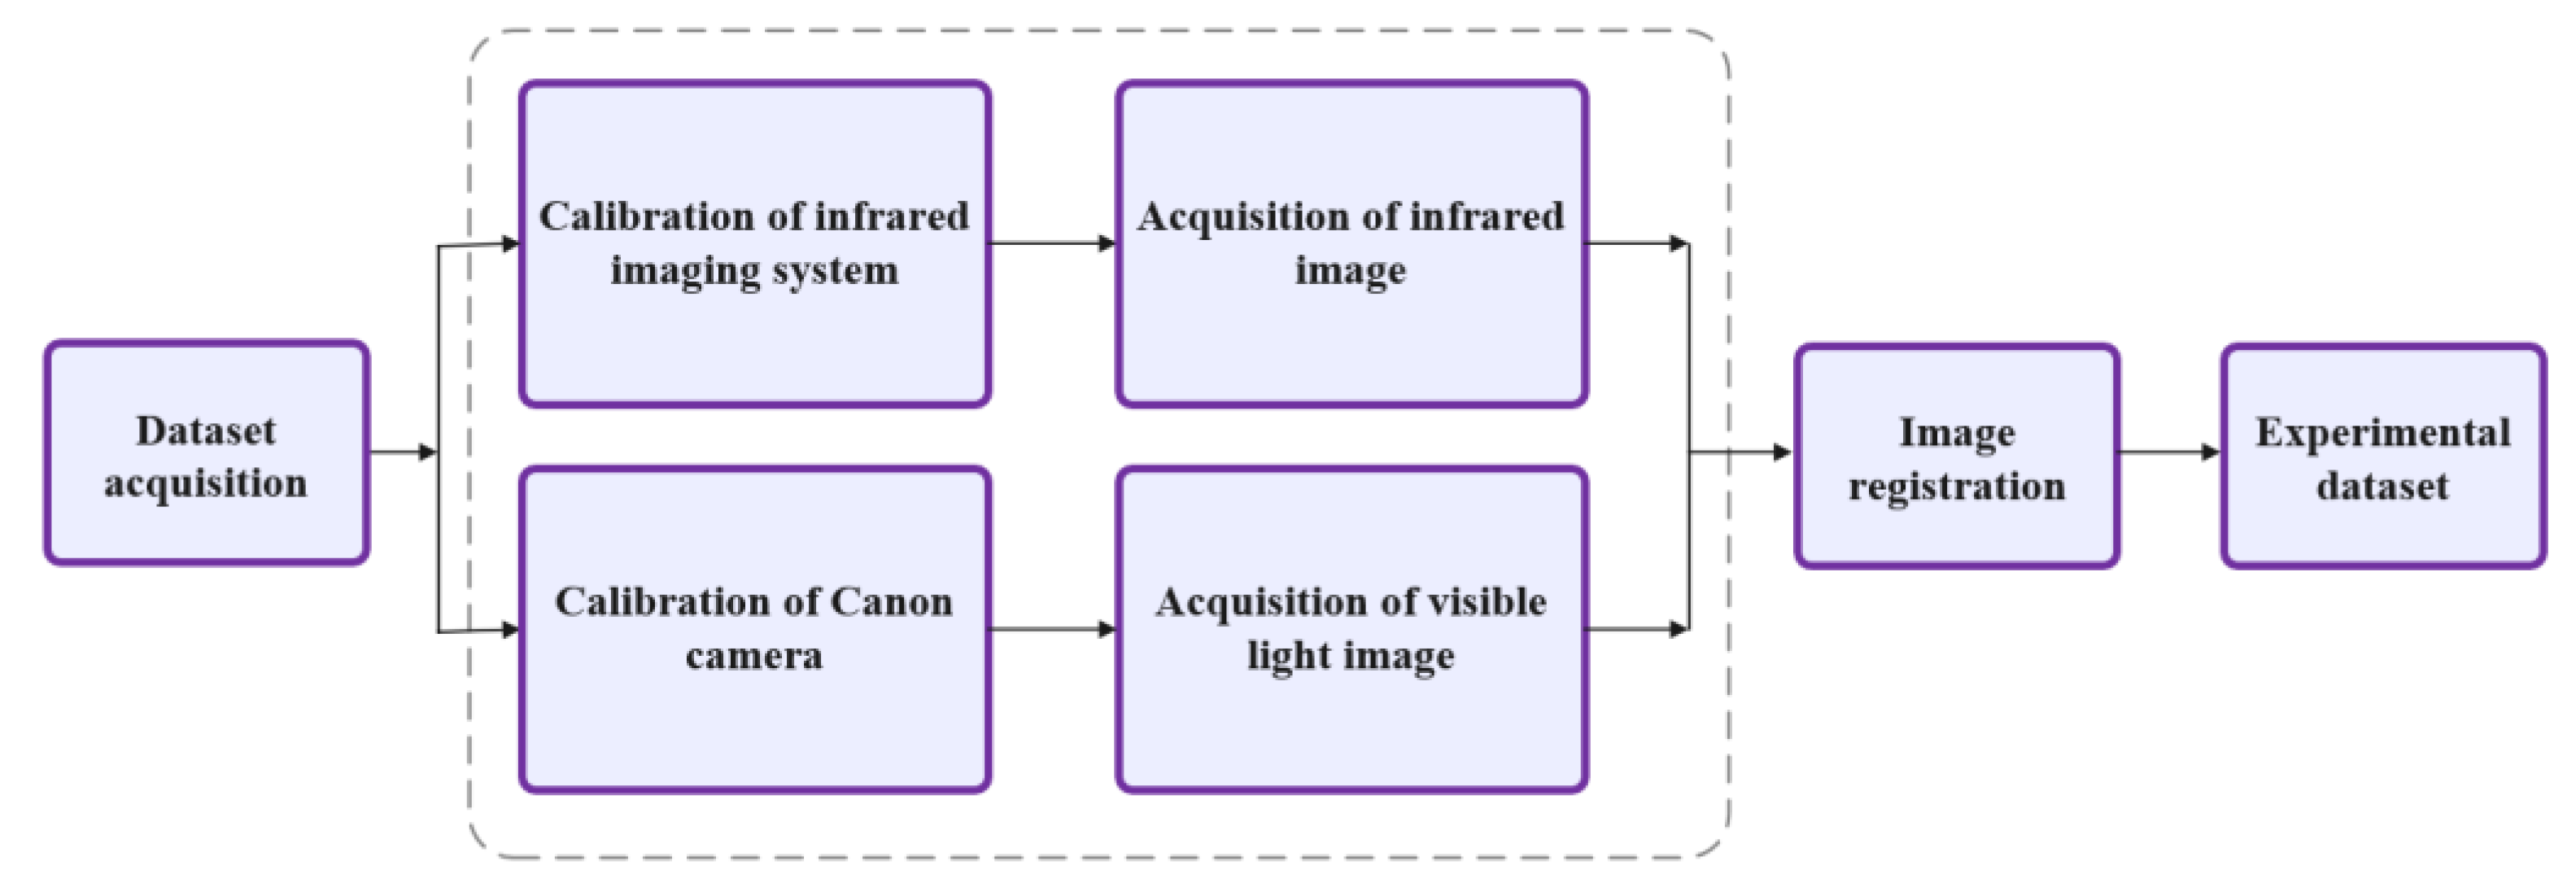
4.1. Experimental Data

Data set refers to a common data set in the field of image processing. The most widely used data sets are image net, urban100, greneral-100, set5, set14, manager109, bsd300 and bsd500. The test data often used in image processing are set5, set14 and manager109. The infrared image and visible image databases [21,22] have also been applied to various computer vision tasks (such as image enhancement, pedestrian detection and region segmentation), but most of the data sets do not consider as high-resolution IR. Therefore, RGB and IR pairs are used as inputs to the network to effectively train a deeper network. The Kaist dataset contains images acquired through day and night, mainly outdoor (garden, playground and building) scenes. Because infrared is sensitive to thermal radiation, the human body is conspicuous in IR image at night time.
In order to train the depth network effectively, both the variety and quantity of the image database need to be extensive. In this paper, we collected datasets containing IR and RGB images using the designed infrared imaging system and Canon EOS 700D camera (Dafen, Japan). The datasets contain day and night images of the sea scene. For the same scene image, an image registration algorithm based on local self-similarity is used according to the target size and resolution of IR. The whole flow chart is shown in Figure 8. We collected 200 pairs of IR and RGB images with different lighting conditions and scenes to form the experimental data, and combined them with 300 pairs of images selected from the Kaist dataset to form final experimental datasets. We provided the download address of the Kaist dataset at the end of this paper.
Among all the data collected and combined, 400 pairs of images are taken as the training dataset, which its main image pairs include IR and corresponding RGB images. In order to expand the training dataset, the image pairs are horizontally flipped, vertically flipped or rotated by 90 degrees, 180 degrees and 270 degrees, and then are enlarged two, three and four times, using interpolation method restore the size and to get new data. The sample size, which is cut to 128 × 128, are sent to the network for training. After the training is completed, the pre-trained model is capable of performing super-resolution at 2×, 3× and 4× scales, respectively. During the test, we are able to select the trained model parameters and a new input of image for model performance verification.

4.2. Experimental Setup

The computer CPU used for the algorithm test is an Intel Core [email protected] GHz. Additional hardware equipment includes a NVIDIA GeForce GTX 1060 GPU, 16 GB memory and a 1 TB hard disk. The software environment includes matlabr2016a, 64-bit Linux operating system, Cudnn 5.0, CUDA 8 toolkit, Pycharm and Pytorch. We divide the stored training images into a batch of 64 groups, and each batch contains 128 × 128 pairs of segmented pictures to go through the network for training. After training, the loss function between restored images and clear images is calculated, and the weight parameters are updated by back propagation, finally the optimized network model is obtained. When the number of infrared image dense connection modules is three, the loss function can be reduced to a more ideal effect. We train a network model at different scales, including images magnified by 2×, 3× and 4×, and then combine LR and HR pairs at all different scales into a training dataset. For pixels near the image boundary, we fill zero before convolution to keep the same size of all feature maps. The momentum parameter of the network is 0.9, and the weight attenuation is set to 10−4. Next, we set the initial learning rate to 0.1, and then reduce it by 10 times for every 25 cycles [23,24]. In order to ensure the rapid convergence of the network, the gradient clip is gradually set within a certain range [−τ, τ], where τ is set to 0.4 [25,26,27]. The activation function and regularization operation follow each convolution layer, and the negative slope of the activation layer is 0.2 [28,29,30]. We trained 90 generations of deep learning according to the above-mentioned set procedure, and the entire process take about 75 h. We observed that the loss function of the 85th generation network model was the smallest and chose this model for subsequent experiment.

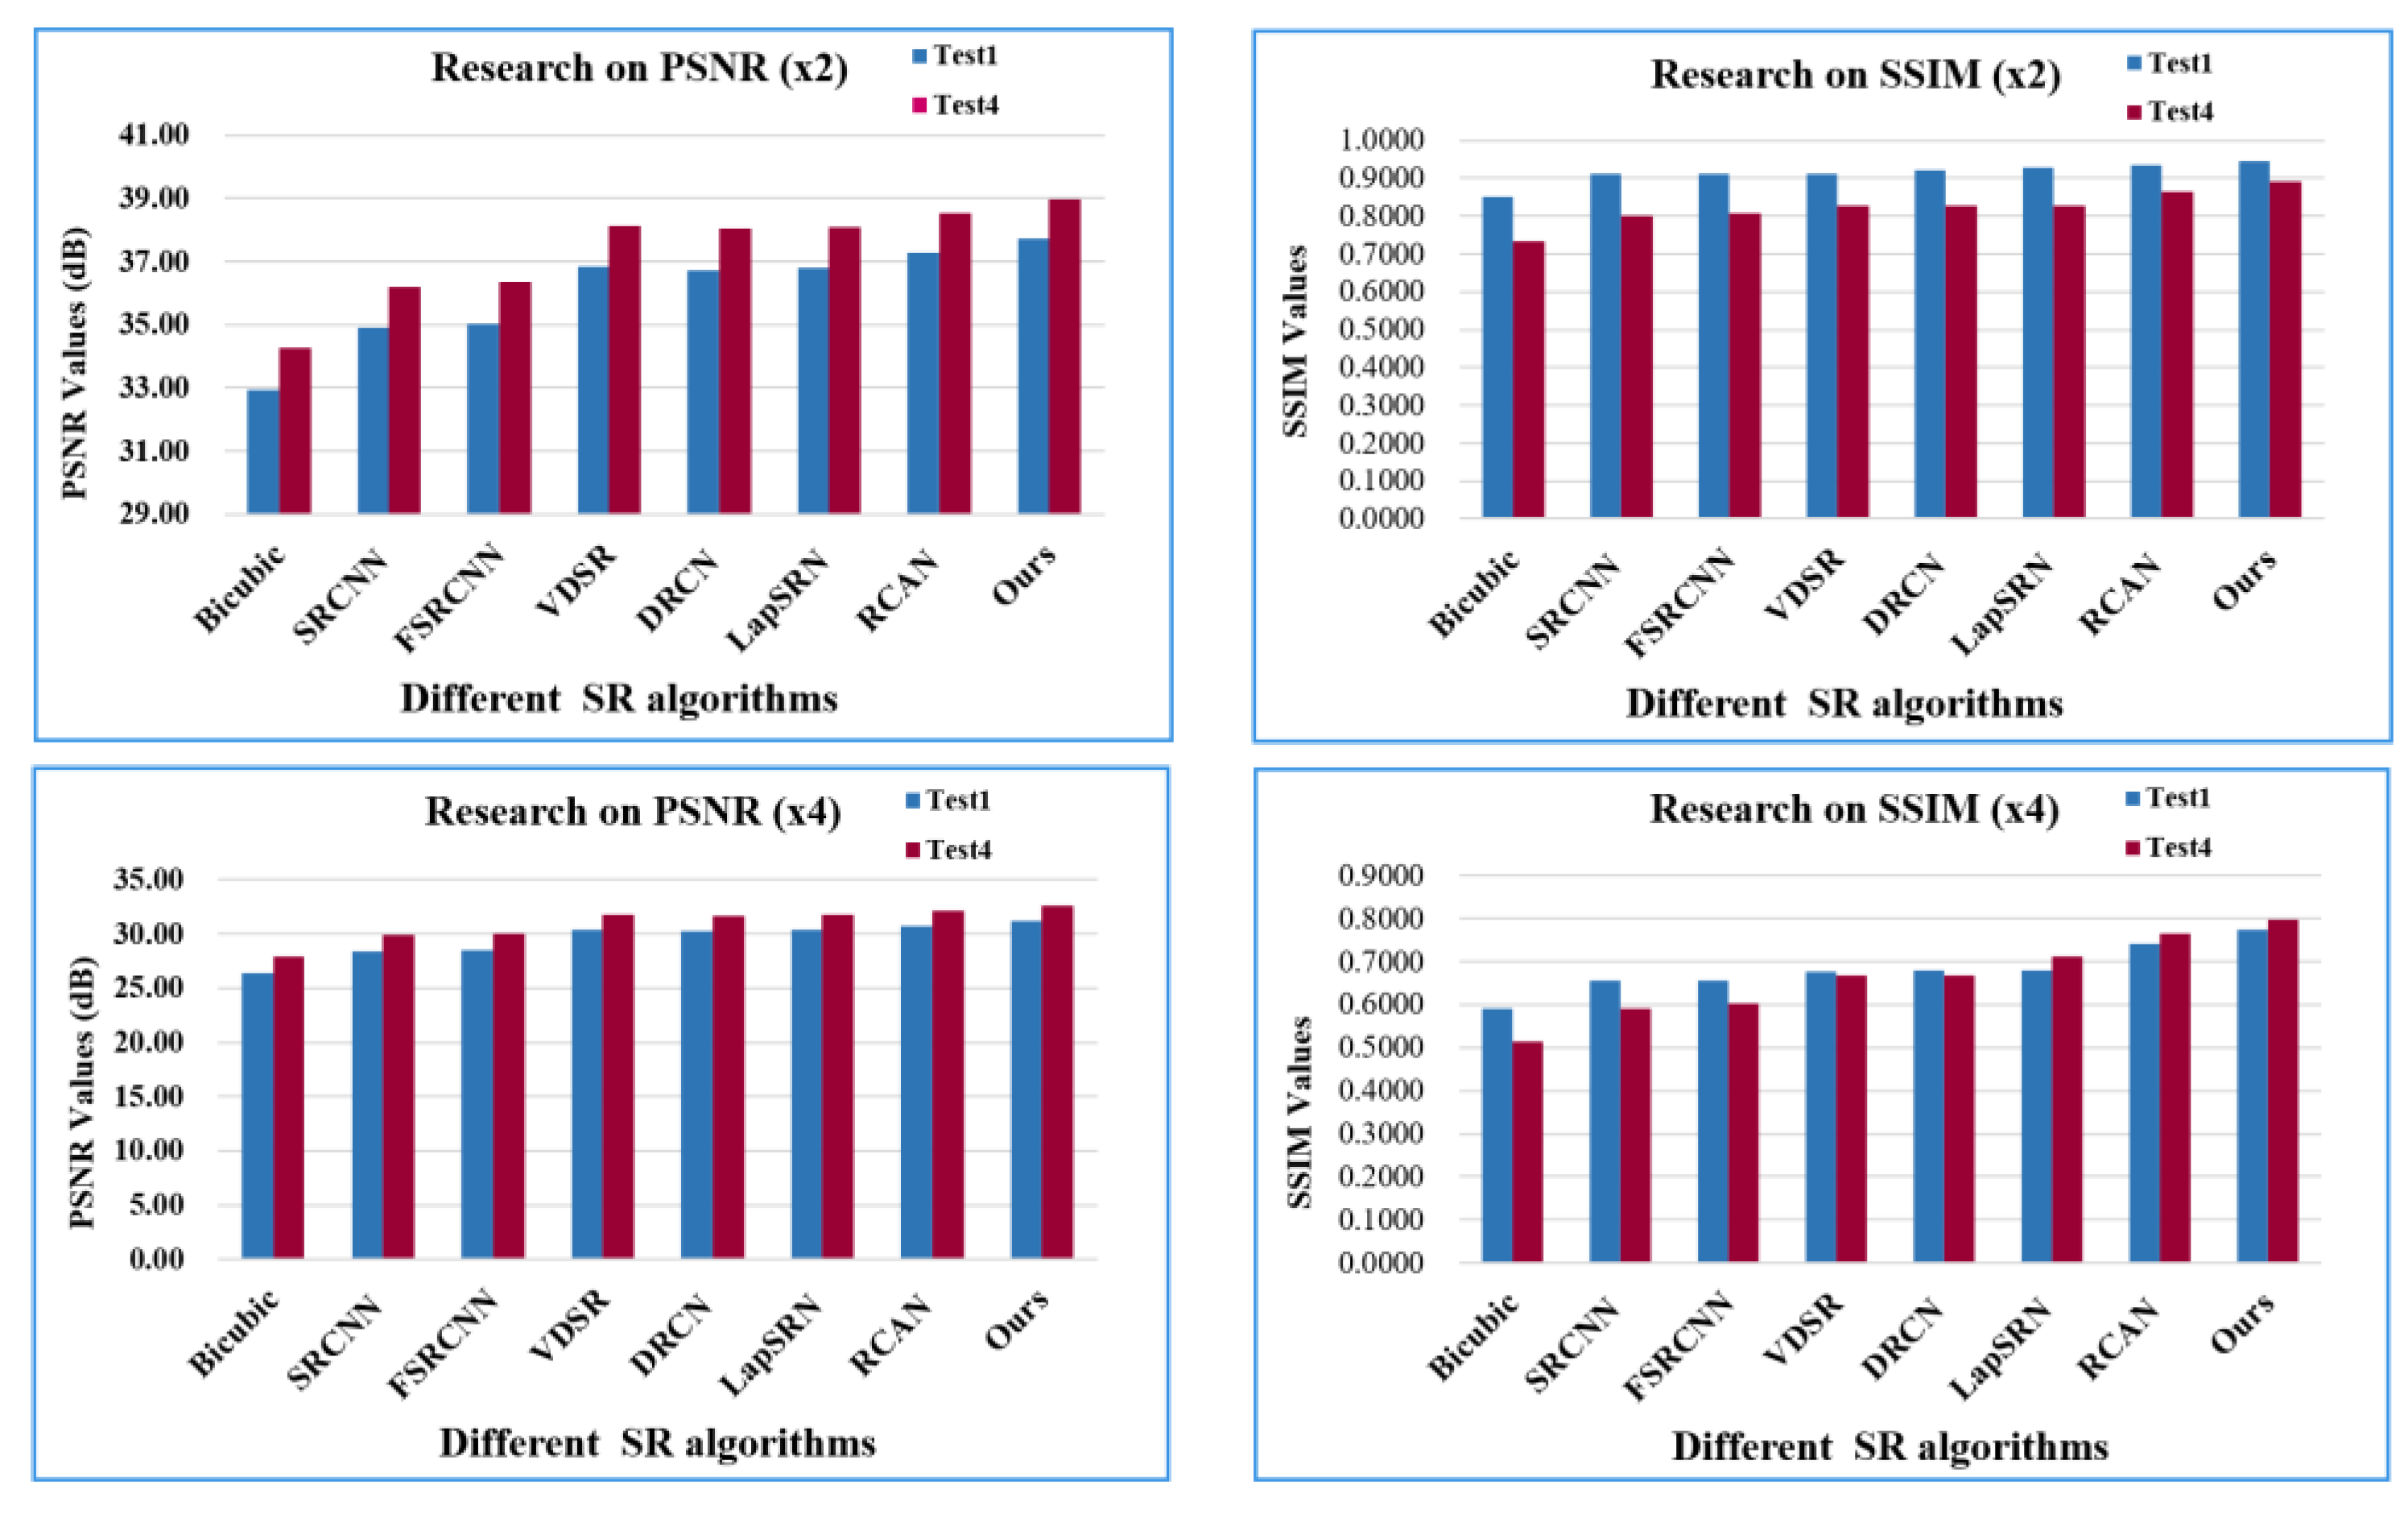
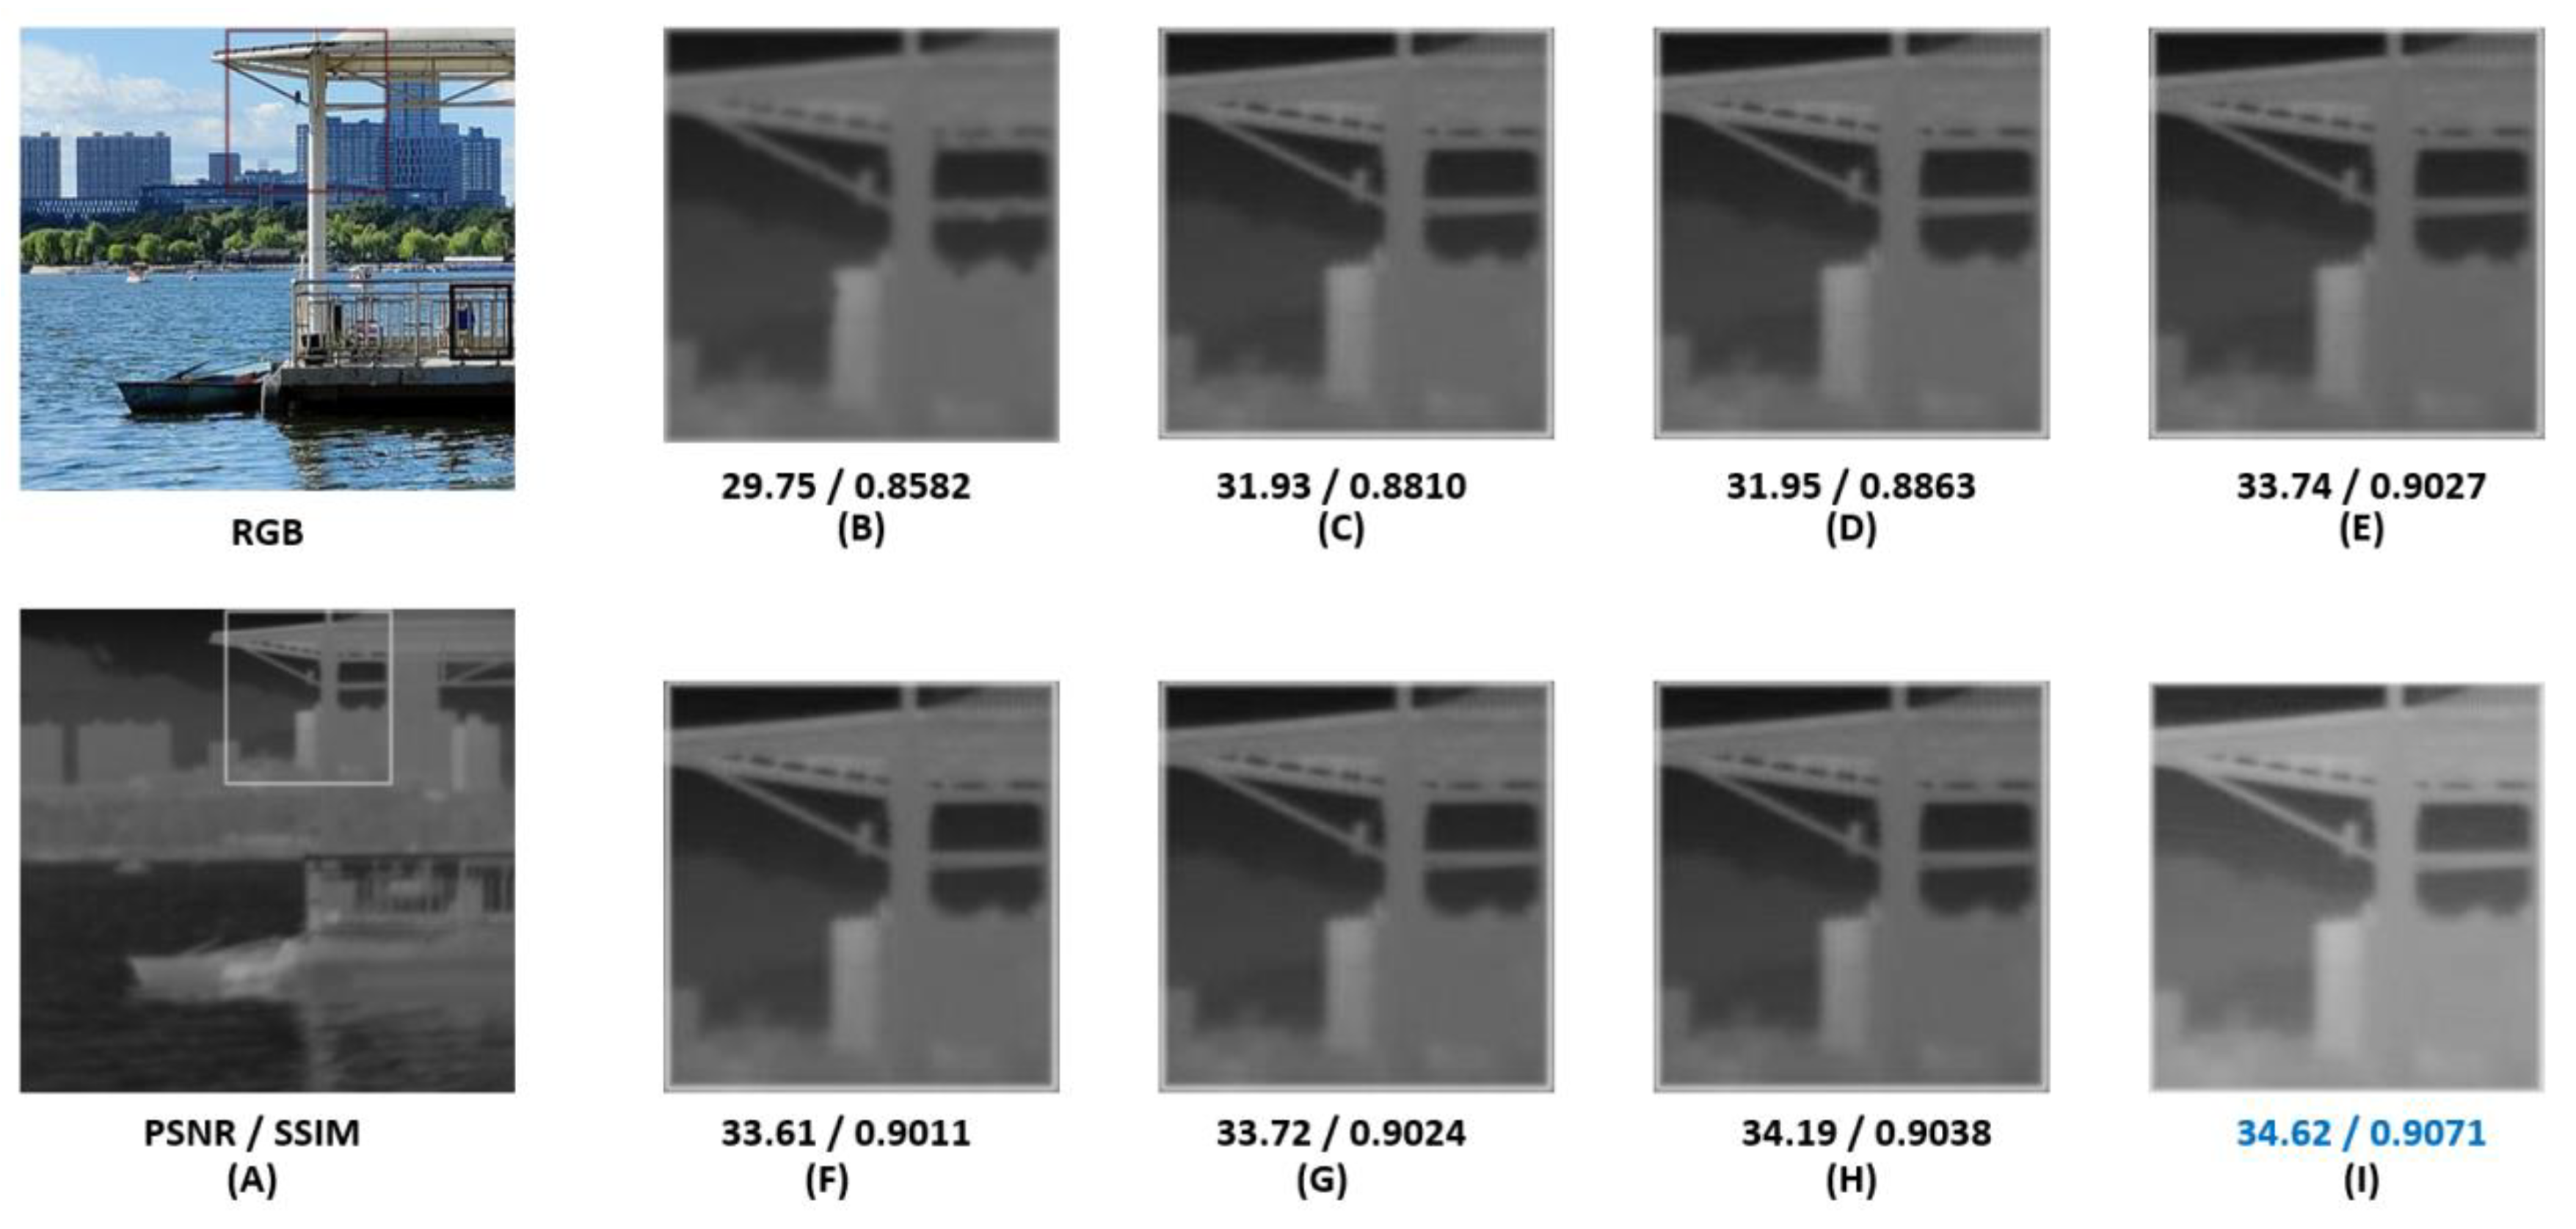
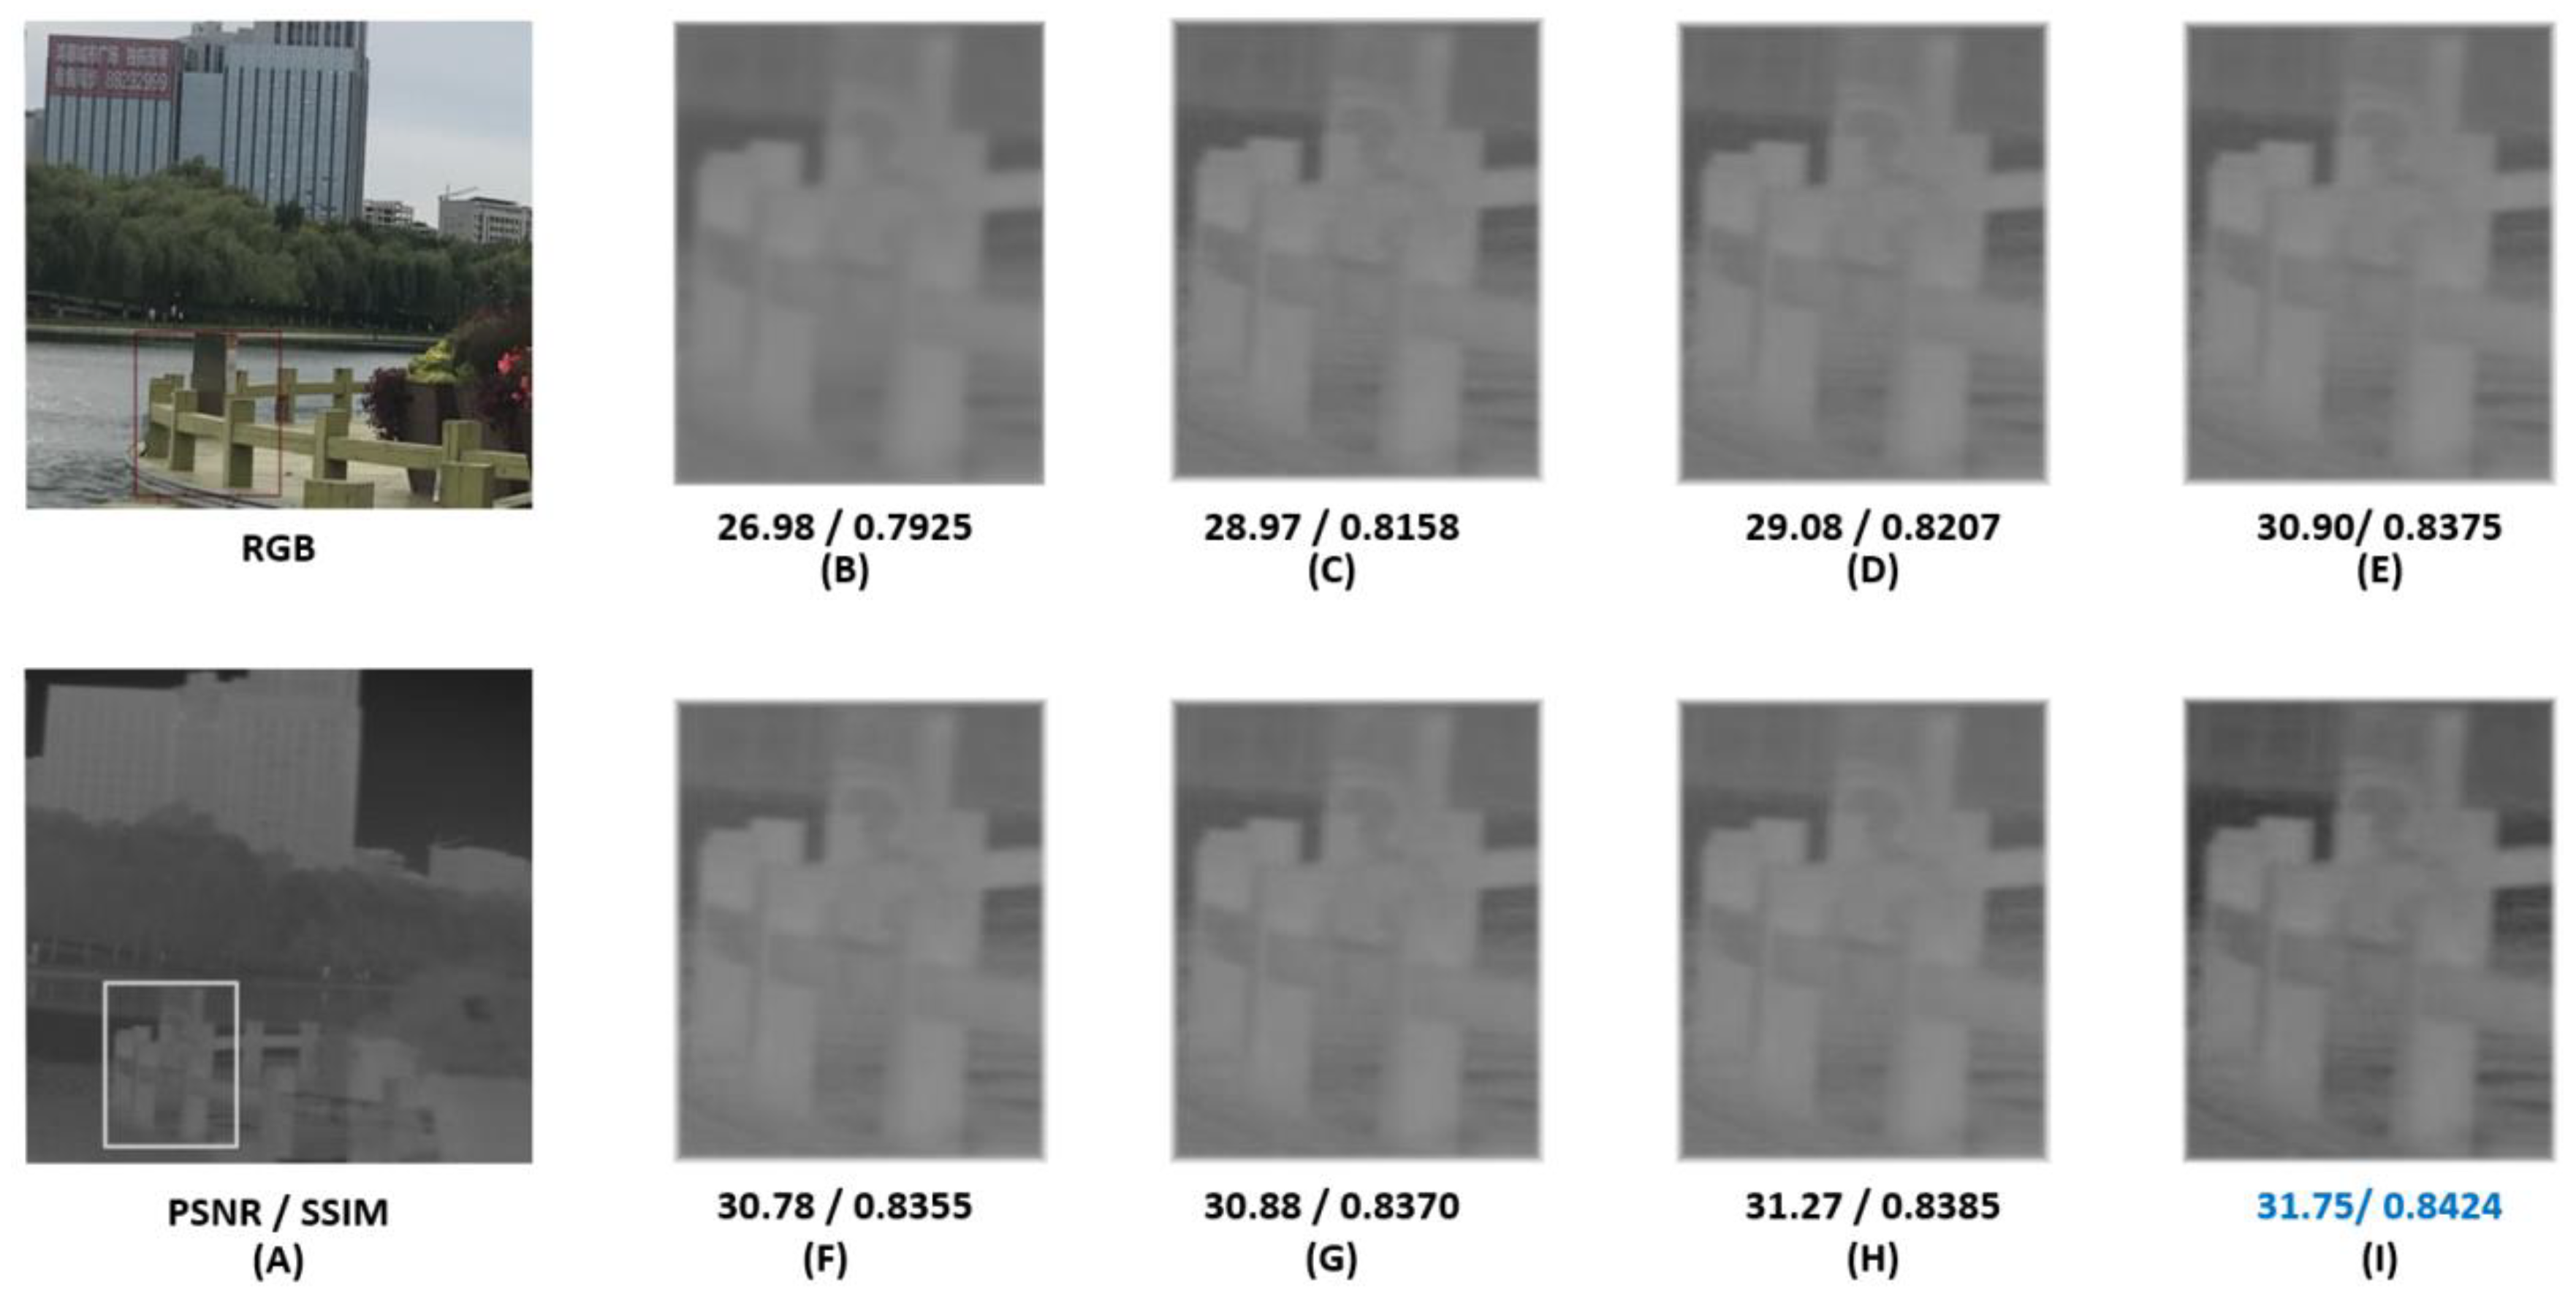
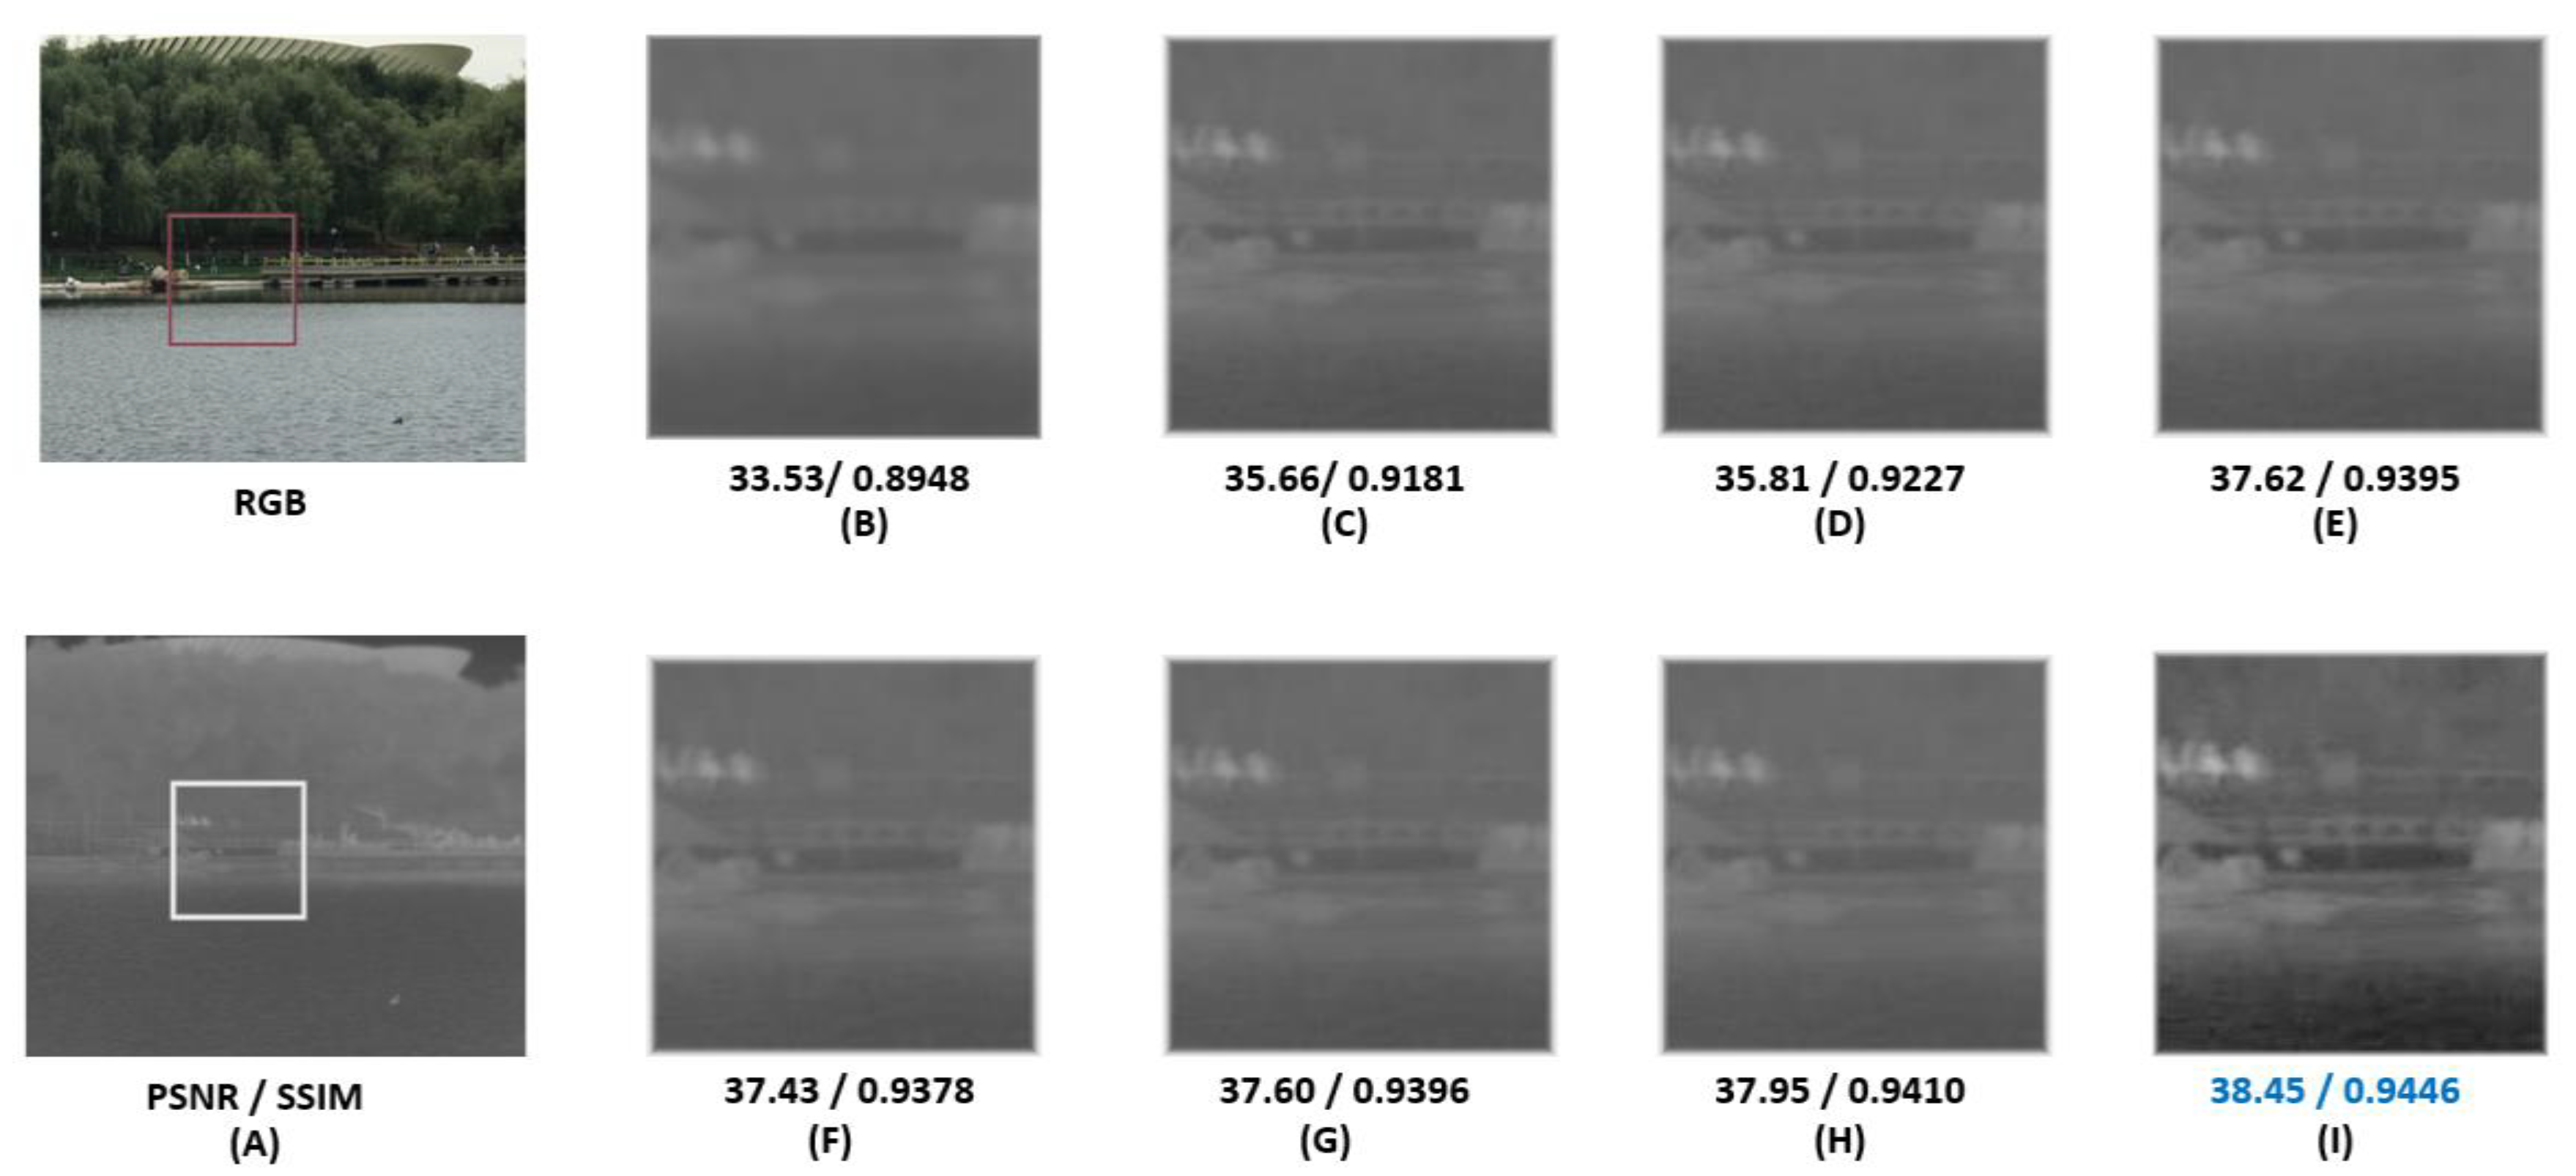
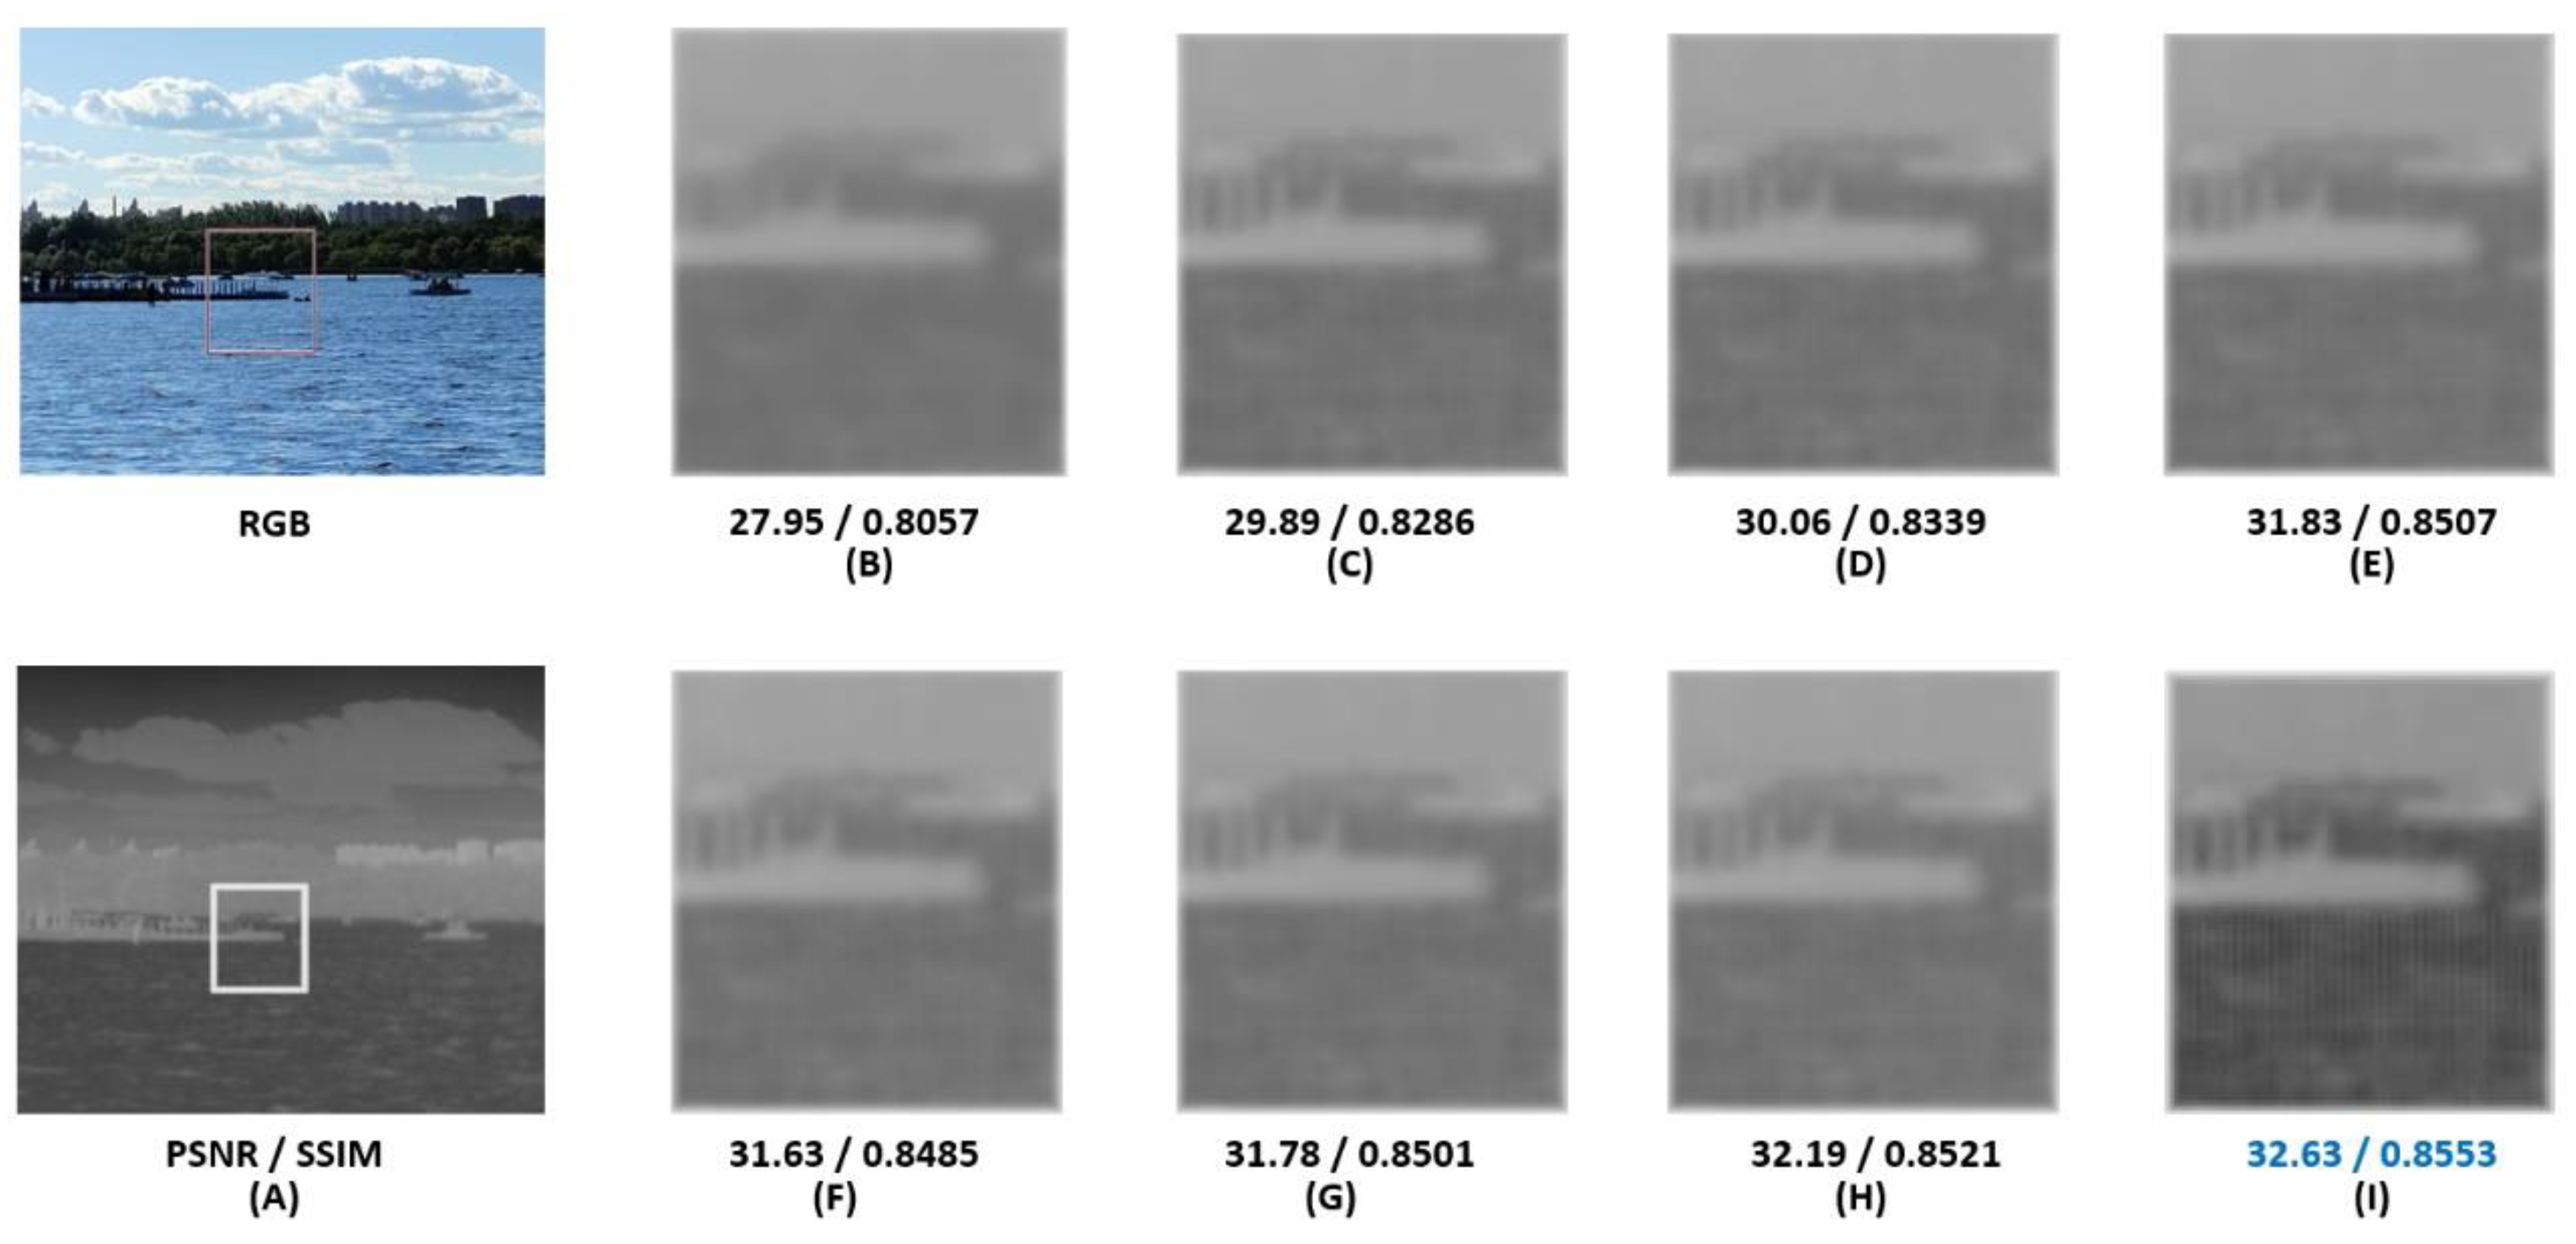
4.3. Experimental Comparison

We use the remain 100 self-built datasets as experimental data, and we divide them into four groups of test1, test2, test3, and test4, which contain 10, 15, 25, and 50 pairs of pictures respectively. We also compare the subjective vision and objective quality with the existing super-resolution algorithms SRCNN [4], FSRCNN [5], VDSR [6], DRCN [7], LapSRN [8], RCAN [9]. Before making comparison, we analyze the relevant algorithm network structure, as shown in Table 2, which provides a clear list of the input, depth, residual structure and loss function for each of the algorithm network.
In order to quantitatively analyze the super separation performance of each method, the peak signal to noise ratio (PSNR) [31] and structural similarity (SSIM) [32] were used as evaluation indicators for comparison on the selected experimental data test1, test2, test3 and test4 respectively. The inputs of the model are the test1 experimental data magnified by two, three and four times. The calculated PSNR average results are 37.73 dB, 34.63 dB and 31.15 dB, and the SSIM average results are 0.9349, 0.9075 and 0.8243. Using the same method, experiments are also conducted on experimental data test2, test3, and test4, where the overall end results are then placed together with other results obtained from using advanced super-resolution algorithms such as SRCNN [4], FSRCNN [5], VDSR [6], DRCN [7], LapSRN [8], RCAN [9] for comparison. The results of each method on the image in the figure are shown in the tables listed as below. As shown in Table 3, our algorithm has achieved better performance results compared to the other reconstruction algorithms mentioned above.
As shown in Table 3, when different magnification and experimental data combinations are used. Our algorithm is superior to six other advanced super-resolution algorithms in which the PSNR value of the proposed algorithm exceeds others. For the 2X test1 experimental data, the PSNR value generated is 0.45 dB higher than that generated by the RCAN and 0.91 dB higher than that generated by the LapSRN. For the test2 experimental data, the PSNR value generated by this algorithm is 0.84 dB higher than that generated by the VDSR and 2.79 dB higher than that generated by the SRCNN. It is obvious from Table 4 that when different magnification and experimental data are applied, the SSIM value generated by the algorithm in this paper is higher than that generated by the other six advanced super-resolution algorithms. For the 4X test3 experimental data, the SSIM value generated by our algorithm is 0.0065 higher than that generated by the DRCN and 0.0215 higher than that generated by the FSRCNN. For the test4 experimental data, the SSIM value generated by this algorithm is 0.0047 higher than that generated by the VDSR and 0.0263 higher than that generated by the SRCNN. Figure 9 shows the values of PSNR and SSIM when different methods are applied under a 2X and 4X of test1 and test4 experimental data, which directly indicates that our algorithm has outperformed others.

4.4. Experimental Analysis

We analyze the above algorithm from the perspective of sensory effects. As shown in Figure 10, Figure 11, Figure 12 and Figure 13, we again compare our proposed method with the six existing methods. Based on the obtained results, our method is capable to clearly reconstruct the textures, lines and edges of the infrared image, thus improving the image quality. The experimental results of enlarging the “dock” picture three times in the test1 are shown in Figure 10. The image recovered by our method shows a better visual experience, and the background clarity is also improved. More specifically, the gap between the pavilions and railings on the wharf is clearly visible. The glossiness and smoothness of the columns in the figure are also significantly improved, and the clouds and buildings in the distance are also nicely recovered. In contrast, other algorithms have more or less deficiencies and unsatisfactory aspects in reconstruction.
Figure 11 shows the experimental results obtained from the “platform” picture using test2 data that are magnified by 4×. The image restored by our method is closer to the real image. The lines and edges of the fence on the platform are clearly visible. The restoration effect of the SRCNN algorithm is obviously blurred, and the images restored by the LapSRN and the RCAN algorithms are too rigid in terms of contours and lines.
Figure 12 shows the results of the experiment obtained from the “bridge” picture using the test3 data that are magnified by 2×. The DRCN and the VDSR algorithms unable to restore the bridge frame line, or even to see the details and contours clearly, while the SRCNN, the FSRCNN and other algorithms distort the edges of marks. Our method can restore clear frame lines and visible edges of the bridge, as the silhouette behind the bridge looks more intuitive.
Figure 13 shows the results of the experiment obtained from the “bay” picture using test4 data that are at 4× magnification. The edges, corners and cylinders recovered by our method are closer to the real images, the recovered infrared image can clearly see the gap and number of fences, and the ship behind the dock can also be clearly displayed. The results provide strong evidence for our real-time marine monitoring and identification of targets. while other algorithms (such as DRCN and FSRCNN) cannot reconstruct fence lines and gaps.

5. Conclusions

The main contributions of this paper are as follows: (1) We designed and processed a medium and long wave infrared imaging optical system to increase the sharpness of infrared images. New infrared optical materials are used and crafted using single point diamond turning technology. The system can provide simple, portable and powerful focusing ability using the large relative aperture equipped, and output experimental data to support our further modeling design. (2) For achieving a clear result, we also proposed a super-resolution network algorithm, which inputs paired infrared and visible image simultaneously, utilizes deep learning to train a network model, which is capable to perform feature extraction, data fusion, and infrared image reconstruction by adding edge, texture and other visible light details. Our experiments results have proven that our method is effective, towards solving the problem of low resolution of optical infrared imaging in the marine environment. Practically, this research adds tremendous values in terms of building an infrared feature characterization model for typical marine targets in a complex marine background, creating breakthroughs in basic theory and key technology in the generation, transmission, reconstruction and interpretation of multi-dimensional characteristics of images, and realizing the control of oil spills and species, red tide biomass and dominant species by accurately identifying and inversing information such as the depth and speed of underwater vehicles, and ultimately, improving the recognition ability of marine military targets.

Author Contributions

Z.R.: Conceptualization, Methodology and Editing. J.Z.: Supervision and Review. C.W.: Validation. X.M.: Testing and Review. Y.L.: Training and Testing. P.W.: Writing, Editing and Software. All authors have read and agreed to the published version of the manuscript.

Funding

This research was funded by the 2022 International Cooperation Project in Jilin Province Science and Technology Department grant number [20220402014GH], the Science and Technology Re-search Project in Jilin Provincial Department of Education grant number [JJKH20220774KJ], the Open Fund Project of the State Key Laboratory of Applied Optics grant number [SKLAO2022001A07], the Natural Science Foundation of Jilin Province grant number [YDZJ202201ZYTS411].

Informed Consent Statement

Informed consent was obtained from all subjects involved in the study.

Data Availability Statement

The dataset can be downloaded at the website: https://pan.baidu.com/s/1zUvWmDlhh5vsGiv_0M8h9A (accessed on 19 April 2022), password: a3r0.

Conflicts of Interest

No potential conflict of interest was reported by the authors. The authors declare that they have no known competing financial interests or personal relationships that could have appeared to influence the work reported in this paper. The dataset can be downloaded at the website: https://pan.baidu.com/s/1zUvWmDlhh5vsGiv_0M8h9A (accessed on 19 April 2022), password: a3r0.

References

  1. He, X.-G.; Wu, X.-M.; Wang, L.; Liang, Q.-Y.; Gu, L.-J.; Liu, F.; Lu, H.-L.; Zhang, Y.; Zhang, M. Distributed optical fiber acoustic sensor for in situ monitoring of marine natural gas hydrates production for the first time in the Shenhu Area. China Geol. 2022, 5, 322–329. [Google Scholar] [CrossRef]
  2. Zhang, R.; Hong, W.; Wang, X.; Su, J. Color Fusion Method of Infrared Medium and Long Wave Images Based on Helix Mapping of Differential Features. Prog. Laser Optoelectron. 2022, 59, 4. [Google Scholar] [CrossRef]
  3. Yang, W.; Zhang, X.; Tian, Y.; Wang, W.; Xue, J.H.; Liao, Q. Deep learning for single image super-resolution: A brief review. IEEE Trans. Multimed. 2019, 21, 3106–3121. [Google Scholar] [CrossRef] [Green Version]
  4. Dong, C.; Loy, C.C.; He, K.; Tang, X. Learning a deep convolutional network for image super-resolution. In European Conference on Computer Vision; Springer: Cham, Switzerland, 2014; pp. 184–199. [Google Scholar]
  5. Dong, C.; Loy, C.C.; Tang, X. Accelerating the super-resolution convolutional neural network. In European Conference on Computer Vision; Springer: Cham, Switzerland, 2016; pp. 391–407. [Google Scholar]
  6. Kim, J.; Lee, J.K.; Lee, K.M. Accurate image super-resolution using very deep convolutional networks. In Proceedings of the IEEE Conference on Computer Vision and Pattern Recognition, Las Vegas, NV, USA, 27–30 June 2016; pp. 1646–1654. [Google Scholar]
  7. Kim, J.; Lee, J.K.; Lee, K.M. Deeply-Recursive convolutional network for image super-resolution. In Proceedings of the IEEE Conference on Computer Vision and Pattern Recognition, Las Vegas, NV, USA, 27–30 June 2016; pp. 1637–1645. [Google Scholar]
  8. Lai, W.S.; Huang, J.B.; Ahuja, N.; Yang, M.H. Deep Laplacian pyramid networks for fast and accurate super-resolution. In Proceedings of the IEEE Conference on Computer Vision and Pattern Recognition, Honolulu, HI, USA, 21–26 July 2017; pp. 624–632. [Google Scholar]
  9. Zhang, Y.; Li, K.; Li, K.; Wang, L.; Zhong, B.; Fu, Y. Image super-resolution using very deep residual channel attention networks. In Proceedings of the European Conference on Computer Vision, Munich, Germany, 8–14 September 2018; pp. 286–301. [Google Scholar]
  10. Wang, C.; Zhang, Y.; Jiang, H.L.; Li, Y.C.; Jiang, L.; Fu, Q.; Han, L. Research Status and Progress of Super Resolution Imaging Methods. Laser Infrared 2017, 7, 791–798. [Google Scholar] [CrossRef]
  11. Hu, J.; Shen, L.; Sun, G. Squeeze and excitation networks. In Proceedings of the IEEE Conference on Computer Vision and Pattern Recognition, Salt Lake City, UT, USA, 18–23 June 2018; pp. 7132–7141. [Google Scholar]
  12. Sakai, Y.; Lu, H.; Tan, J.K.; Kim, H. Recognition of surrounding environment from electric wheelchair videos based on modified YOLOv2. Future Gener. Comput. Syst. 2019, 92, 161. [Google Scholar] [CrossRef]
  13. Xiang, L.; Yang, S.; Liu, Y.; Li, Q.; Zhu, C. Novel linguistic steganography based on character-level text generation. Mathematics 2020, 8, 1558. [Google Scholar] [CrossRef]
  14. Chen, Y.; Liu, L.; Tao, J.; Xia, R.; Zhang, Q.; Yang, K.; Xiong, J.; Chen, X. The improved image inpainting algorithm via encoder and similarity constraint. Vis. Comput. 2020, 37, 1691–1705. [Google Scholar] [CrossRef]
  15. He, S.; Li, Z.; Wang, J.; Xiong, N.N. Intelligent detection for key performance indicators in industrial based cyber-physical systems. IEEE Trans. Ind. Inform. 2020, 17, 5799–5809. [Google Scholar] [CrossRef]
  16. Lu, W.; Zhang, Y.; Wang, S.; Huang, H.; Liu, Q.; Luo, S. Concept representation by learning explicit and implicit concept couplings. IEEE Intell. Syst. 2020, 36, 6–15. [Google Scholar] [CrossRef]
  17. Chen, Y.; Phonevilay, V.; Tao, J.; Chen, X.; Xia, R.; Zhang, Q.; Yang, K.; Xiong, J.; Xie, J. The face image super-resolution algorithm based on combined representation learning. Multimed. Tools Appl. 2020, 80, 30839–30861. [Google Scholar] [CrossRef]
  18. Shi, W.; Caballero, J.; Huszár, F.; Totz, J.; Aitken, A.P.; Bishop, R.; Rueckert, D.; Wang, Z. Real-time single image and video super-resolution using an efficient sub-pixel convolutional neural network. In Proceedings of the 2016 IEEE Conference on Computer Vision and Pattern Recognition (CVPR), Las Vegas, NV, USA, 27–30 June 2016; pp. 1874–1883. [Google Scholar]
  19. Zhang, P.; Lam Edmund, Y. Efficient Dual Attention Mechanism for Single Image Super-Resolution. Inst. Electr. Electron. Eng. 2021, 114, 957–964. [Google Scholar] [CrossRef]
  20. Tong, T.; Li, G.; Liu, X.; Gao, Q. Image super resolution using dense skip connections. In Proceedings of the 2017 IEEE International Conference on Computer Vision, Venice, Italy, 22–29 October 2017; pp. 4809–4817. [Google Scholar]
  21. Lee, S.; Cho, M.S.; Jung, K.; Kim, J.H. Scene text extraction with edge constraint and text collinearity. In Proceedings of the 20th International Conference on Pattern Recognition, Washington, DC, USA, 23–26 August 2010; pp. 3983–3986. [Google Scholar]
  22. Morris, N.J.; Avidan, S.; Matusik, W.; Pfister, H. Statistics of infrared images. In Proceedings of the 2007 IEEE Conference on Computer Vision and Pattern Recognition, Minneapolis, MN, USA, 17–22 June 2007; pp. 1–7. [Google Scholar]
  23. Yang, X.; Xie, T.; Liu, L.; Zhou, D. Image super-resolution reconstruction based on improved Dirac residual network. Multidimens. Syst. Signal Process. 2021, 32, 1065–1082. [Google Scholar] [CrossRef]
  24. Esmaeilzehi, A.; Ahmad, M.O.; Swamy, M.N.S. A Deep Light-Weight Network for Single Image Super Resolution Using Spatial and Spectral Information. IEEE Trans. Comput. 2021, 7, 409–421. [Google Scholar] [CrossRef]
  25. Wang, Y.; Perazzi, F.; McWilliams, B.; Sorkine-Hornung, A.; Sorkine-Hornung, O.; Schroers, C. A fully progressive approach to single-image super-resolution. In Proceedings of the IEEE Conference on Computer Vision and Pattern Recognition (CVPR), Salt Lake City, UT, USA, 17–22 June 2018; pp. 977–986. [Google Scholar]
  26. Srivastava, R.K.; Greff, K.; Schmidhuber, J. Training very deep networks. In Proceedings of the Advances in Neural Information Processing Systems, Montreal, QC, Canada, 7–12 December 2015; pp. 2377–2385. [Google Scholar]
  27. Chen, Y.; Liu, L.; Phonevilay, V.; Gu, K.; Xia, R.; Xie, J. Image super-resolution reconstruction based on feature map attention mechanism. Appl. Intell. 2021, 51, 4367–4380. [Google Scholar] [CrossRef]
  28. Soh, J.W.; Cho, S.; Cho, N.I. Meta-transfer learning for zero-shot super-resolution. In Proceedings of the IEEE Conference on Computer Vision and Pattern Recognition (CVPR), Seattle, WA, USA, 13–19 June 2020; pp. 3513–3522. [Google Scholar]
  29. Timofte, R.; Rothe, R.; Gool, L.V. Seven ways to improve example-based single image super resolution. In Proceedings of the IEEE Conference on Computer Vision and Pattern Recognition (CVPR), Las Vegas, NV, USA, 27–30 June 2016; pp. 1865–1873. [Google Scholar]
  30. Ren, Z.; Zhao, J.; Chen, C.; Lou, Y.; Ma, X.; Tao, P. Rendered image super-resolution reconstruction with multi-channel feature network. Sci. Program. 2022, 2022, 9393589. [Google Scholar] [CrossRef]
  31. Wang, Z.; Bovik, A.C.; Sheikh, H.R.; Simoncelli, E.P. Image quality assessment from error visibility to structural similarity. IEEE Trans. Image Process. 2004, 13, 600–612. [Google Scholar] [CrossRef] [PubMed] [Green Version]
  32. Sheikh, H.R.; Bovik, A.C.; De Veciana, G. An information fidelity criterion for image quality assessment using natural scene statistics. IEEE Trans. Image Process. 2005, 14, 2117–2128. [Google Scholar] [CrossRef] [PubMed]
Figure 1. Optical path diagram of wide band infrared system.
Applsci 12 10871 g001
Figure 2. Modulation transfer function.
Applsci 12 10871 g002
Figure 3. Spot diagram.
Applsci 12 10871 g003
Figure 4. Assembled wide band infrared lens.
Applsci 12 10871 g004
Figure 5. The architecture of the proposed network.
Applsci 12 10871 g005
Figure 6. Feature map attention mechanism.
Applsci 12 10871 g006
Figure 7. Dense connection module.
Applsci 12 10871 g007
Figure 8. The flow chart of experimental dataset acquisition.
Applsci 12 10871 g008
Figure 9. Compared results of the PSNR and SSIM on Test1 and Test4 datasets.
Applsci 12 10871 g009
Figure 10. Comparison of restored results on dock by different super-resolution methods (3×). (A) HR (B) Bicubic (C) SRCNN (D) FSRCNN (E) VDSR (F) DRCN (G) LapSRN (H) RCAN (I) Ours.
Applsci 12 10871 g010
Figure 11. Comparison of restored results on platform by different super-resolution methods (4×). (A) HR (B) Bicubic (C) SRCNN (D) FSRCNN (E) VDSR (F) DRCN (G) LapSRN (H) RCAN (I) Ours.
Applsci 12 10871 g011
Figure 12. Comparison of restored results on bridge by different super-resolution methods (4×). (A) HR (B) Bicubic (C) SRCNN (D) FSRCNN (E) VDSR (F) DRCN (G) LapSRN (H) RCAN (I) Ours.
Applsci 12 10871 g012
Figure 13. Comparison of restored results on bay by different super-resolution methods (×4). (A) HR (B) Bicubic (C) SRCNN (D) FSRCNN (E) VDSR (F) DRCN (G) LapSRN (H) RCAN (I) Ours.
Applsci 12 10871 g013
Table 1. Parameters of wide band infrared optical system.
ParameterIndex
wavelength3–12 μm
focal length30 mm
F\#0.9
Total length of optical system35 mm
detector resolution640 × 512
pixel size of detector 15 μm
Table 2. Structural analysis of SRCNN [4], FSRCNN [5], VDSR [6], DRCN [7], LapSRN [8], RCAN [9].
AlgorithmInputDepthResidual StructureReconstructionLoss
SRCNN [4]LR+Bicubic3no-L2
FSRCNN [5]LR8no-L2
VDSR [6]LR+Bicubic20yes-L2
DRCN [7]LR+Bicubic5no-L2
LapSRN [8]LR24yesProgressiveCharbonnier
Table 3. Average PSNR for different algorithms at Test1, Test2, Test3 and Test4 datasets.
DatasetScaleBicubicSRCNN [4]FSRCNN [5]VDSR [6]DRCN [7]LapSRN [8]RCAN [9]Ours
Test132.9334.9235.0536.8636.7136.8237.2837.73
Test233.2435.3335.4737.2837.1337.2537.6638.12
Test333.5635.6735.8237.6137.4437.5837.9938.44
Test434.2836.1936.3438.1238.0538.1038.5238.98
Test129.8231.8331.9633.7533.6233.7334.1834.63
Test230.5132.4932.6734.4134.2534.3734.8235.27
Test330.9532.9333.0534.7934.6334.7435.1735.61
Test431.4633.4333.5735.3835.2235.3635.7336.19
Test126.4528.4328.5630.3730.2330.3430.7031.15
Test226.9928.9829.1030.9130.7630.8731.2631.72
Test327.5329.5229.6631.4731.3231.4331.6132.06
Test427.9329.9130.0431.8231.6531.7732.1832.64
Table 4. Average SSIM for different algorithms at Test1, Test2, Test3 and Test4 datasets.
DatasetScaleBicubicSRCNN [4]FSRCNN [5]VDSR [6]DRCN [7]LapSRN [8]RCAN [9]Ours
Test10.88530.90870.91340.93020.92840.92990.93150.9349
Test20.88660.91000.91470.93150.92970.93120.93280.9362
Test30.89490.91830.92300.93980.93800.93950.94110.9445
Test40.89920.92260.92730.94410.94230.94380.94540.9488
Test10.85790.88130.88600.90280.90100.90250.90410.9075
Test20.86230.88560.89030.90710.90530.90680.90840.9118
Test30.86350.88710.89170.90850.90670.90820.90980.9132
Test40.88000.90320.90810.92490.92310.92460.92620.9296
Test10.77470.79820.80280.81960.81780.81930.82090.8243
Test20.79260.81590.82060.83740.83560.83710.83870.8421
Test30.80010.82360.82820.84500.84320.84470.84630.8497
Test40.80560.82890.83370.85050.84870.85020.85180.8552
Publisher’s Note: MDPI stays neutral with regard to jurisdictional claims in published maps and institutional affiliations.

