
Evaluation of Active Shoulder Exoskeleton Support to Deduce Application-Oriented Optimization Potentials for Overhead Work

 , , , , and
Abstract
1. Introduction
2. Materials and Methods
2.1. Participants
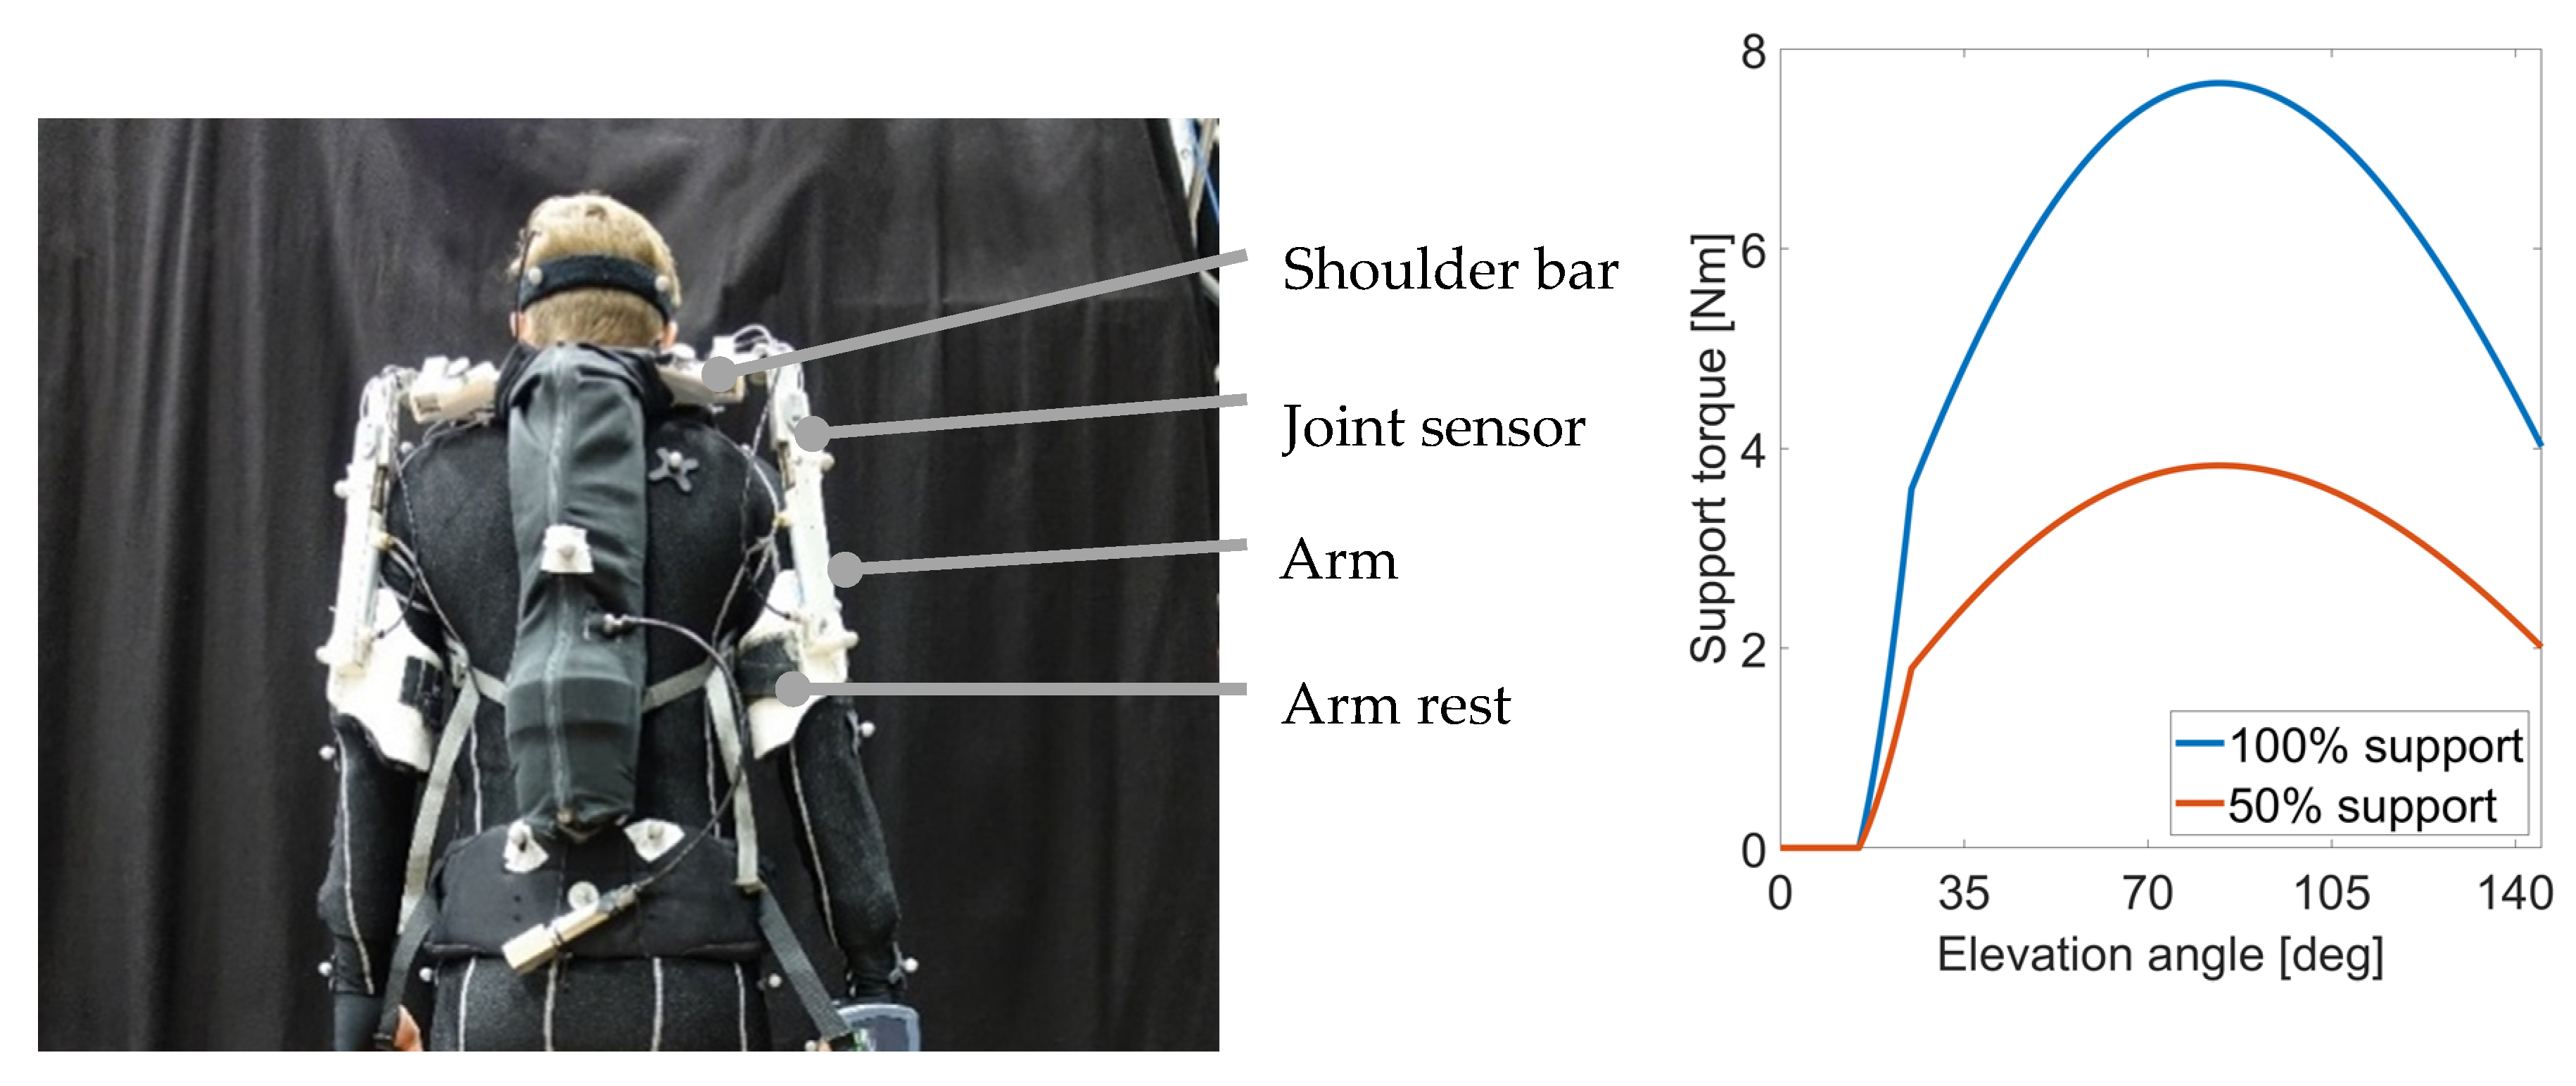
2.2. Test Apparatus
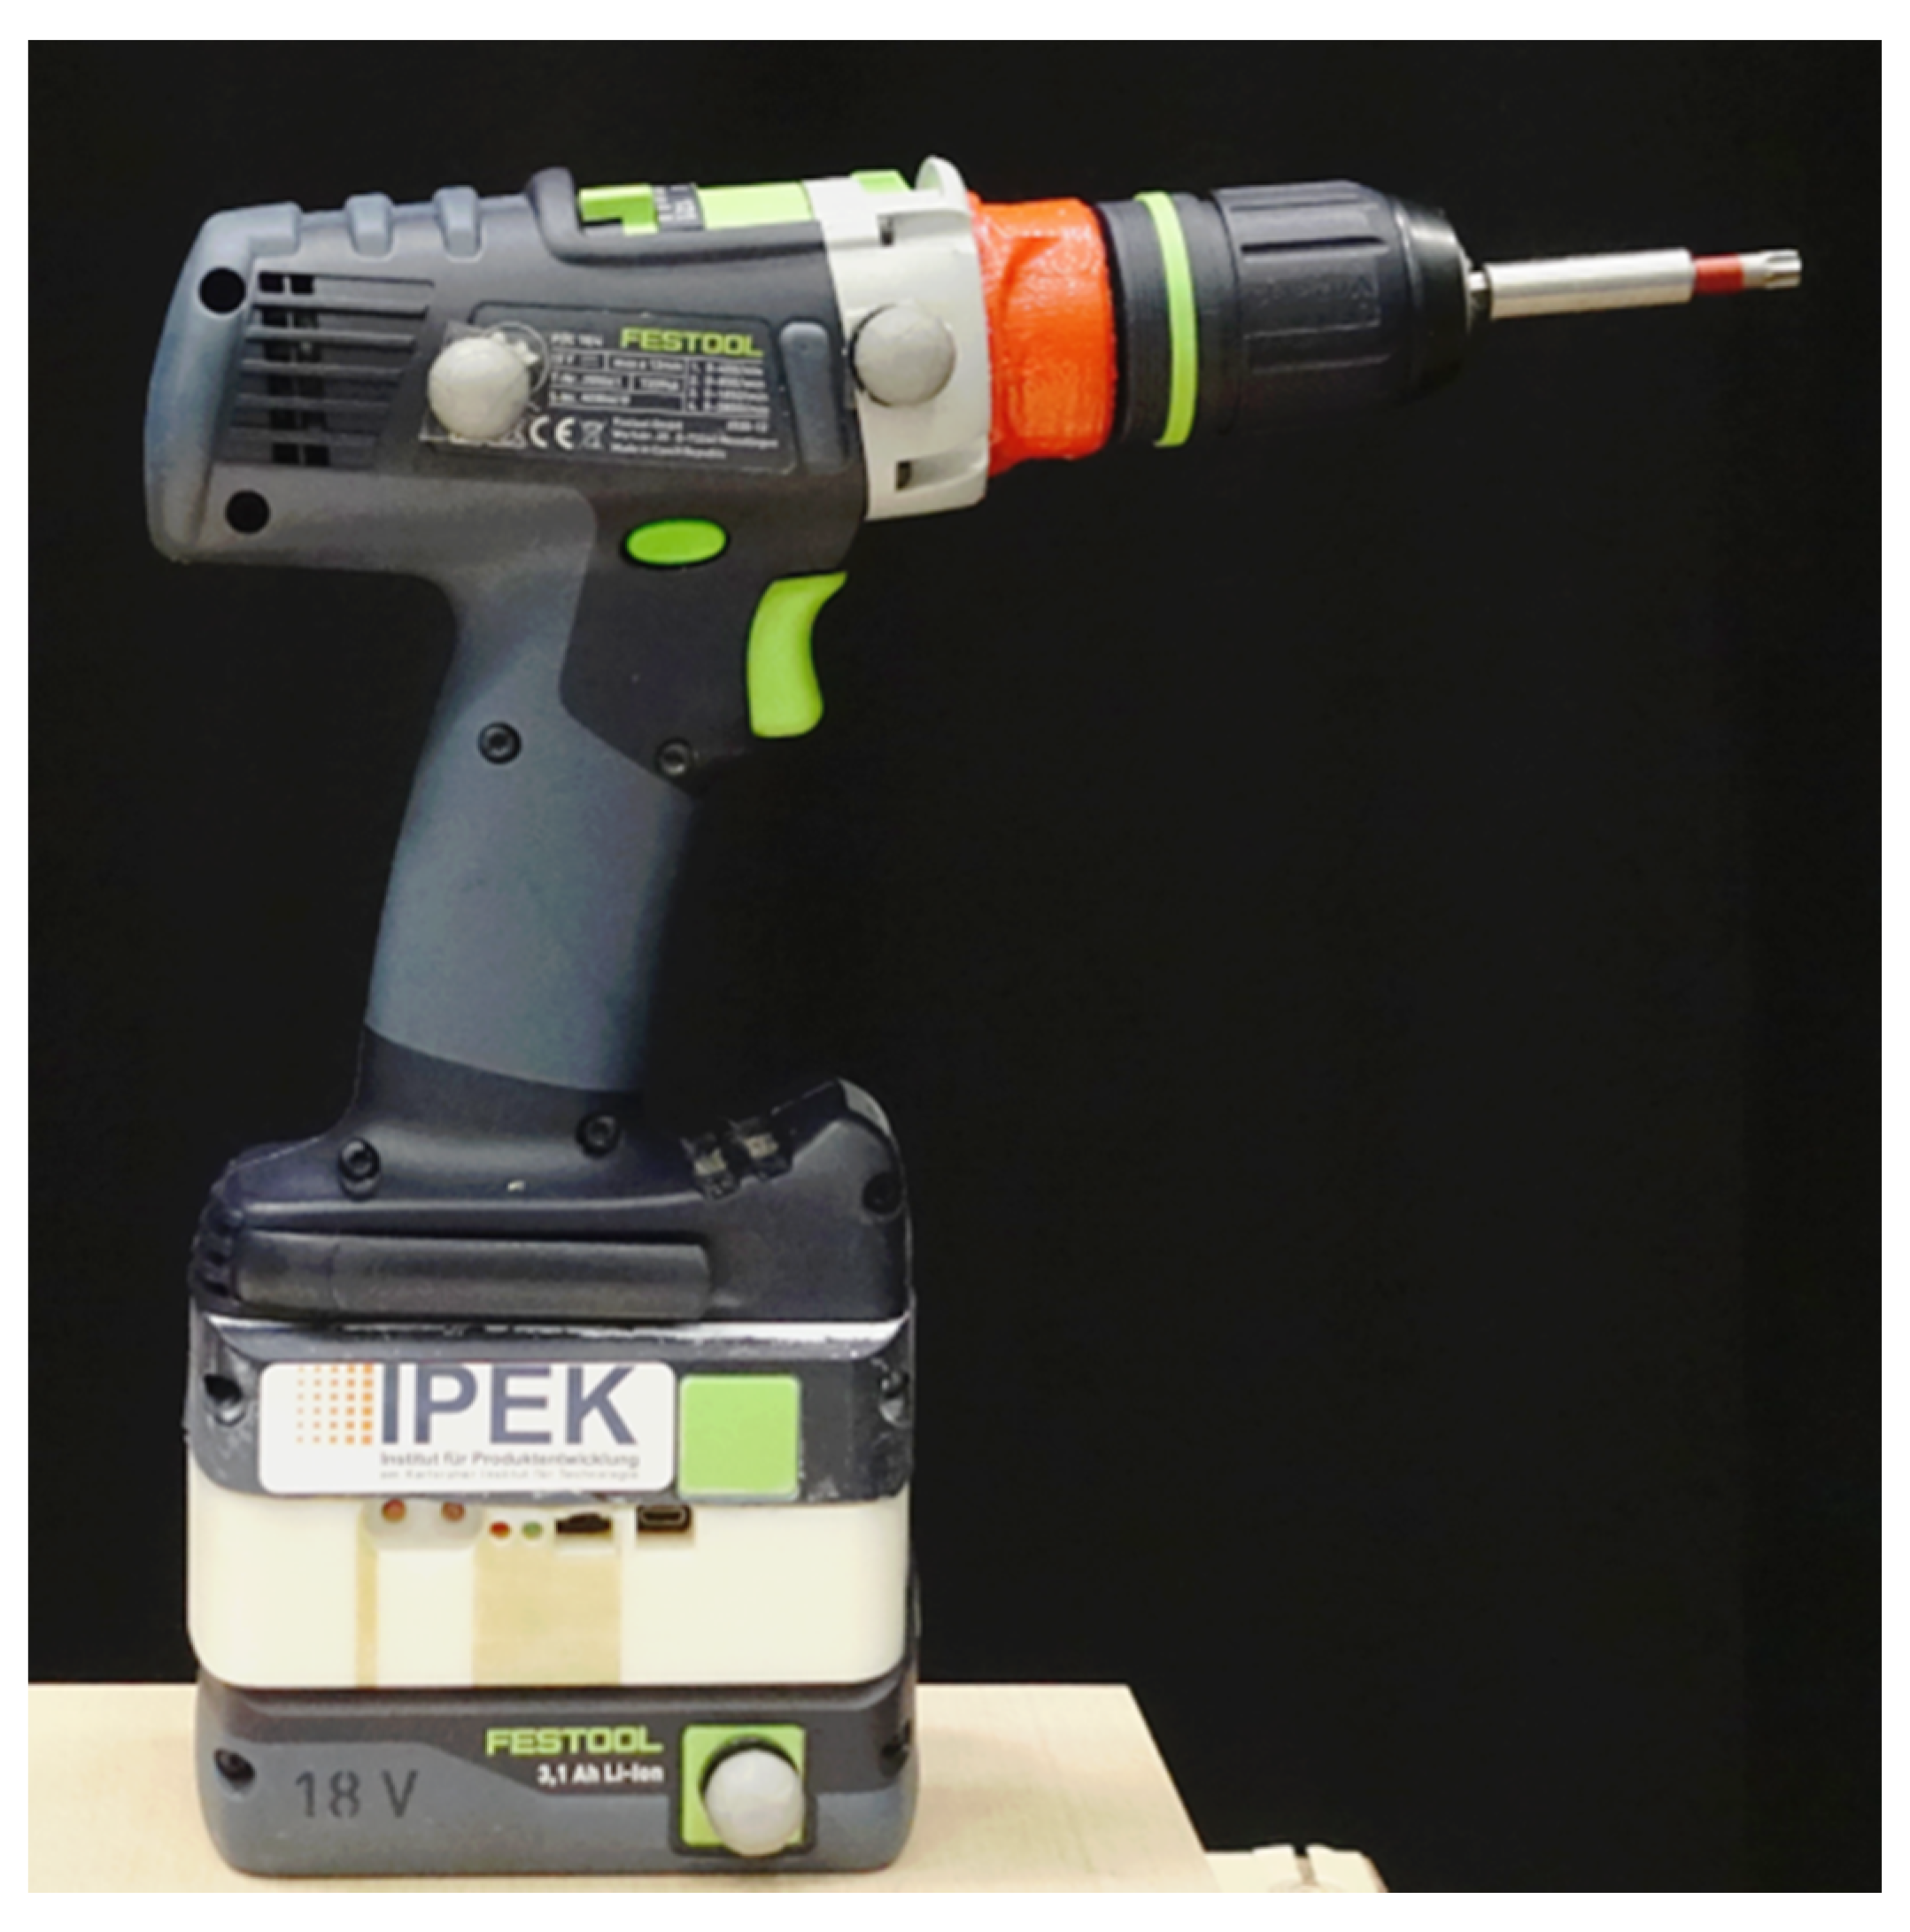
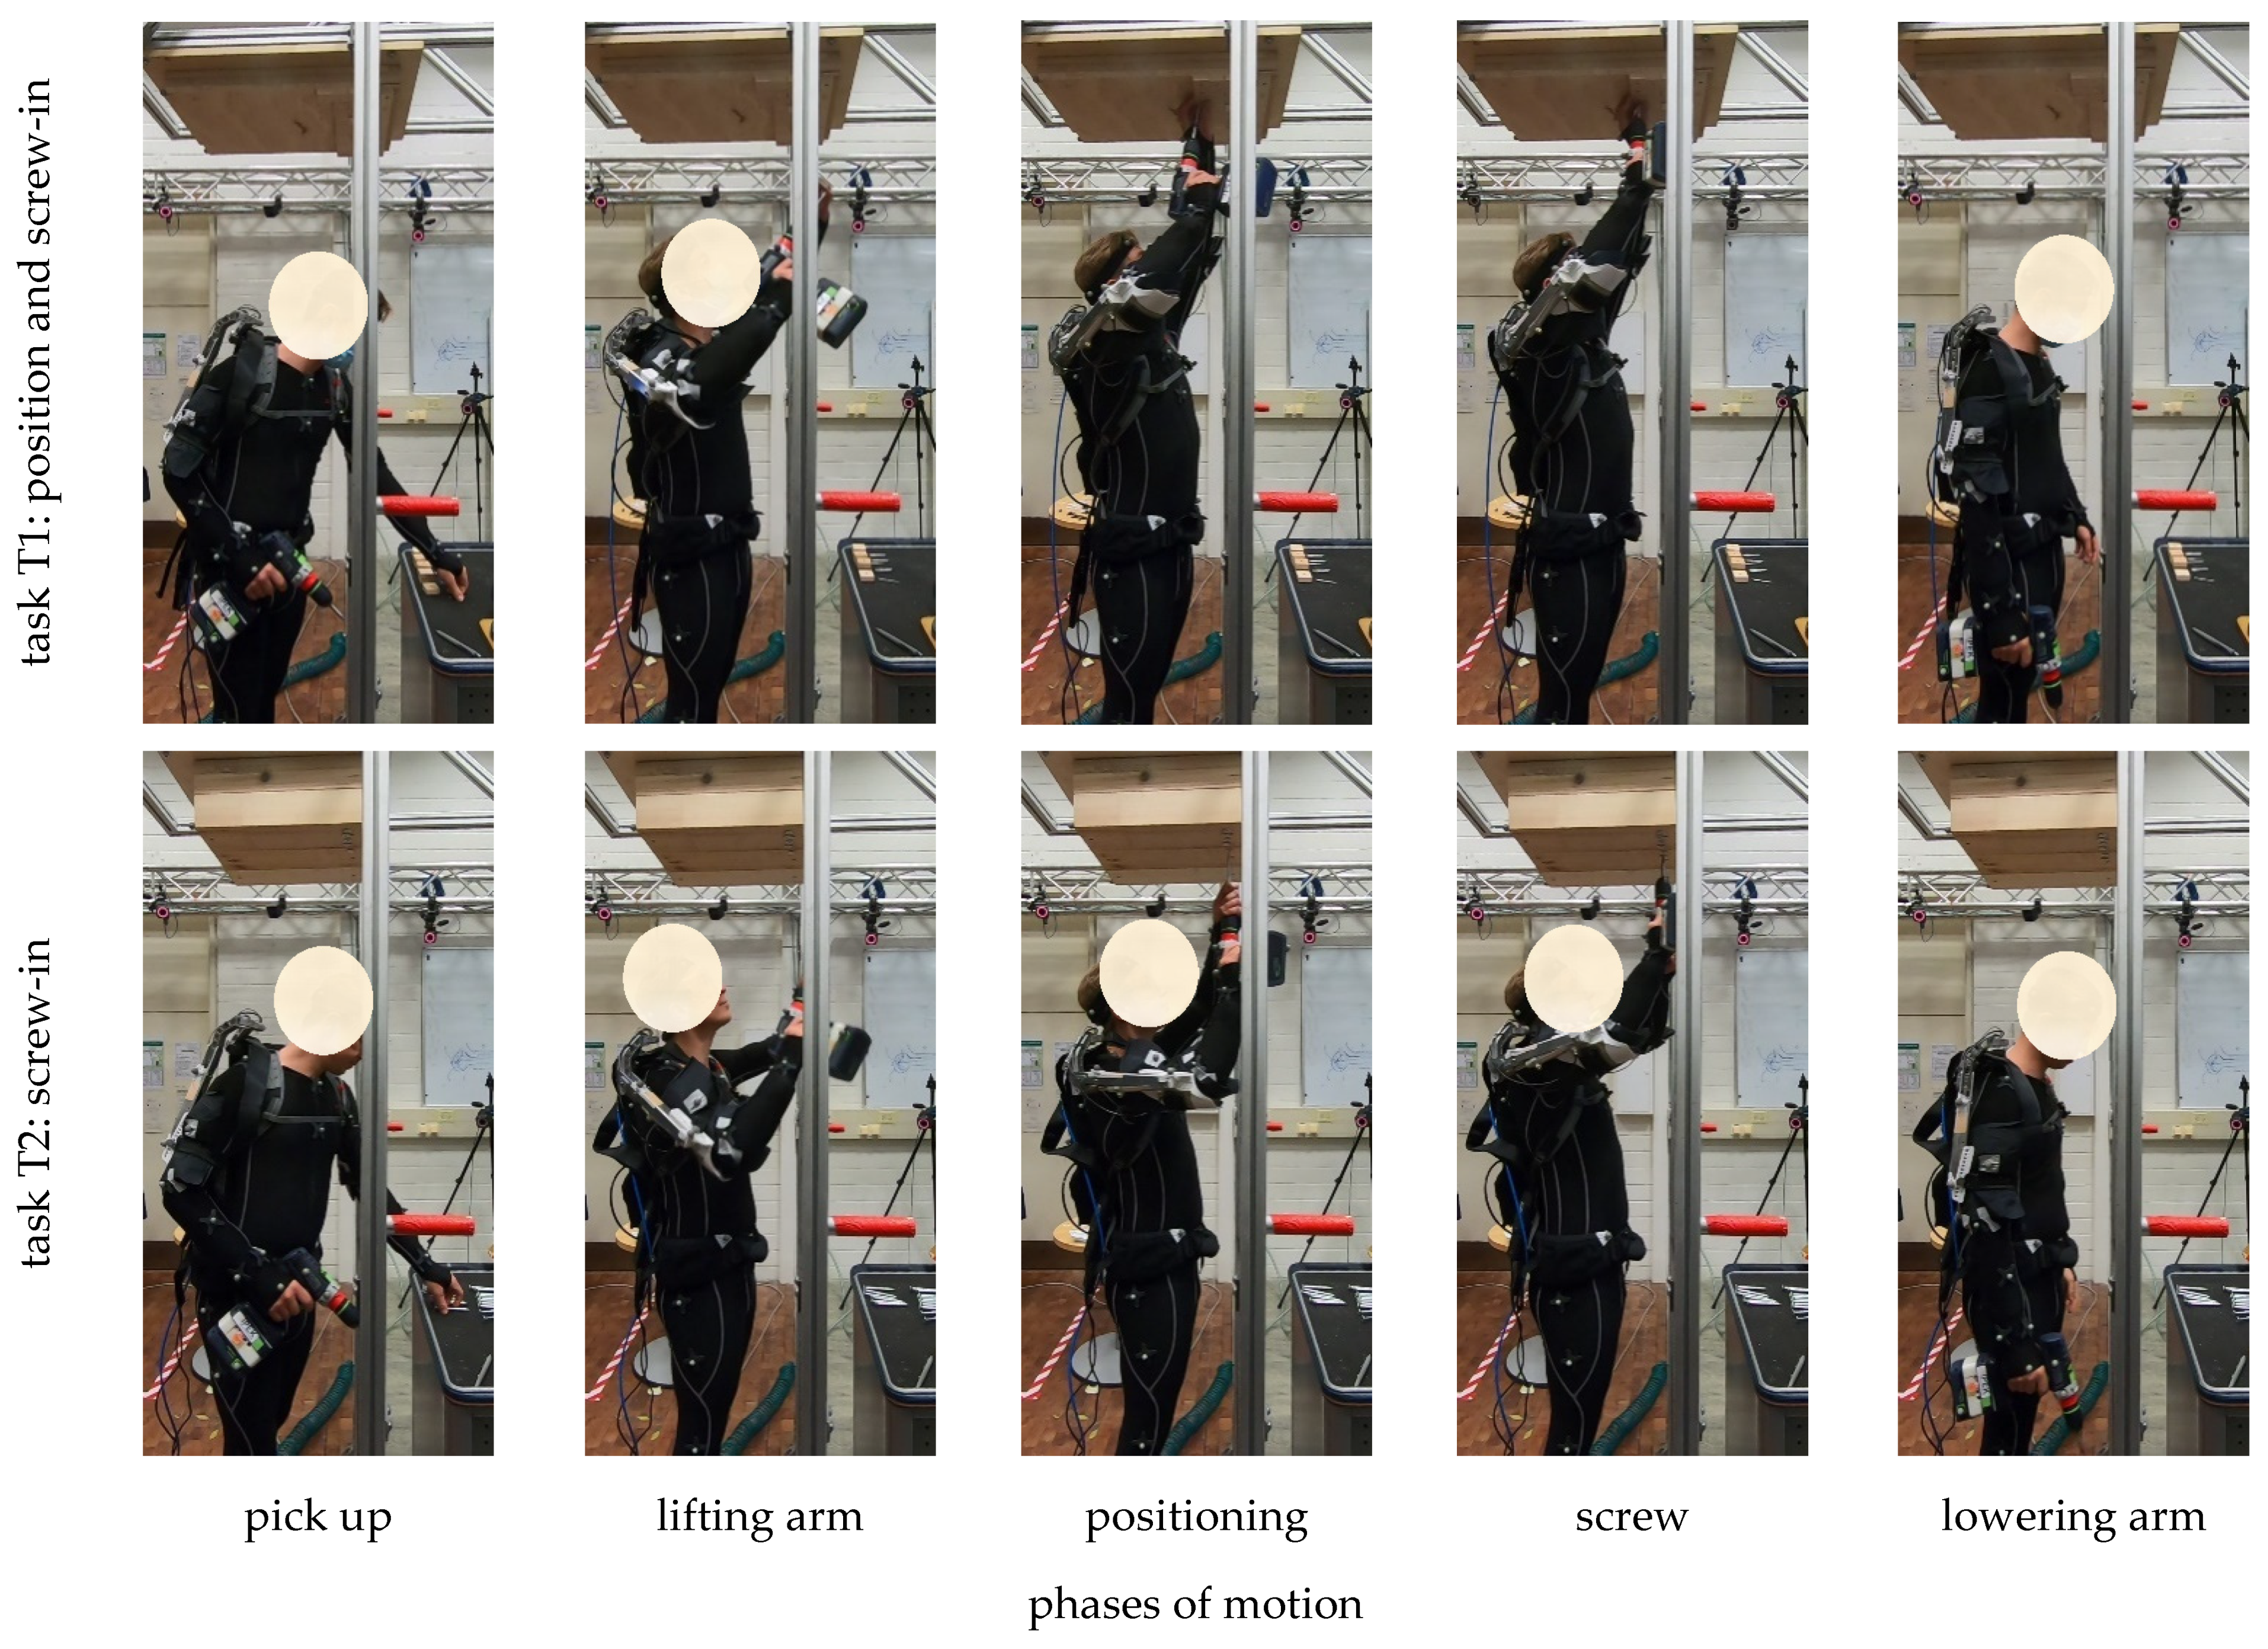
2.3. Tasks

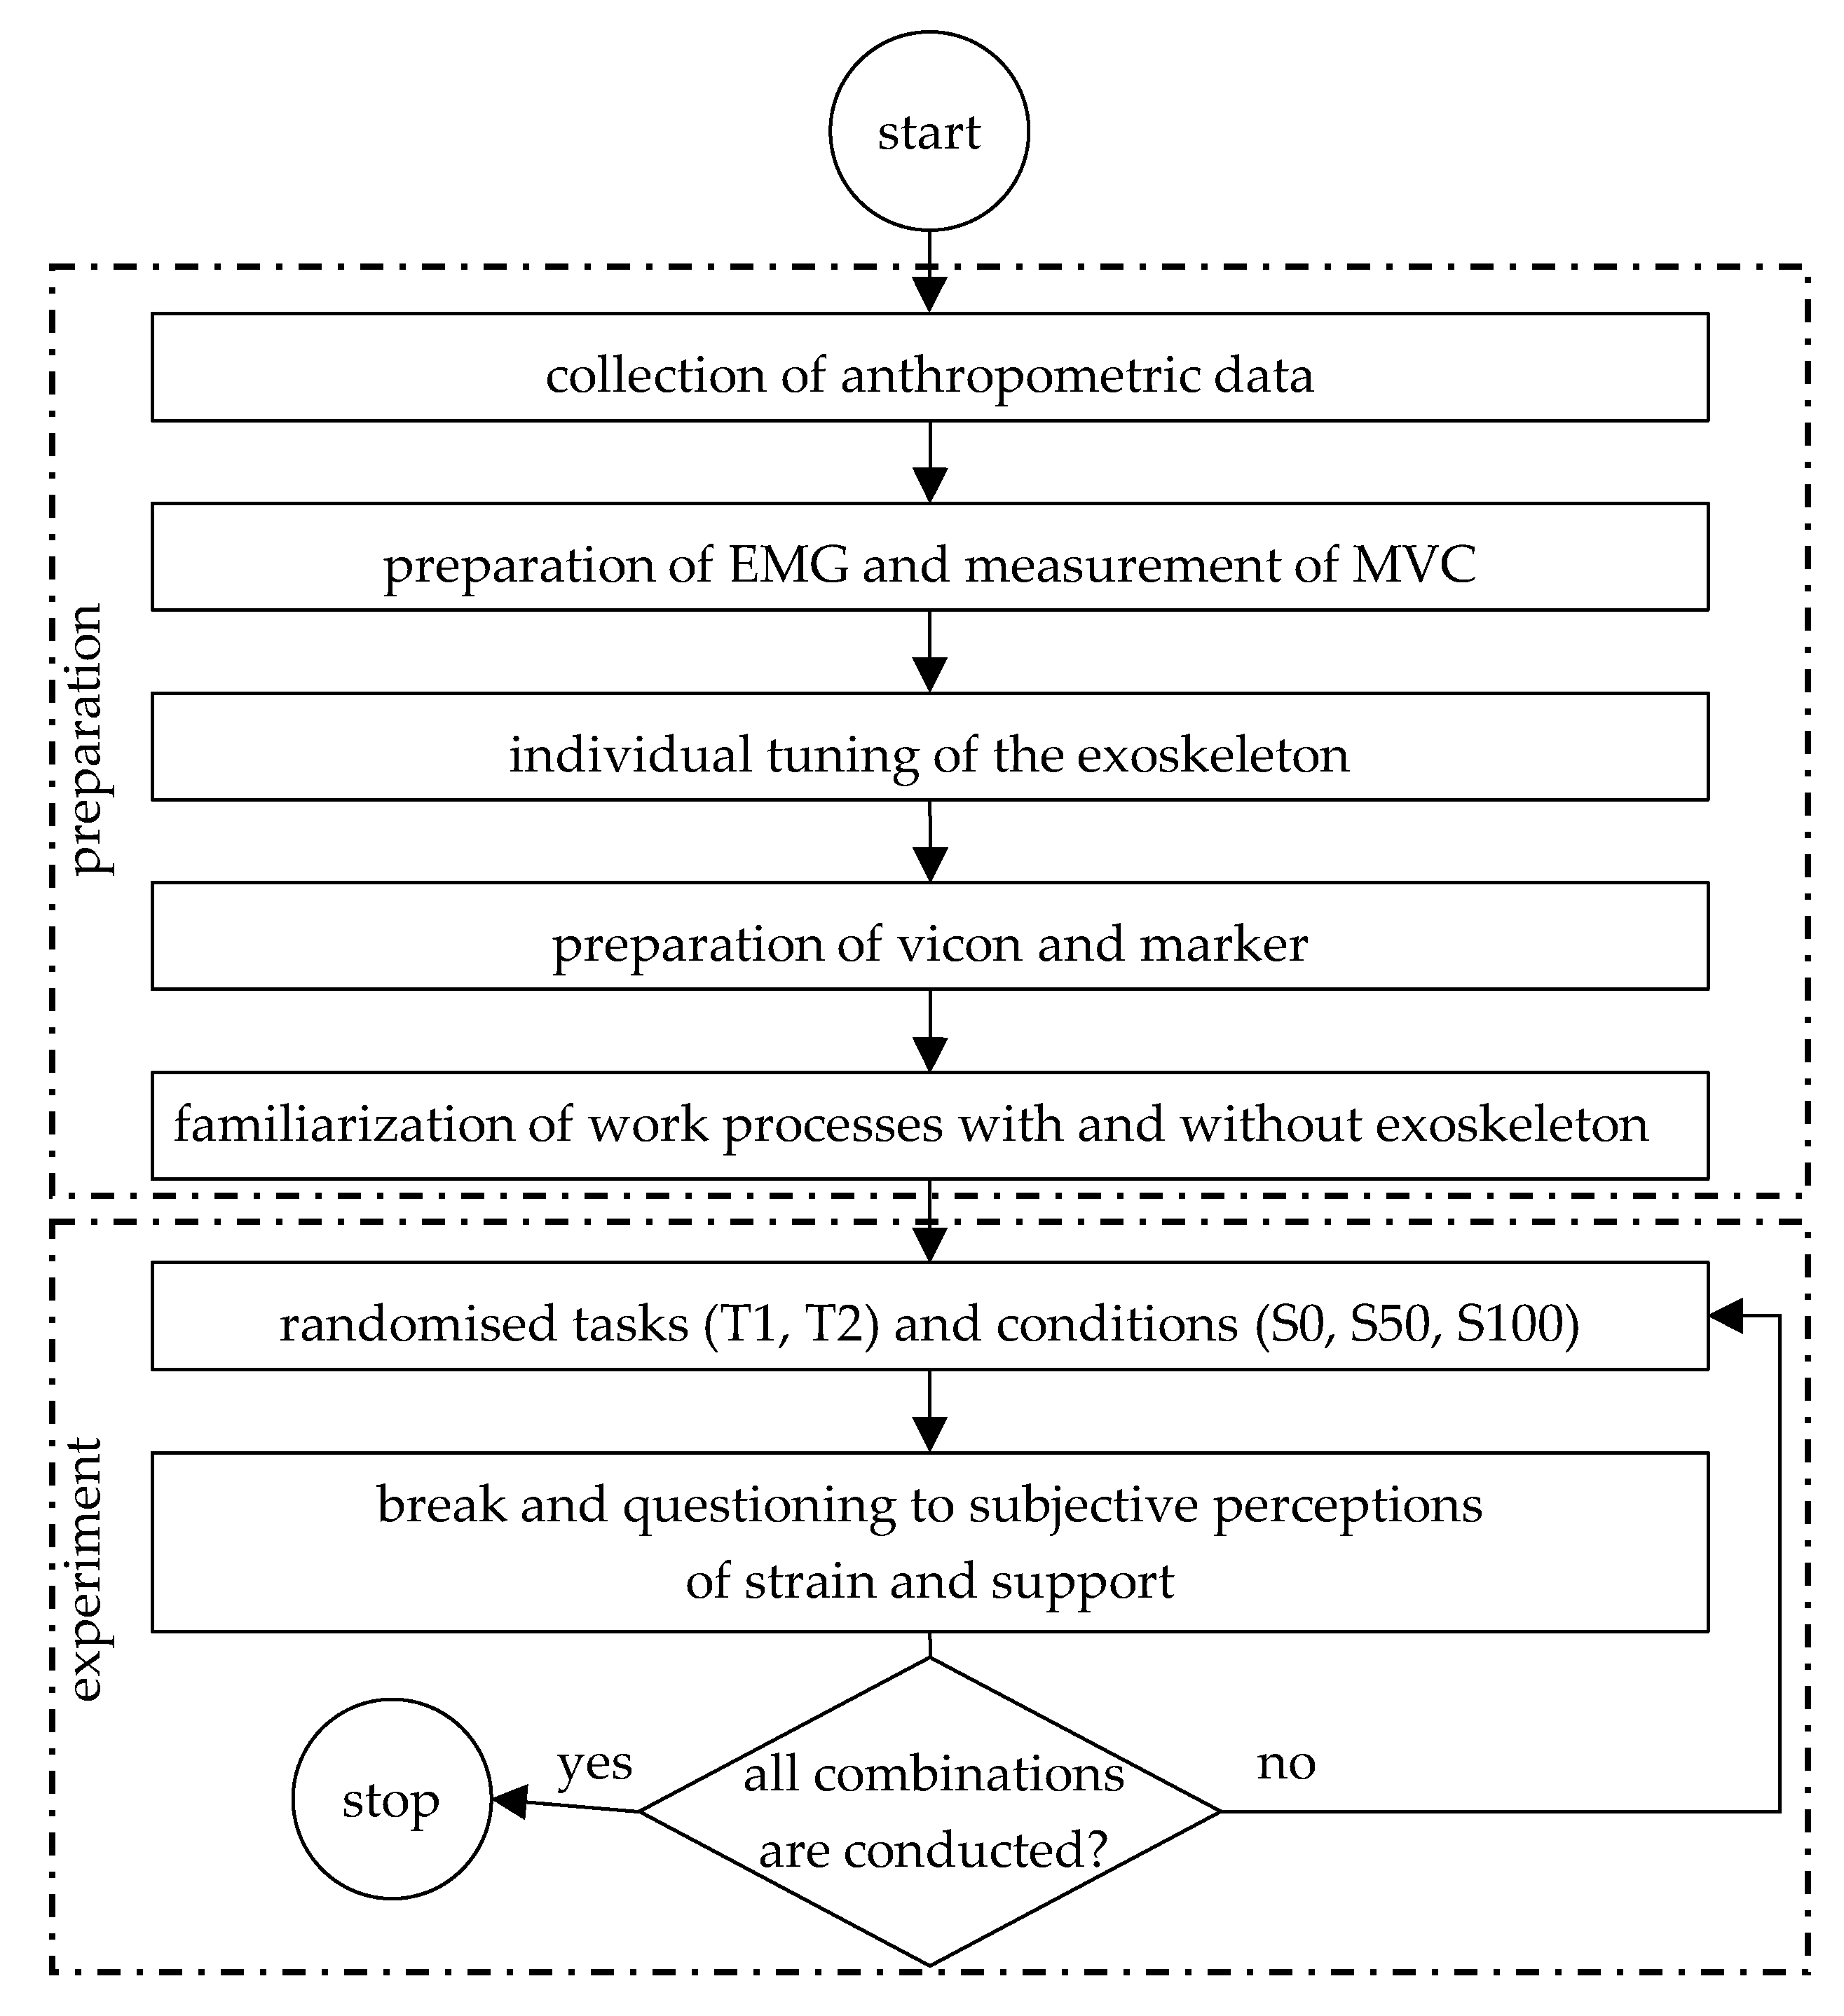
2.4. Test Procedure
2.5. Observed Variables

| Variable | Measurement System | |
|---|---|---|
| evaluation metrics | Muscle activity (objective physical strain) | Surface EMG (Myon 320, 1.000 Hz, Myon AG, Schwarzenberg, Schweiz) |
| Perceived exertion (subjective physical strain) | Questionnaire with body map and Borg Scale CR-10 [19] | |
| NASA-TLX questionnaire evaluated in six subscales [20] | ||
| Push force (workload) | One force plate (AMTI OPT, 464 × 508 mm, Advanced Mechanical Technology Inc., Watertown, NY, USA) | |
| Human–exoskeleton interaction force | One pressure sensing mat (X3 Pro System, 127 × 254 mm, Xsensor Technology Corporation, Calgary, AB, Canada) | |
| Subjective perception of the support force | Questionnaire for user experience | |
| assistant metrics | Electric current and voltage screwdriver | Datalogger on screwdriver [17] |
| Elevation angle exoskeleton | Datalogger on Lucy | |
| Human motion | Vicon (Vicon Bonita, Oxford Metrics Ltd., Oxford, UK) |
2.6. Data Analysis
3. Results
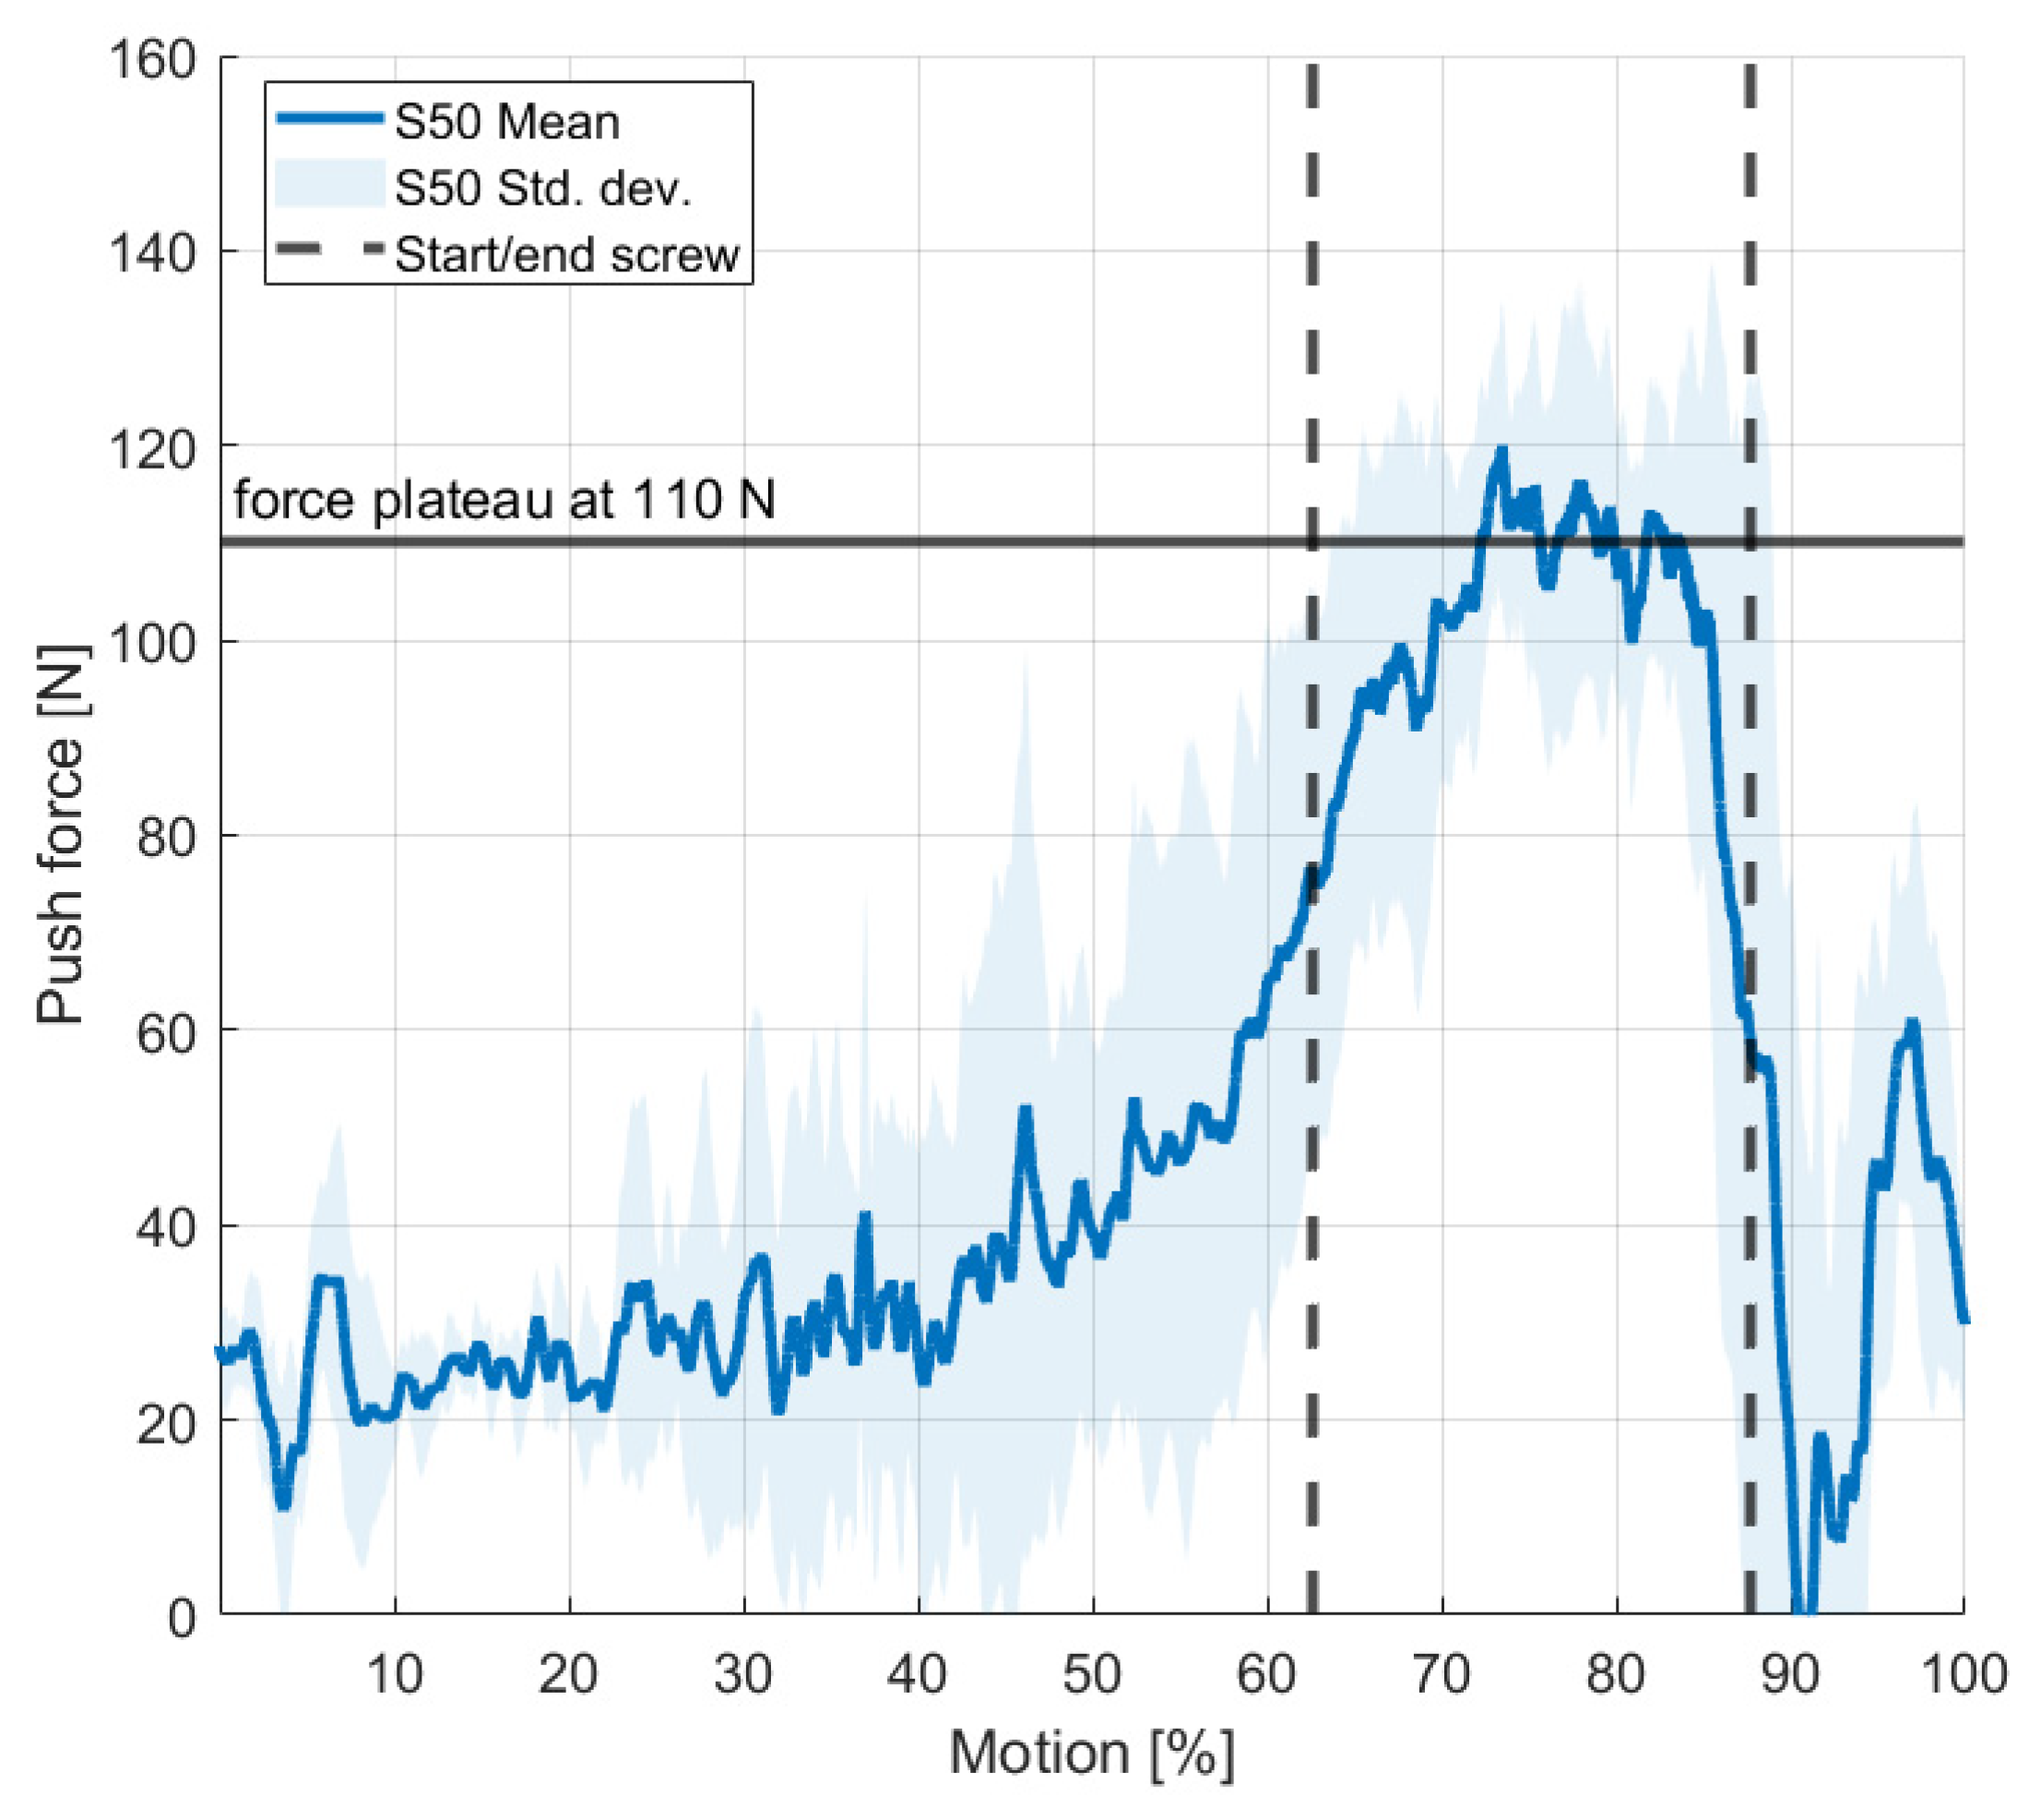
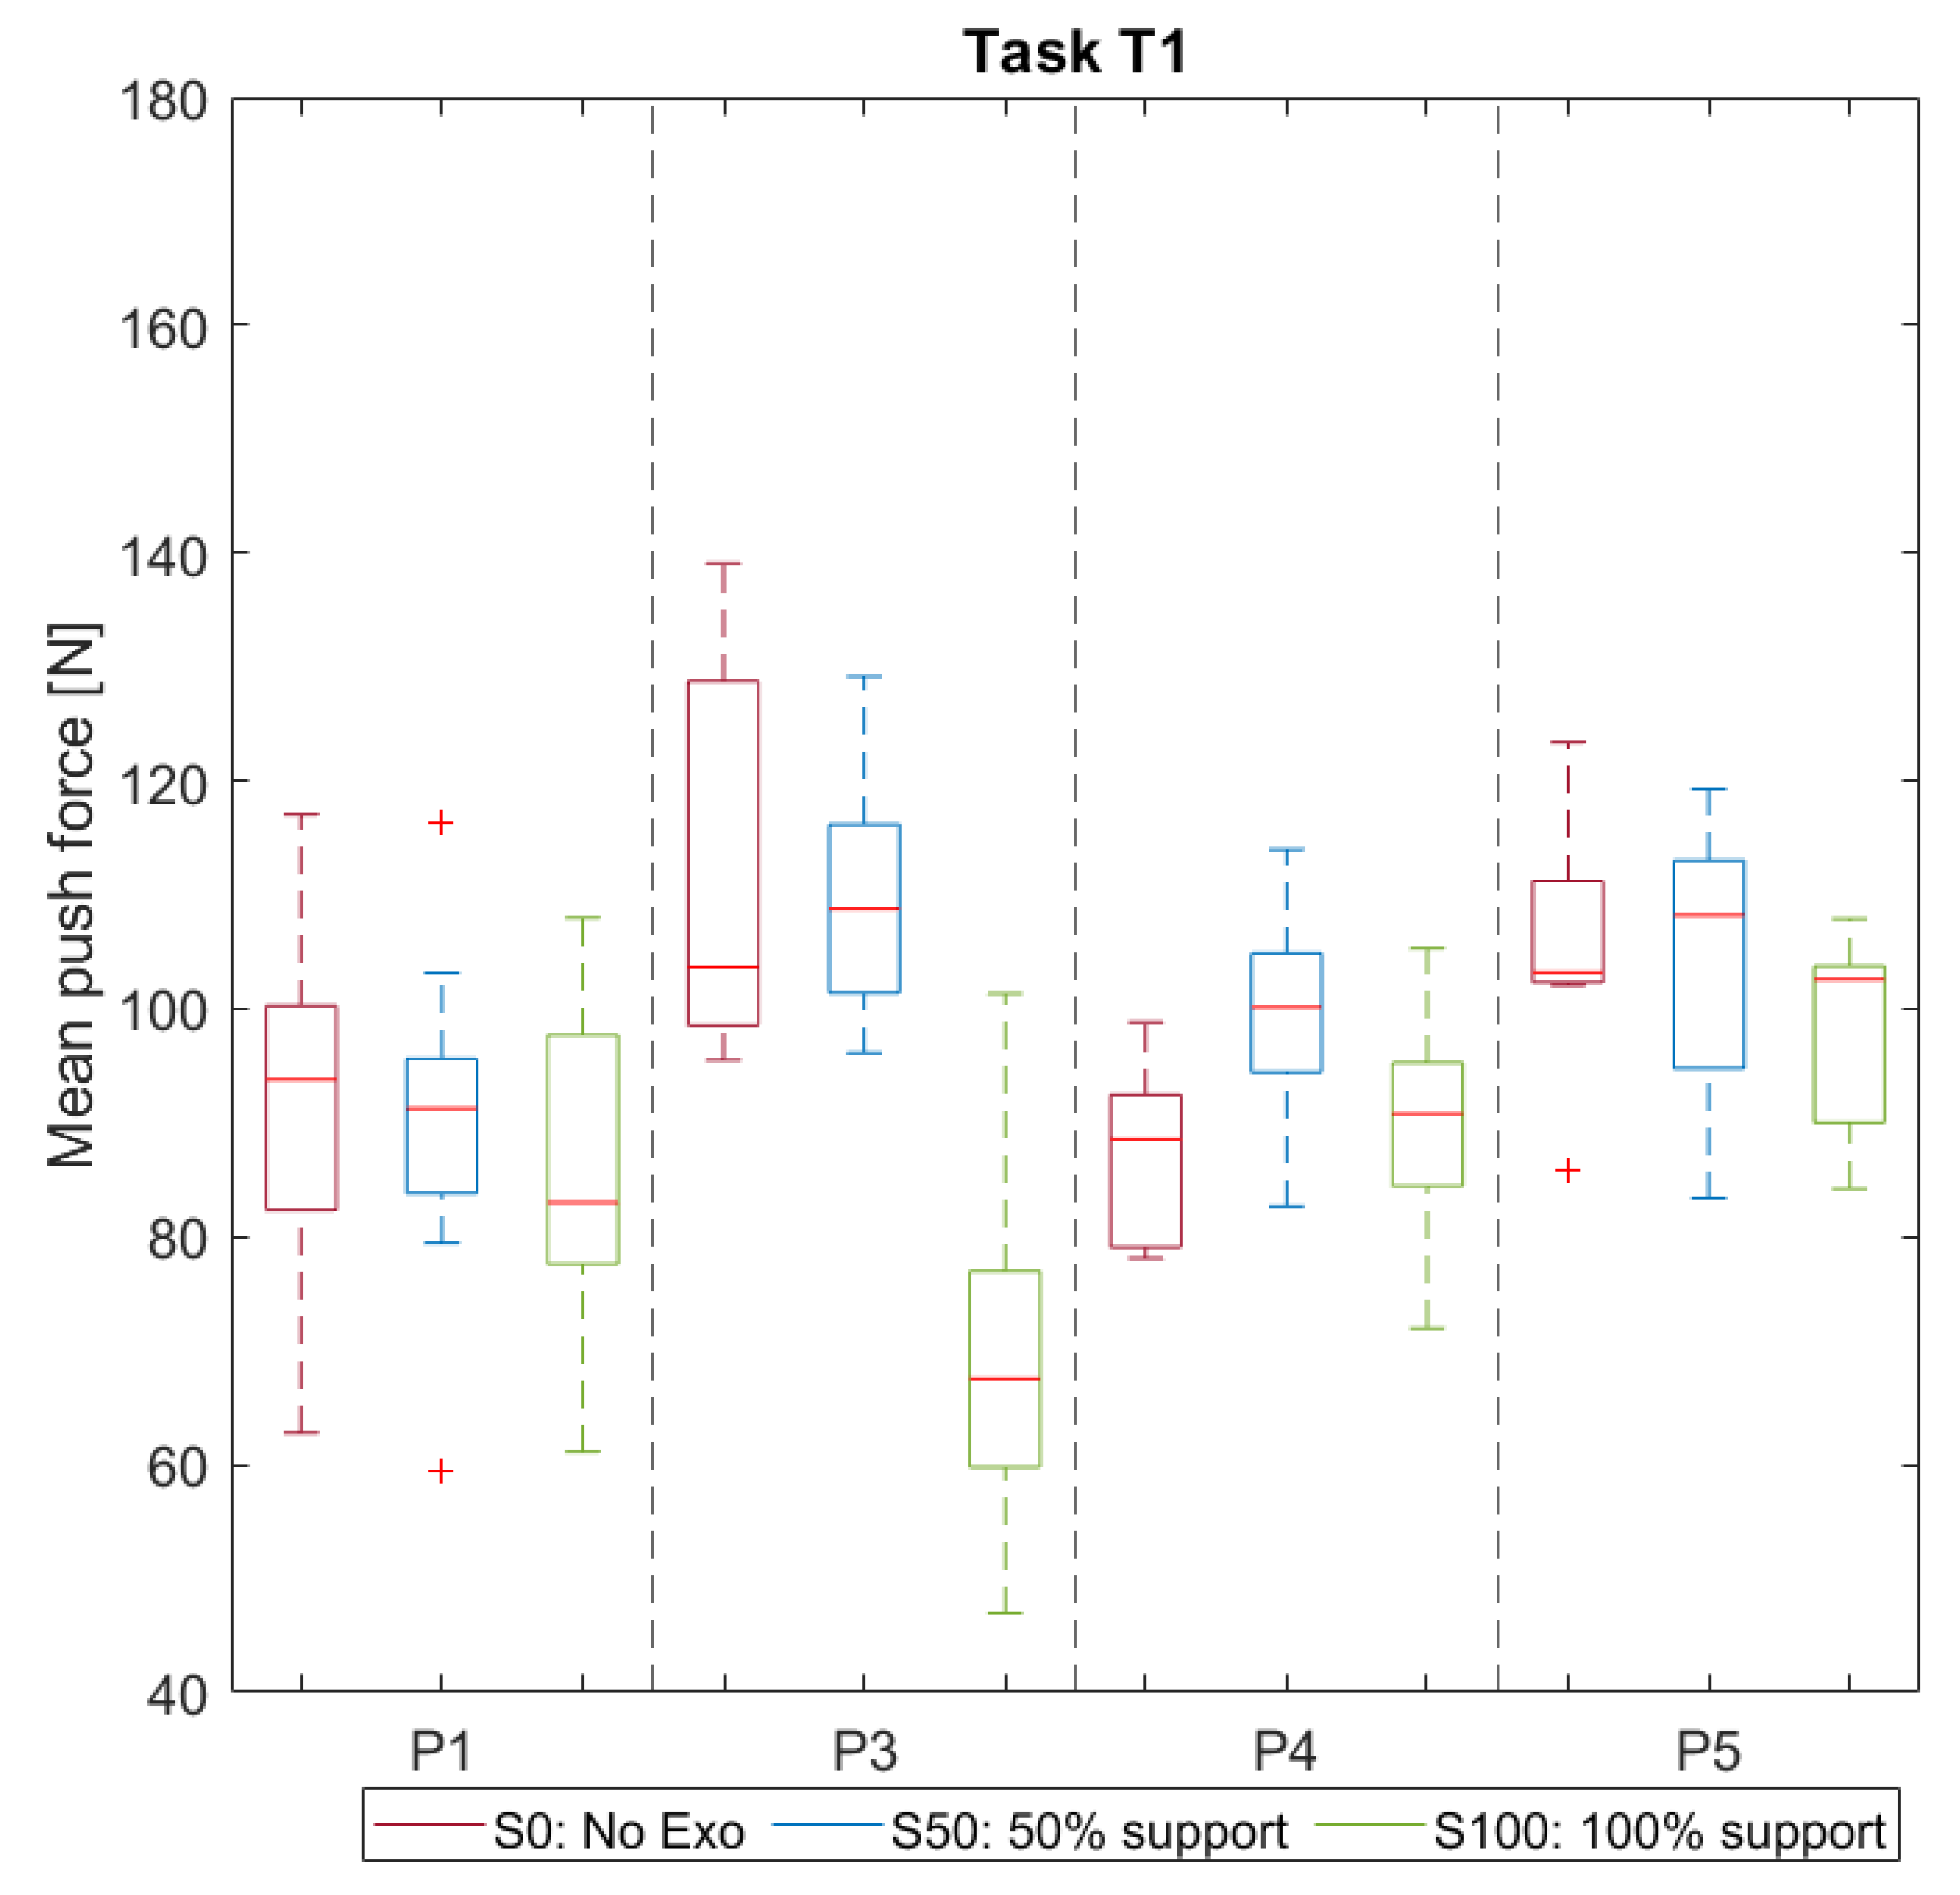
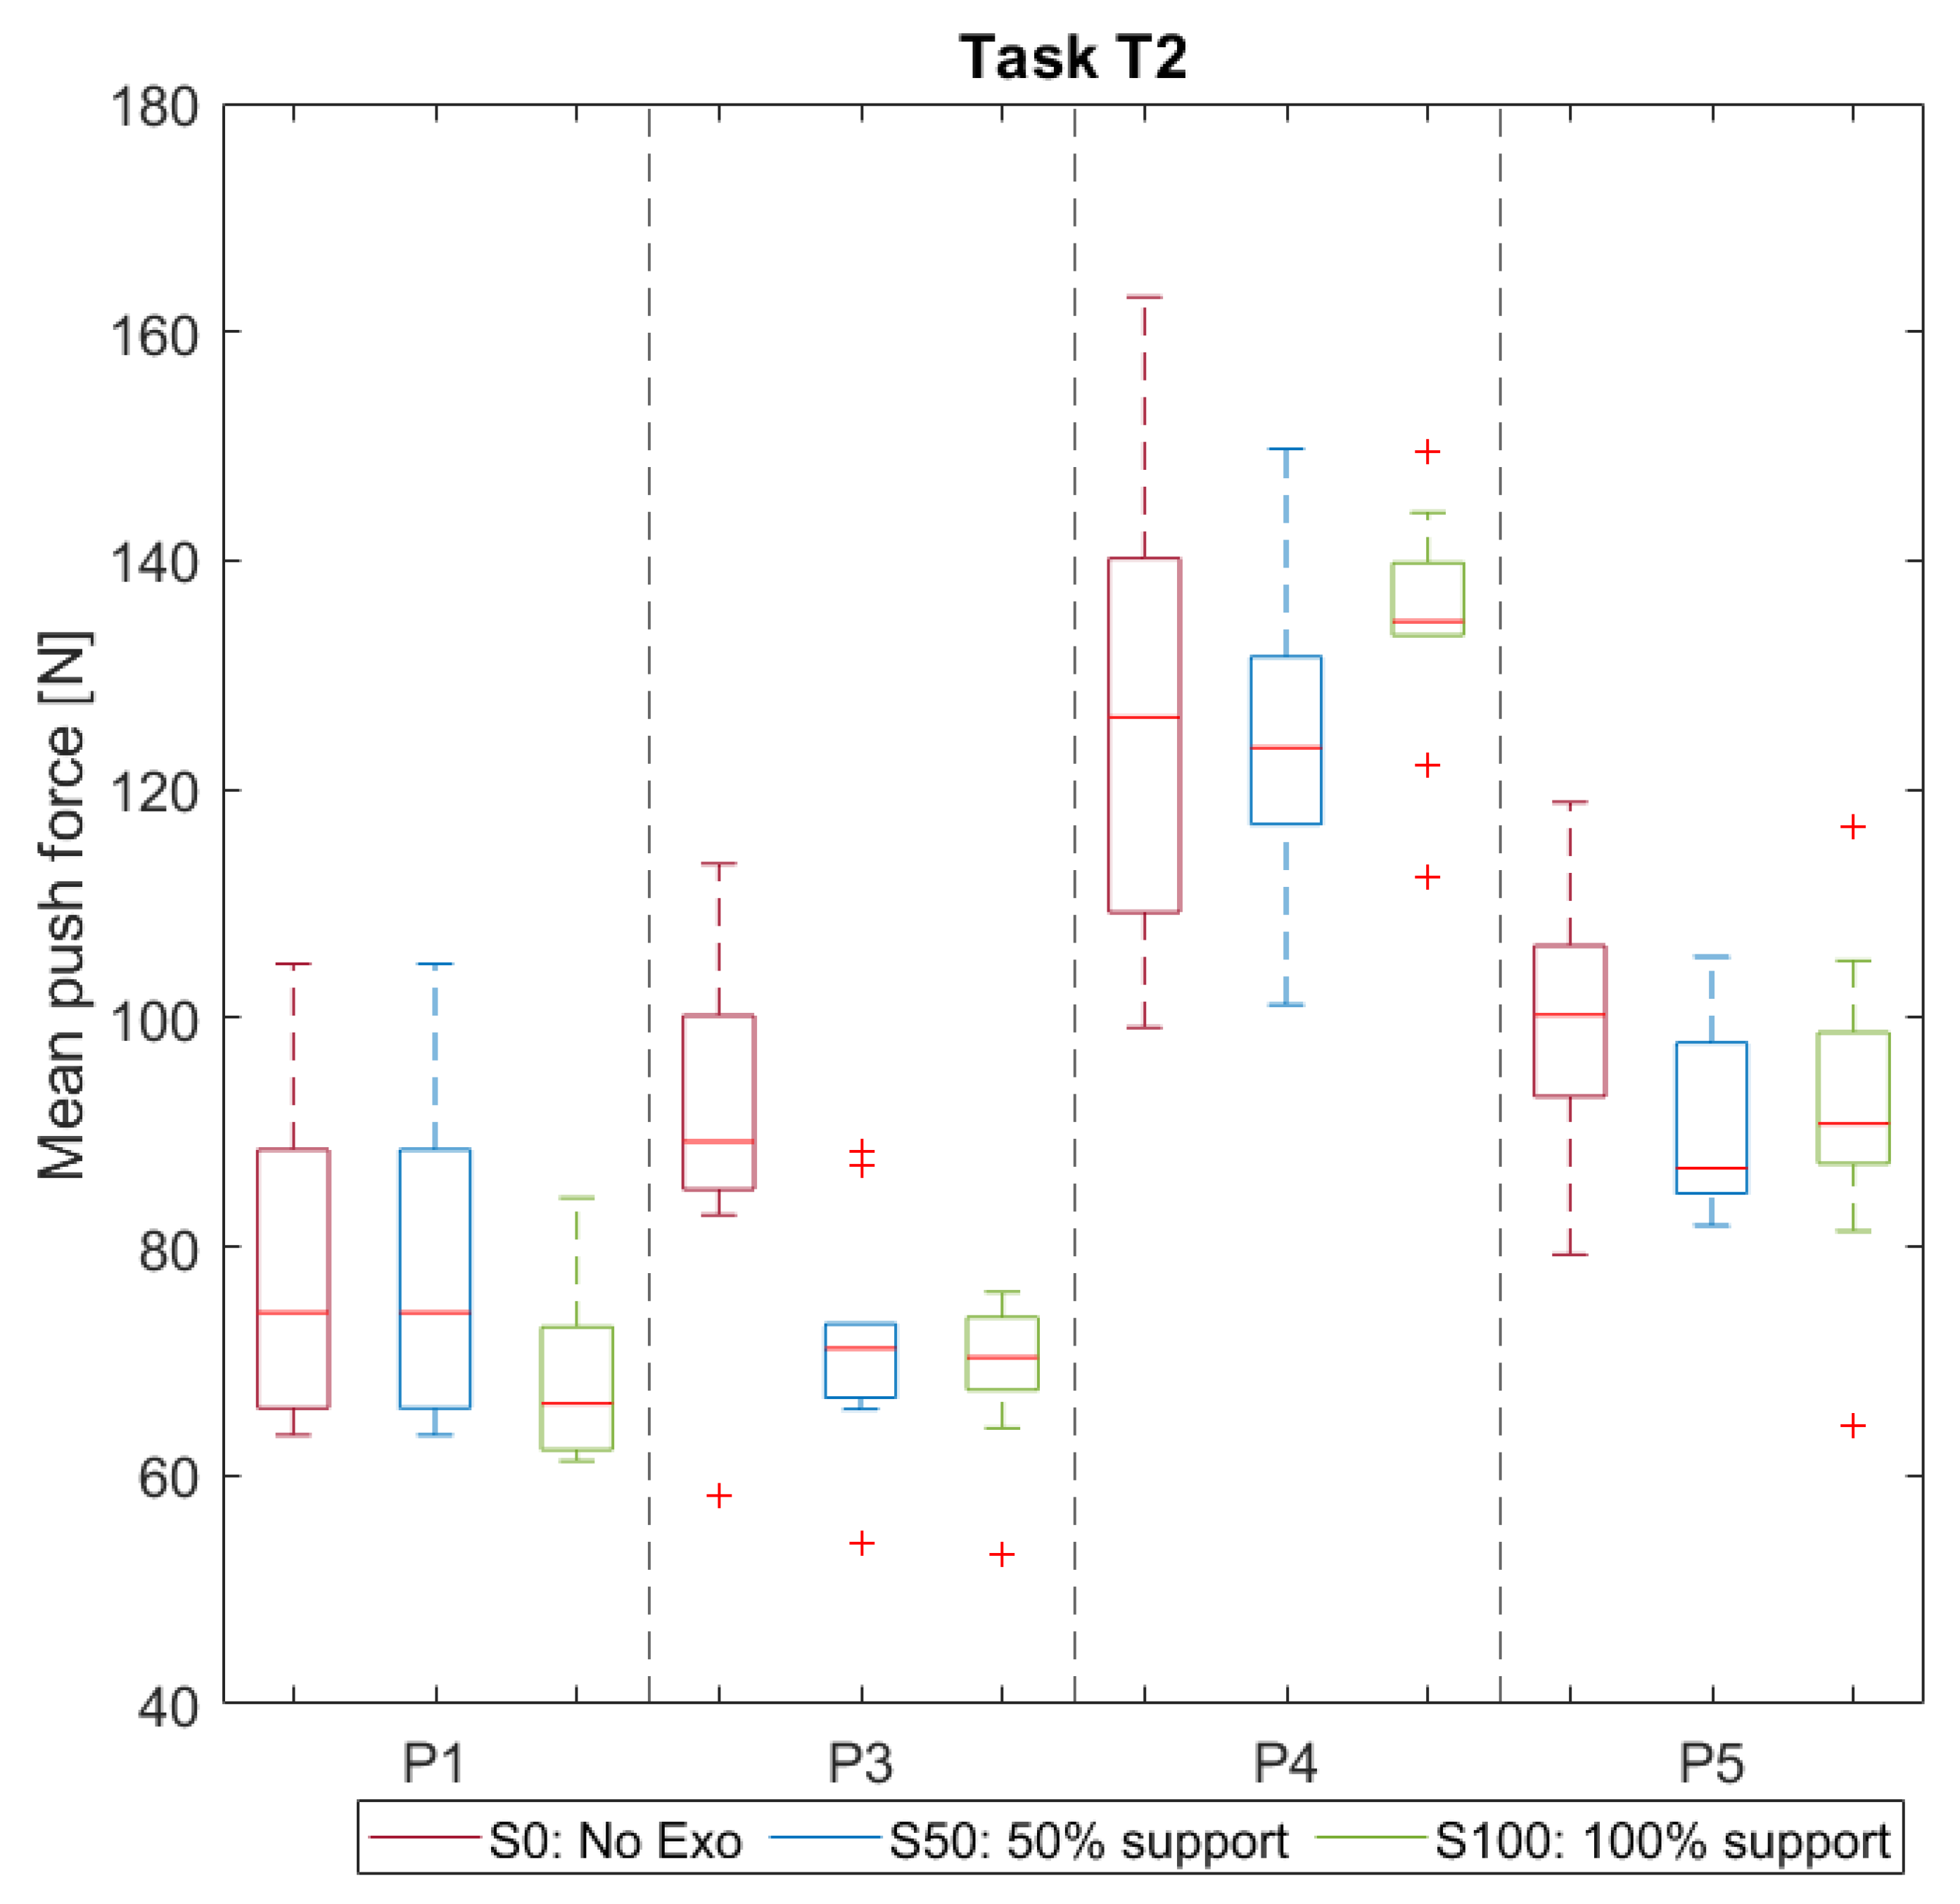
3.1. Push Force during Screw Phase of the Motion
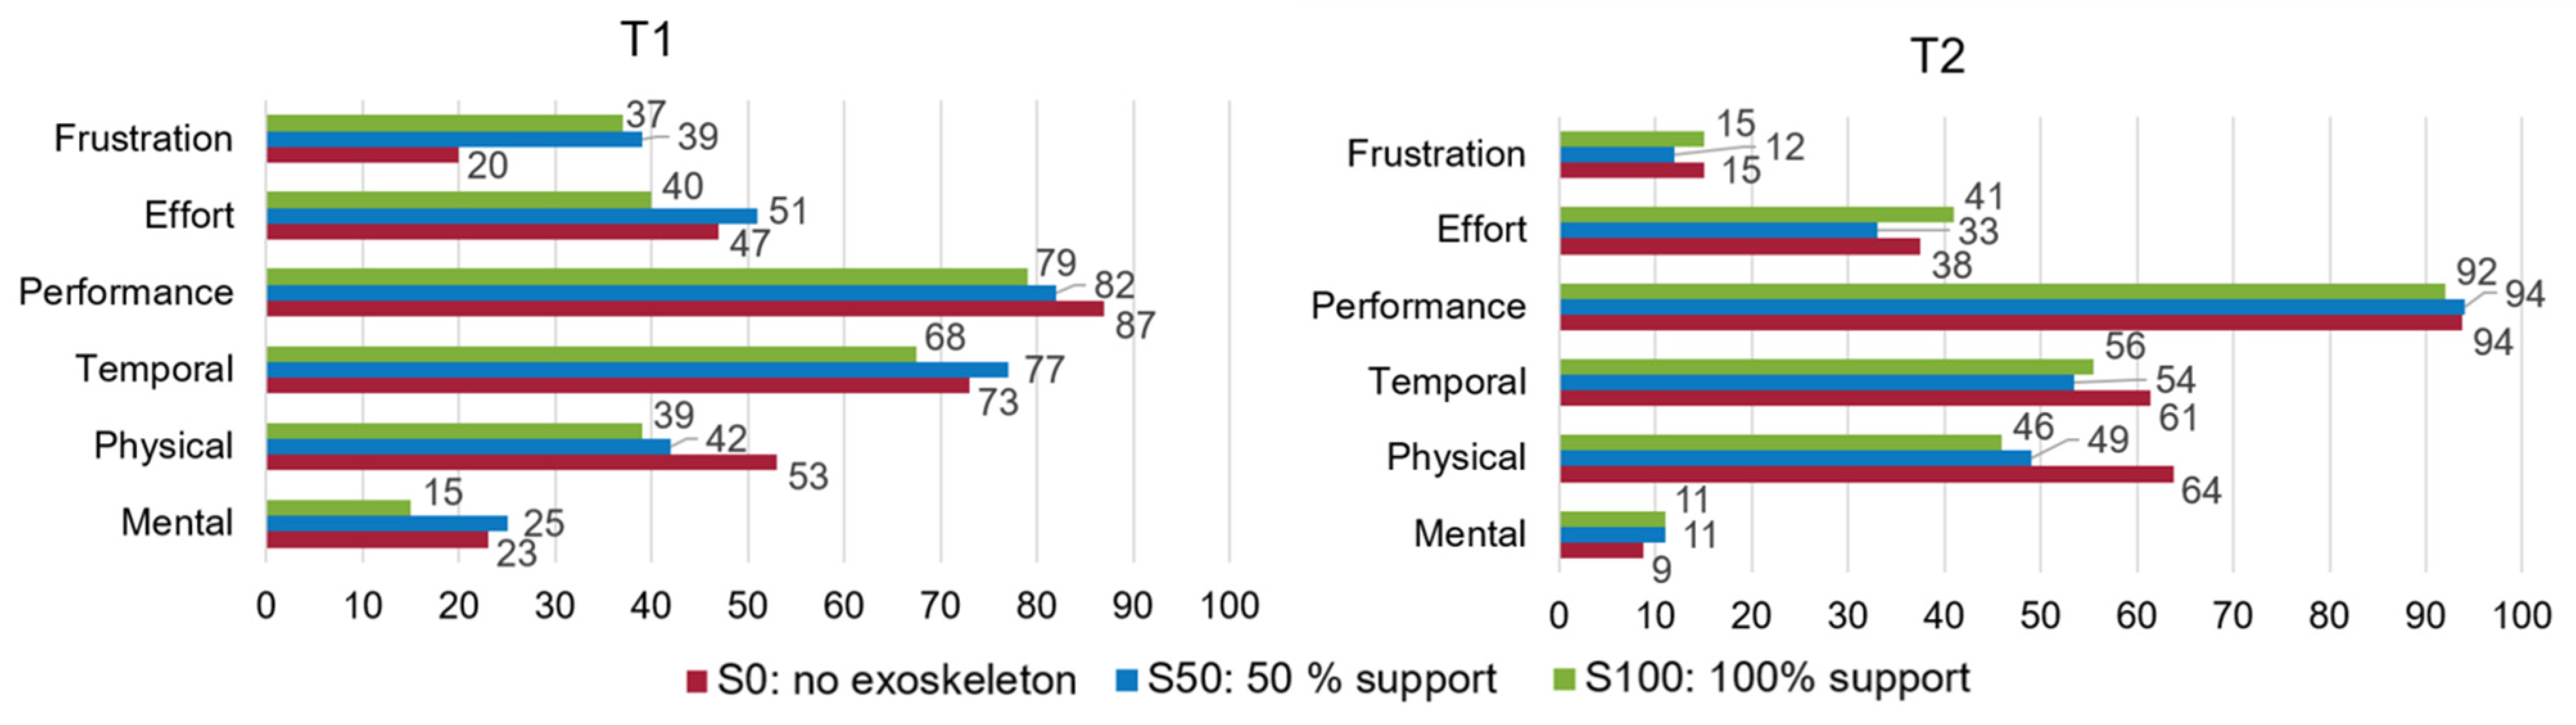
3.2. Subjective Perception of the Strain
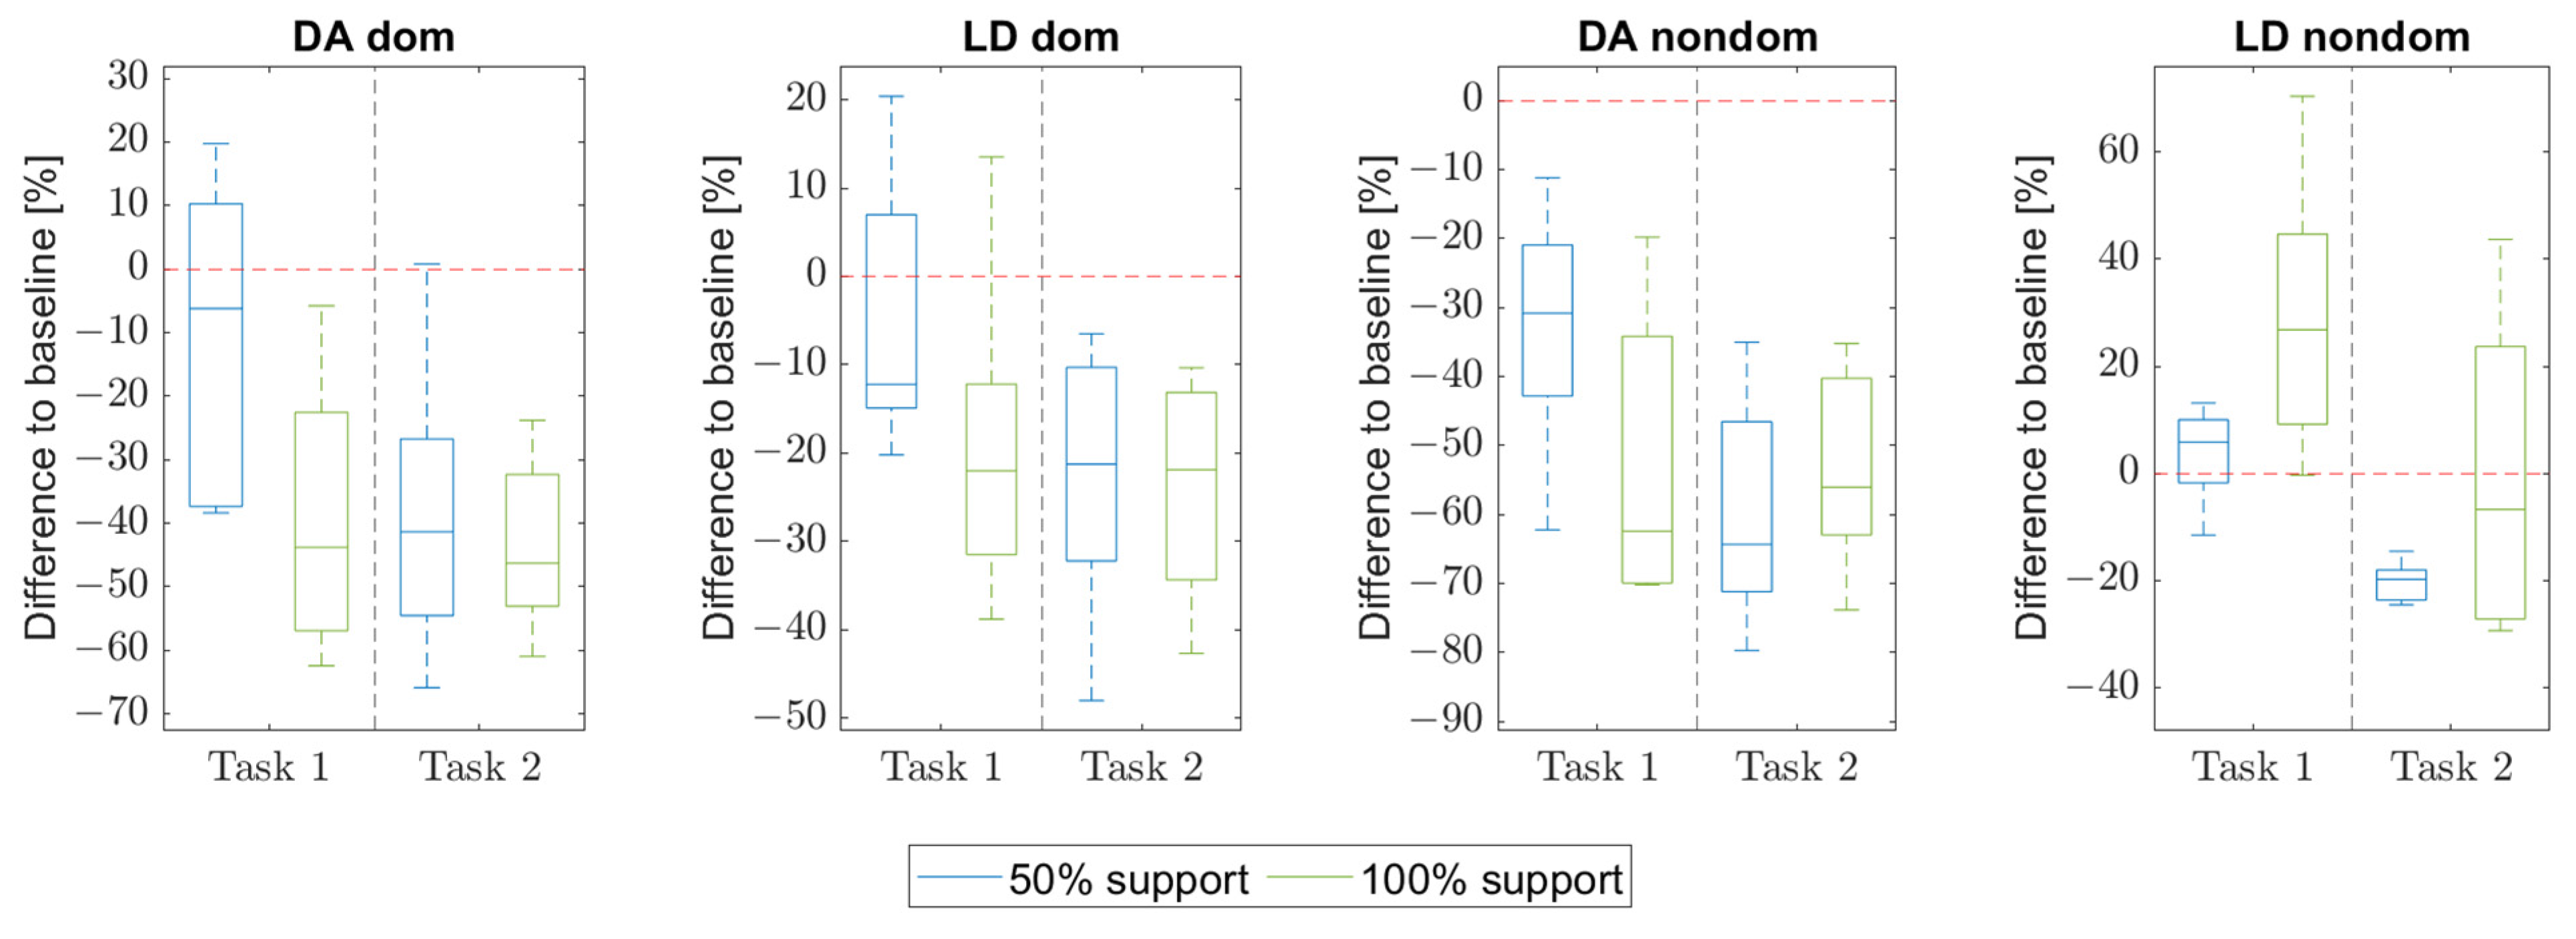
3.3. Muscle Activities
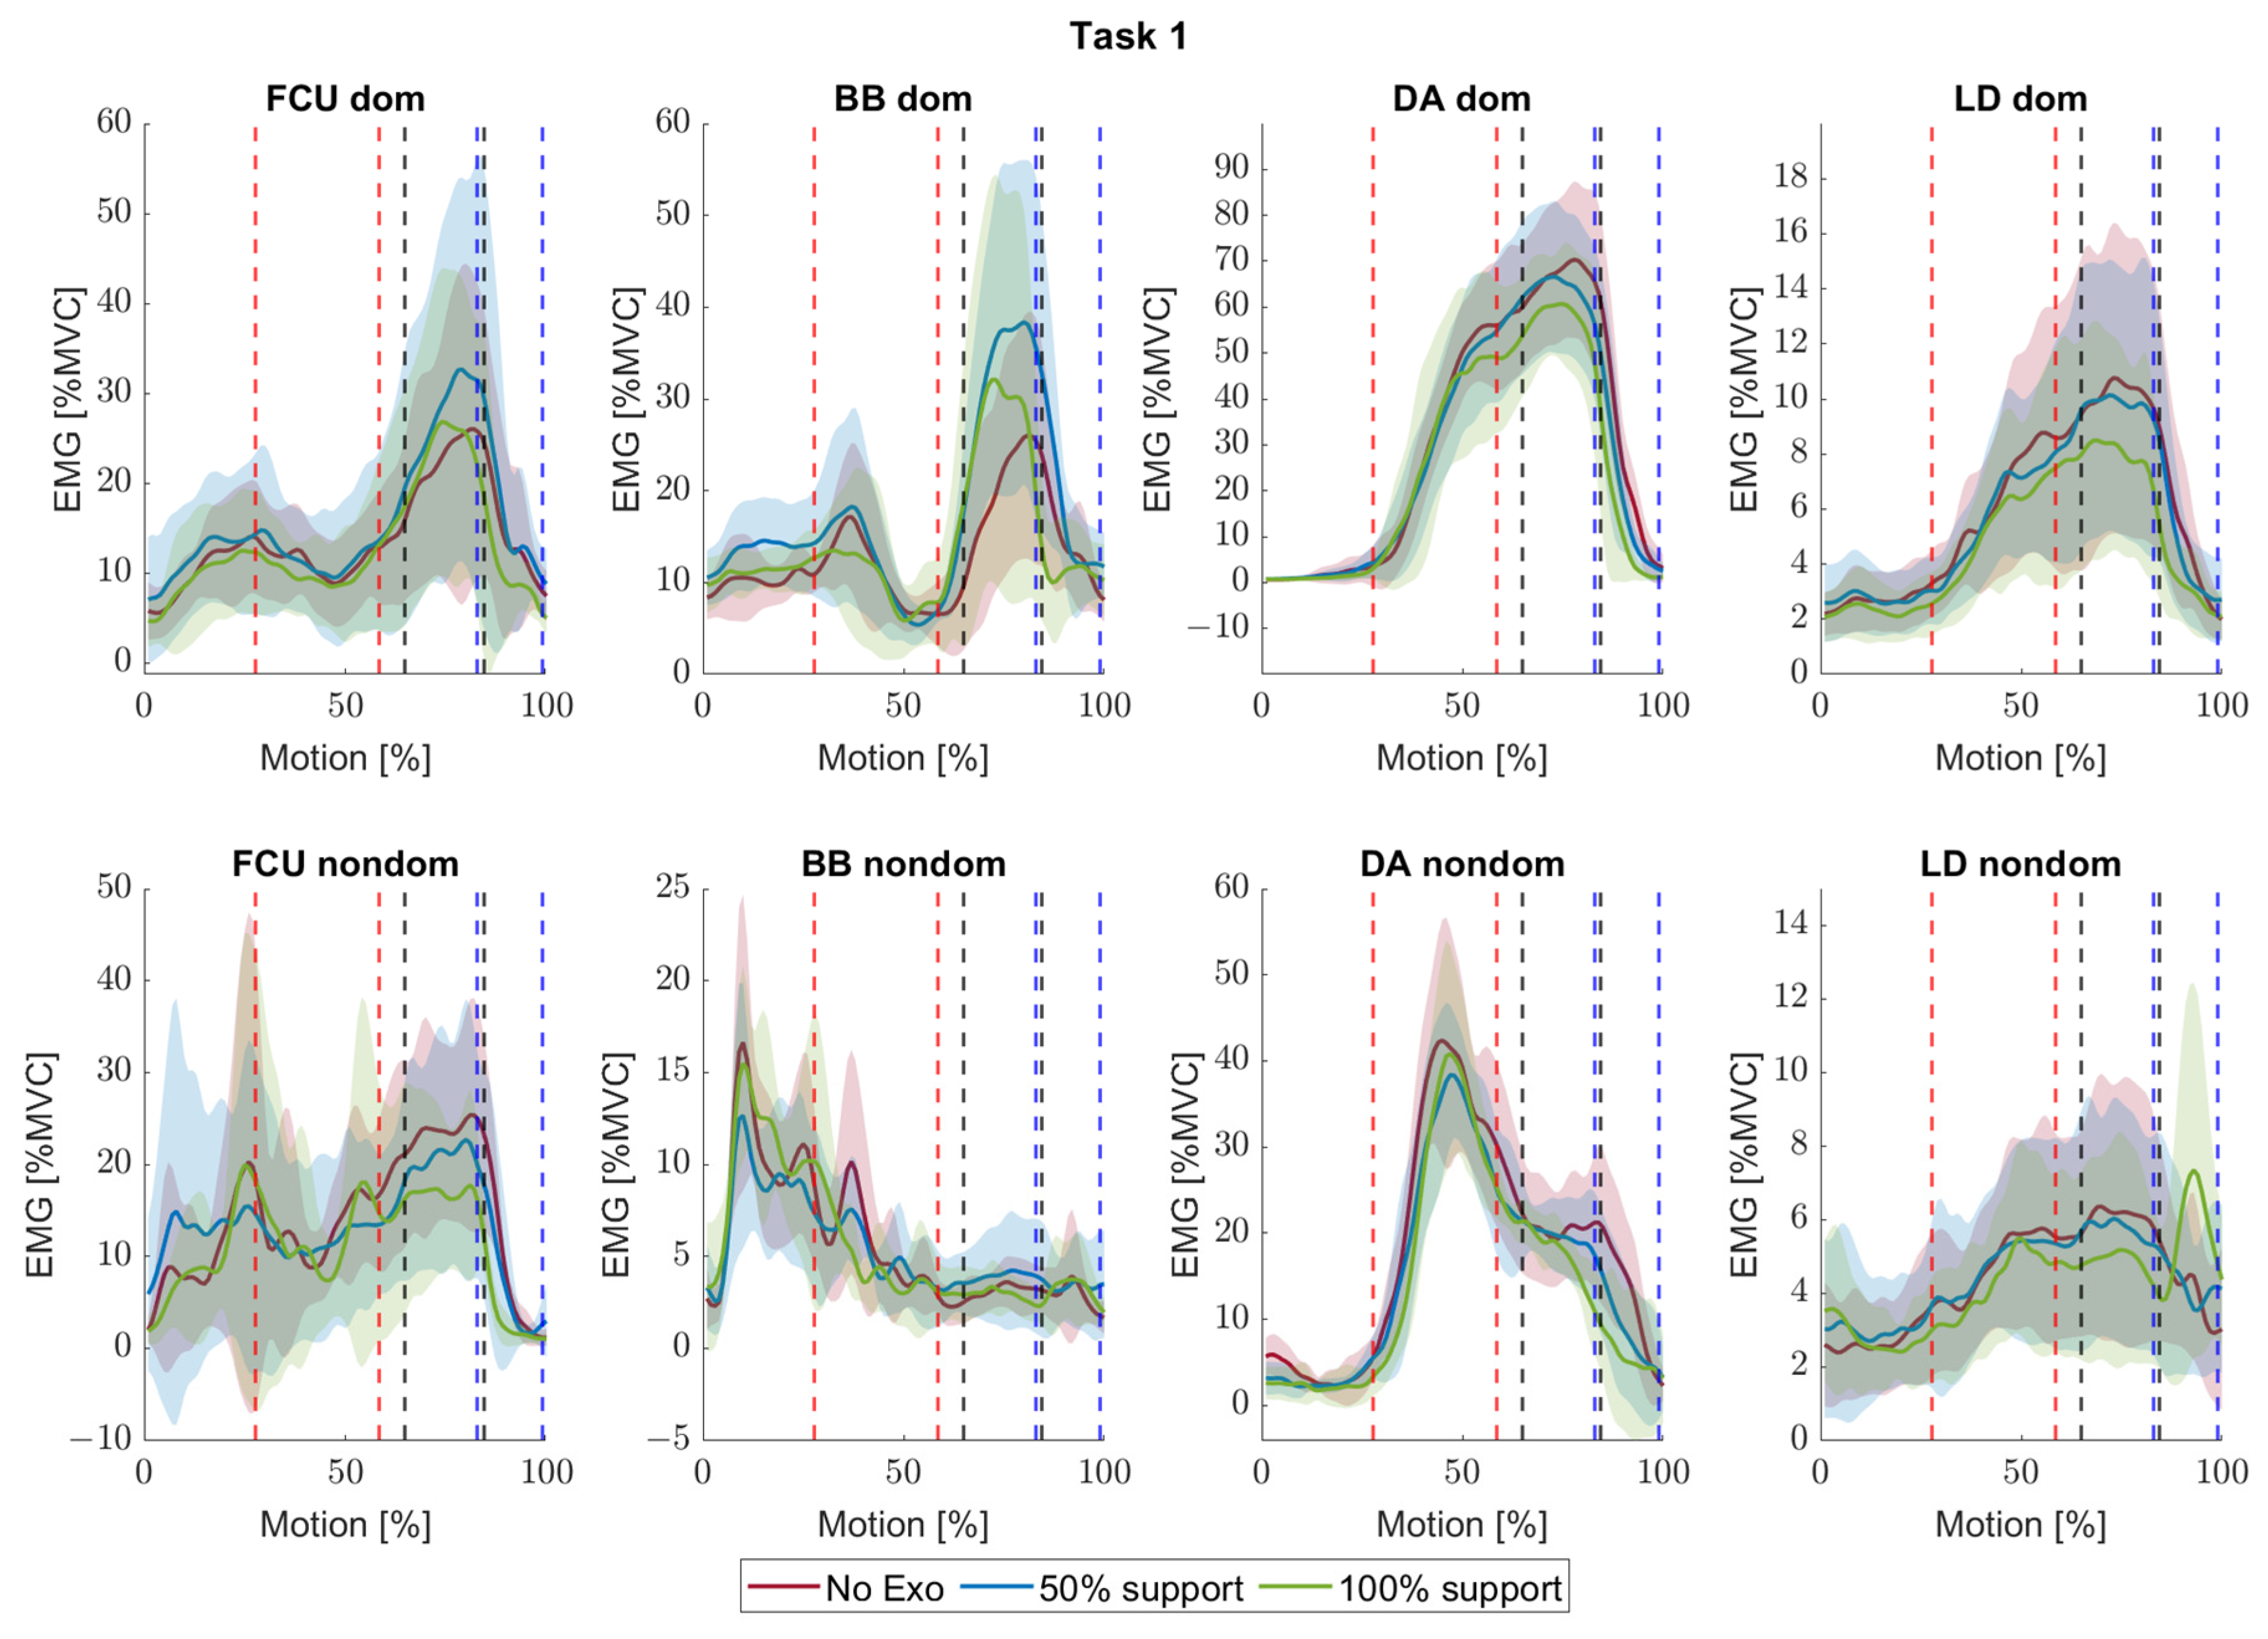
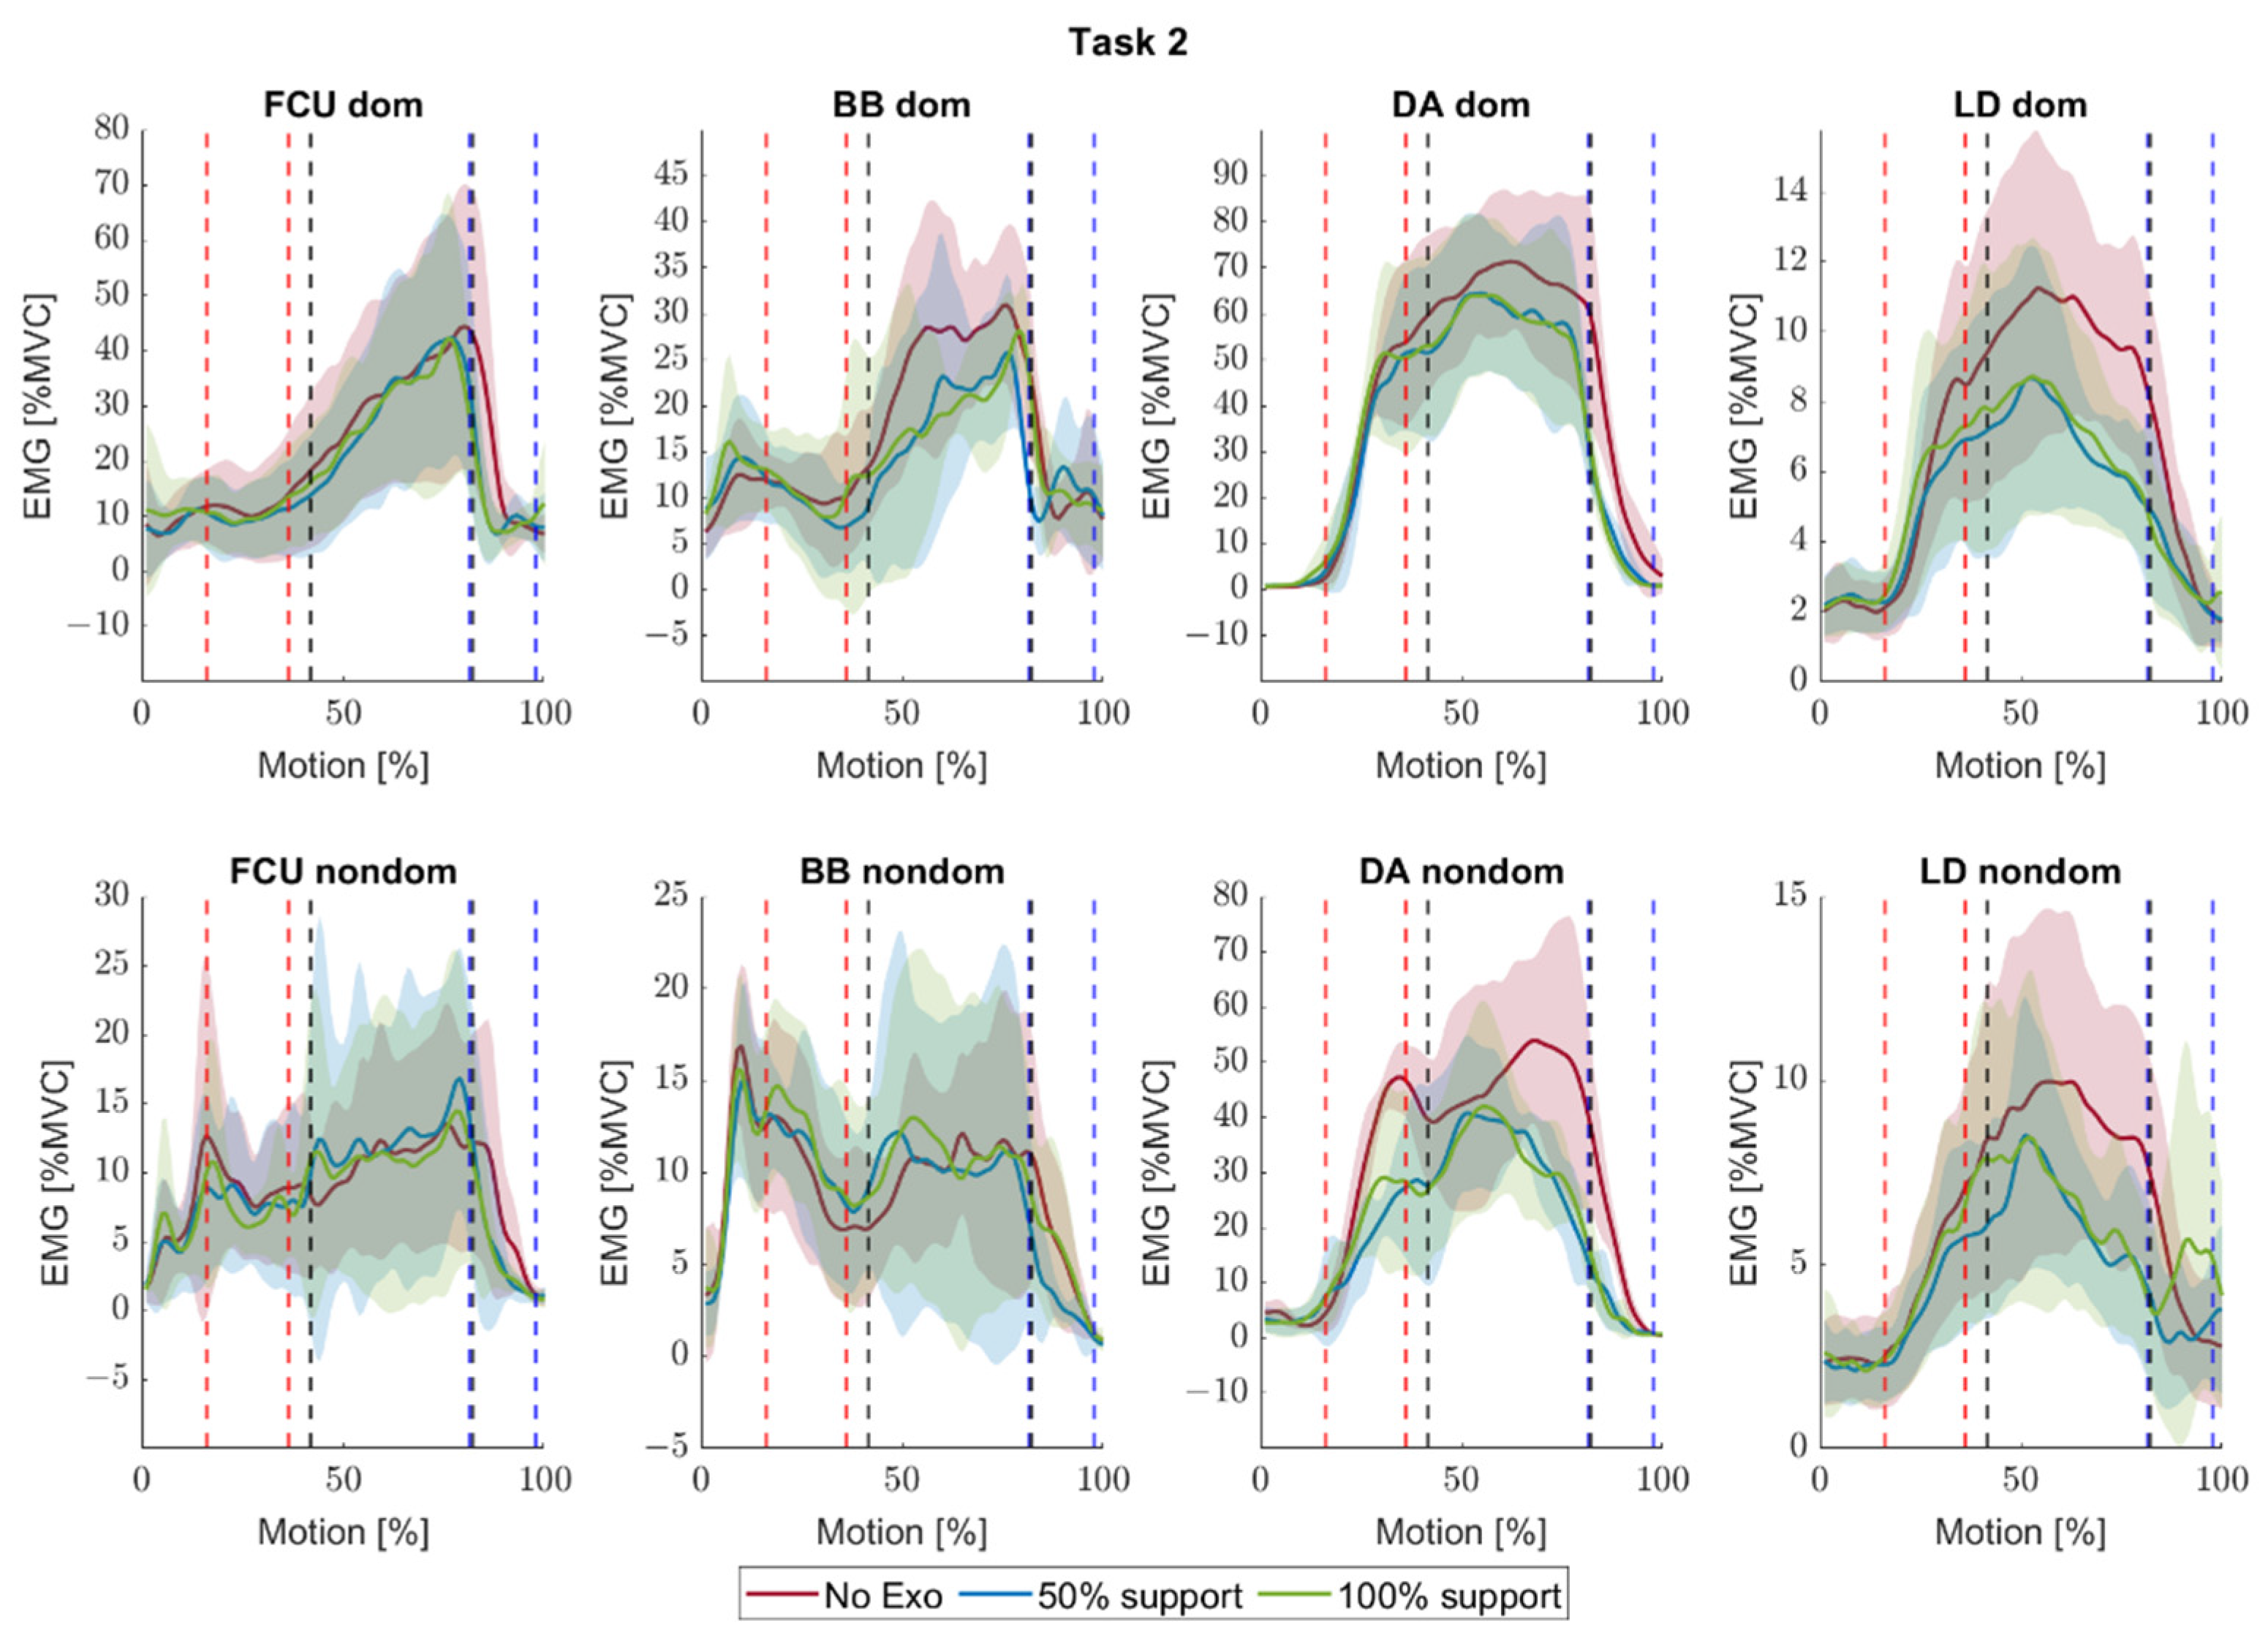
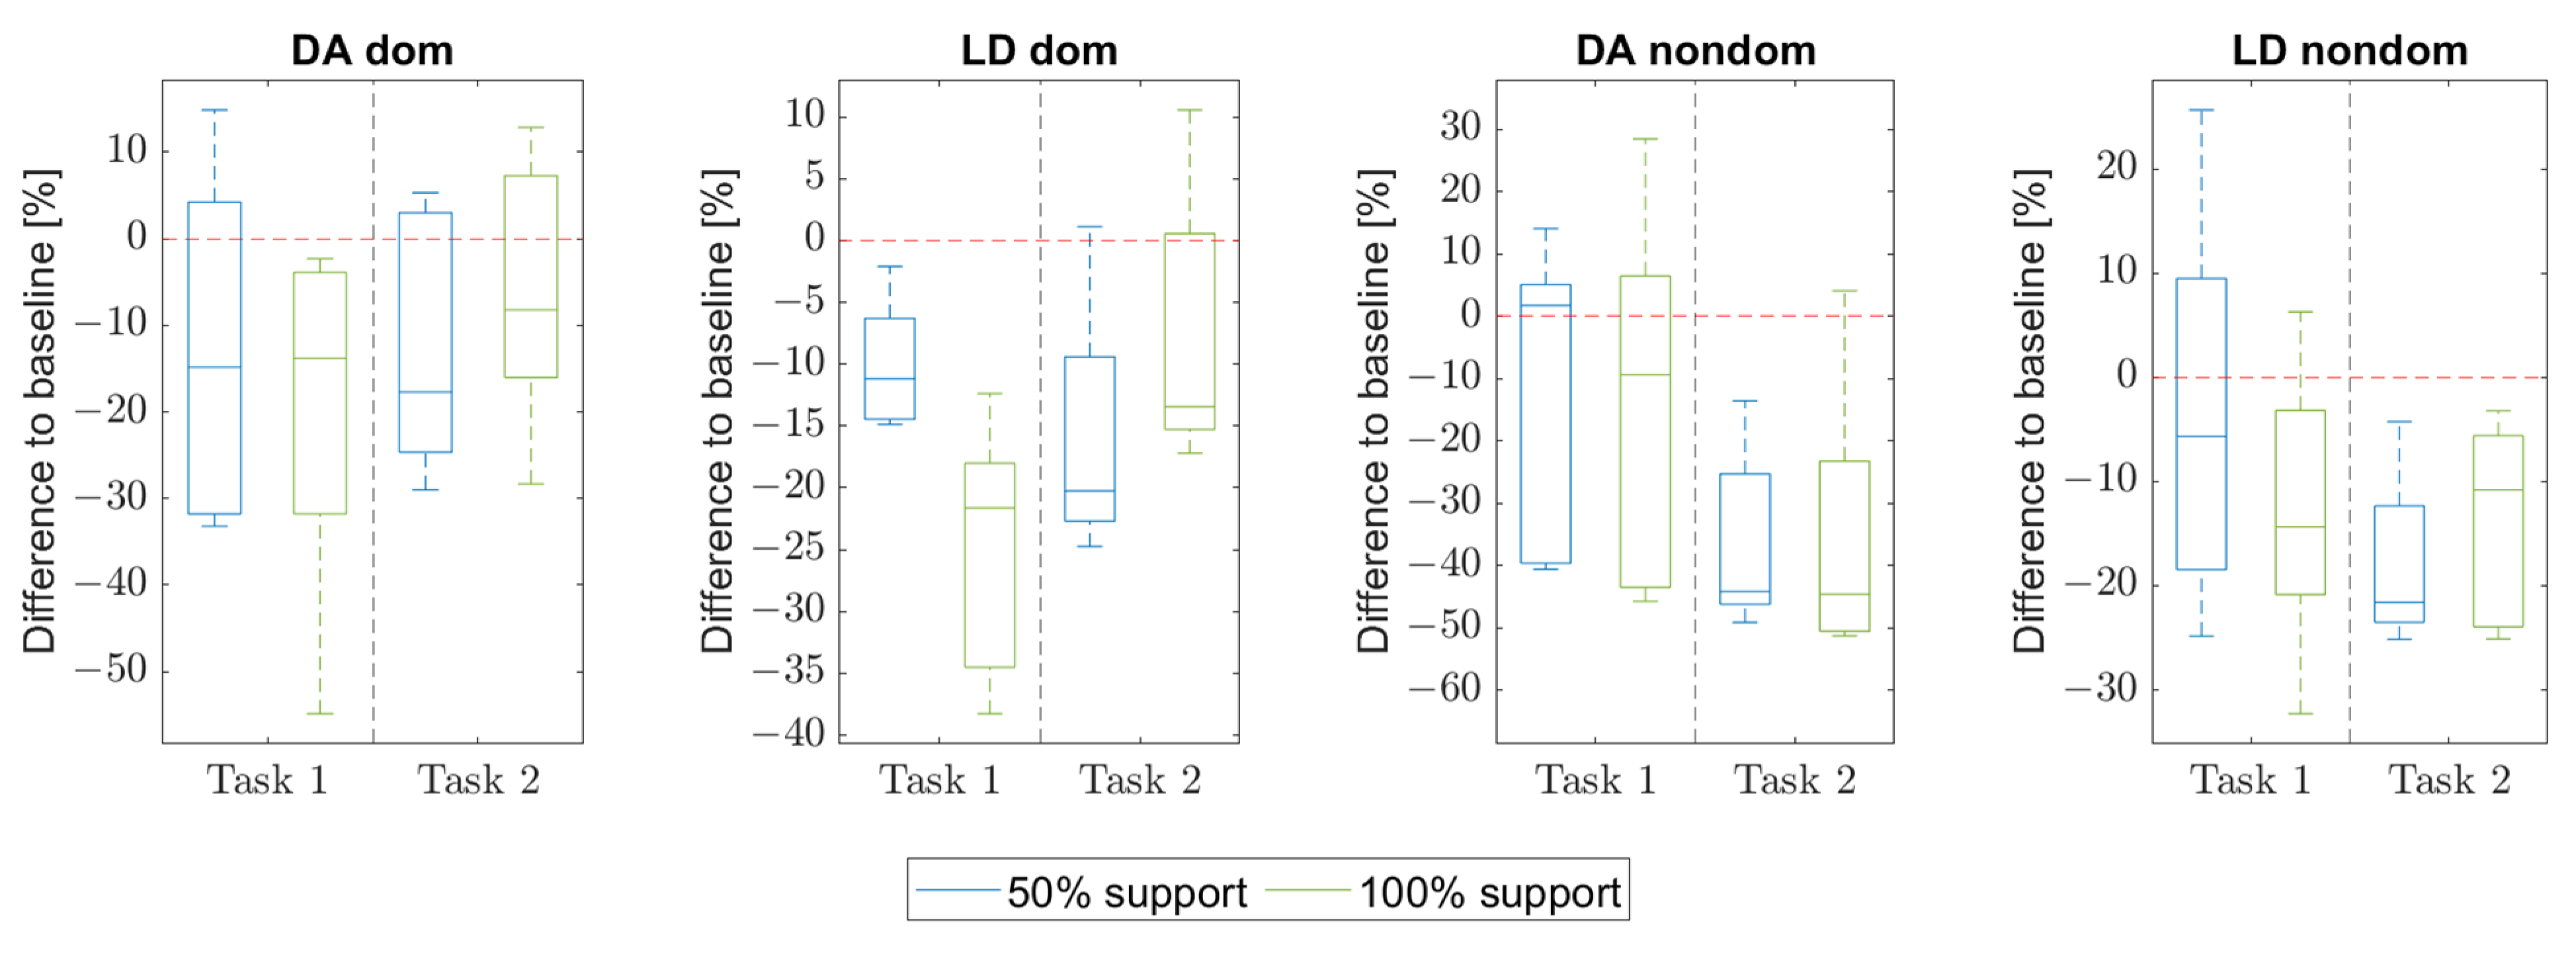
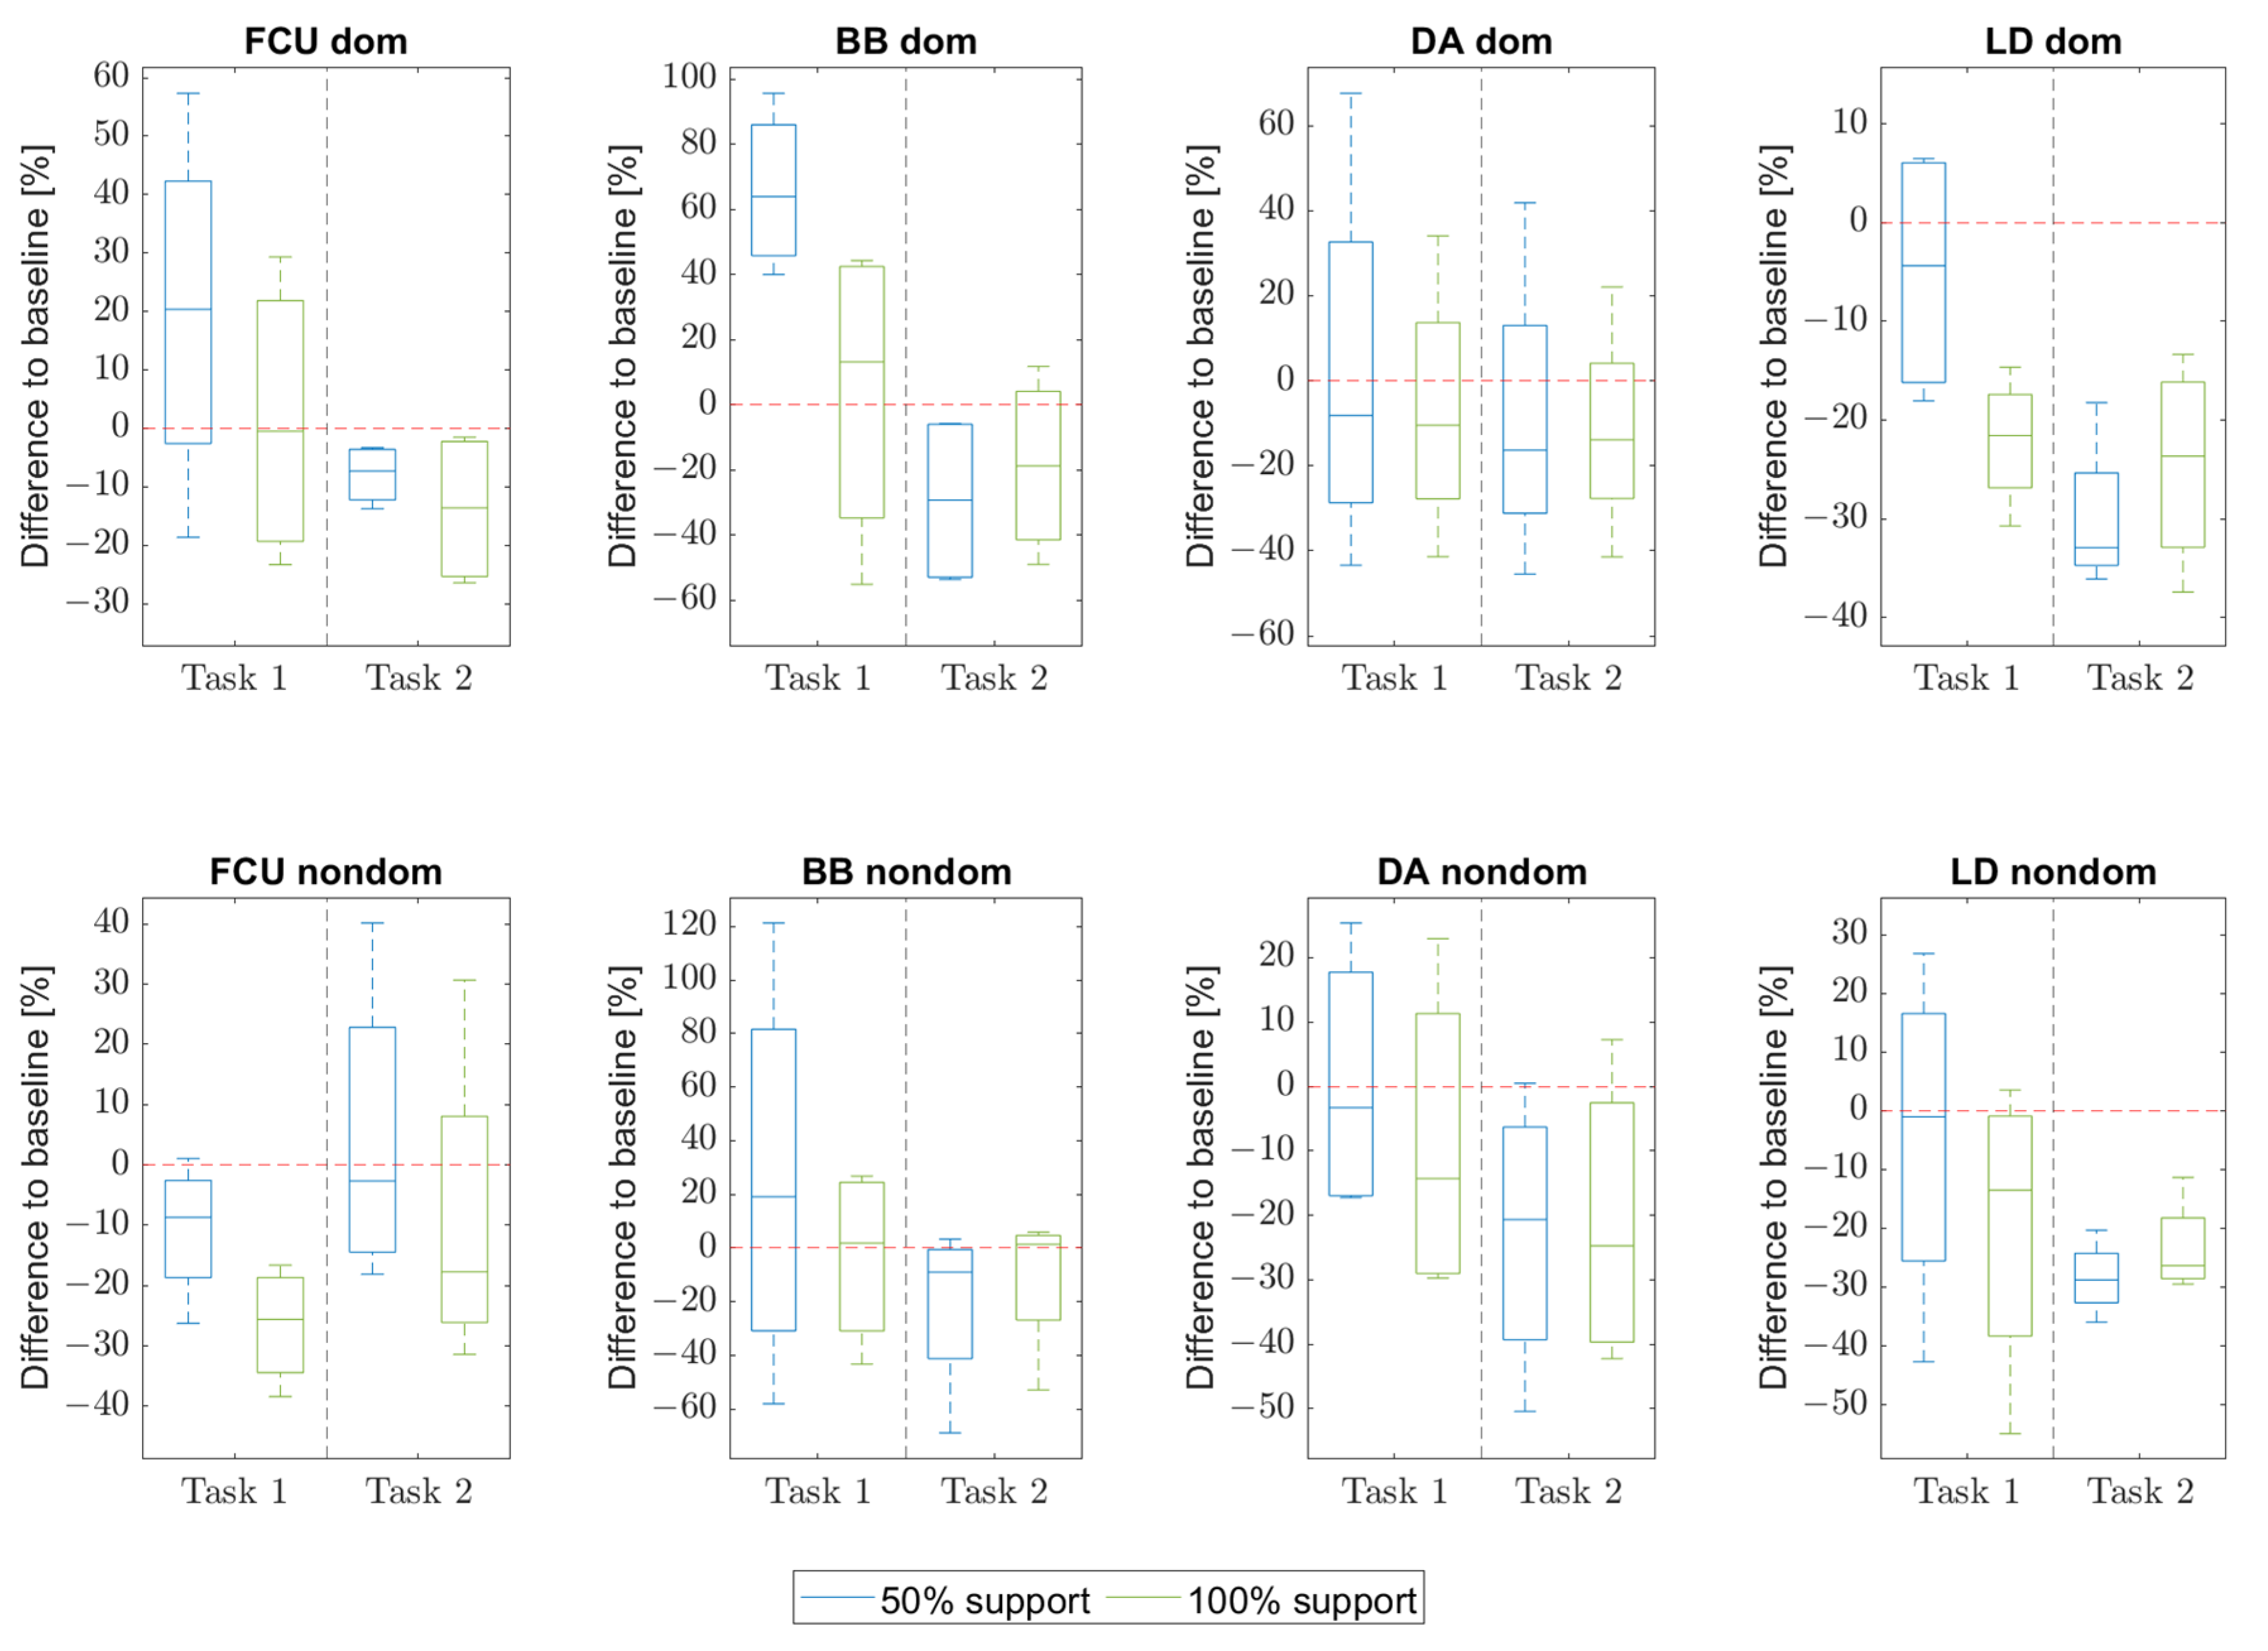
3.3.1. Muscle Activities for the Whole Motion Sequence
3.3.2. Muscle Activities during the Arm Lifting Processes
3.3.3. Muscle Activities during Screw Phase of the Motion
3.3.4. Muscle Activities during the Arm Lowering Processes
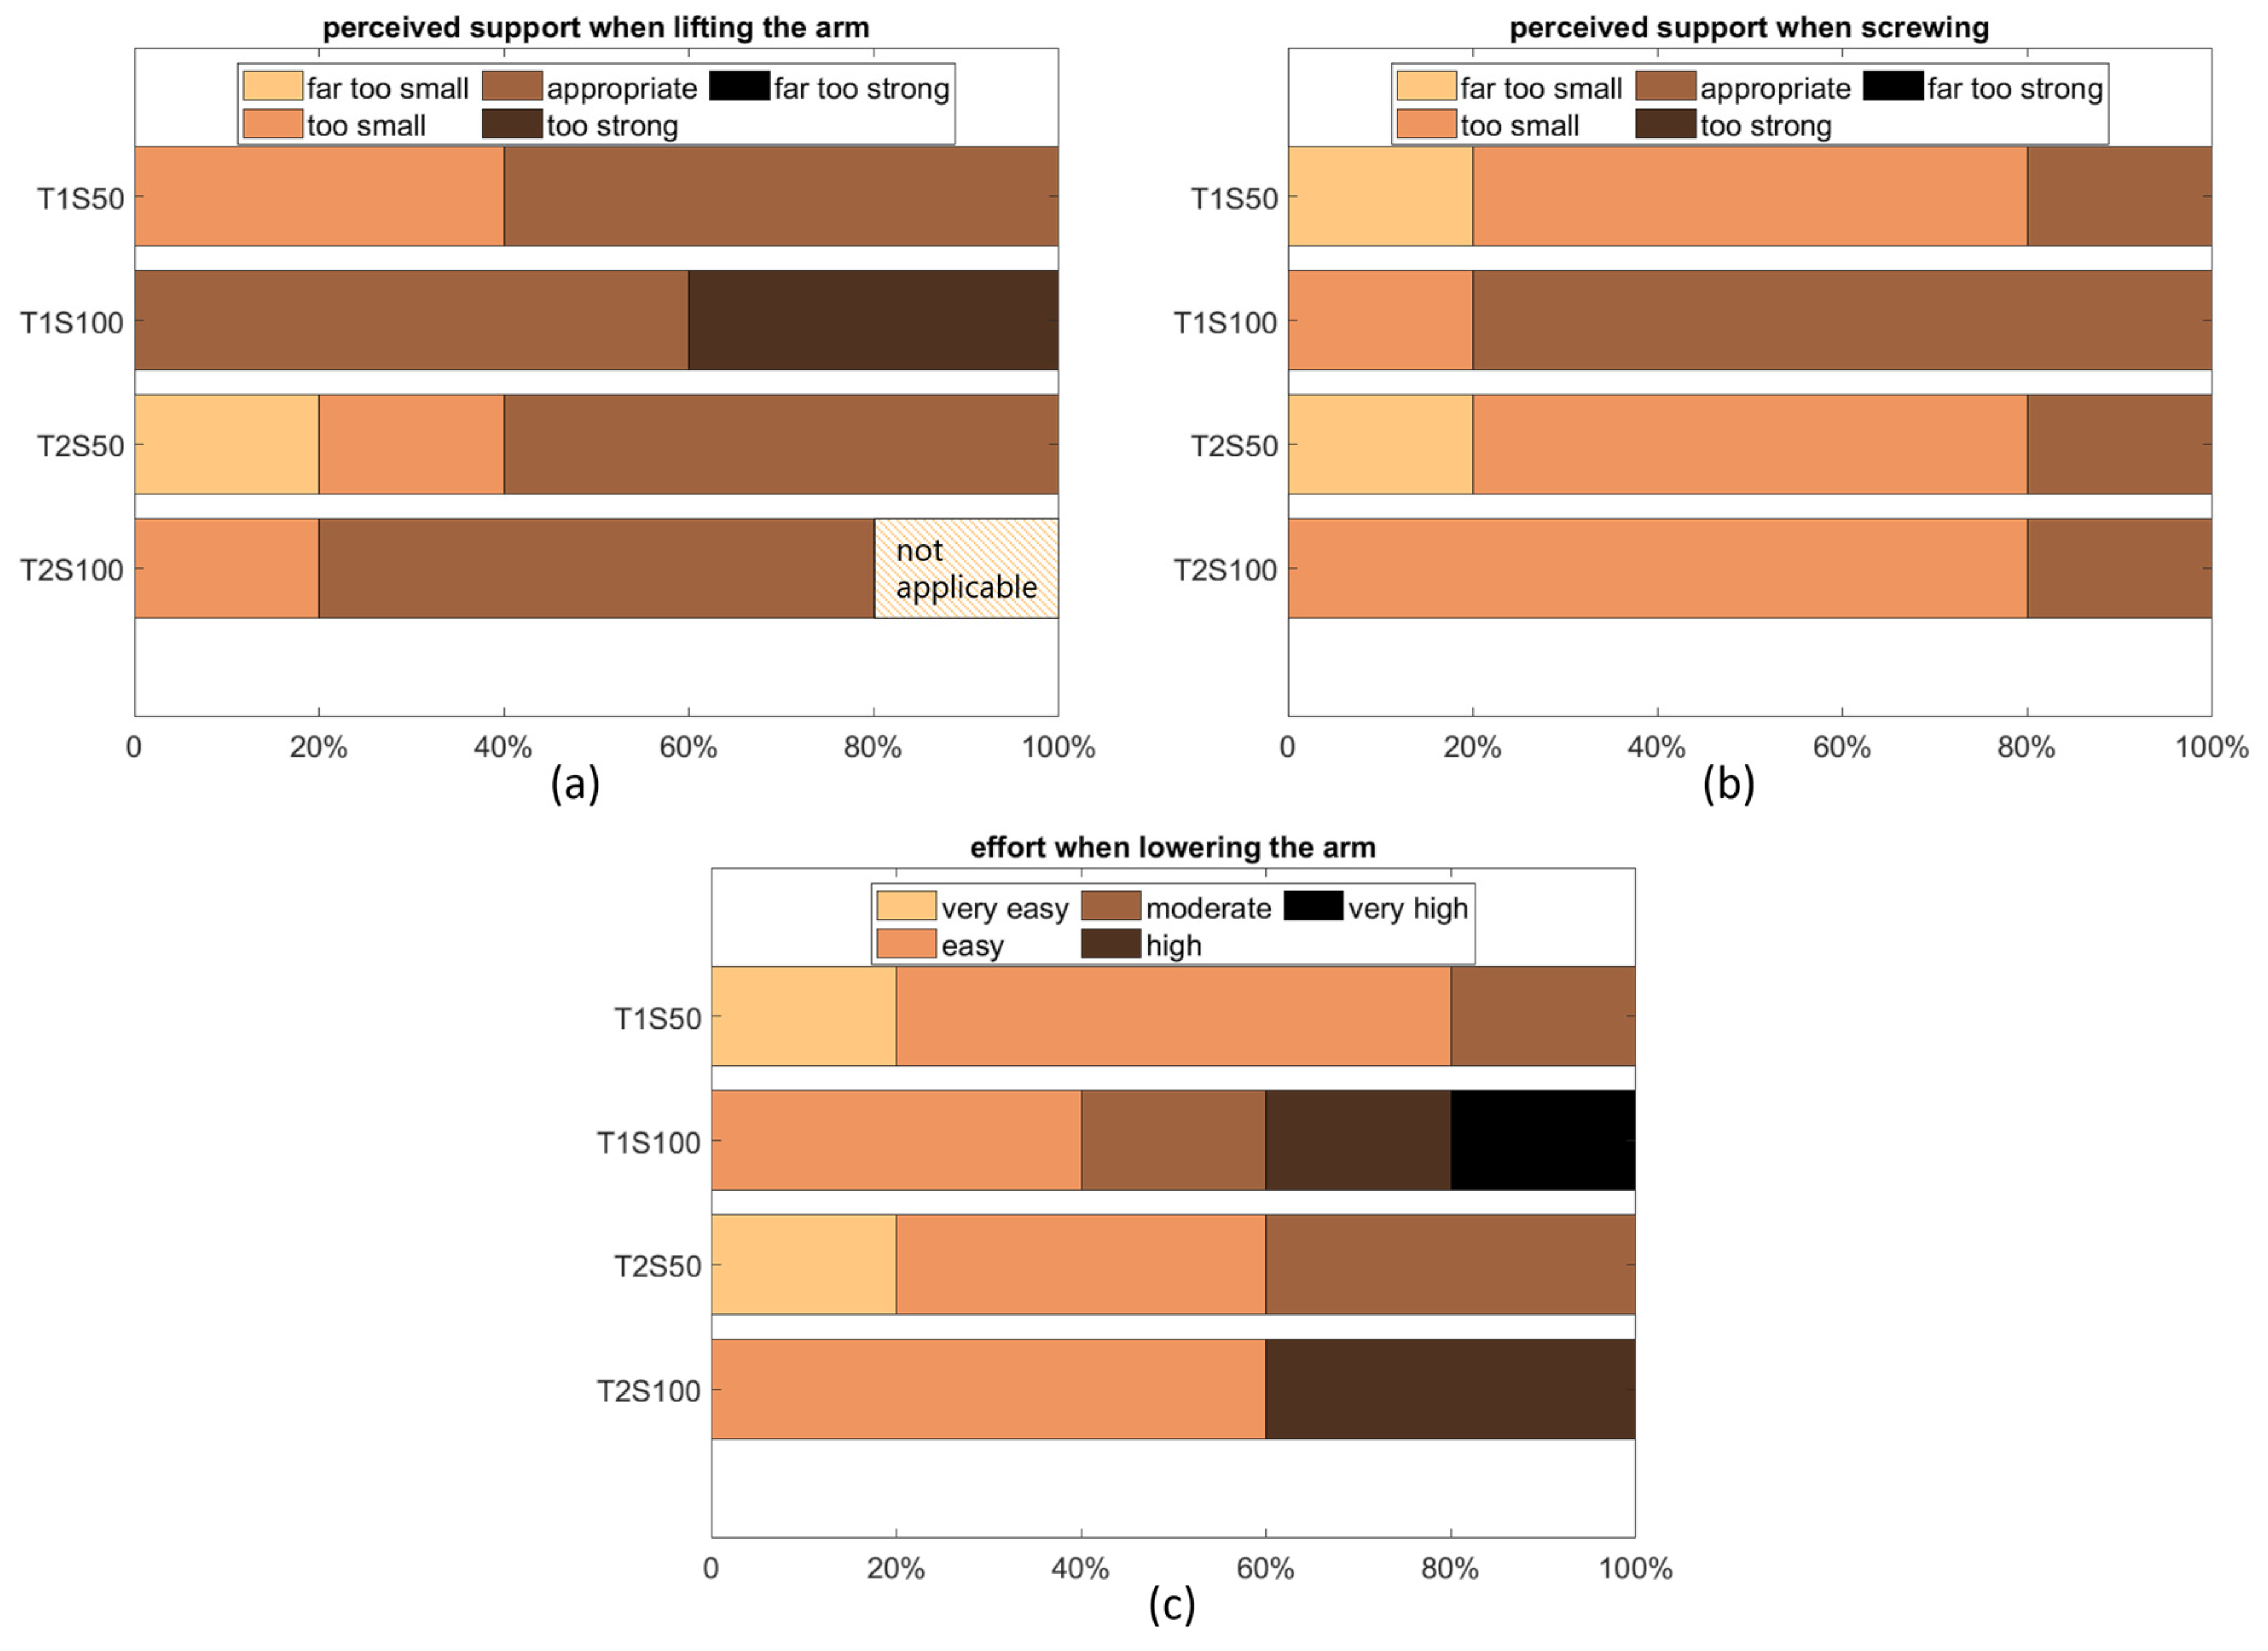
3.4. Subjective Perception of Support Force
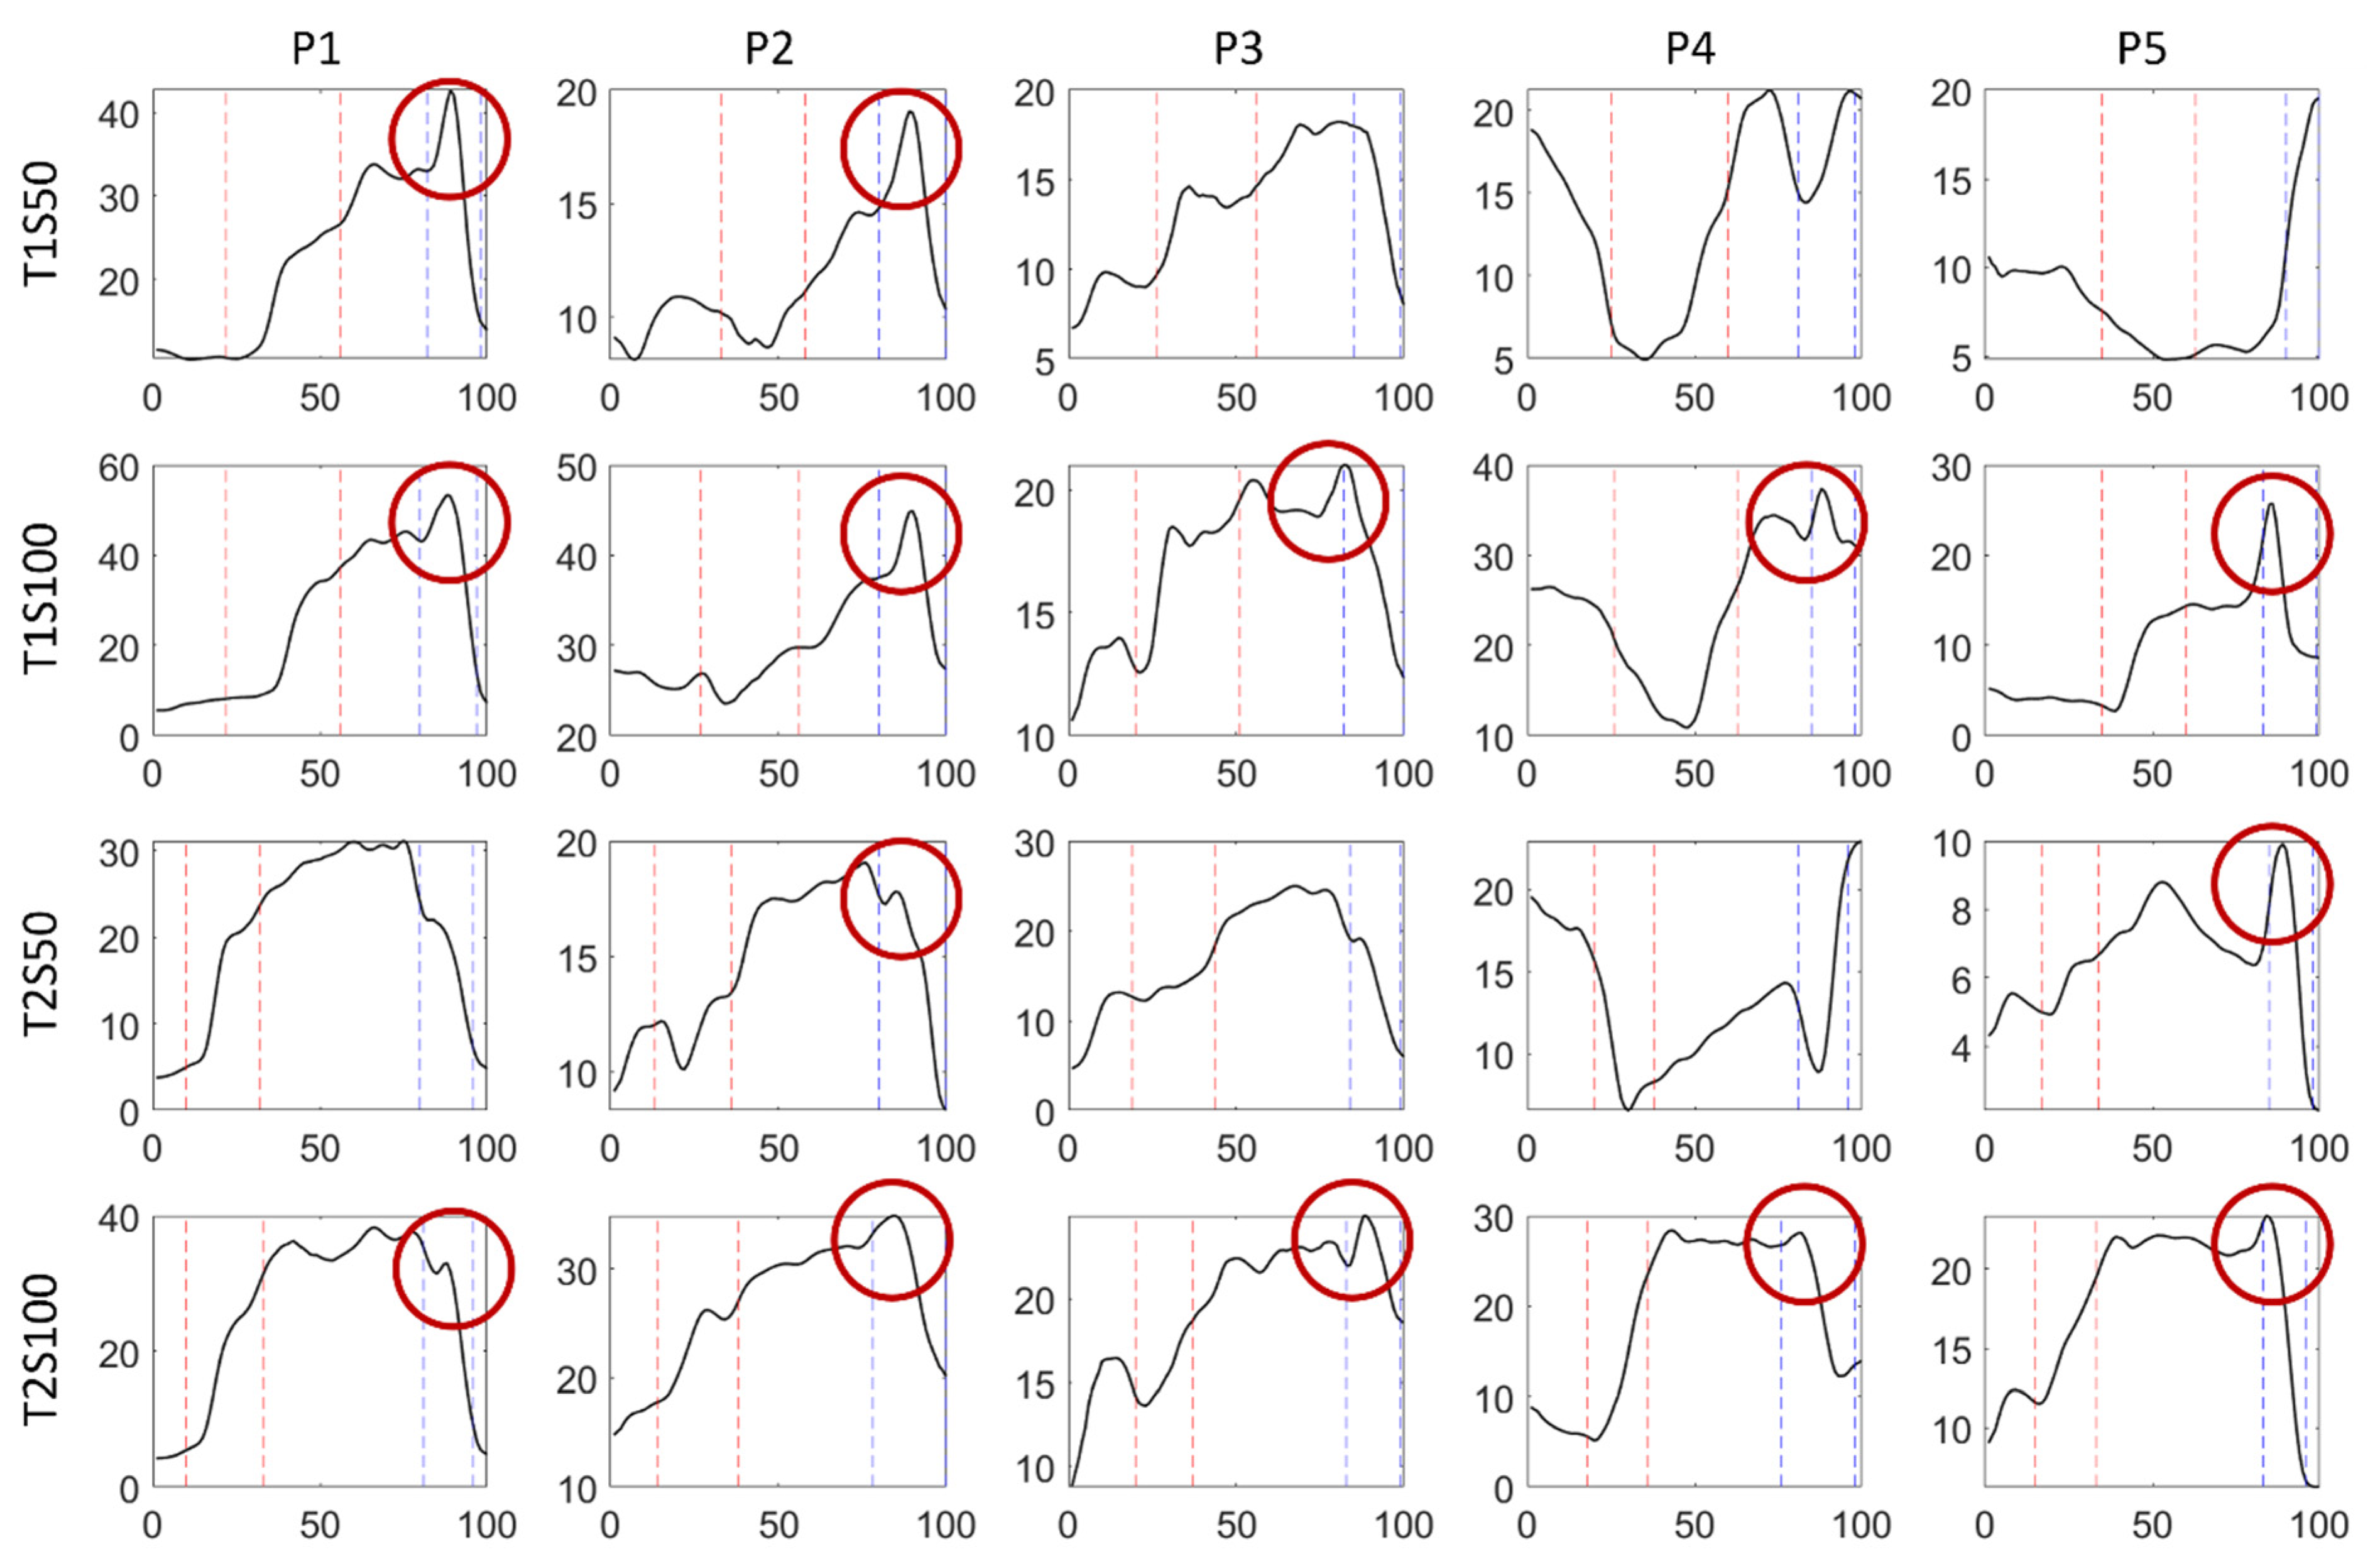
3.5. Human-Exoskeleton Interaction Force
4. Discussion
Limitations of the Study
5. Conclusions
Author Contributions
Funding
Institutional Review Board Statement
Informed Consent Statement
Data Availability Statement
Conflicts of Interest
References
- Fritzsche, L.; Wegge, J.; Schmauder, M.; Kliegel, M.; Schmidt, K.-H. Good ergonomics and team diversity reduce absenteeism and errors in car manufacturing. Ergonomics 2014, 57, 148–161. [Google Scholar] [CrossRef]
- European Commission. EU Labour Force Survey 2020: Module on Accidents at Work and Other Work-Related Health Problems: Assessment Report, 2021 ed.; Publications Office of the European Union: Luxembourg, 2021; ISBN 9789276420040. [Google Scholar]
- BAuA/BMAS. Sicherheit und Gesundheit bei der Arbeit—Berichtsjahr 2016. Bundesministerium für Arbeit und Soziales (BMAS) 2017. Available online: https://www.baua.de/dok/8732292 (accessed on 1 June 2022).
- De Looze, M.P.; Bosch, T.; Krause, F.; Stadler, K.S.; O’Sullivan, L.W. Exoskeletons for industrial application and their potential effects on physical work load. Ergonomics 2016, 59, 671–681. [Google Scholar] [CrossRef] [PubMed]
- Kim, S.; Nussbaum, M.A. A Follow-Up Study of the Effects of an Arm Support Exoskeleton on Physical Demands and Task Performance During Simulated Overhead Work. IISE Trans. Occup. Ergon. Hum. Factors 2019, 7, 163–174. [Google Scholar] [CrossRef]
- Bär, M.; Steinhilber, B.; Rieger, M.A.; Luger, T. The influence of using exoskeletons during occupational tasks on acute physical stress and strain compared to no exoskeleton—A systematic review and meta-analysis. Appl. Ergon. 2021, 94, 103385. [Google Scholar] [CrossRef] [PubMed]
- Miehling, J.; Wolf, A.; Wartzack, S. Musculoskeletal Simulation and Evaluation of Support System Designs. In Developing Support Technologies: Integrating Multiple Perspectives to Create Assistance that People Really Want; Karafillidis, A., Weidner, R., Eds.; Springer International Publishing: Cham, Switzerland, 2018; pp. 219–227. ISBN 978-3-030-01836-8. [Google Scholar]
- Moeller, T.; Krell-Roesch, J.; Woll, A.; Stein, T. Effects of Upper-Limb Exoskeletons Designed for Use in the Working Environment-A Literature Review. Front. Robot. AI 2022, 9, 858893. [Google Scholar] [CrossRef] [PubMed]
- Otten, B.; Weidner, R.; Linnenberg, C. Light weight support systems with inherent biomechanic compatibility for tasks at or above head level. In Proceedings of the 2nd Transdisciplinary Conference “Technical Support Systems, That People Really Want”; Springer: Berlin/Heidelberg, Germany, 2016; pp. 495–505. [Google Scholar]
- Otten, B.M.; Weidner, R.; Argubi-Wollesen, A. Evaluation of a Novel Active Exoskeleton for Tasks at or Above Head Level. IEEE Robot. Autom. Lett. 2018, 3, 2408–2415. [Google Scholar] [CrossRef]
- Molz, C.; Yao, Z.; Sänger, J.; Gwosch, T.; Weidner, R.; Matthiesen, S.; Wartzack, S.; Miehling, J. A Musculoskeletal Human Model-Based Approach for Evaluating Support Concepts of Exoskeletons for Selected Use Cases. Proc. Des. Soc. 2022, 2, 515–524. [Google Scholar] [CrossRef]
- Hefferle, M.; Lechner, M.; Kluth, K.; Christian, M. Development of a Standardized Ergonomic Assessment Methodology for Exoskeletons Using Both Subjective and Objective Measurement Techniques. In Advances in Human Factors in Robots and Unmanned Systems; Chen, J., Ed.; Springer International Publishing: Cham, Switzerland, 2020; pp. 49–59. ISBN 978-3-030-20466-2. [Google Scholar]
- Maurice, P.; Camernik, J.; Gorjan, D.; Schirrmeister, B.; Bornmann, J.; Tagliapietra, L.; Latella, C.; Pucci, D.; Fritzsche, L.; Ivaldi, S.; et al. Objective and Subjective Effects of a Passive Exoskeleton on Overhead Work. IEEE Trans. Neural Syst. Rehabil. Eng. 2020, 28, 152–164. [Google Scholar] [CrossRef]
- Alabdulkarim, S.; Nussbaum, M.A. Influences of different exoskeleton designs and tool mass on physical demands and performance in a simulated overhead drilling task. Appl. Ergon. 2019, 74, 55–66. [Google Scholar] [CrossRef]
- McFarland, T.C.; McDonald, A.C.; Whittaker, R.L.; Callaghan, J.P.; Dickerson, C.R. Level of exoskeleton support influences shoulder elevation, external rotation and forearm pronation during simulated work tasks in females. Appl. Ergon. 2022, 98, 103591. [Google Scholar] [CrossRef] [PubMed]
- Argubi-Wollesen, A. Entwicklung und Biomechanische Evaluation eines Körpergetragenen Unterstützungssystems (Exoskelett) für Arbeiten in und über Kopfhöhe. 2021. Available online: https://ediss.sub.uni-hamburg.de/handle/ediss/9166 (accessed on 3 June 2022).
- Dörr, M.; Ries, M.; Gwosch, T.; Matthiesen, S. Recognizing Product Application based on Integrated Consumer Grade Sensors: A Case Study with Handheld Power Tools. Procedia CIRP 2019, 84, 798–803. [Google Scholar] [CrossRef]
- Hermens, H.J. (Ed.) European Recommendations for Surface ElectroMyoGraphy: Results of the SENIAM Project; Roessingh Research and Development B.V.: Enschede, The Netherlands, 1999; ISBN 978-90-75452-15-0. [Google Scholar]
- Borg, G. Borg’s Perceived Exertion and Pain Scales; Human Kinetics: Champaign, IL, US, 1998; ISBN 0-88011-623-4. [Google Scholar]
- Hart, S.G.; Staveland, L.E. Development of NASA-TLX (Task Load Index): Results of Empirical and Theoretical Research. In Human Mental Workload; Elsevier: Amsterdam, The Netherlands, 1988; pp. 139–183. ISBN 9780444703880. [Google Scholar]


| Age [Years] | Body Height [cm] | Weight [kg] | Shoulder Width [cm] | Upper Arm Length [cm] | ||
|---|---|---|---|---|---|---|
| participant | P1 | 29 | 180 | 74.2 | 43 | 37 |
| P2 | 44 | 178 | 69.3 | 40 | 35 | |
| P3 | 23 | 188 | 93.0 | 47 | 41 | |
| P4 | 21 | 184 | 65.2 | 40 | 38 | |
| P5 | 28 | 182 | 65.0 | 40 | 38 |
| Cycles (Duration/Cycle) | Task Apparatus | Shoulder Elevation Angle [°] | Screwdriver Adjustments | |
|---|---|---|---|---|
| task T1 | 10 (10 s/cycle) | plywood board (size: 400 × 600 × 55 mm) wooden component (size: 50 × 50 × 10 mm with central borehole) wood screw (5 × 60 mm, T-STAR plus T20, SPAX International GmbH & Co. KG, Ennepetal, Germany) | 0–130 | SS 2: 0–850 rpm TS 10: 5.3 Nm |
| task T2 | 10 (15 s/cycle) | solid structural timber (size: 400 × 400 × 160 mm) wood screw (10 × 100 mm, TX40, Fischerwerke GmbH & Co. KG, Waldachtal, Germany) | 0–100 | SS 1: 0–400 rpm TS 12: 11.5 Nm |
| Mean Value [CR10] | |||
|---|---|---|---|
| Support level | Task overall | Dom. shoulder | |
| task T1 | S0: no exoskeleton | 4.4 | 6.0 |
| S50: 50% support | 4.6 | 5.7 | |
| S100: 100% support | 3.2 | 4.3 | |
| task T2 | S0: no exoskeleton | 5.8 | 6.3 |
| S50: 50% support | 4.4 | 5.0 | |
| S100: 100% support | 4.2 | 4.7 | |
Publisher’s Note: MDPI stays neutral with regard to jurisdictional claims in published maps and institutional affiliations. |
© 2022 by the authors. Licensee MDPI, Basel, Switzerland. This article is an open access article distributed under the terms and conditions of the Creative Commons Attribution (CC BY) license (https://creativecommons.org/licenses/by/4.0/).
Share and Cite
Sänger, J.; Yao, Z.; Schubert, T.; Wolf, A.; Molz, C.; Miehling, J.; Wartzack, S.; Gwosch, T.; Matthiesen, S.; Weidner, R. Evaluation of Active Shoulder Exoskeleton Support to Deduce Application-Oriented Optimization Potentials for Overhead Work. Appl. Sci. 2022, 12, 10805. https://doi.org/10.3390/app122110805
Sänger J, Yao Z, Schubert T, Wolf A, Molz C, Miehling J, Wartzack S, Gwosch T, Matthiesen S, Weidner R. Evaluation of Active Shoulder Exoskeleton Support to Deduce Application-Oriented Optimization Potentials for Overhead Work. Applied Sciences. 2022; 12(21):10805. https://doi.org/10.3390/app122110805
Chicago/Turabian StyleSänger, Johannes, Zhejun Yao, Tim Schubert, Alexander Wolf, Carla Molz, Jörg Miehling, Sandro Wartzack, Thomas Gwosch, Sven Matthiesen, and Robert Weidner. 2022. "Evaluation of Active Shoulder Exoskeleton Support to Deduce Application-Oriented Optimization Potentials for Overhead Work" Applied Sciences 12, no. 21: 10805. https://doi.org/10.3390/app122110805
APA StyleSänger, J., Yao, Z., Schubert, T., Wolf, A., Molz, C., Miehling, J., Wartzack, S., Gwosch, T., Matthiesen, S., & Weidner, R. (2022). Evaluation of Active Shoulder Exoskeleton Support to Deduce Application-Oriented Optimization Potentials for Overhead Work. Applied Sciences, 12(21), 10805. https://doi.org/10.3390/app122110805