

Study of Stress Distribution Characteristics of Reinforced Earth Retaining Walls under Cyclic Loading


Abstract
:1. Introduction
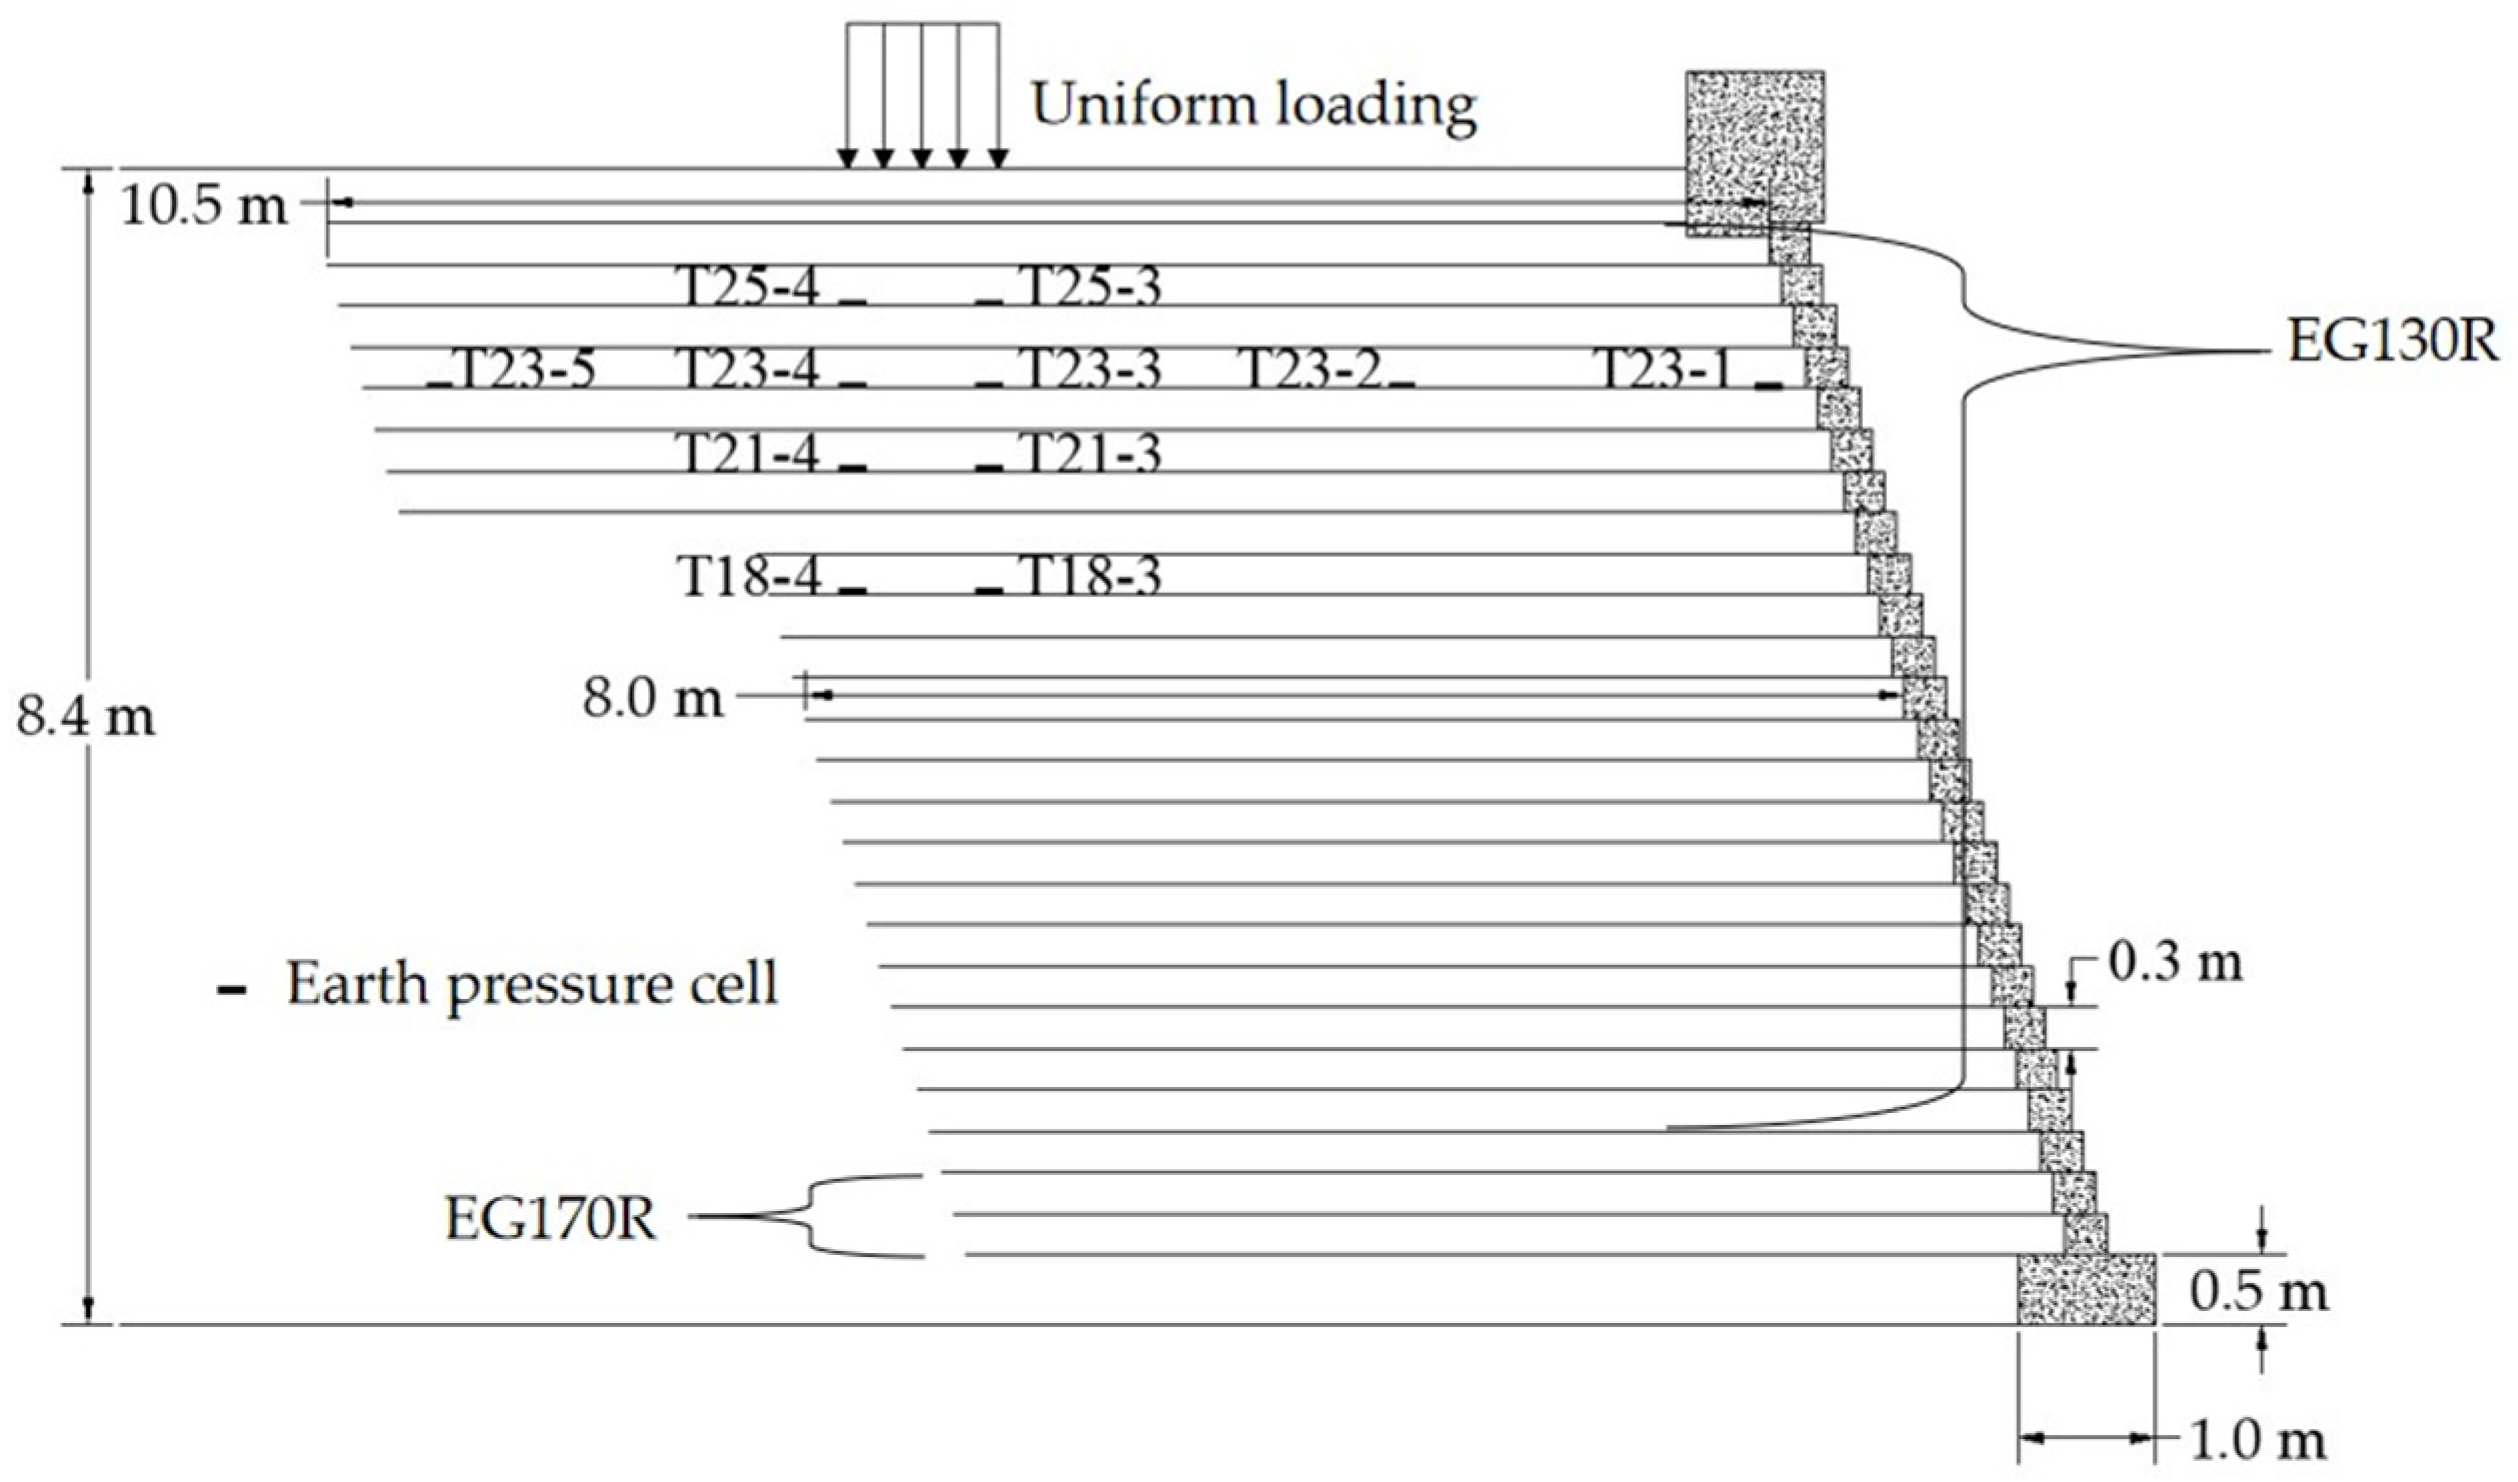
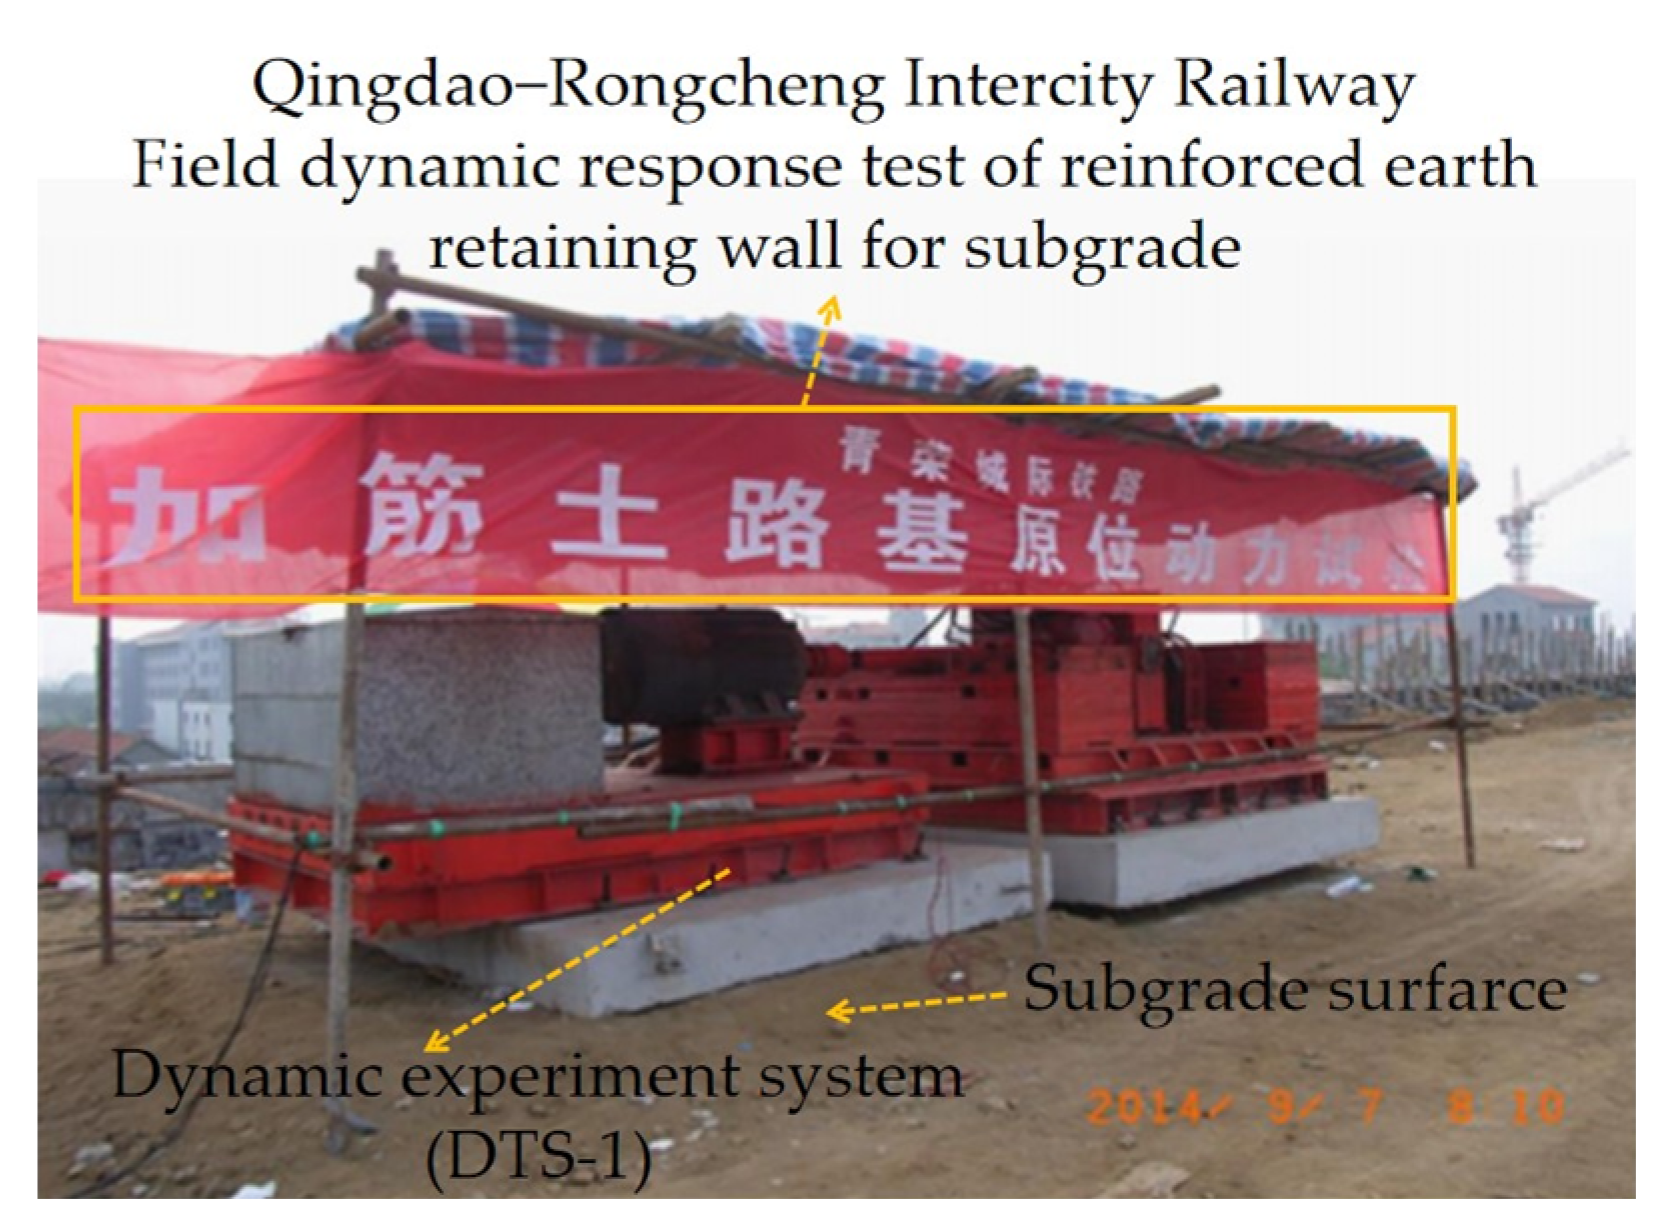
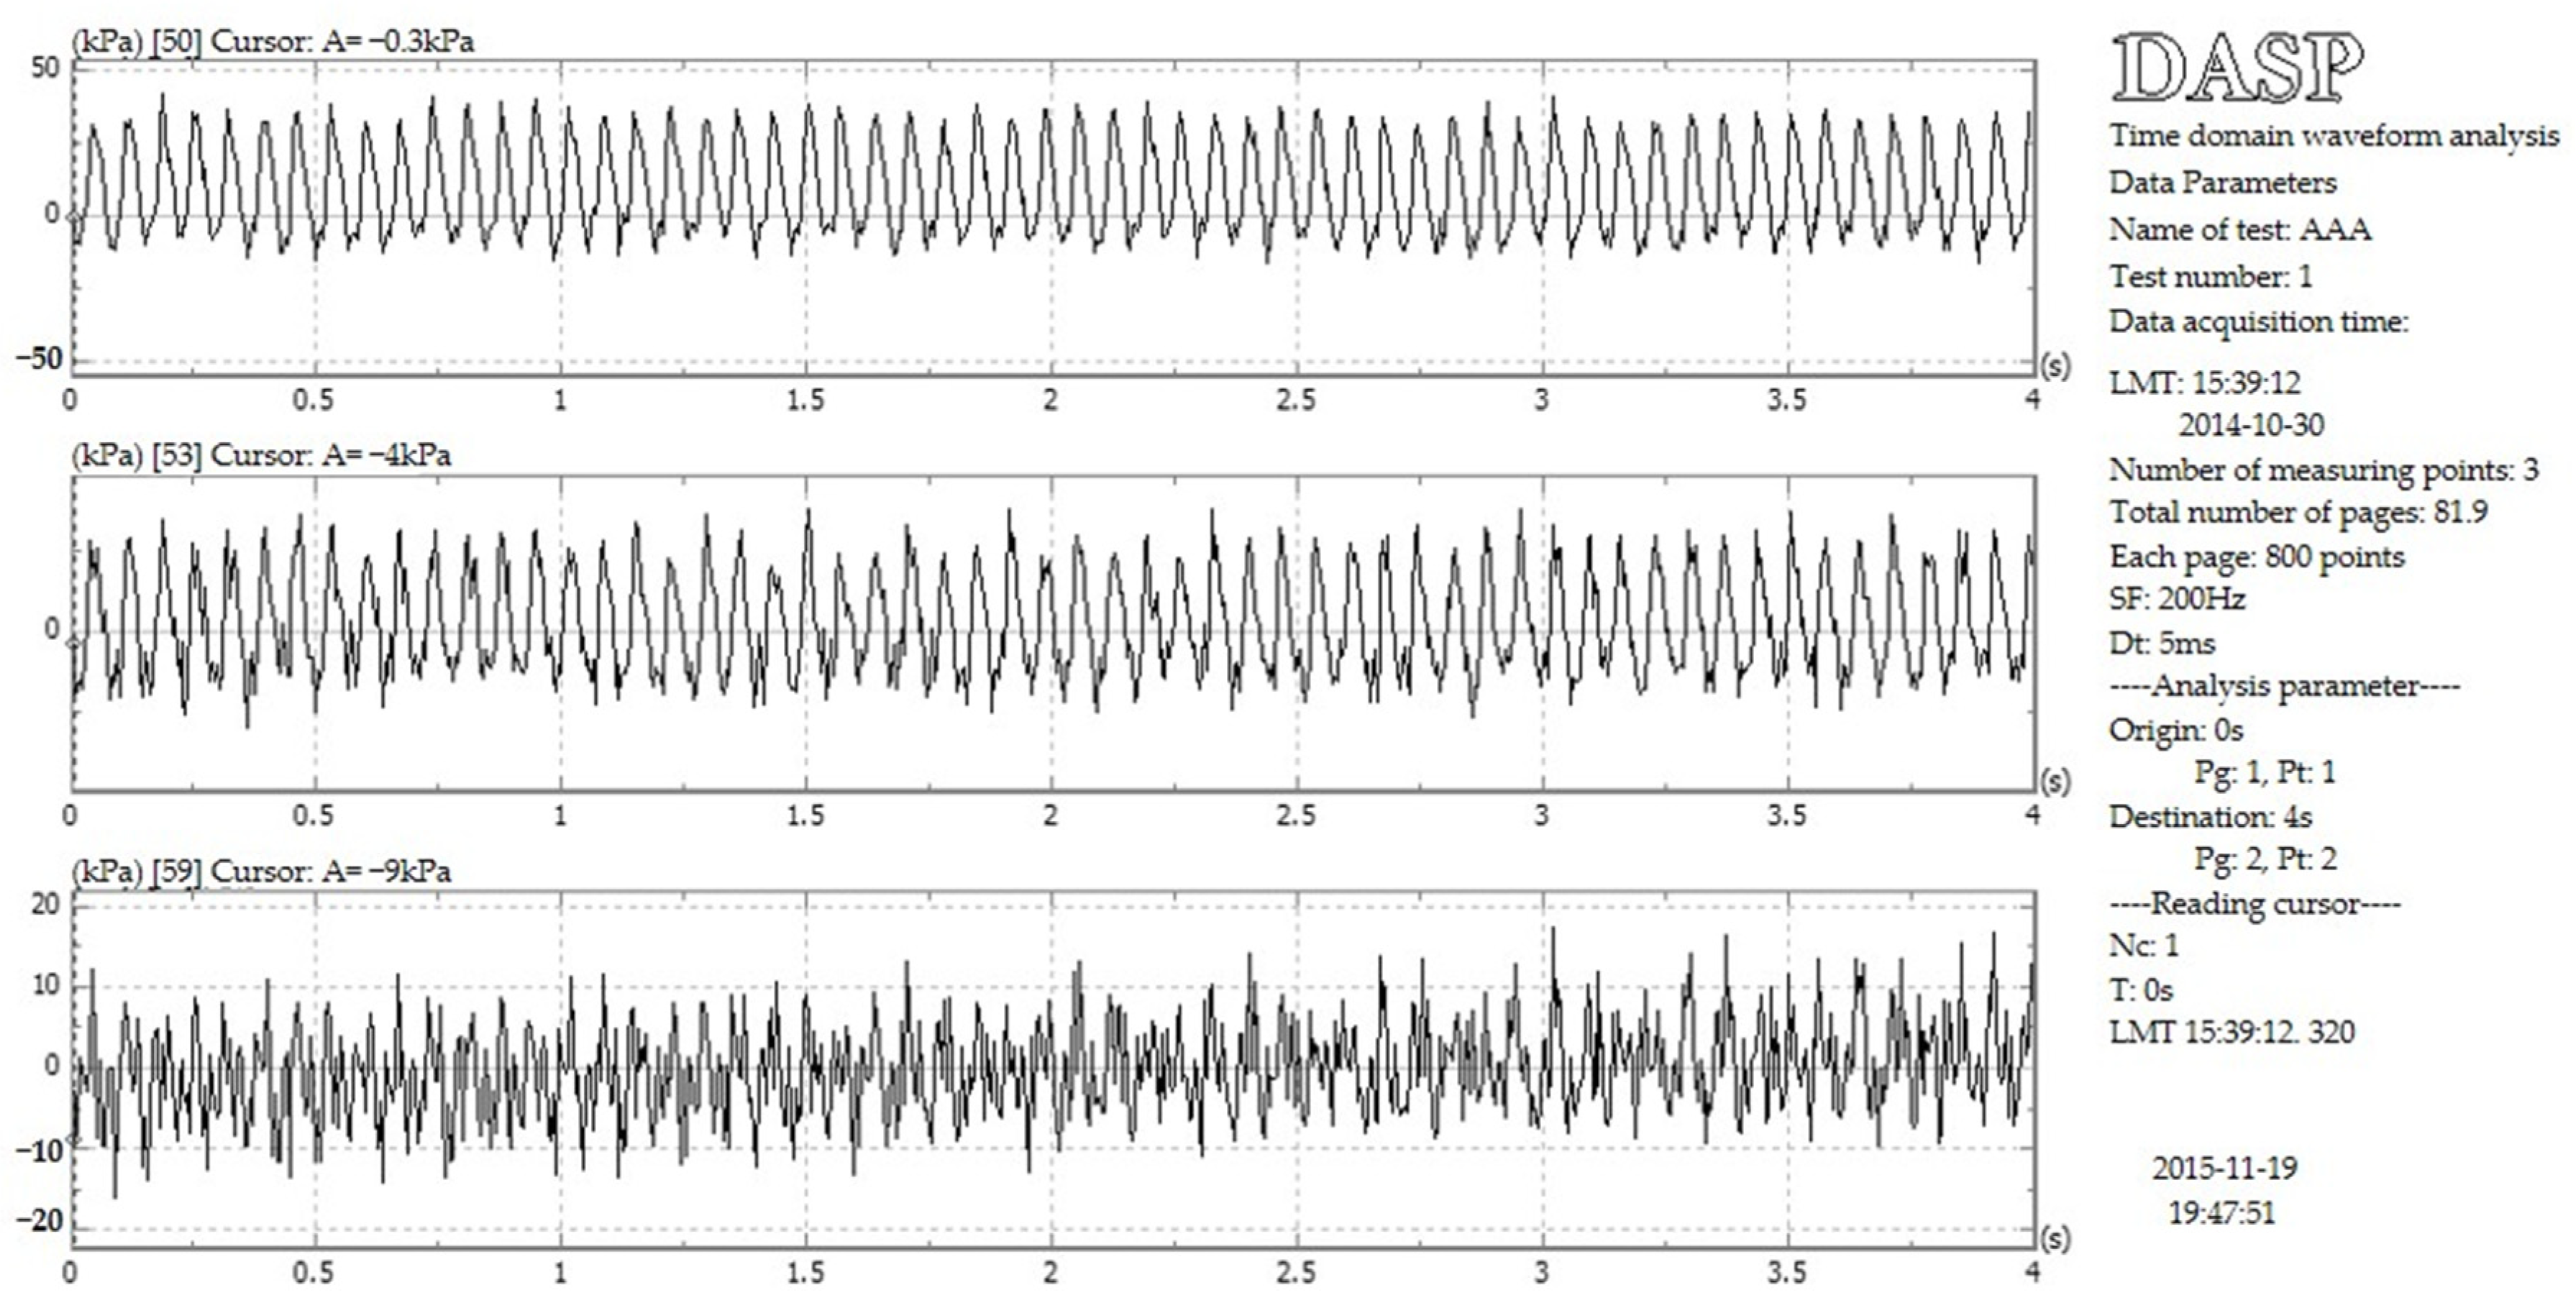
2. Materials Methods
3. Results and Discussion
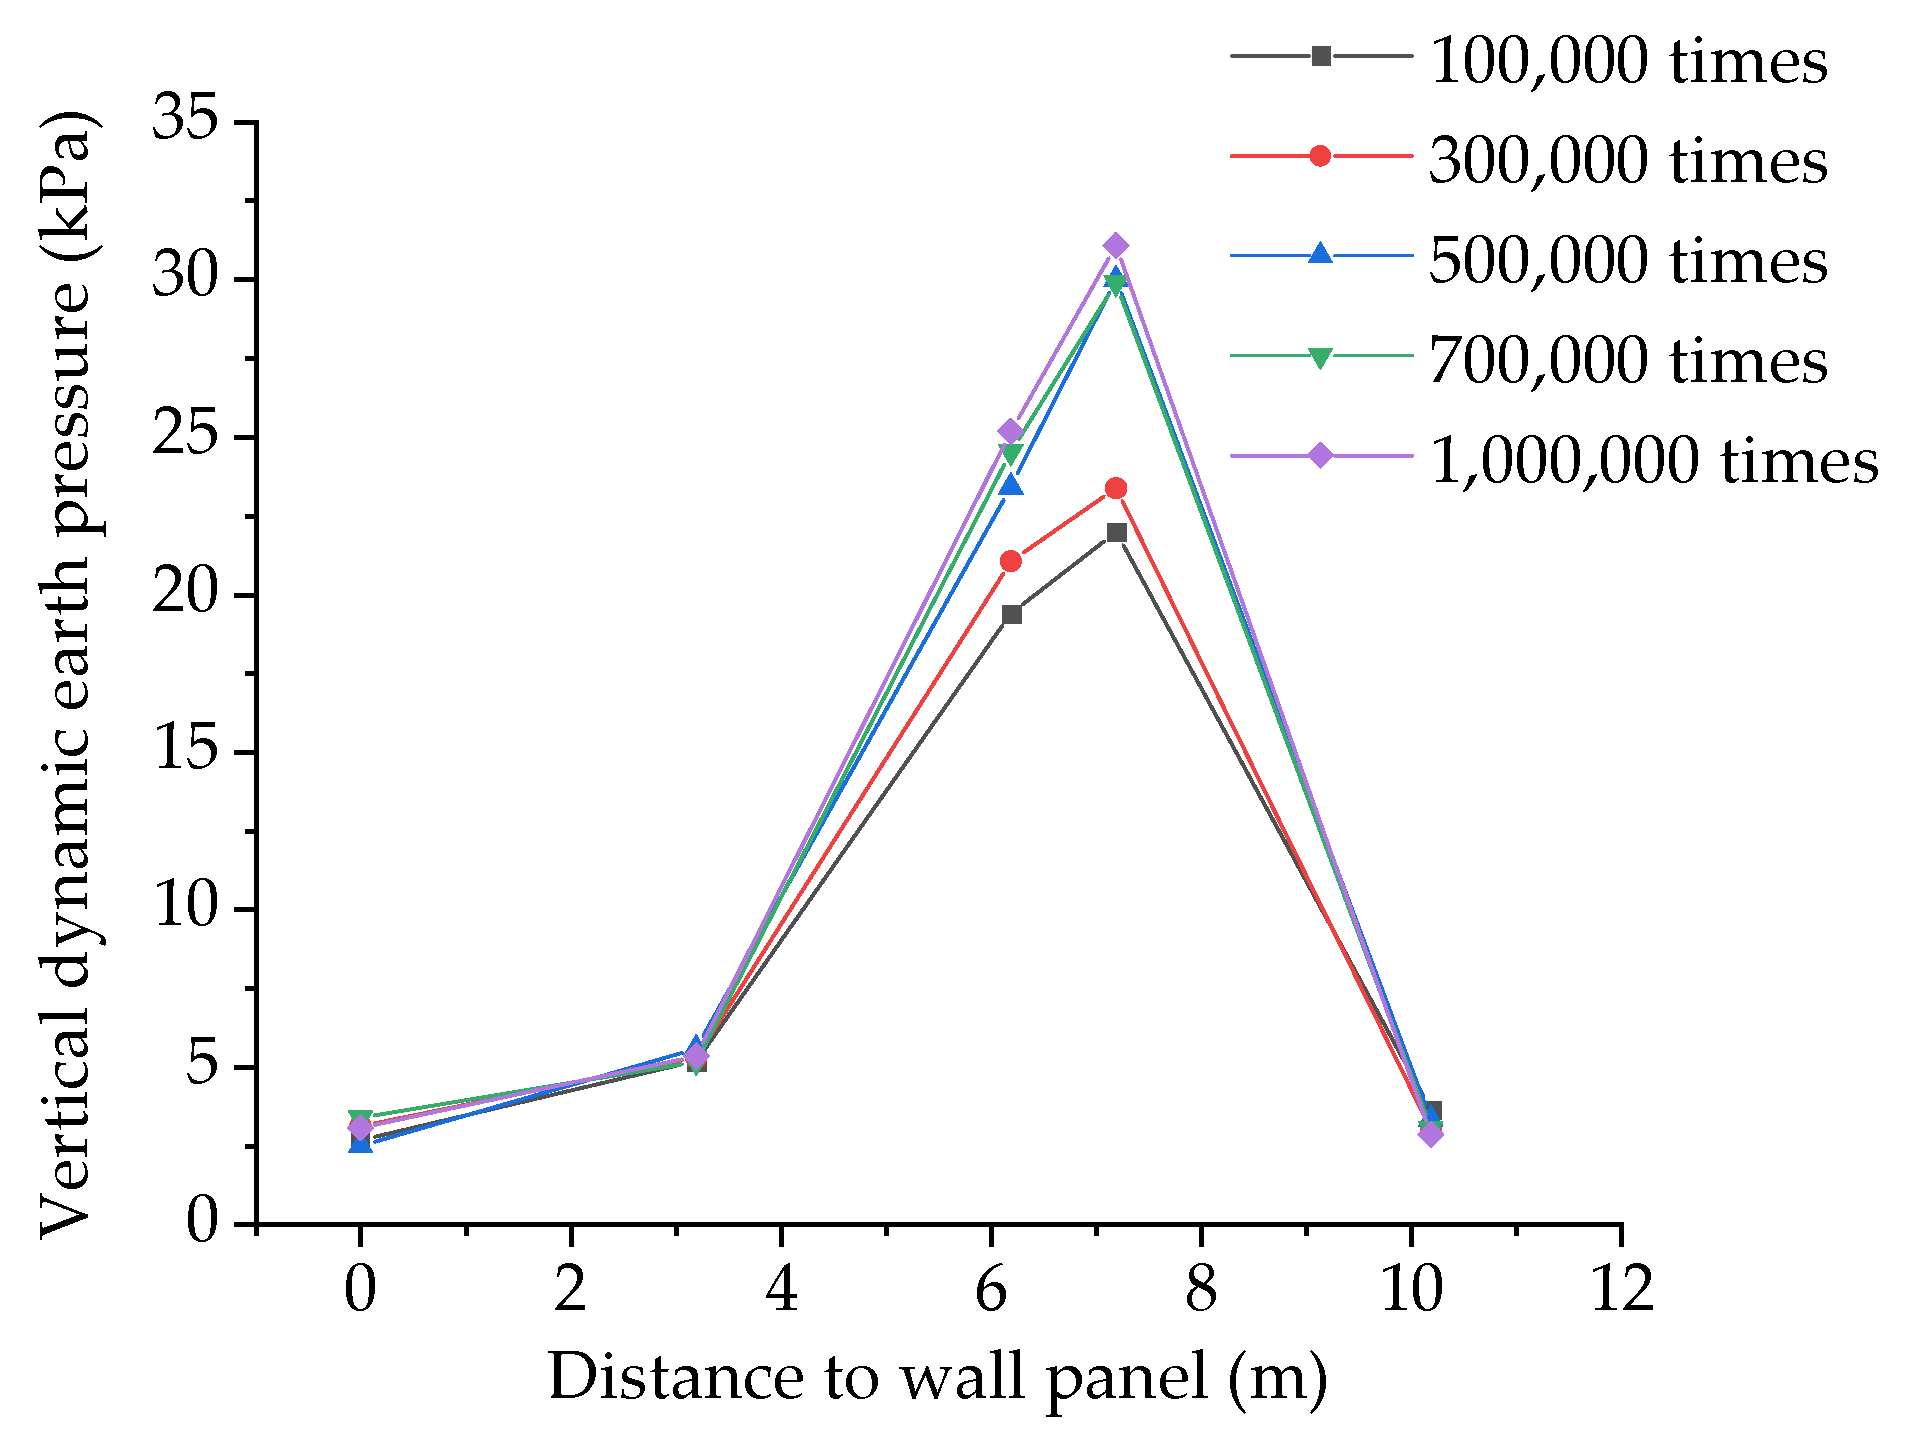
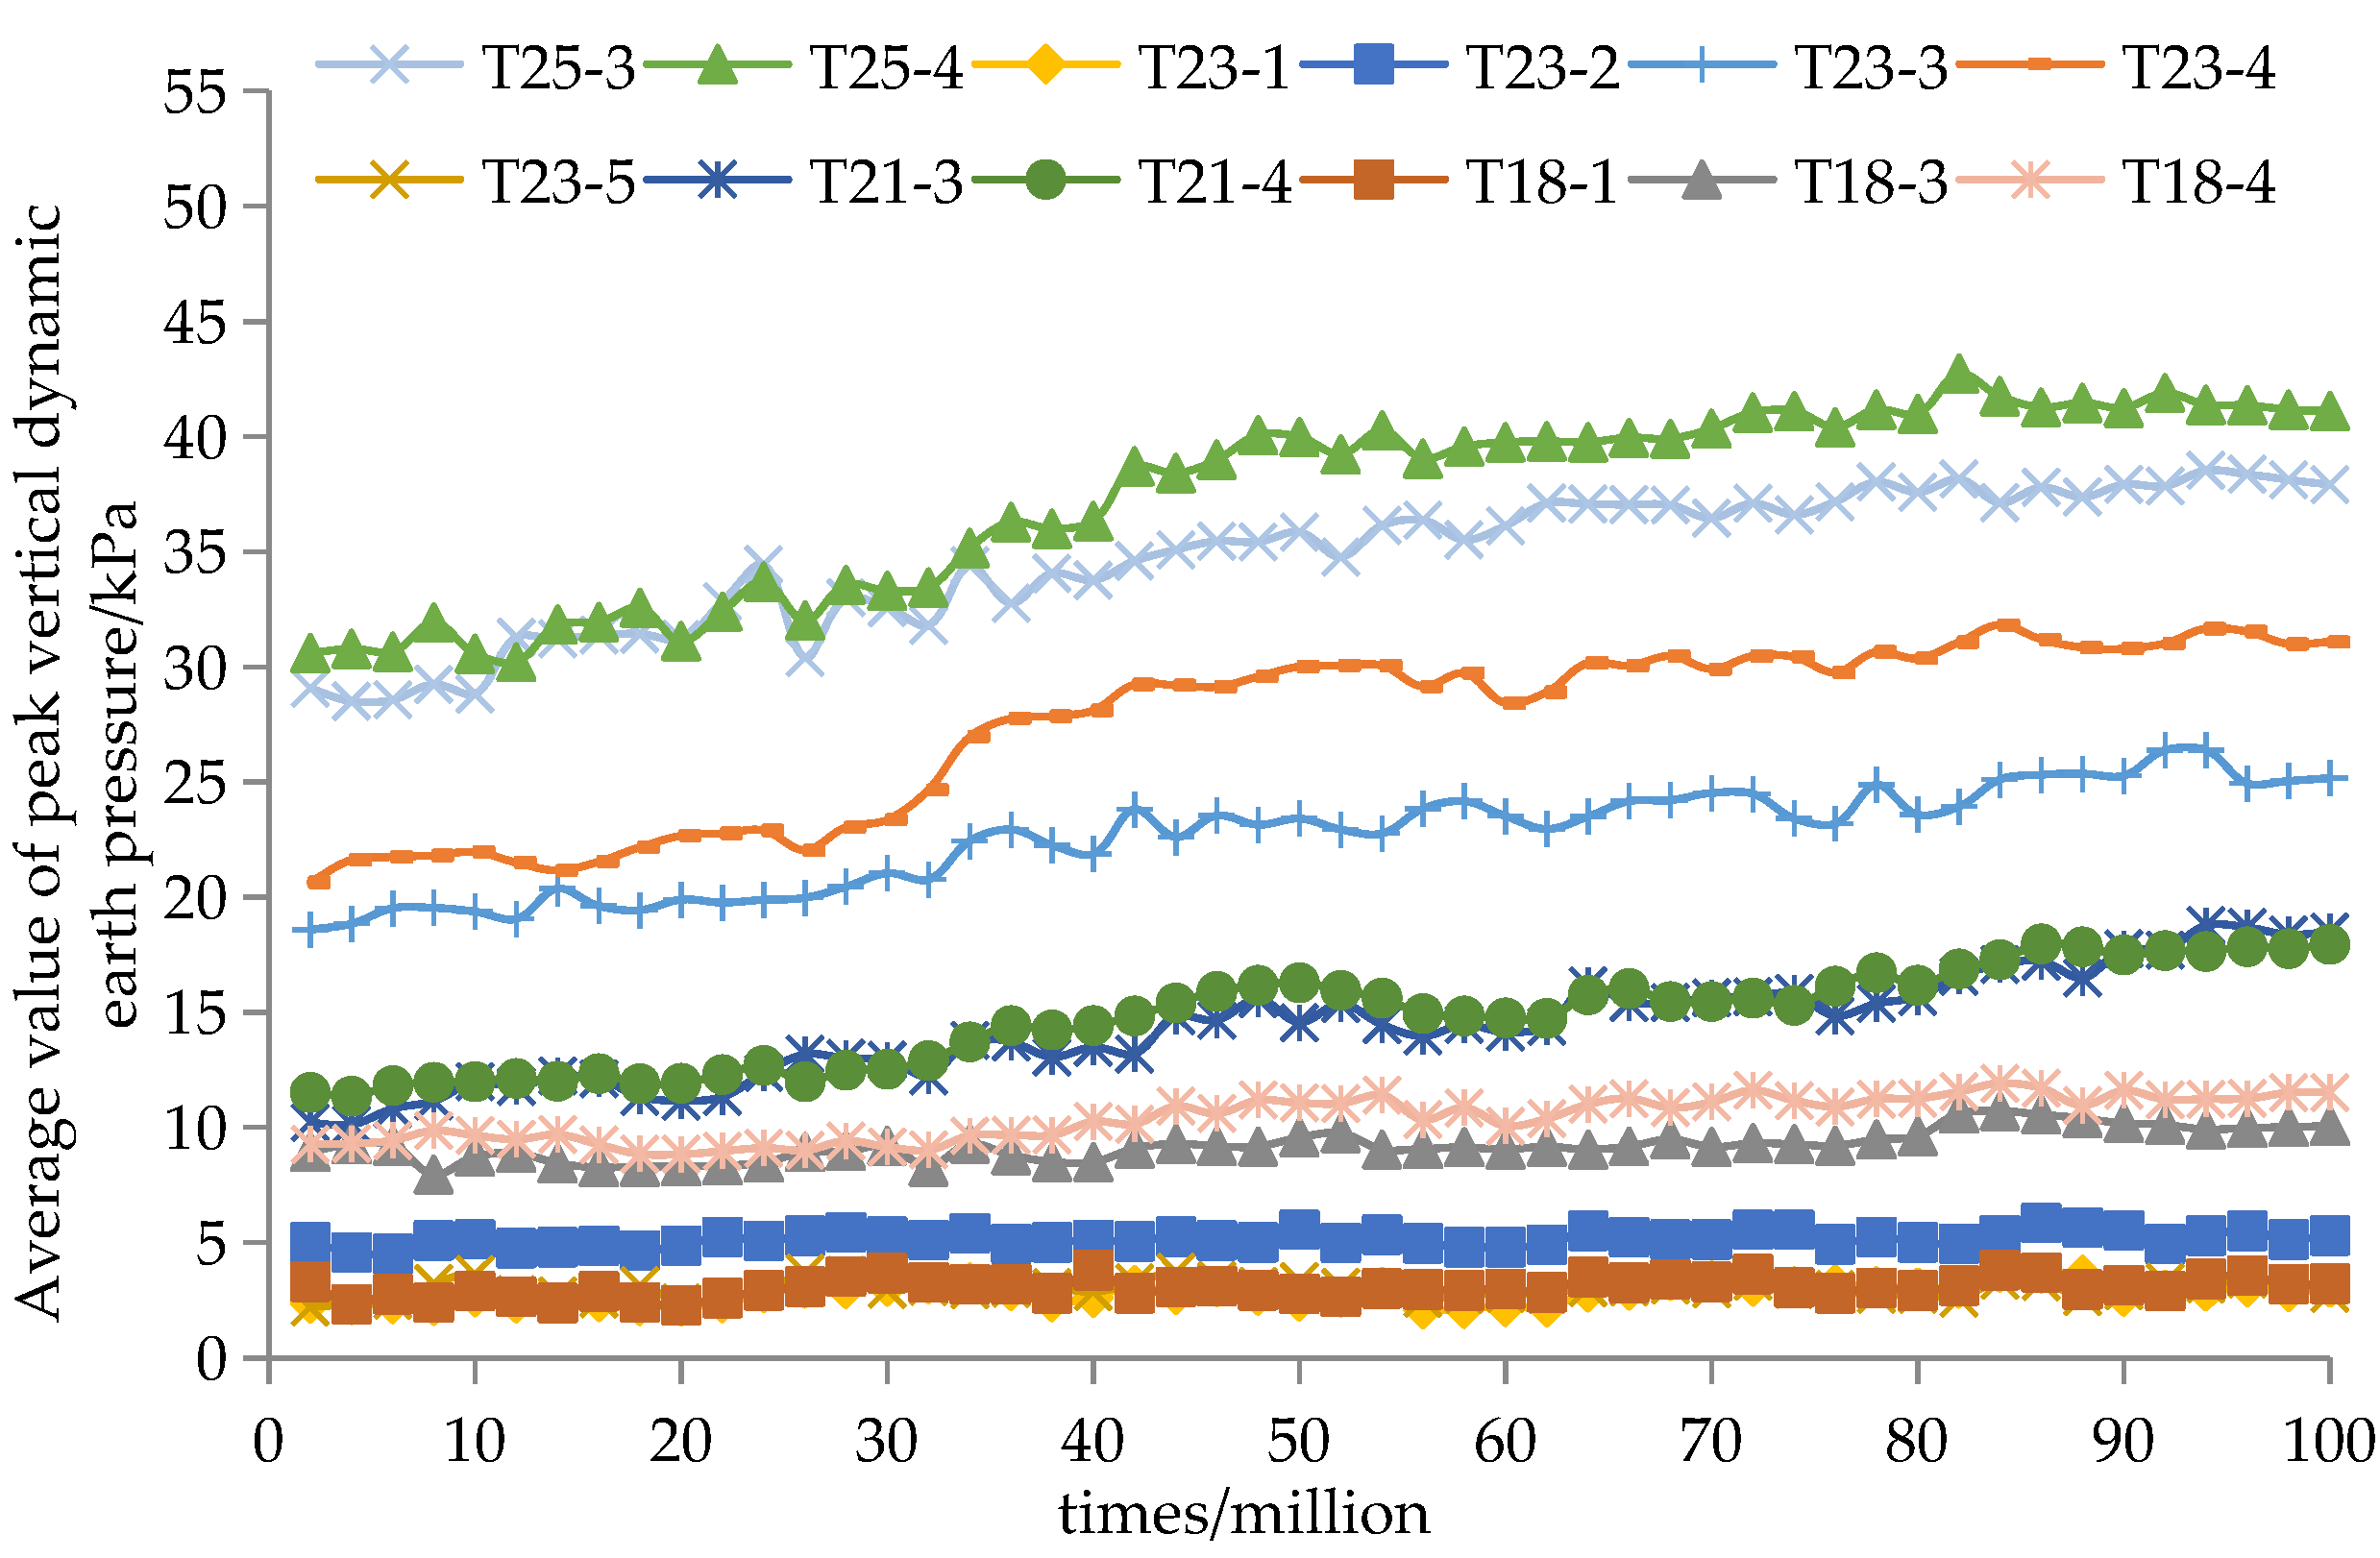
3.1. Distribution of Vertical Earth Pressure
3.2. Stress Distribution Characteristics
4. Numerical Simulation
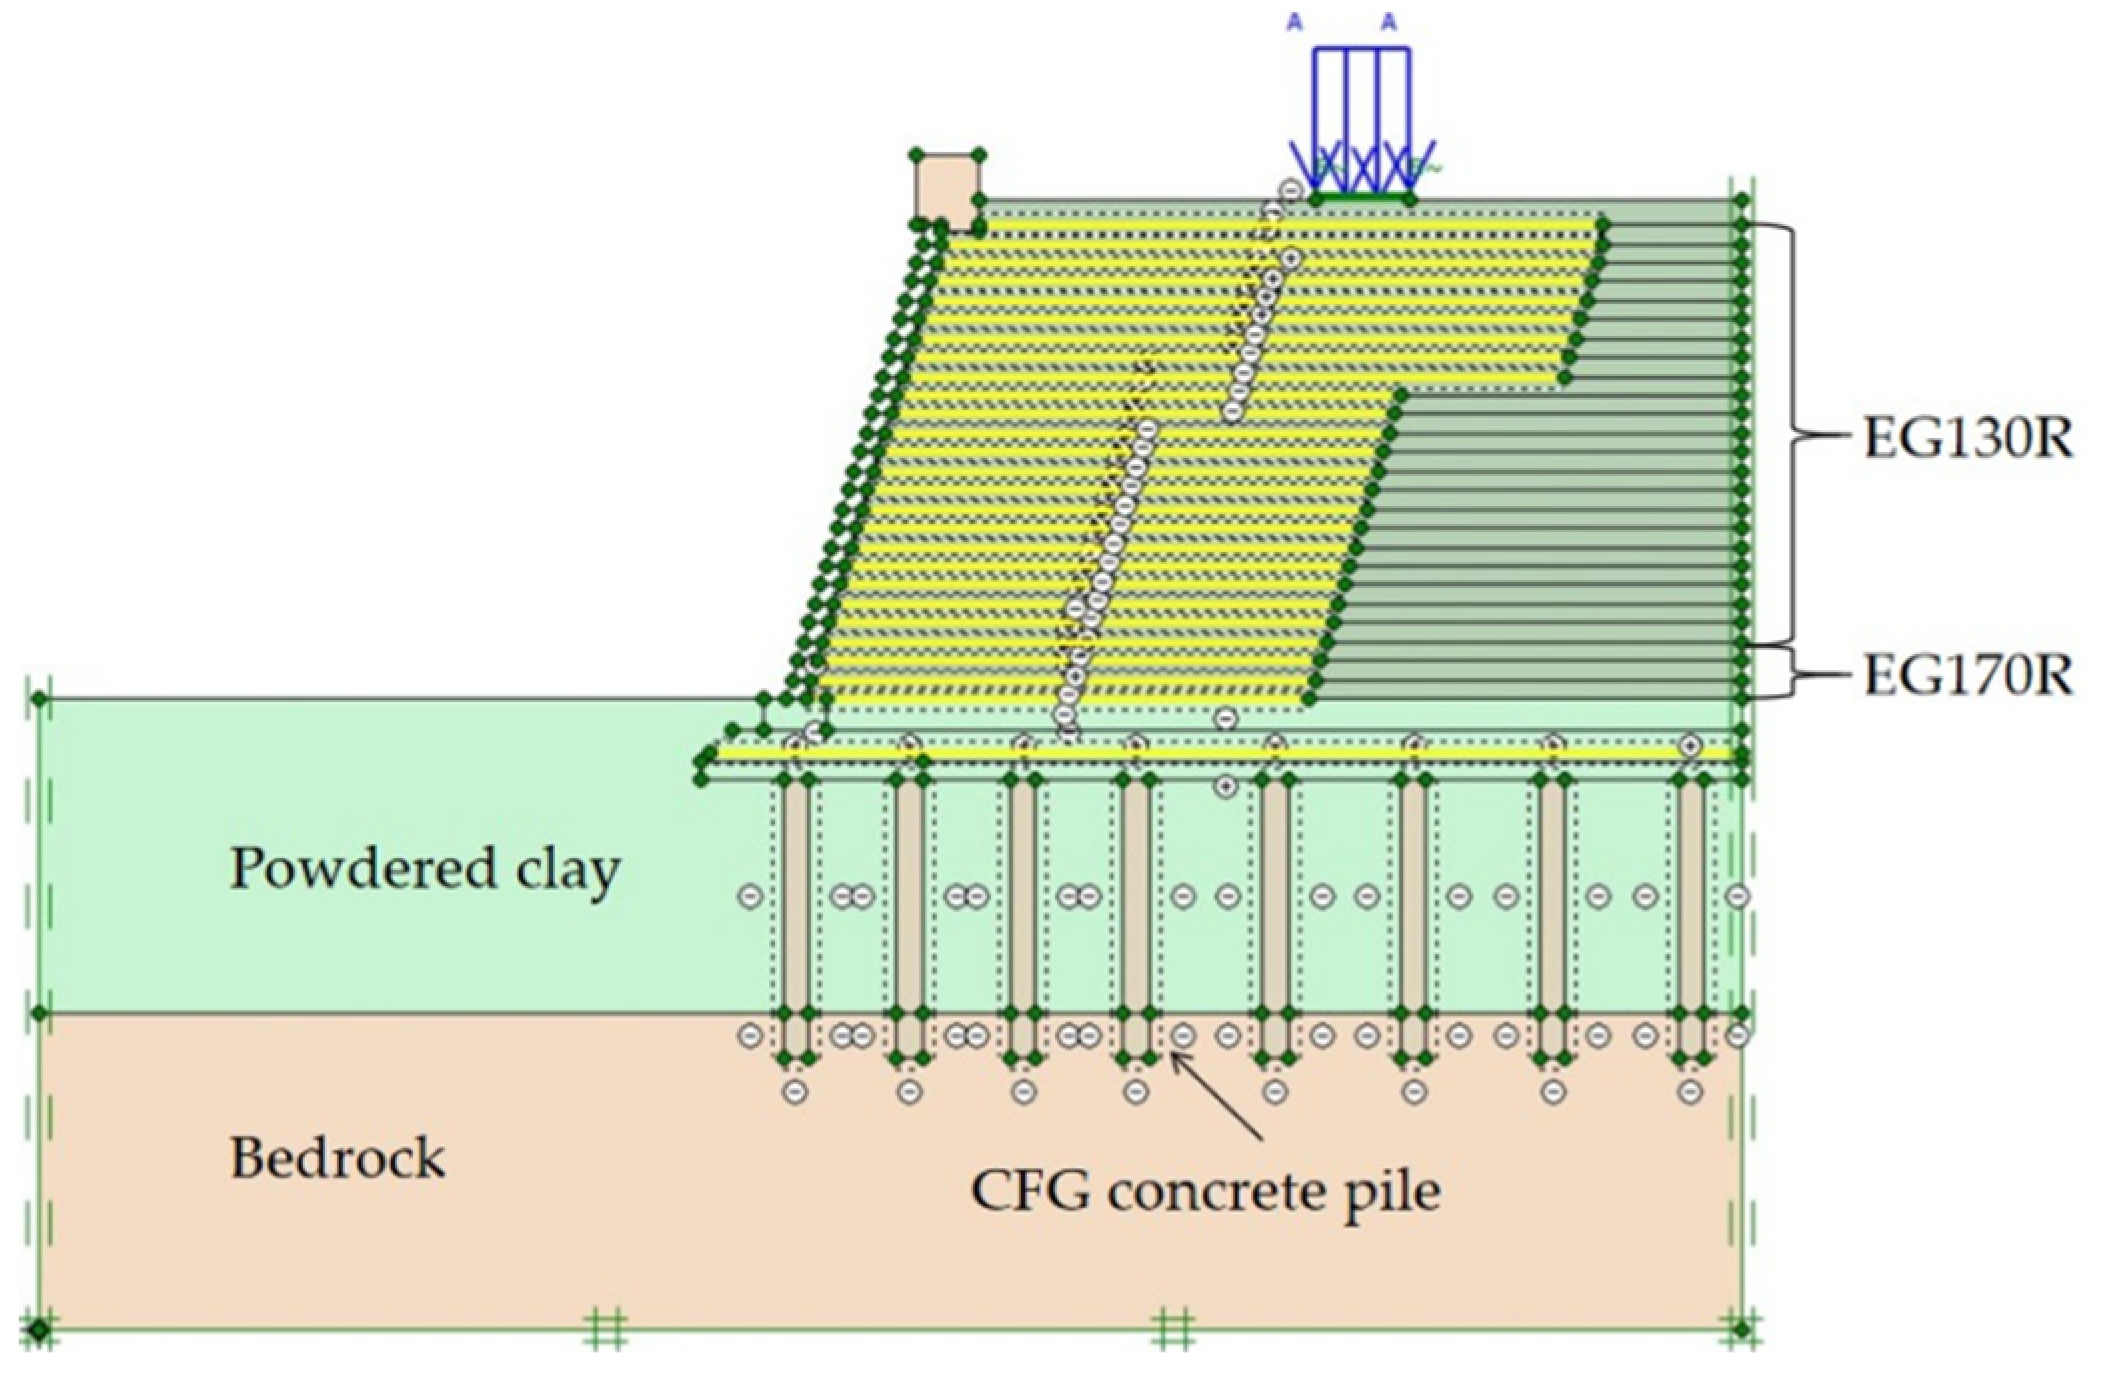
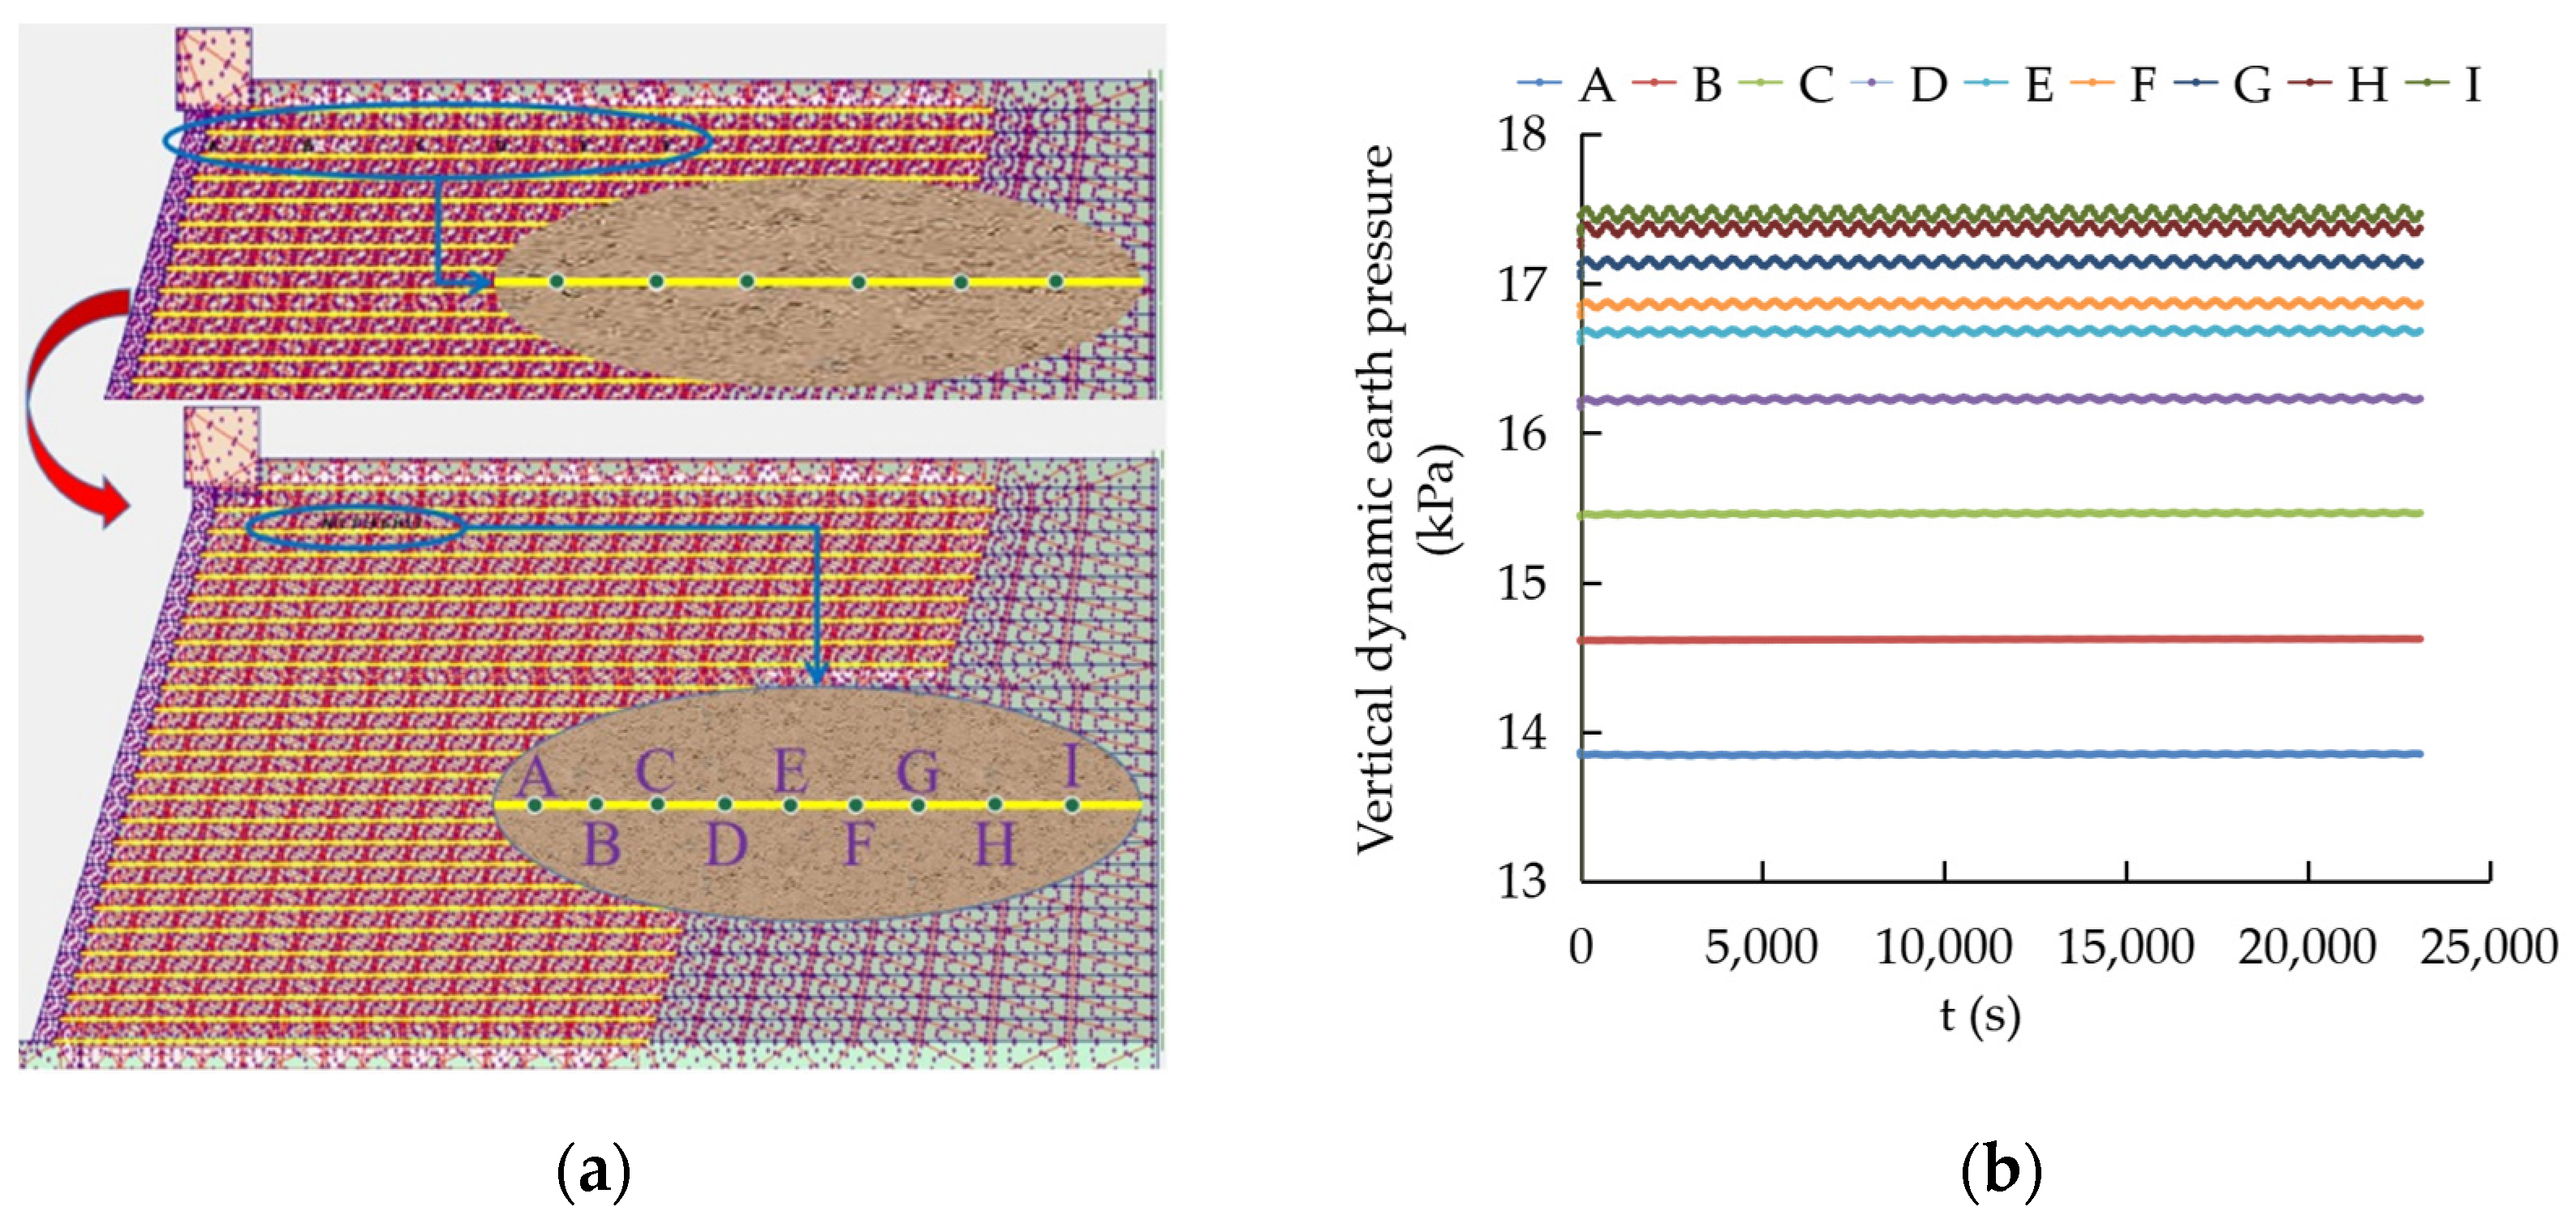
4.1. Finite Element Model
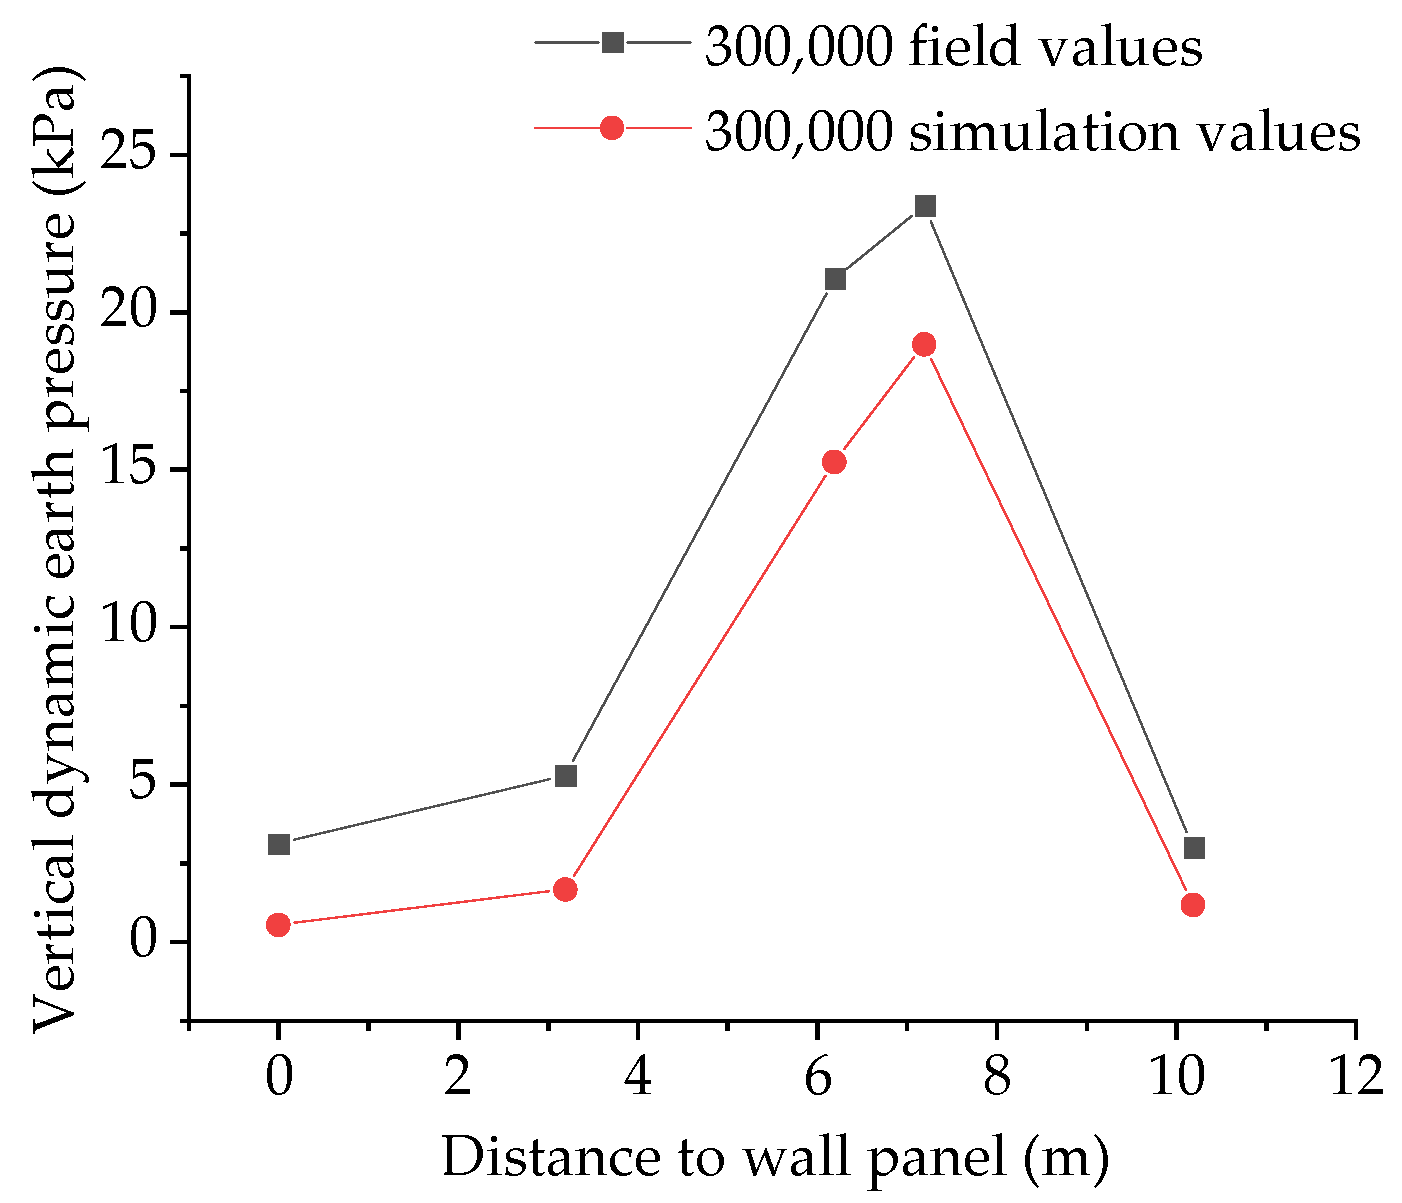
4.2. Numerical Model Validation
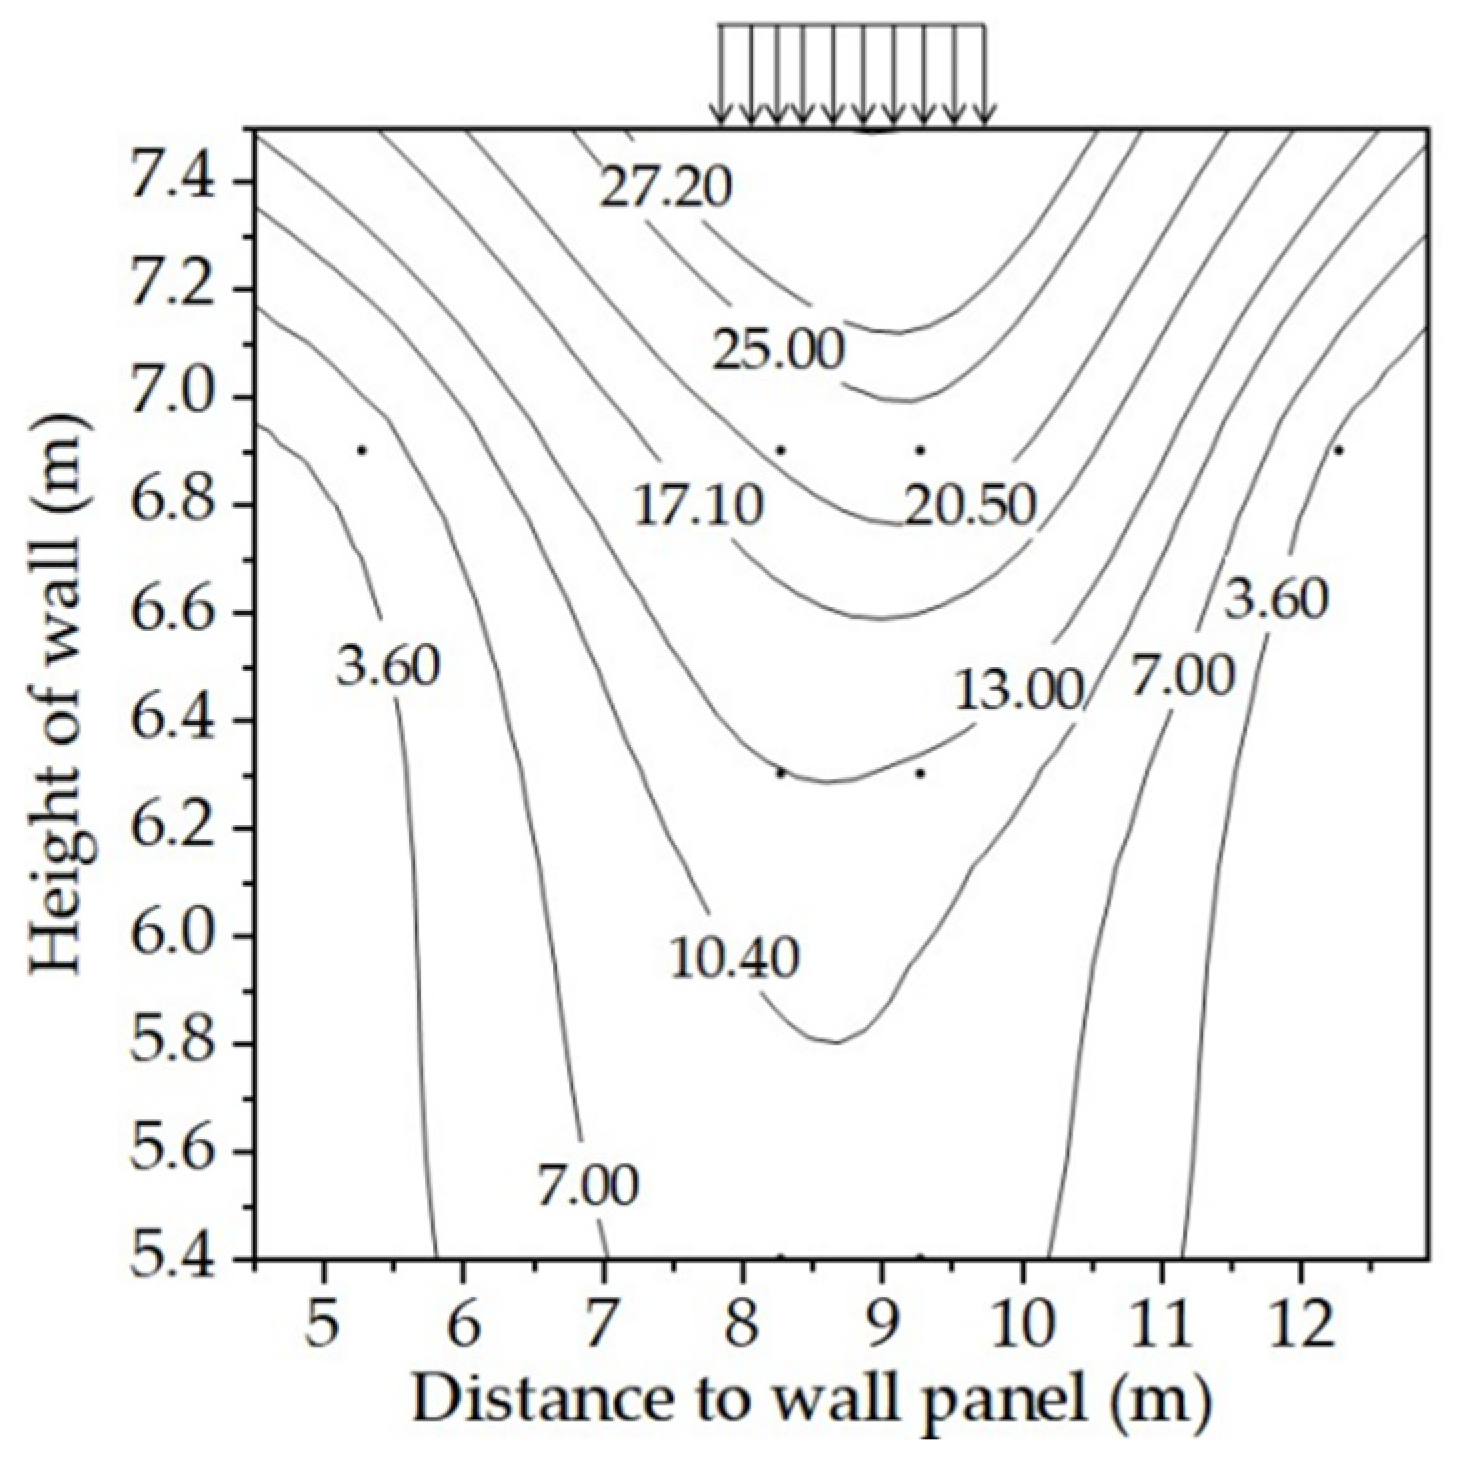
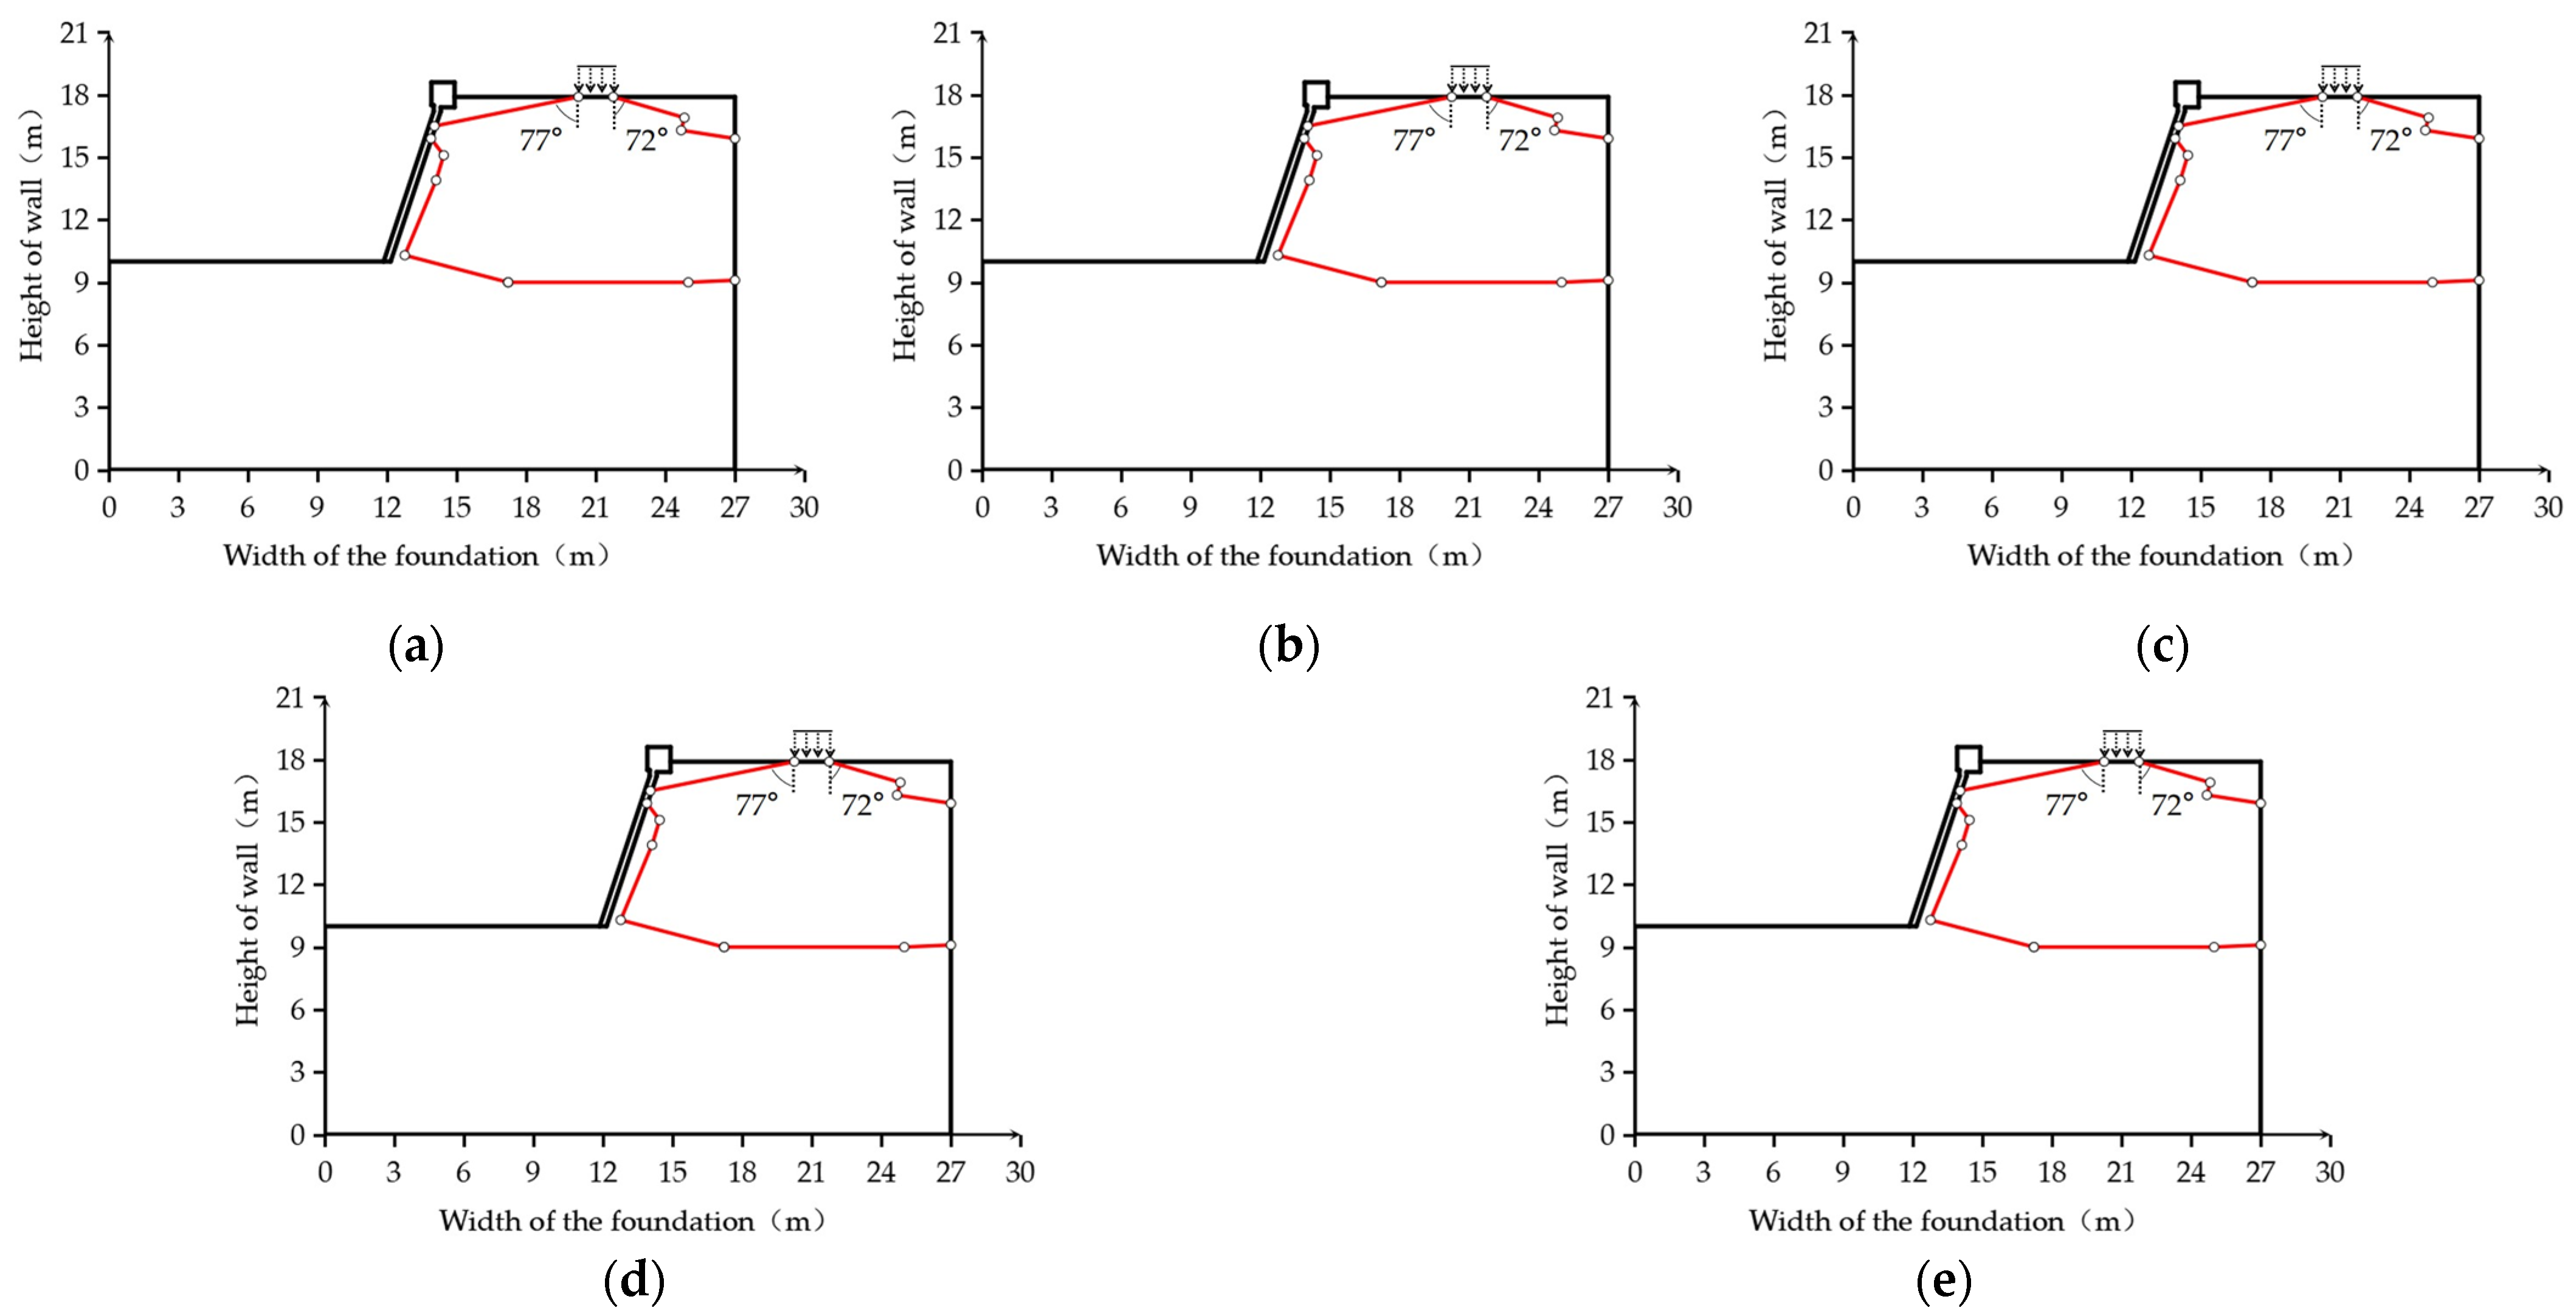
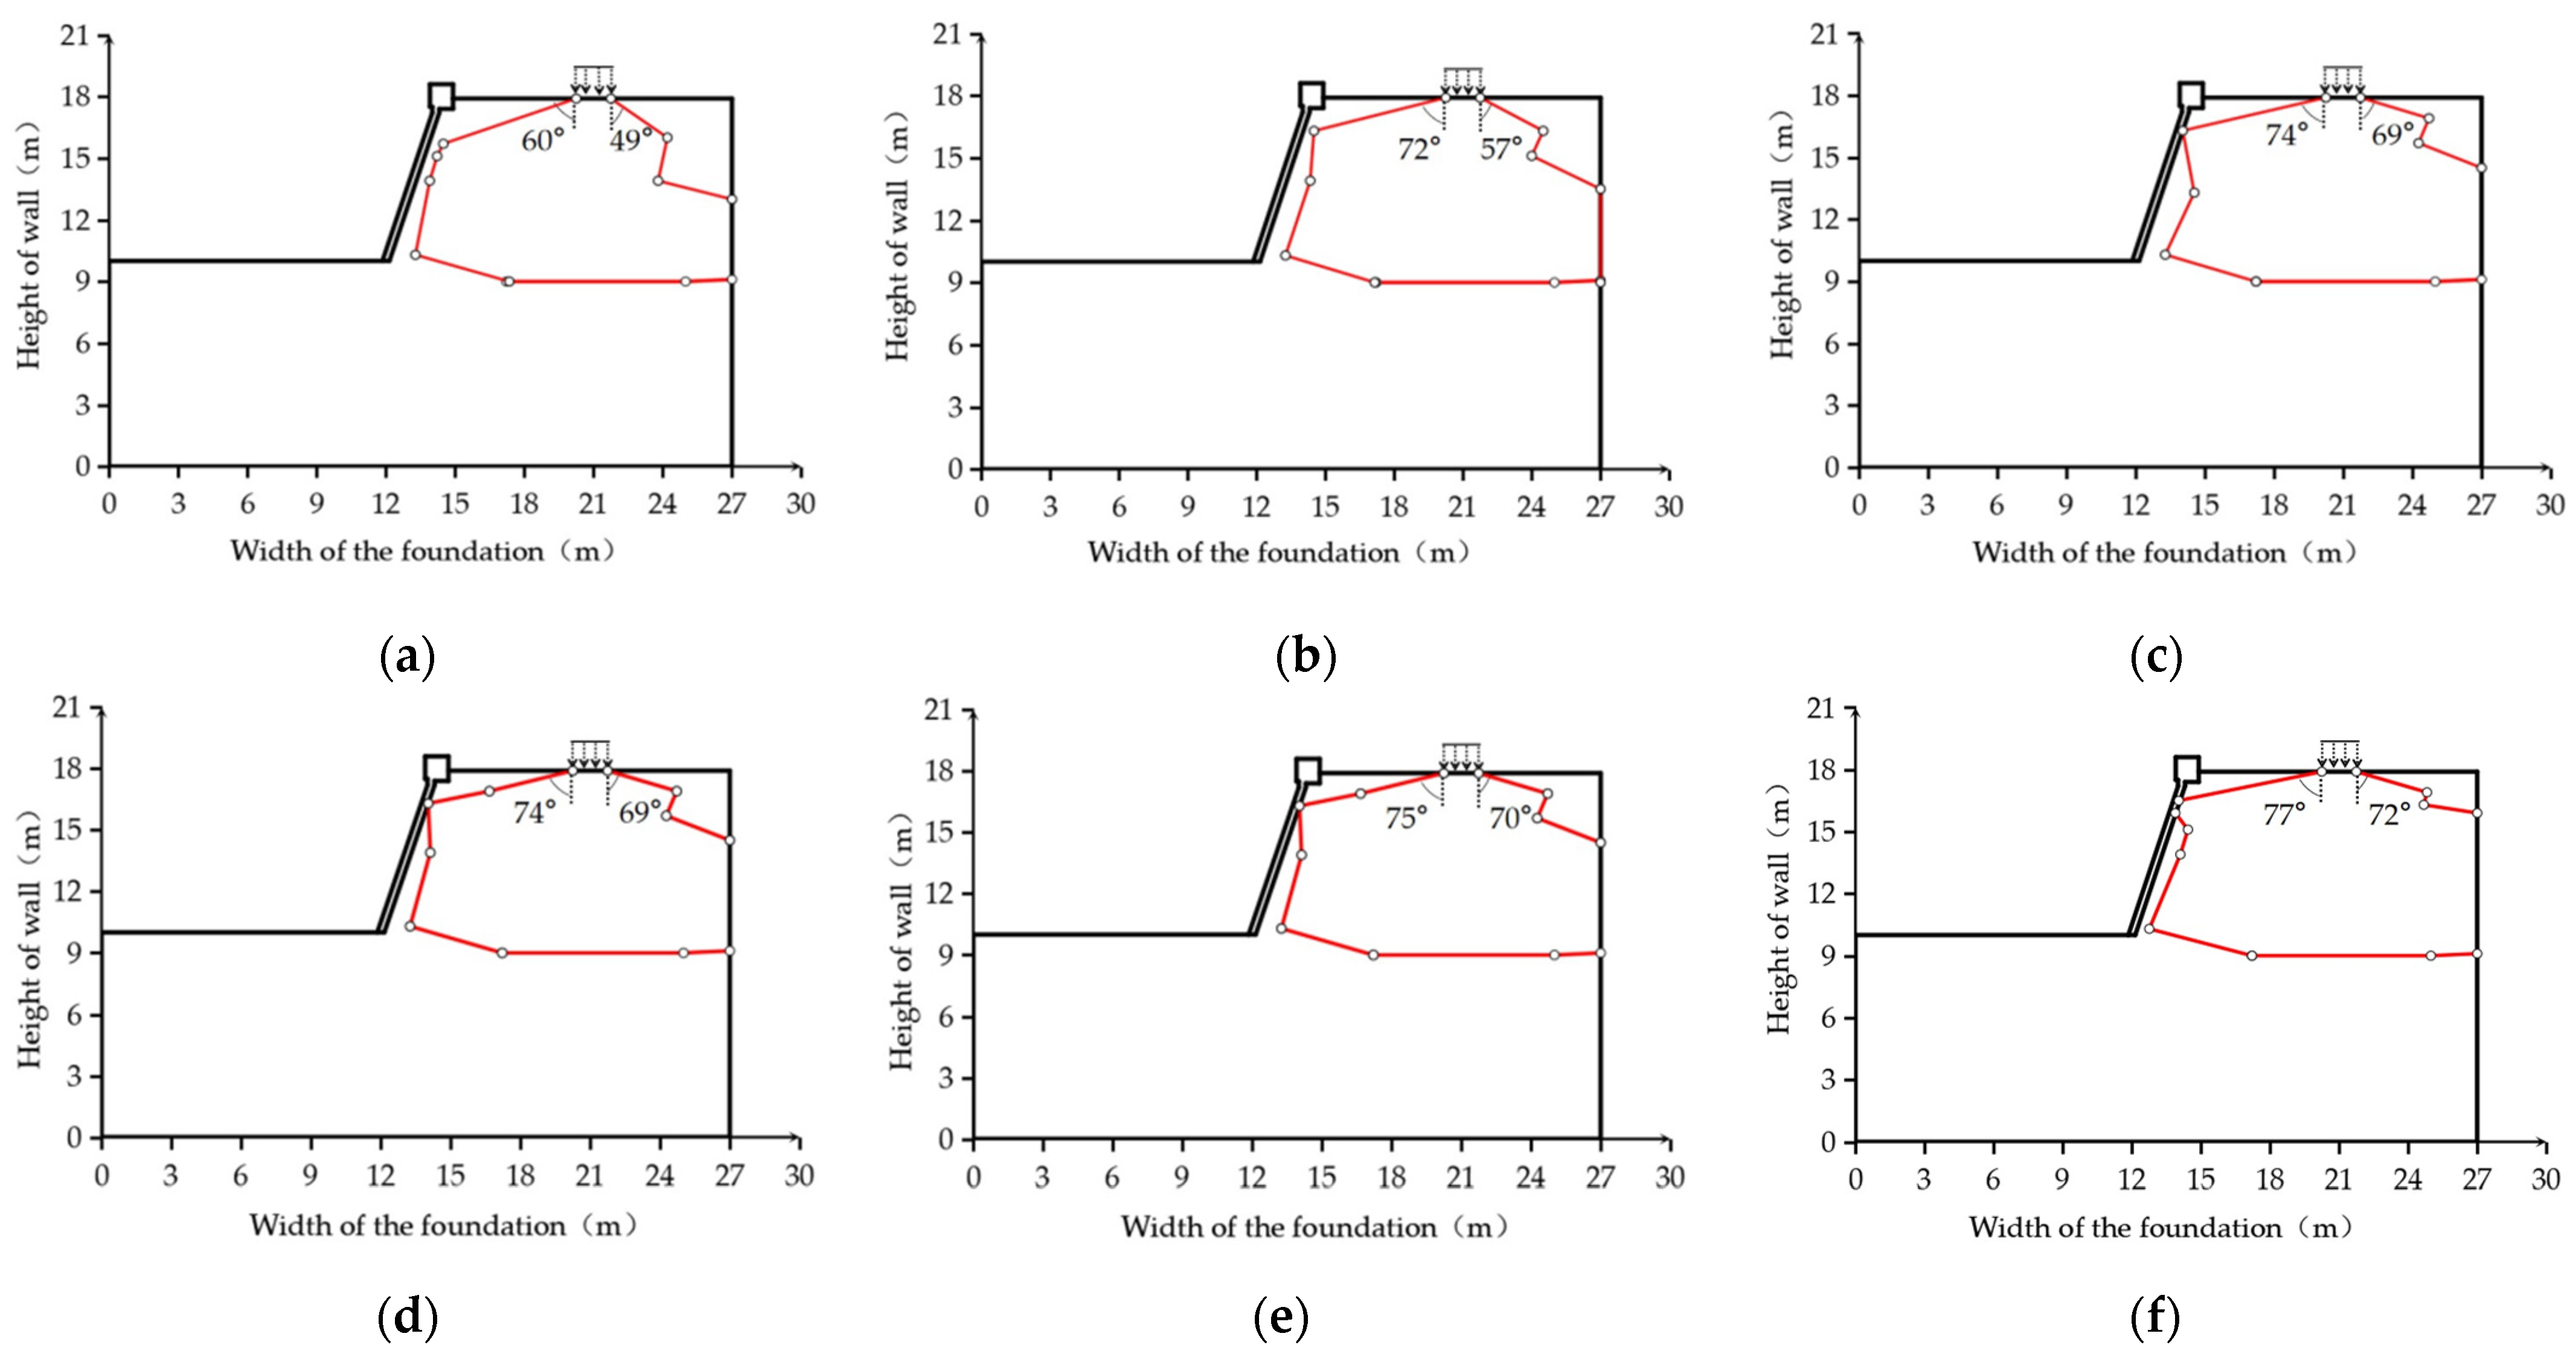
5. Study on Distribution Characteristics of Additional Stress
6. Analysis of Influence Factors on Stress Distribution Characteristics of GRSW under Cyclic Loading
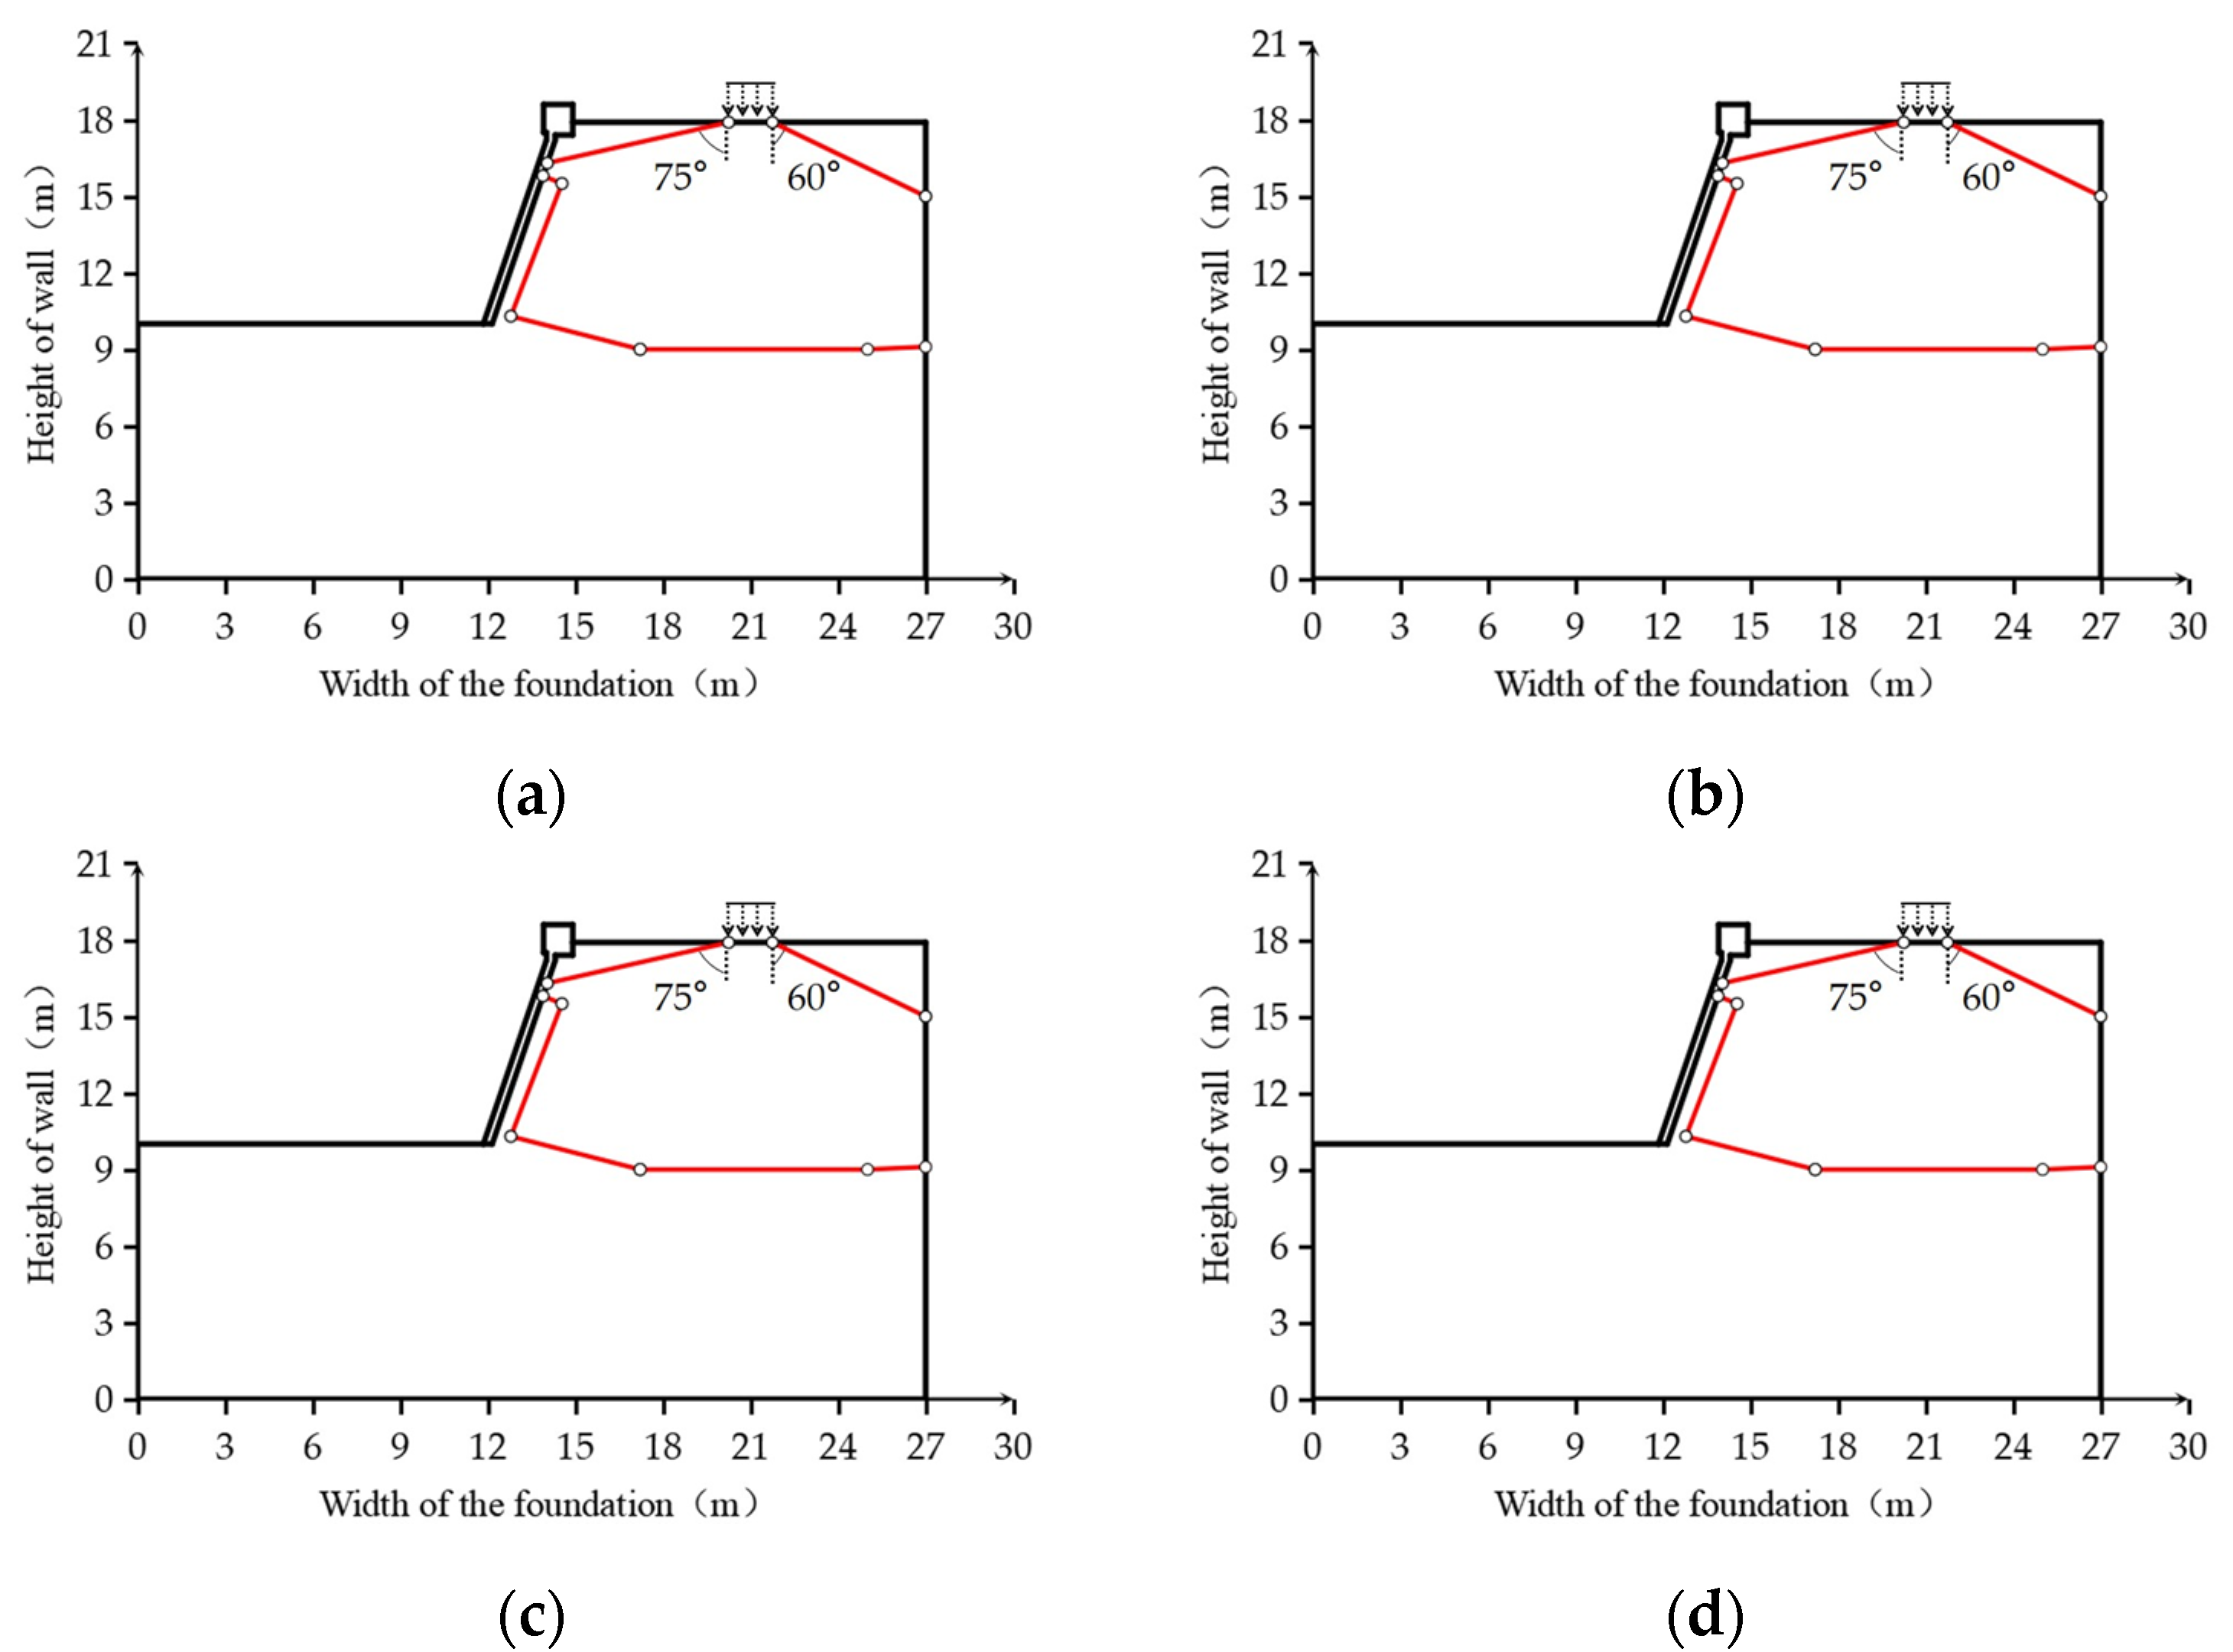
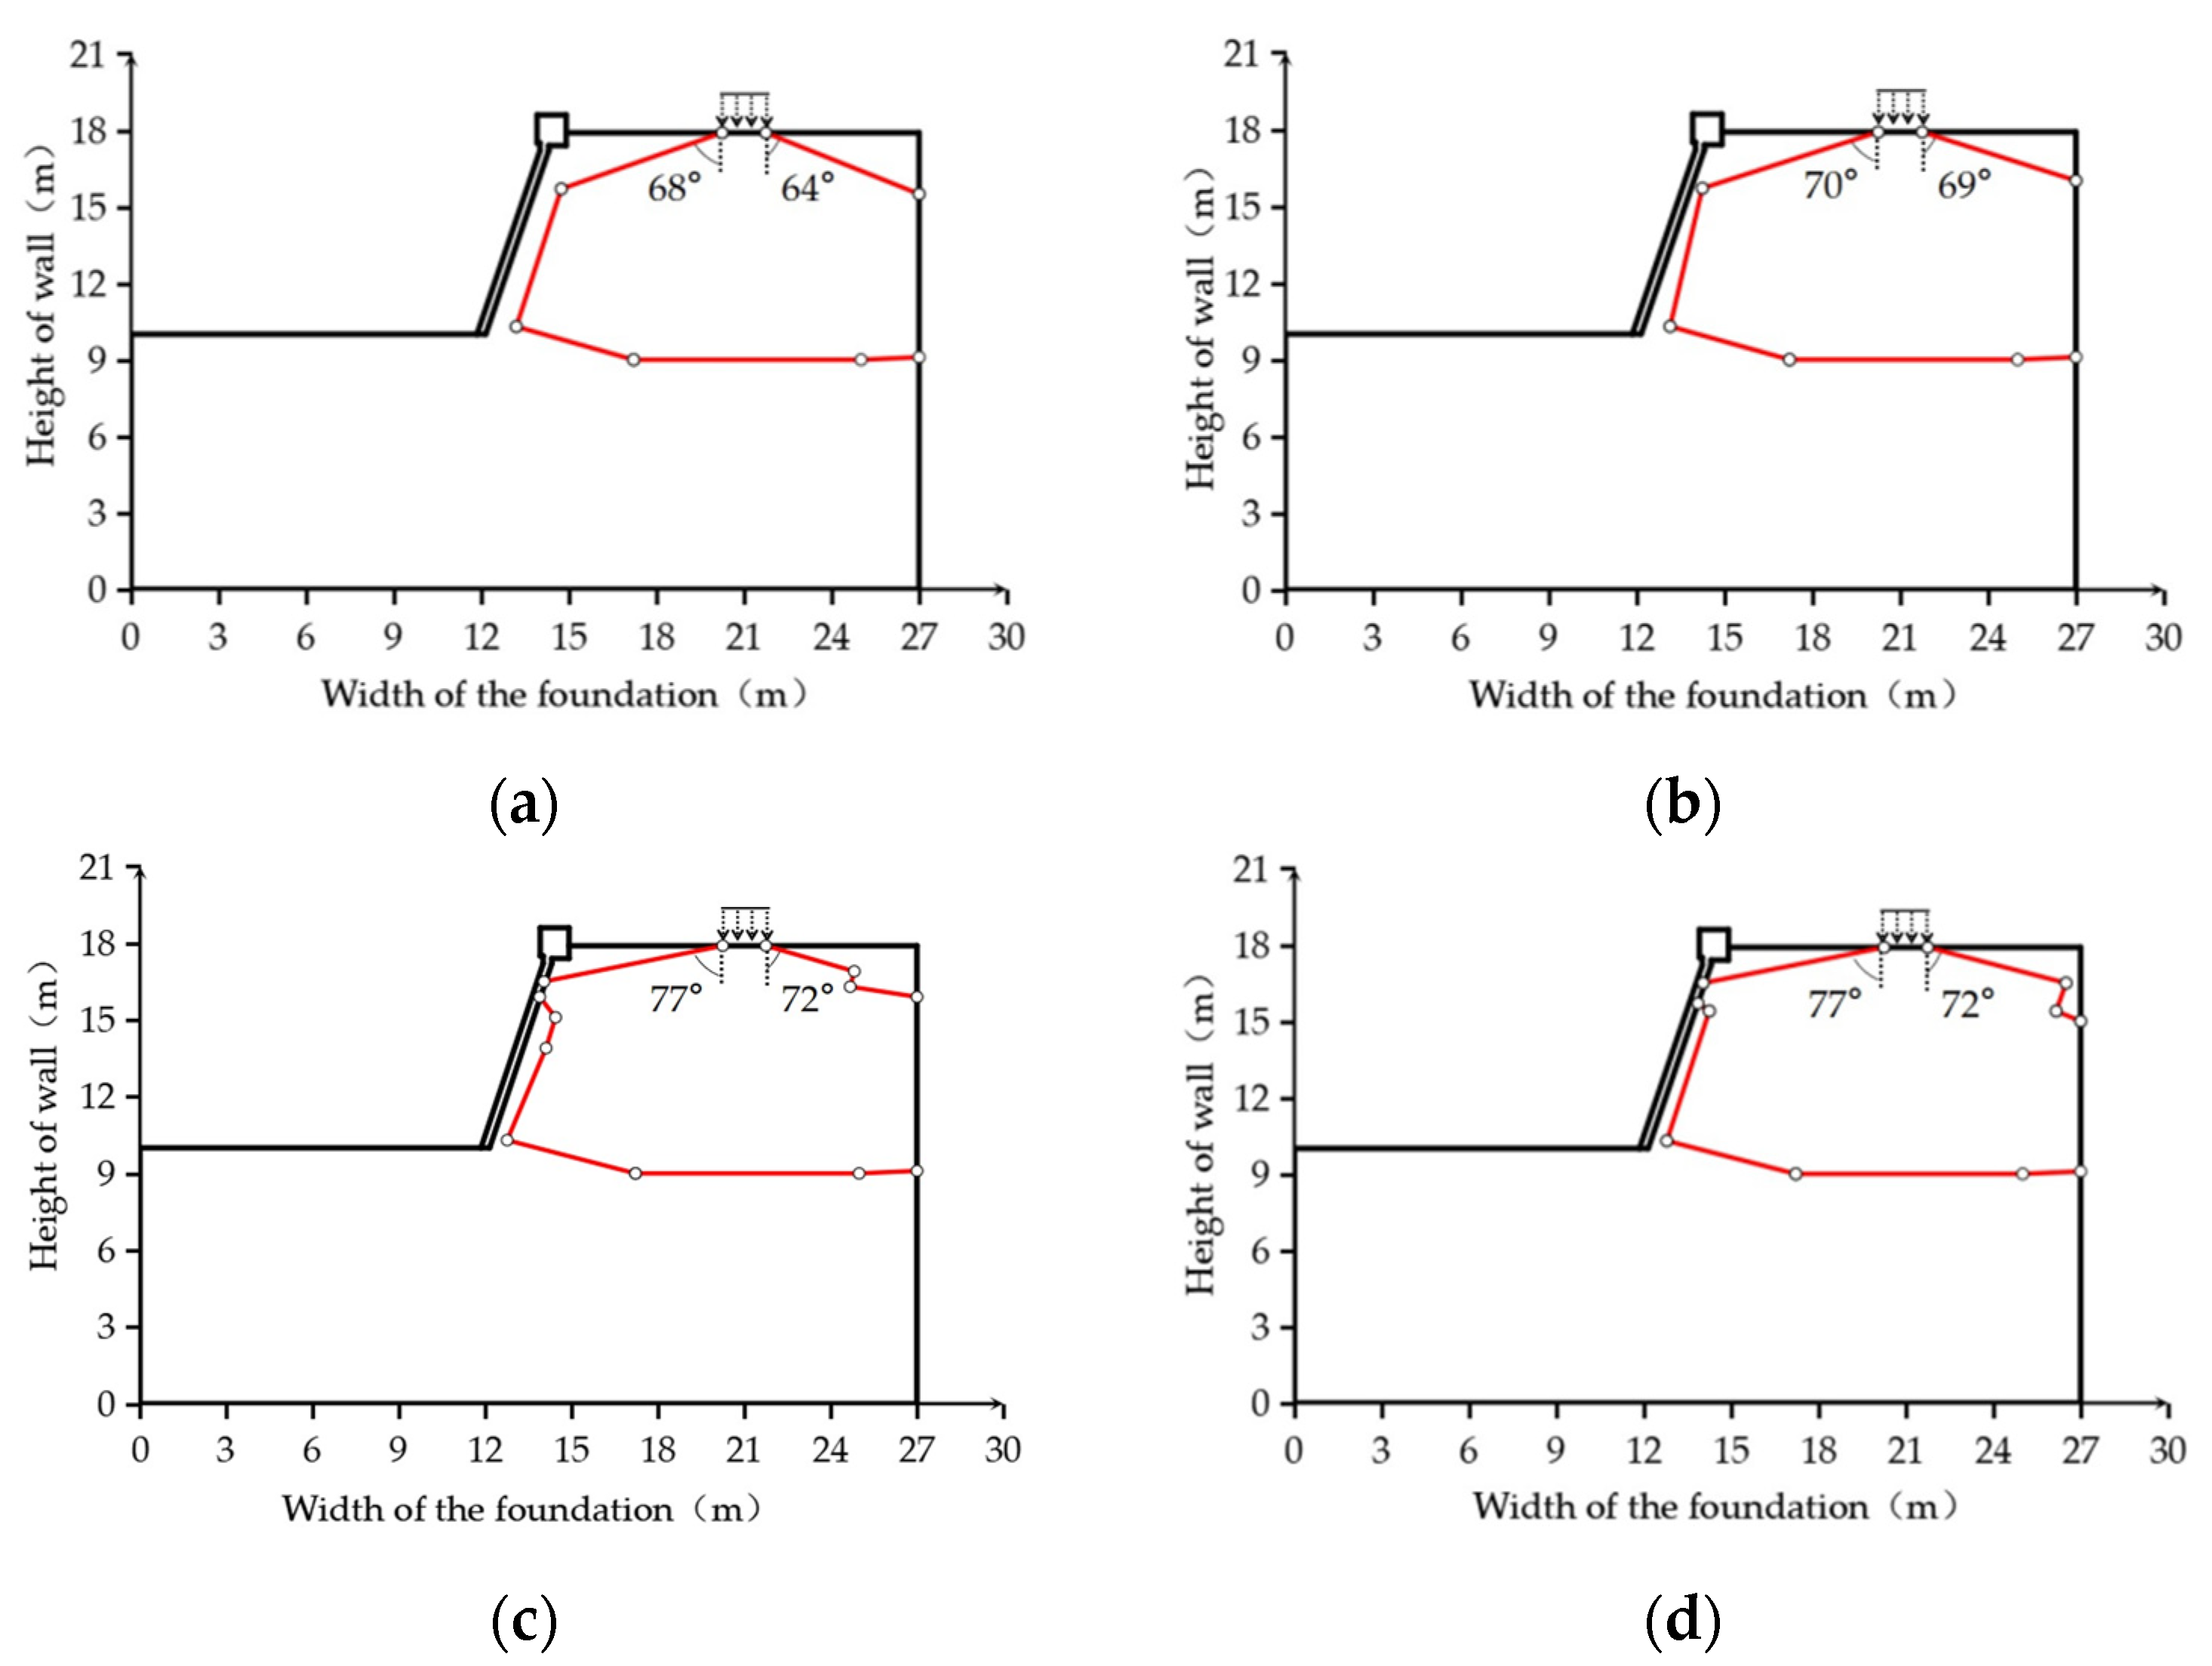
6.1. Influence of Interfacial Friction Coefficient of Reinforced Soil on the Stress Distribution Characteristics of GRSW
6.2. Influence of Reinforcement Modulus on Stress Distribution Characteristics of the Reinforced GRSW
6.3. Effect of Reinforcement Length on the Stress Distribution Characteristics of GRSW
7. Discussion
8. Conclusions
Author Contributions
Funding
Institutional Review Board Statement
Informed Consent Statement
Data Availability Statement
Conflicts of Interest
References
- Wang, J.Q.; Liu, Z.C.; Huang, S.B.; Zhou, Y.W. Experimental study of reinforced retaining wall with variation of grating length and longitudinal and transverse ribs under bar base. J. Guangxi Univ. 2018, 43, 1490–1498. [Google Scholar]
- Zhou, F.; Qiu, Y.W.; Du, Y.X. Experimental study on the performance of prestressed reinforced earth retaining wall under top load. J. Railw. Sci. Eng. 2020, 17, 3063–3071. [Google Scholar]
- Fattah, M.Y.; Salim, N.M.; Ismaiel, M.S. Influence of Geogrid Reinforcement of Sand in Transfer of Dynamic Loading to Underground Structure. In IOP Conference Series: Earth and Environmental Science; IOP Publishing: Bristol, UK, 2021; Volume 856, p. 012013. [Google Scholar]
- Liao, Z.Y.; Bai, H.; Yang, Z.X.; Liang, D.; Shao, G.X. In-situ load test research on deformation and force characteristics of reinforced earth retaining walls. Roadbed Eng. 2016, 67–70. [Google Scholar]
- Wang, H.; Yang, G.Q.; Wu, L.H.; Liu, H.B.; Xiong, B.L. Experimental study on the effect of wall top loading on the working characteristics of reinforced earth retaining walls. J. Rock Mech. Eng. 2014, 33, 2573–2581. [Google Scholar]
- Wang, H.; Yang, G.Q.; Wang, Z.J.; Liu, W.C. Static structural behavior of geogrid reinforced soil retaining walls with a deformation buffer zone. Geotext. Geomembr. 2019, 48, 374–379. [Google Scholar] [CrossRef]
- Demir, A.; Laman, M.; Yildiz, A.; Orneket, M. Large scale field tests on geogrid-reinforced granular fill underlain by clay soil. Geotext. Geomembr. 2013, 38, 1–15. [Google Scholar] [CrossRef]
- Rajesh, S.; Viswanadham, B.V.S. Numerical Simulation of Geogrid-Reinforced Soil Barriers Subjected to Differential Settlements. Int. J. Geomech. 2014, 62, 1–15. [Google Scholar] [CrossRef]
- Wang, J.Q.; Zhong, W.T.; Lin, Z.N.; Tang, Y. Dynamic Response and Geogrid Strain Analysis of GRS Retaining Wall. Appl. Sci. 2022, 12, 9930. [Google Scholar] [CrossRef]
- Lu, Y.G. Research on Stress Diffusion and Deformation Characteristics of Geogrid Reinforced Earth Retaining Wall for High-Speed Railroad; Beijing Jiaotong University: Beijing, China, 2017. [Google Scholar]
- Zhou, H.W.; Qin, L.Y.; Ye, S.J.; Lin, S.S. Calculation of stress diffusion under strip loading of reinforced foundations in lower volcanic soil caverns. J. Fujian Eng. Coll. 2019, 17, 524–531. [Google Scholar]
- Shin, E.C.; Kim, D.; Das, B.M. Stress distribution in reclaimed land under a geogrid-reinforced granular pad. In Proceedings of the XI International Conference of Offshore and Polar Engineering, Stavanger, Norway, 17–22 June 2008; pp. 675–680. [Google Scholar]
- Krystyna, K.F. Influence of geosynthetic reinforcement on the load-settlement characteristics of two-layer subgrade. Geotext. Geomembr. 2007, 25, 366–376. [Google Scholar]
- Knappett, J.A.; Mohammadi, S.; Griffin, C. Lateral Spreading Forces on Bridge Piers and Pile Caps in Laterally Spreading Soil: Effect of Angle of Incidence. J. Geotech. Geoenviron. Eng. 2010, 136, 1589–1599. [Google Scholar] [CrossRef]
- Wang, H. Research on Structural Behaviour of Geogrid Reinforced Soil Retaining Wall under Static or Dynamic Loads. Doctoral Dissertation, Beijing Jiaotong University, Beijing, China, 2016. [Google Scholar]


| Material Type | ||||
|---|---|---|---|---|
| EG130R | 1825 | 36.5 | 72 | 130.6 |
| EG170R | 2625 | 52.5 | 103 | 197.4 |
| Material | Modulus of Elasticity (kN/m²) | Cohesion (kN/m²) | Natural Unit Weight kN/m³ | Internal Friction Angle (°) |
|---|---|---|---|---|
| Filling | 5 × 10⁴ | 30 | 18 | 35 |
| Loading Frequency/Hz | Maximum Dynamic Stress/kPa | Minimum Dynamic Stress/kPa | Dynamic Stress Amplitude/kPa |
|---|---|---|---|
| 13 | 80.62 | 53.50 | 13.56 |
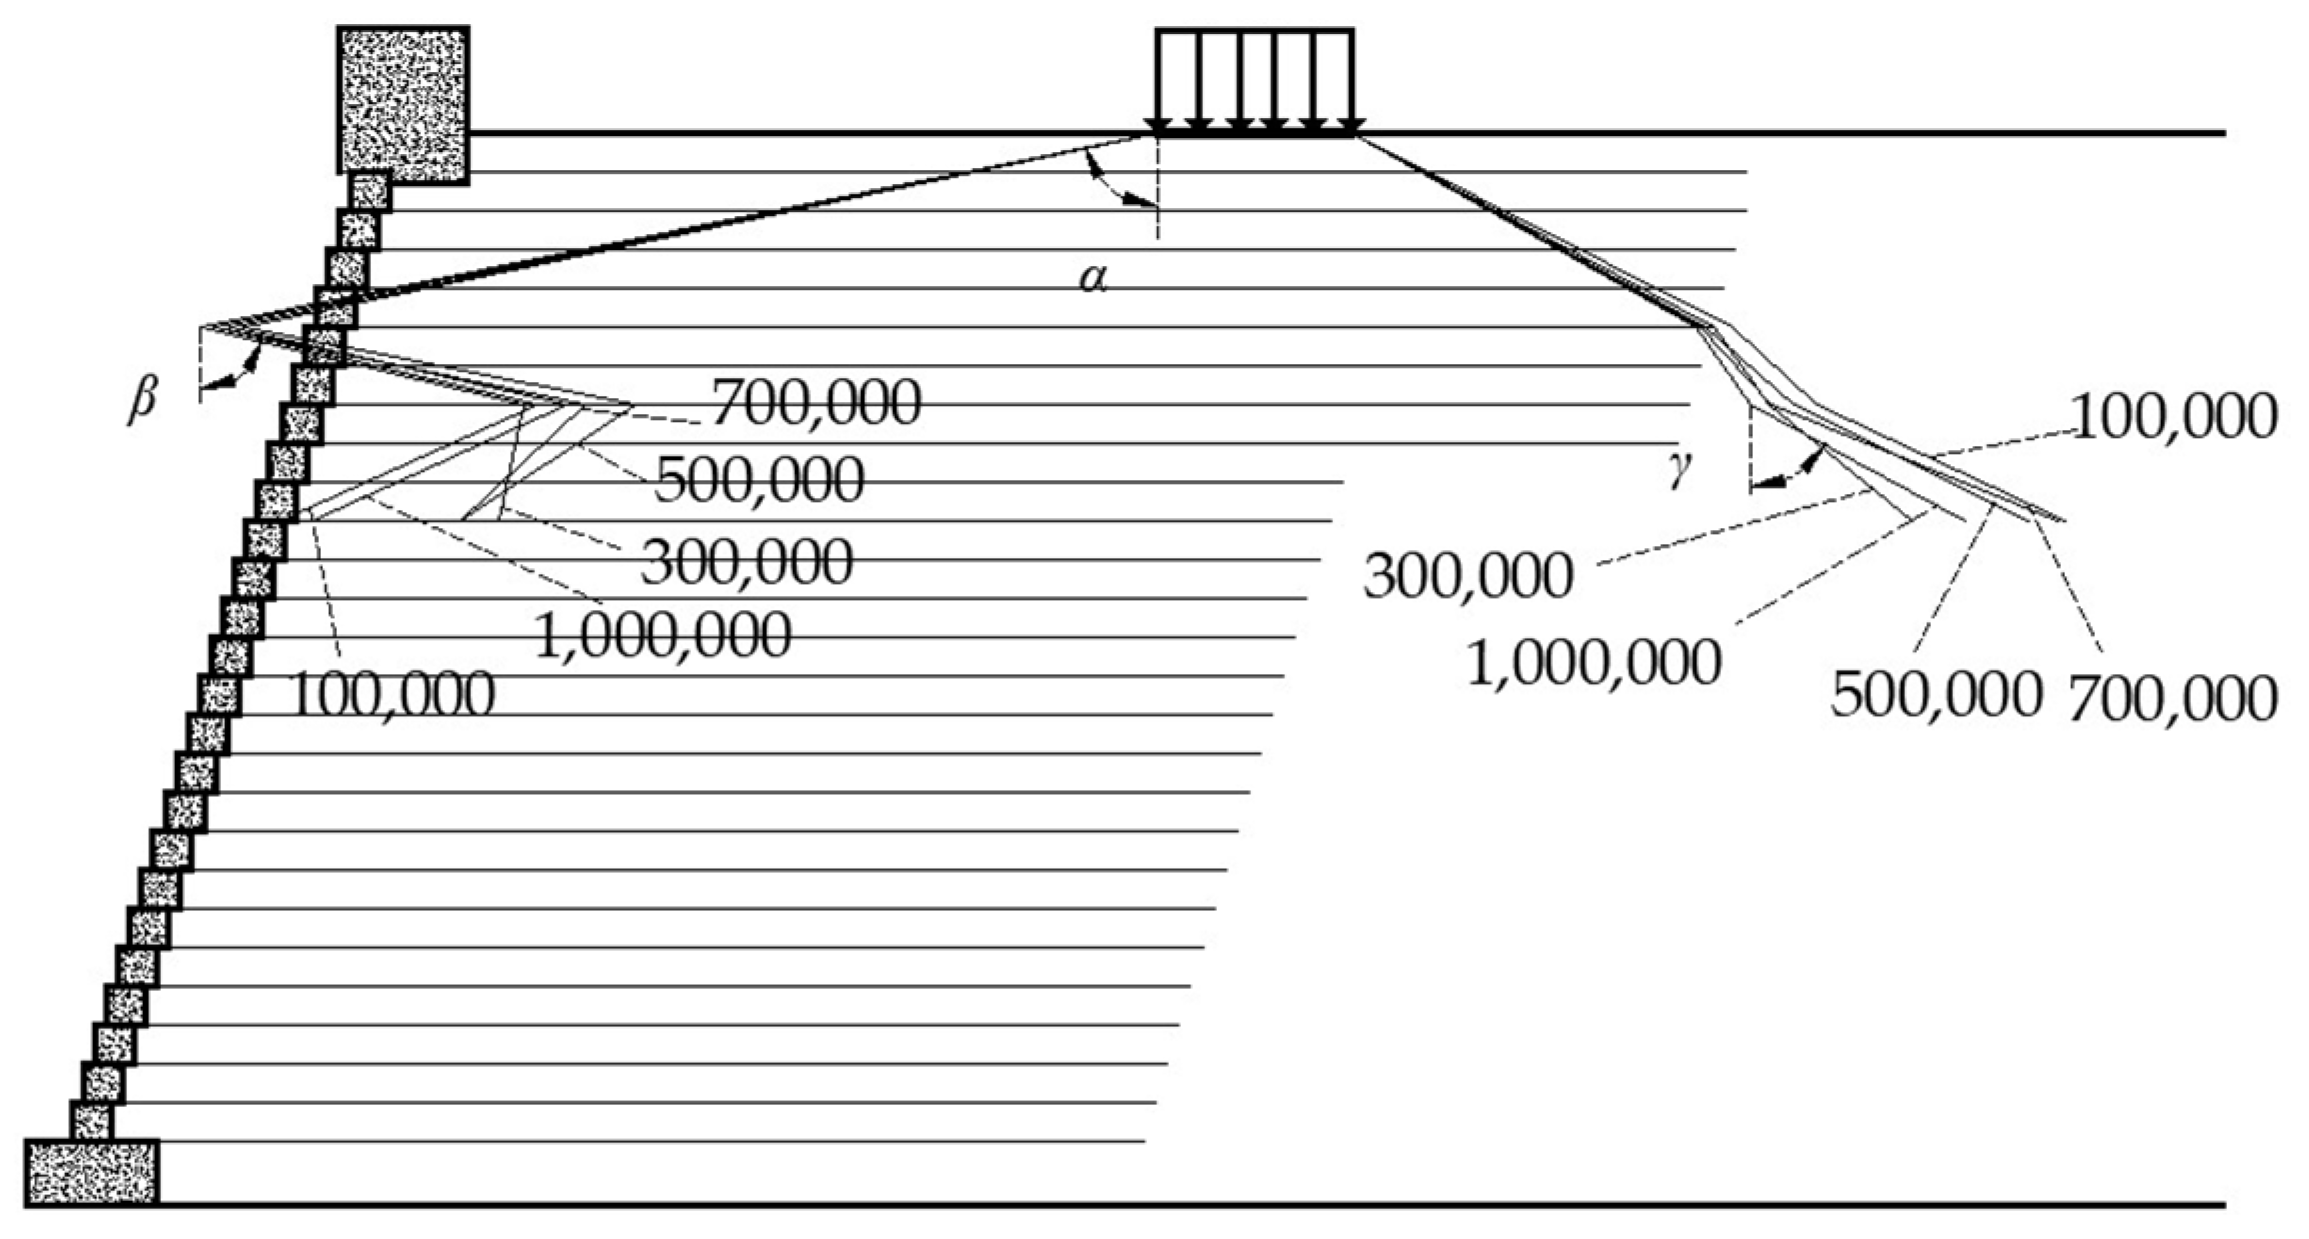
| Location | Number of Loading Cycles | Distribution Angle α (°) | Distribution Angle β (°) | Distribution Angle γ (°) |
|---|---|---|---|---|
| Near wall panel side | 100,000 | 78 | −77 | 66 |
| 300,000 | 78 | −77 | 13 | |
| 500,000 | 78 | −79 | 57 | |
| 700,000 | 78 | −78 | 47 | |
| 1,000,000 | 78 | −77 | 66 | |
| Away from wall panel side | 100,000 | 63 | 47 | 65 |
| 300,000 | 62 | 35 | 51 | |
| 500,000 | 61 | 49 | 64 | |
| 700,000 | 61 | 42 | 68 | |
| 1,000,000 | 61 | 36 | 61 |
| Name | Material MODEL | Modulus of Elasticity (kN/m2) | Cohesion (kN/m2) | Natural Unit Weight kN/m3 | Internal Friction Angle (°) |
|---|---|---|---|---|---|
| Bedrock | Line elasticity | 1.2 × 10⁷ | — | 27 | — |
| Powdered clay | Mohr–Coulomb | 8950 | 15 | 19 | 30 |
| Gravel matting | Mohr–Coulomb | 5 × 10⁵ | 1 | 20 | 40 |
| Pile cap | Line elasticity | 3.5 × 10⁷ | — | 25 | — |
| Bold stone and foundation | Line elasticity | 3 × 10⁷ | — | 24 | — |
| Filling | Mohr–Coulomb | 5 × 10⁴ | 30 | 18 | 35 |
| CFG pile | Line elasticity | 3 × 10⁷ | — | 25 | — |
| Panel | Line elasticity | 1.2 × 10⁷ | — | 24 | — |
Publisher’s Note: MDPI stays neutral with regard to jurisdictional claims in published maps and institutional affiliations. |
© 2022 by the authors. Licensee MDPI, Basel, Switzerland. This article is an open access article distributed under the terms and conditions of the Creative Commons Attribution (CC BY) license (https://creativecommons.org/licenses/by/4.0/).
Share and Cite
Wang, H.; Ma, J.; Yang, G.; Wang, N. Study of Stress Distribution Characteristics of Reinforced Earth Retaining Walls under Cyclic Loading. Appl. Sci. 2022, 12, 10237. https://doi.org/10.3390/app122010237
Wang H, Ma J, Yang G, Wang N. Study of Stress Distribution Characteristics of Reinforced Earth Retaining Walls under Cyclic Loading. Applied Sciences. 2022; 12(20):10237. https://doi.org/10.3390/app122010237
Chicago/Turabian StyleWang, He, Jian Ma, Guangqing Yang, and Nan Wang. 2022. "Study of Stress Distribution Characteristics of Reinforced Earth Retaining Walls under Cyclic Loading" Applied Sciences 12, no. 20: 10237. https://doi.org/10.3390/app122010237
APA StyleWang, H., Ma, J., Yang, G., & Wang, N. (2022). Study of Stress Distribution Characteristics of Reinforced Earth Retaining Walls under Cyclic Loading. Applied Sciences, 12(20), 10237. https://doi.org/10.3390/app122010237