
Effect of Zeolite Content on Permeability of Stone Chip-Bentonite-Zeolite Mixture Using a Single Solution


Abstract
1. Introduction
2. Materials and Methods
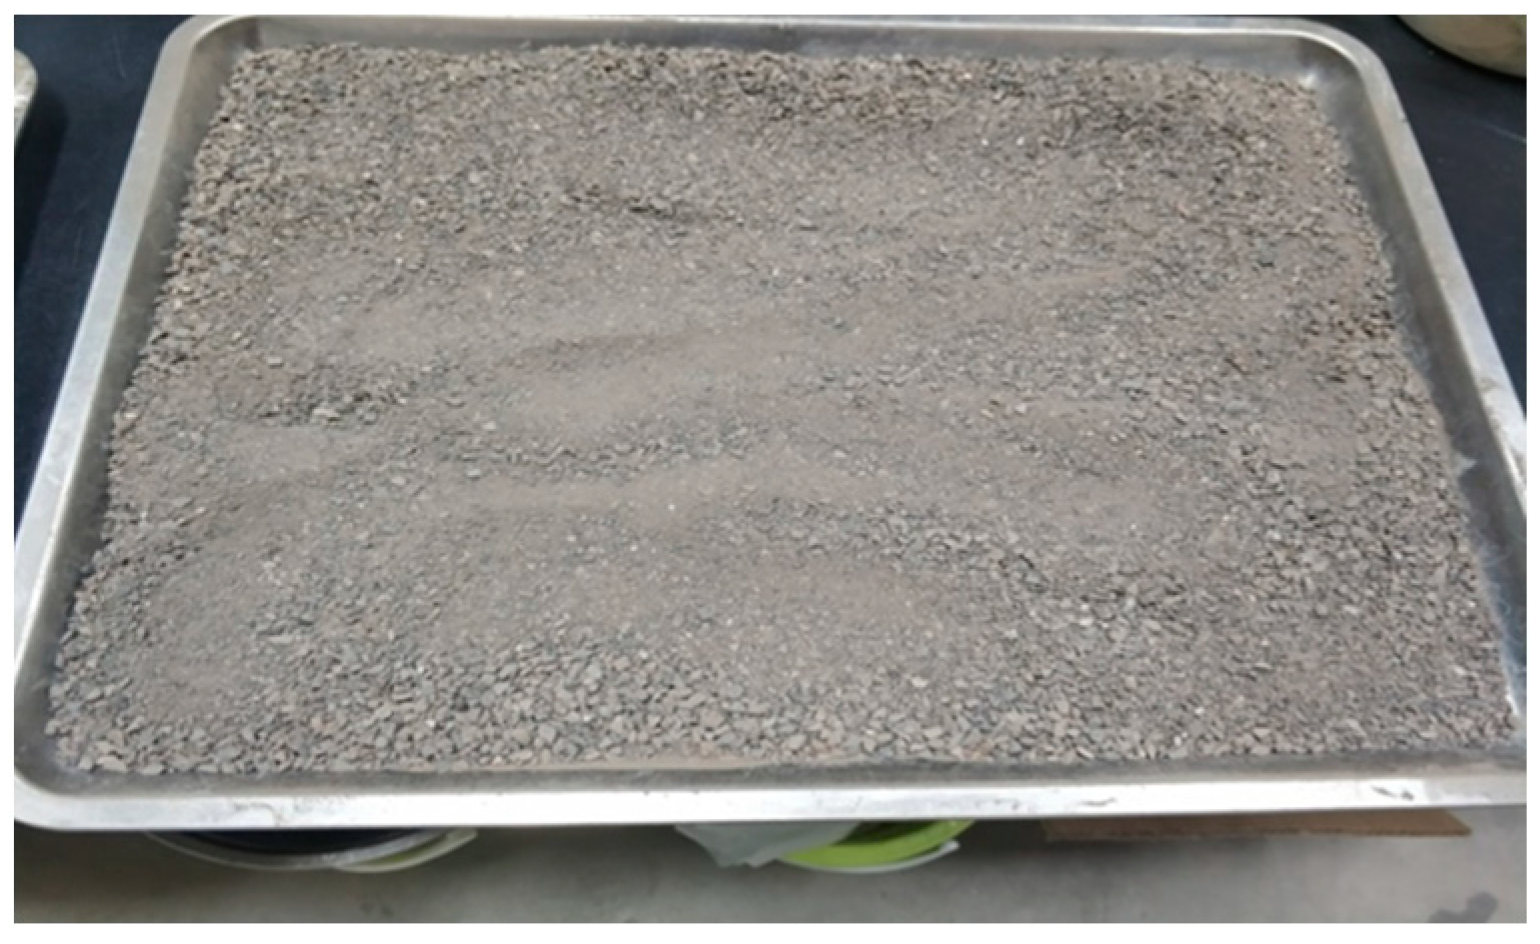
2.1. Materials
- (1)
- Bentonite
- (2)
- Zeolite
- (3)
- Stone chips
2.2. Experimental Procedures
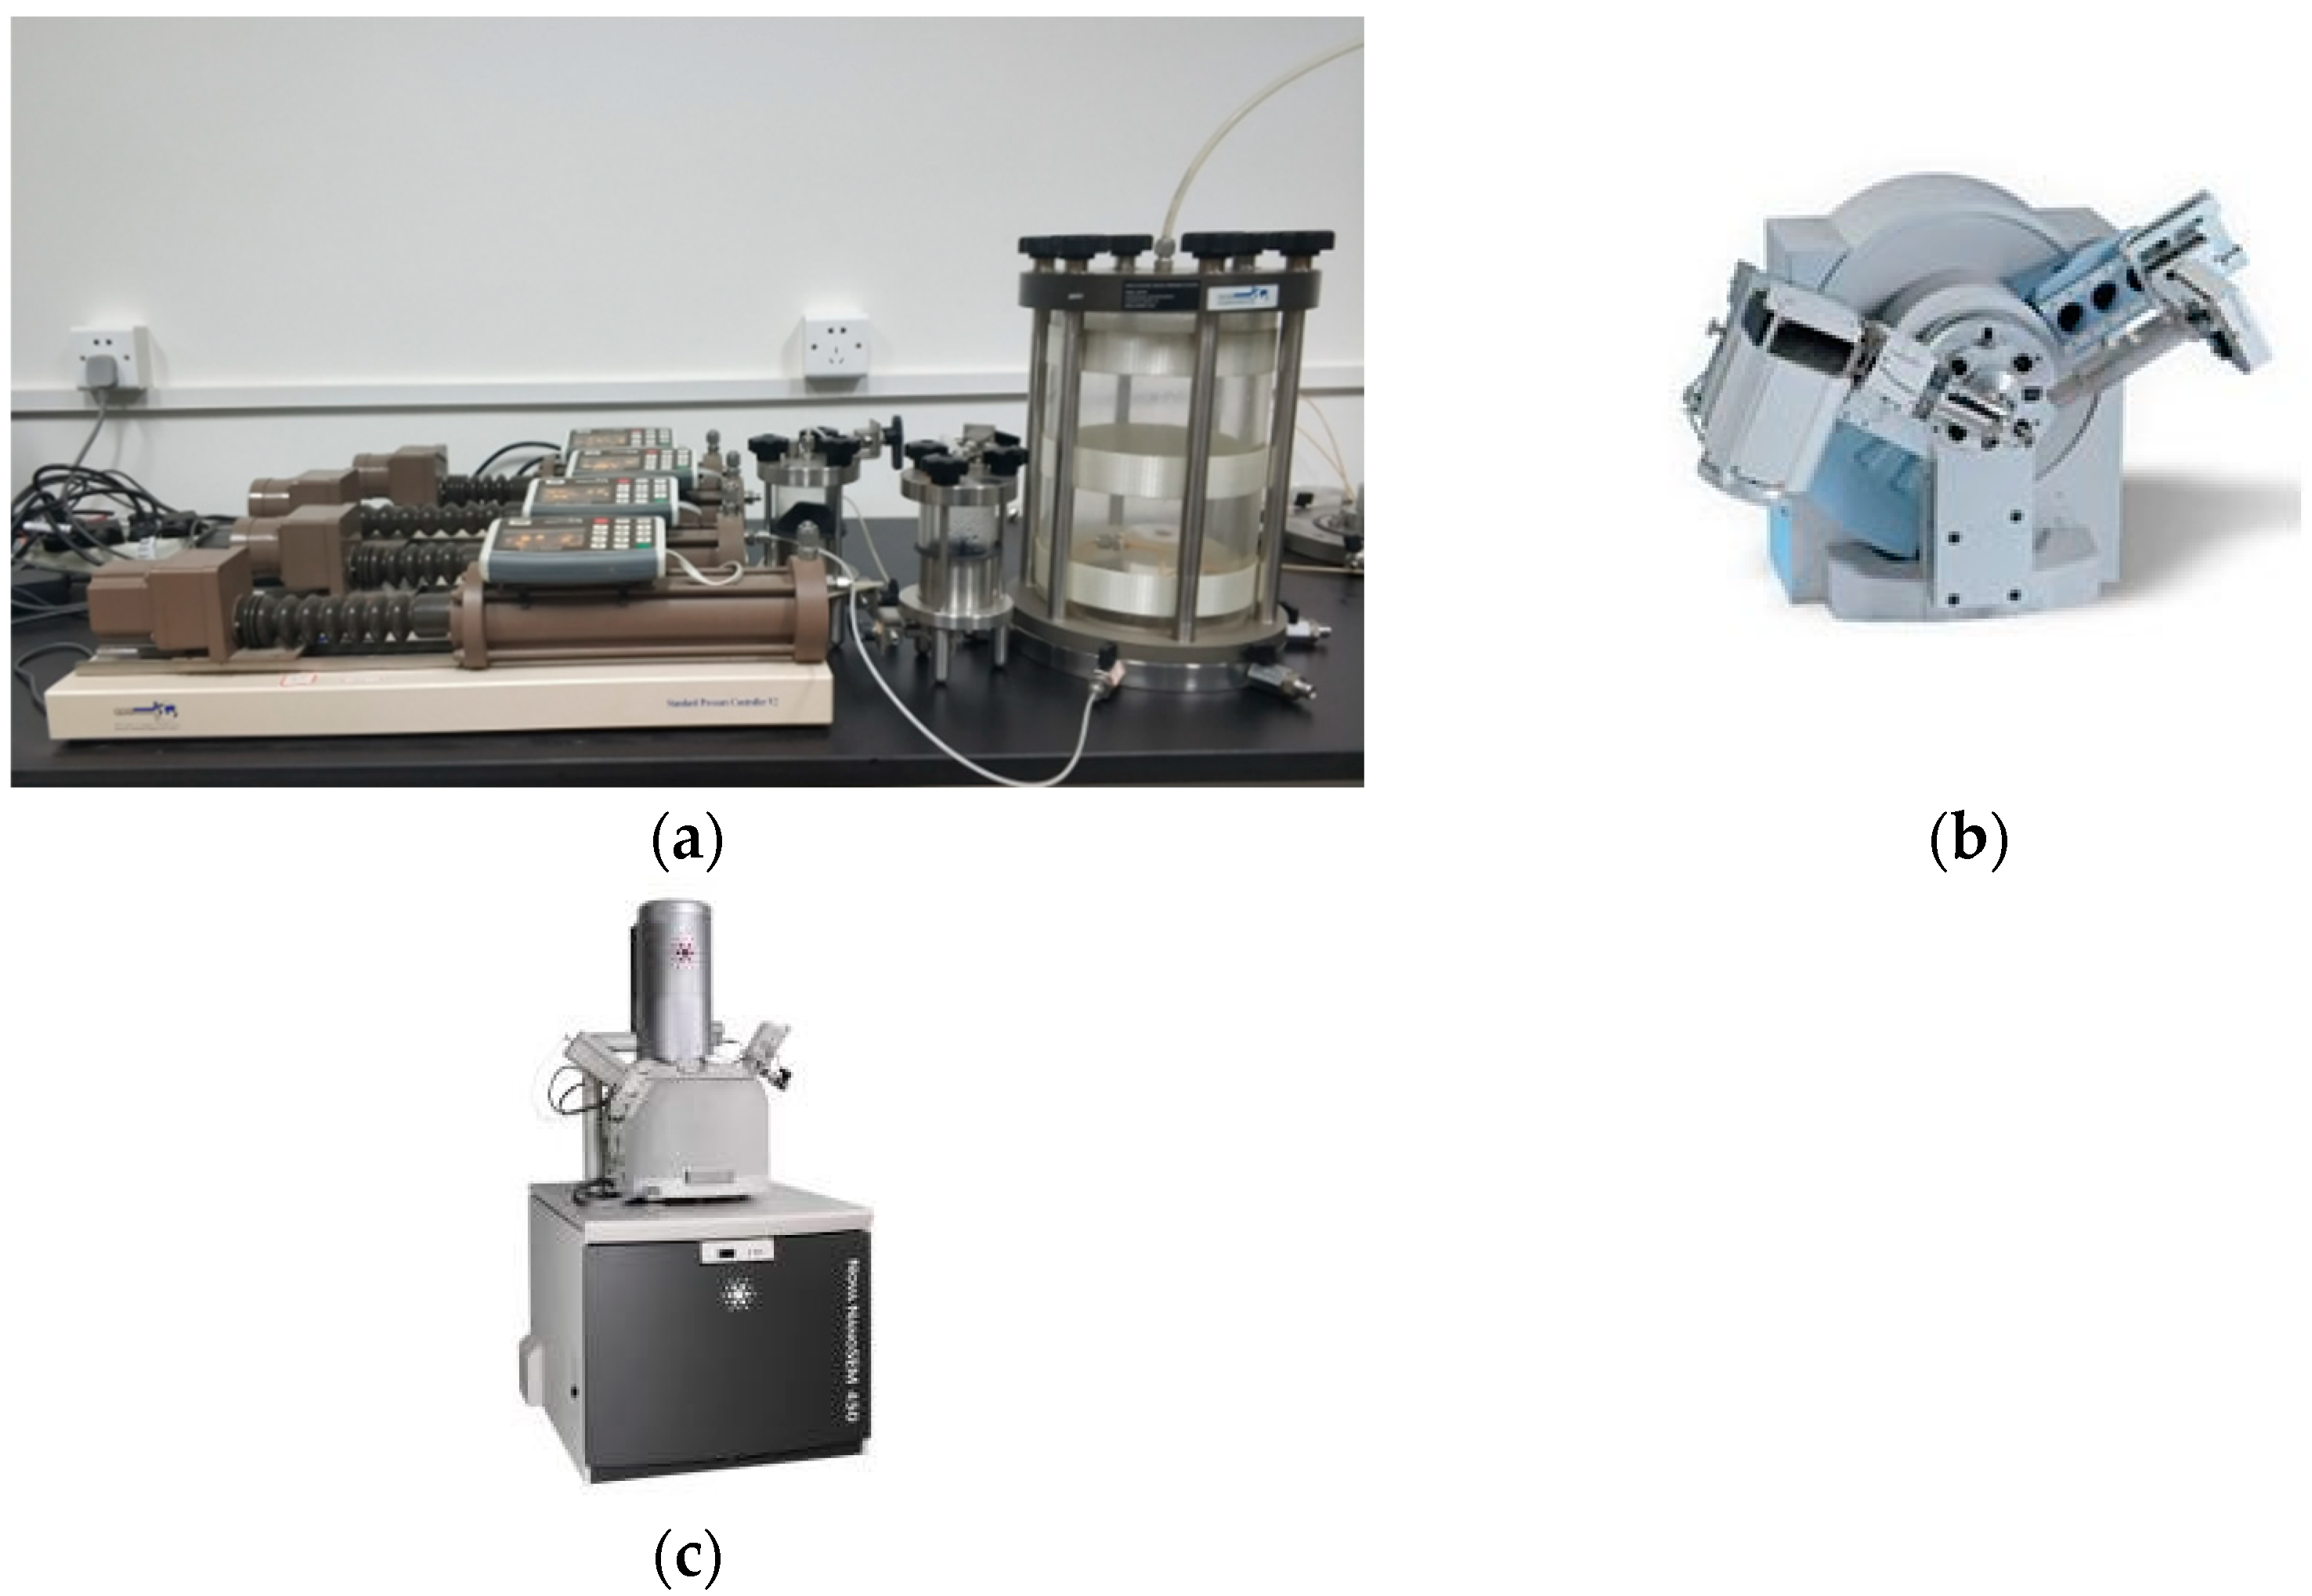
2.3. Test Methods and Apparatus
2.4. Adsorption Kinetics
- ①
- Langmuir model:
- ②
- Freundlich model
- ③
- D-R isothermal adsorption model
- ④
- Henry model
3. Results and Discussion
3.1. Effect of Zeolite Content on Swelling Characteristics of Bentonite
3.2. Effect of Ion Concentration on the Permeability of Soil Mixtures
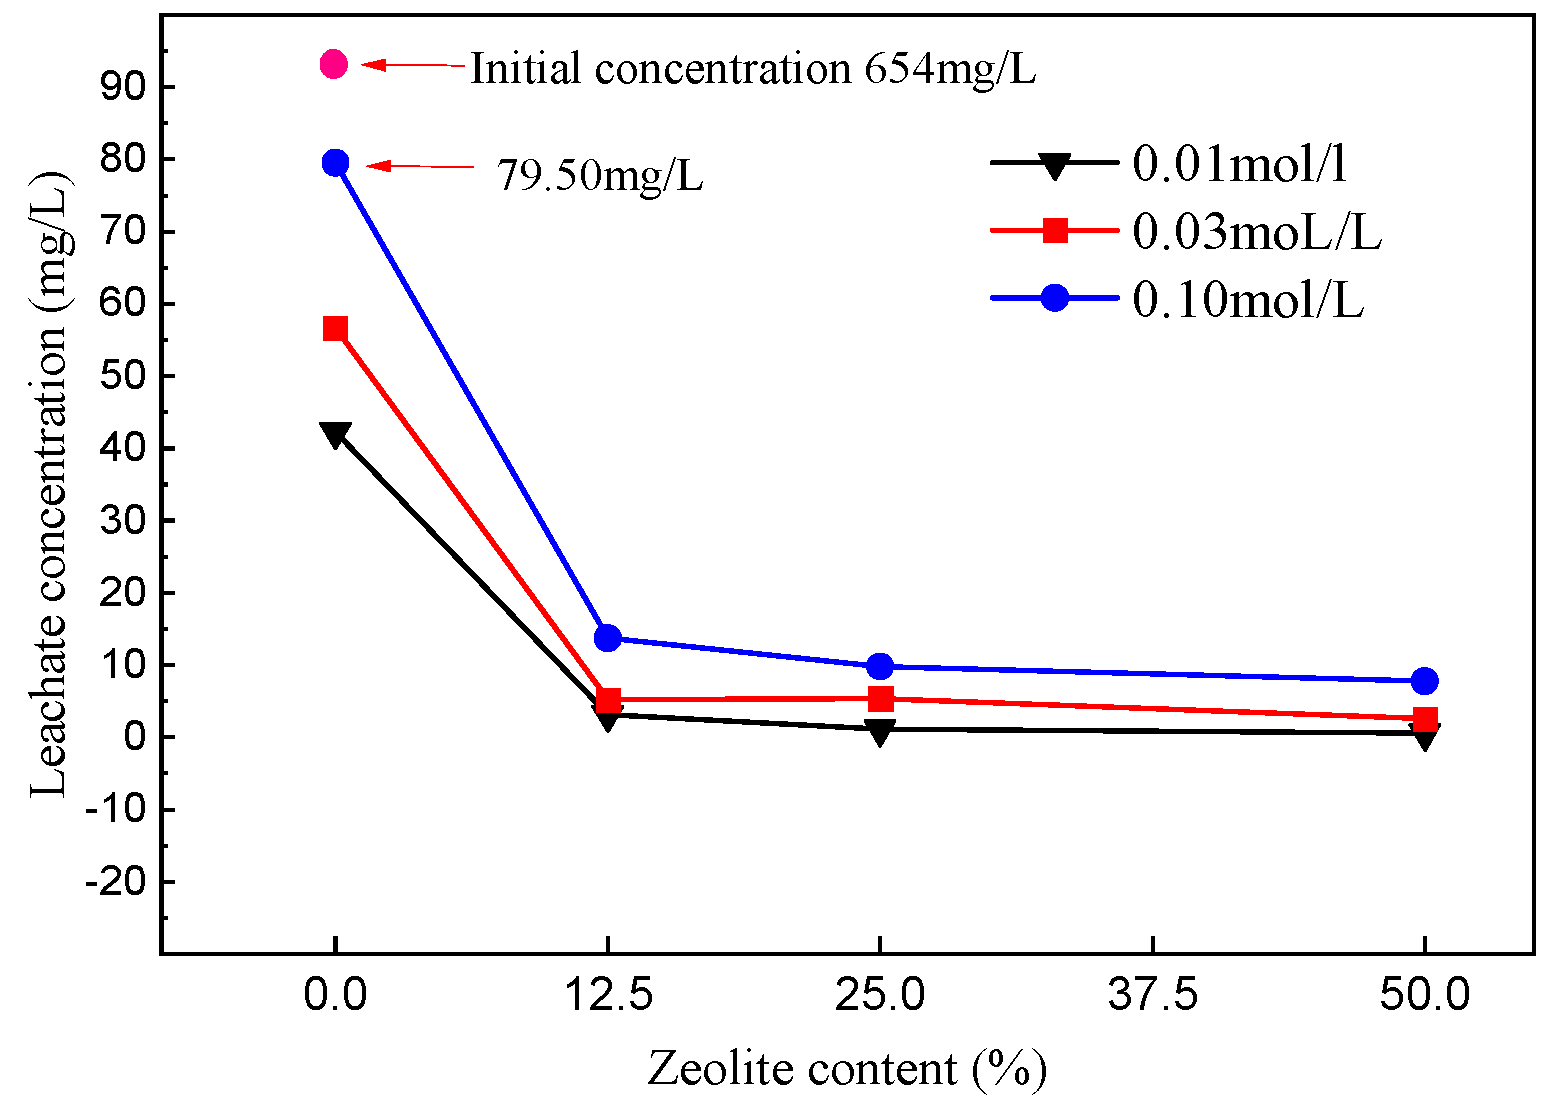
3.3. Changes in Ion Concentration of Leachate
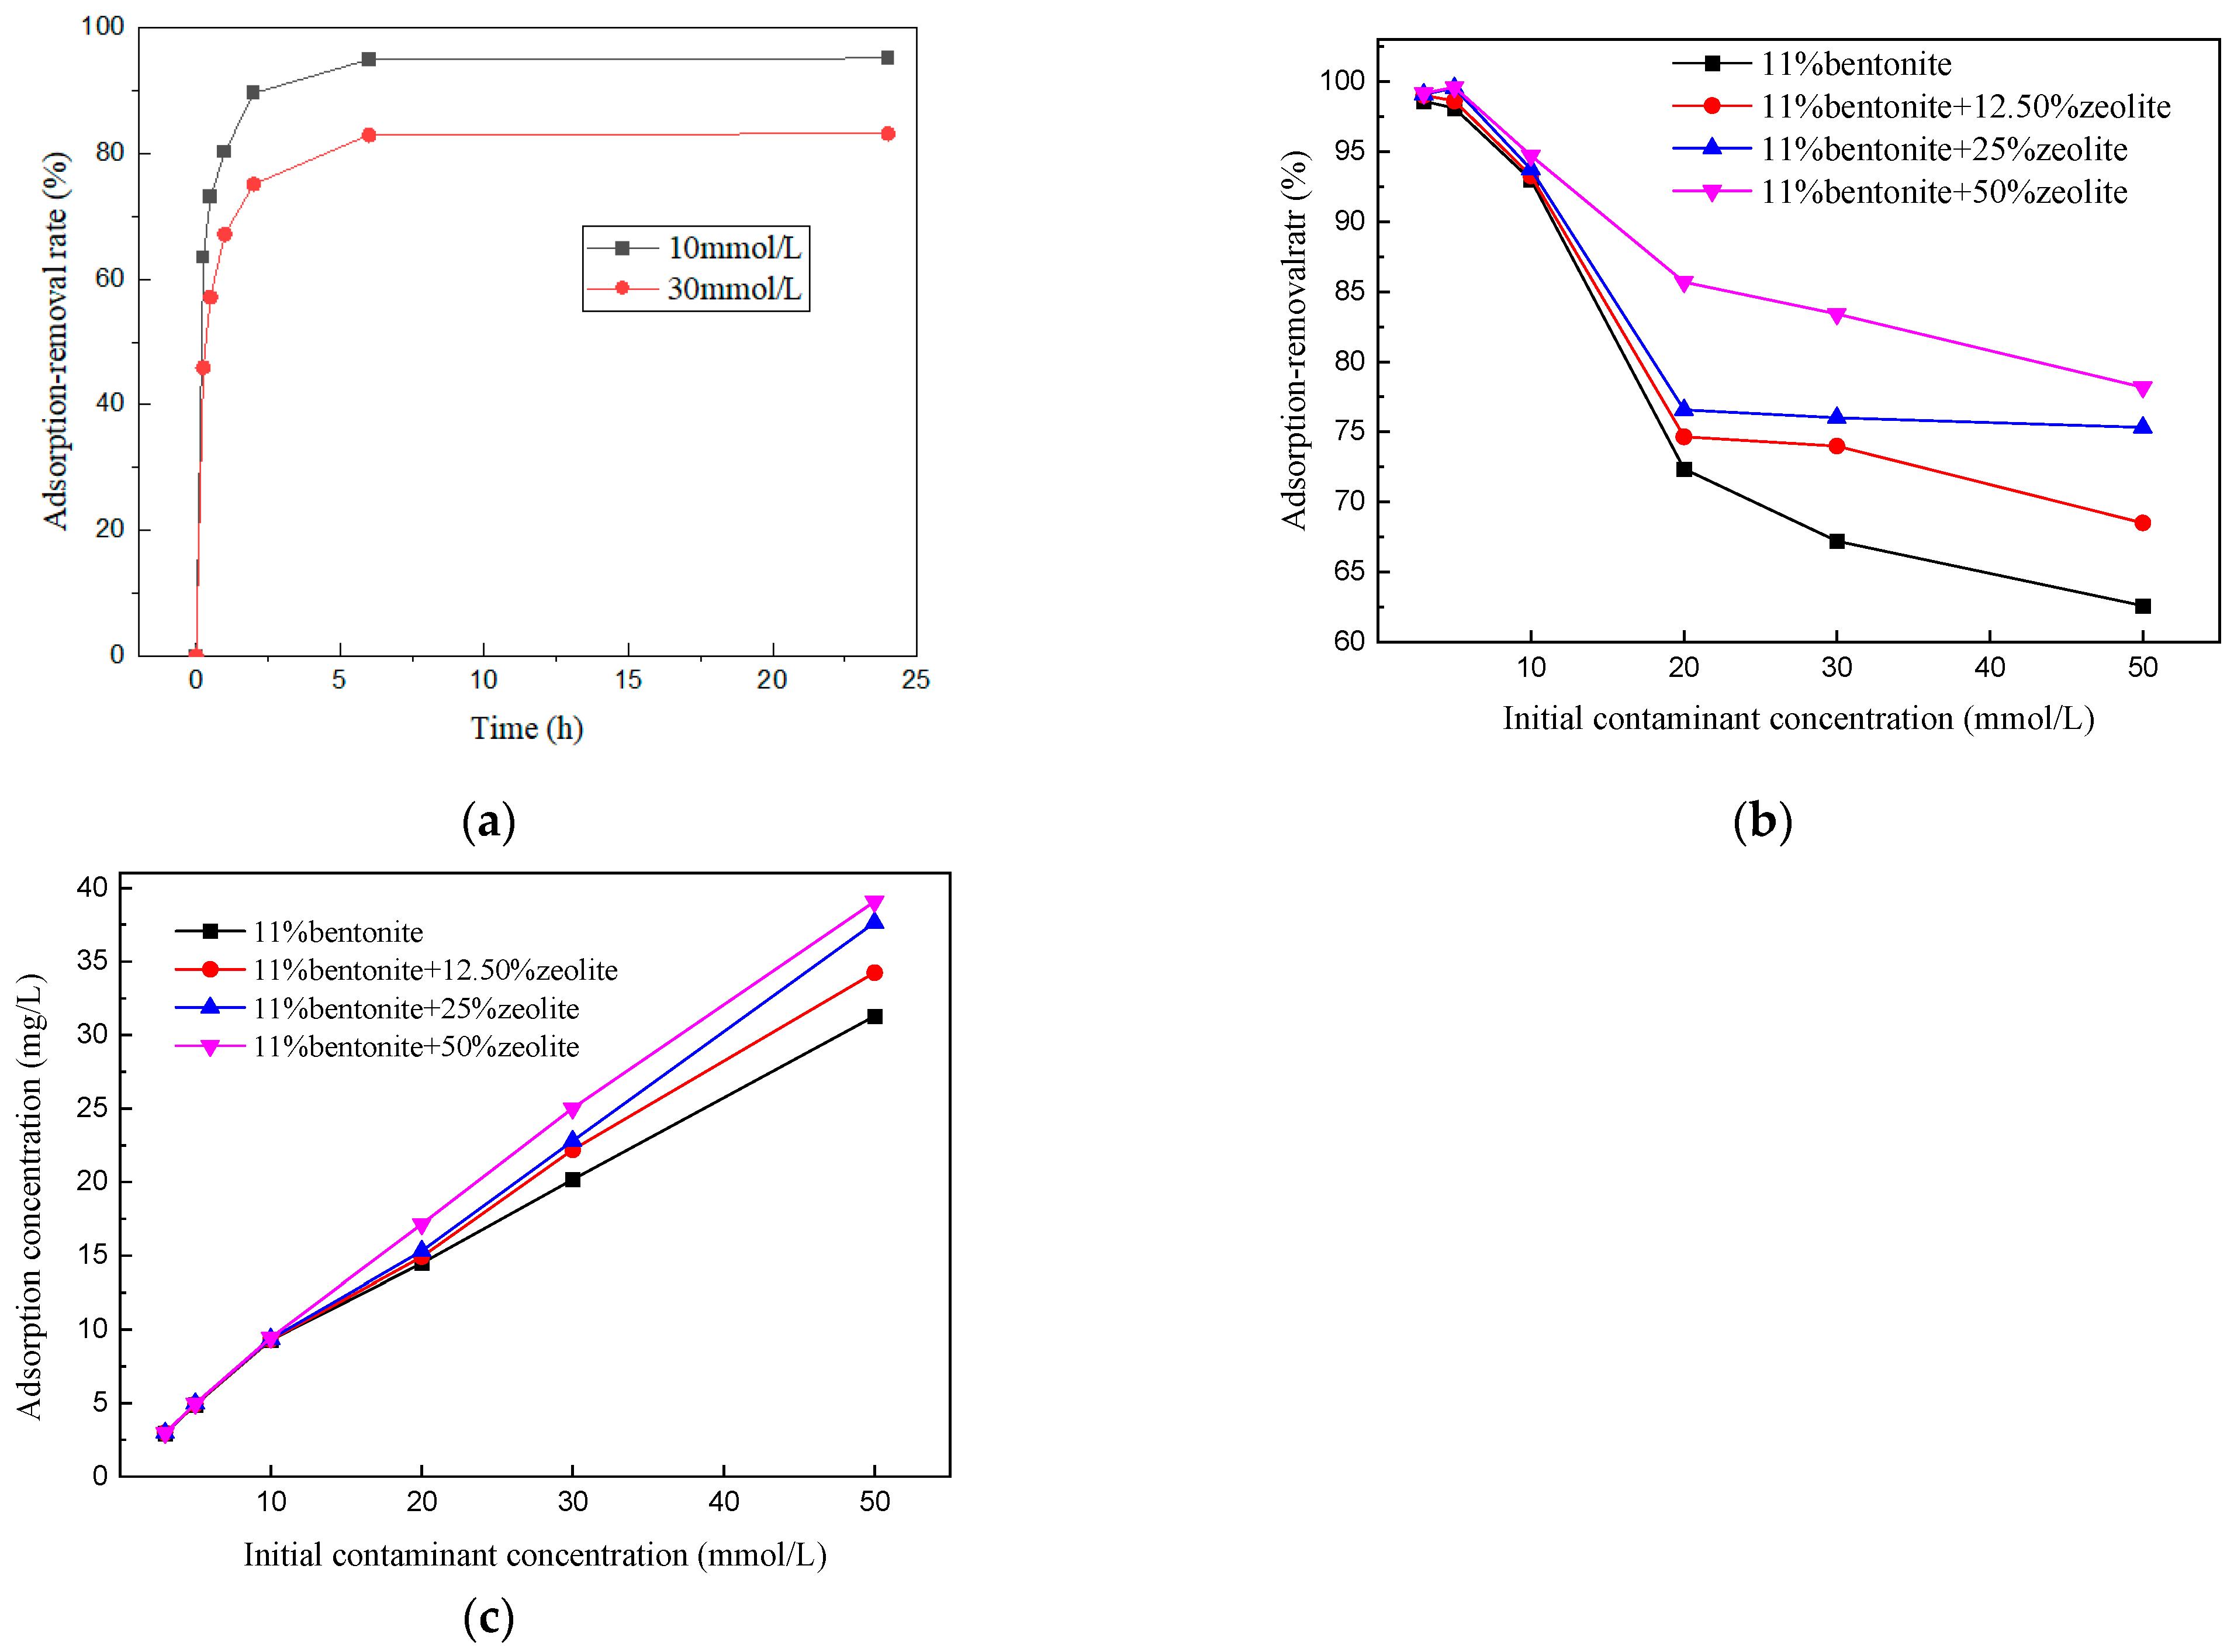
3.4. Effect of Zeolite Content on Adsorption Performance of Soil Mixtures
- (1)
- Ion removal rate
- (2)
- Mixed earth ion adsorption rate
- (3)
- Adsorption model
4. Micromechanics
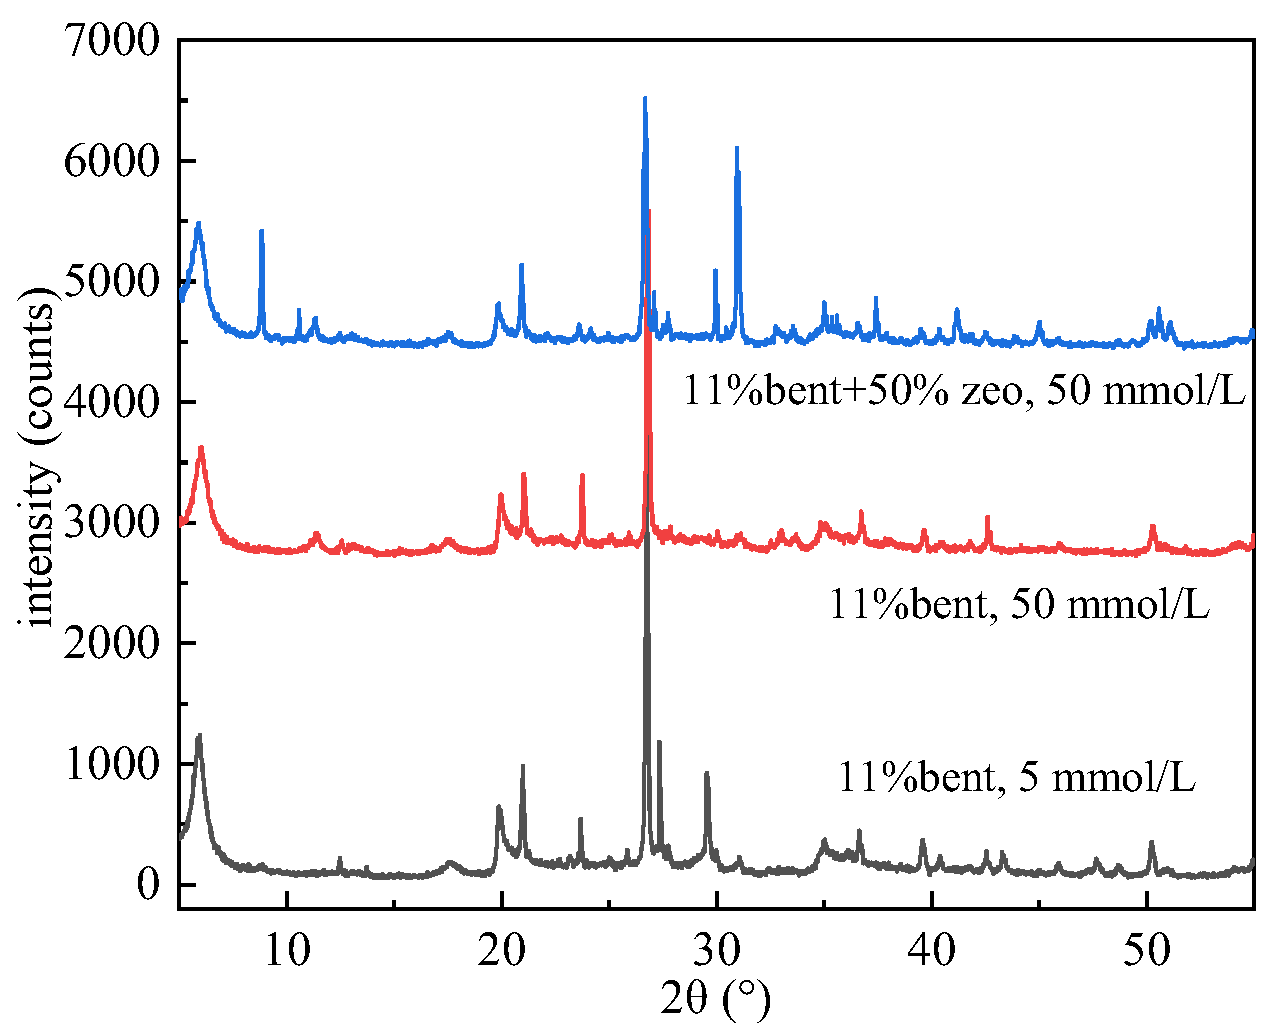
4.1. Influence of Zeolite Doping on the Permeation of Bentonite-Based Liners
- (1)
- XRD
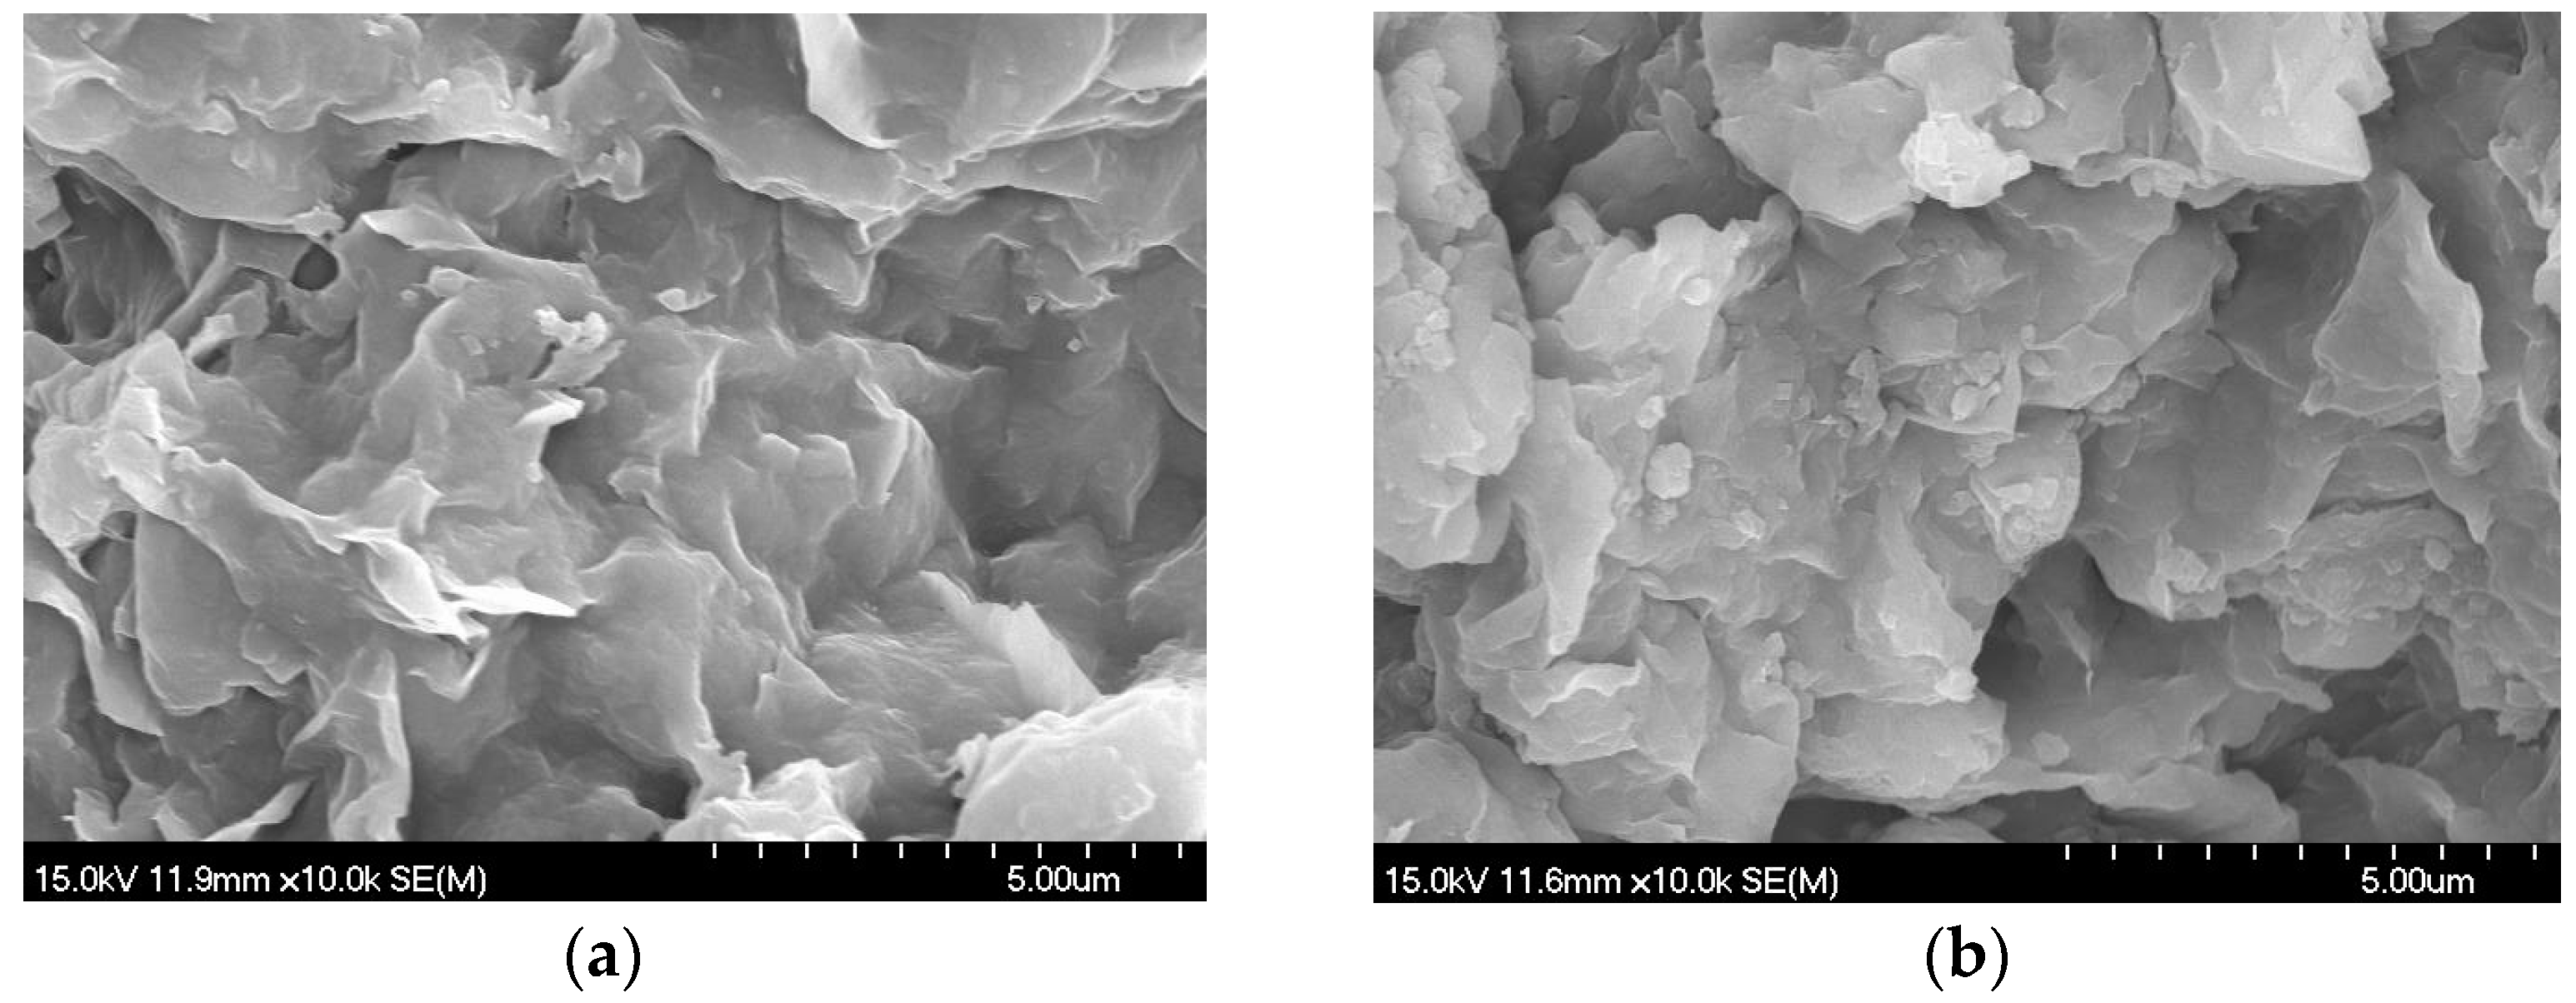
- (2)
- SEM
4.2. Effect of Zeolite Doping on Metal Adsorption Properties of Mixed Soils
- (1)
- Zeta potential
- (2)
- FTIR spectra
- (3)
- Comparison of zeolite-bentonite adsorption properties
5. Conclusions
Author Contributions
Funding
Data Availability Statement
Conflicts of Interest
References
- Huang, X.; Li, J.S.; Xue, Q.; Chen, Z.; Du, Y.J.; Wan, Y.; Liu, L.; Poon, C.S. Use of self-hardening slurry for trench cutoff wall: A review. Constr. Build. Mater. 2021, 286, 122959. [Google Scholar] [CrossRef]
- Narani, S.S.; Abbaspour, M.; Mir Mohammad Hosseini, S.M.; Aflaki, E.; Moghadas, F. Sustainable reuse of Waste Tire Textile Fibers (WTTFs) as reinforcement materials for expansive soils: With a special focus on landfill liners/covers. J. Clean. Prod. 2020, 247, 119151. [Google Scholar] [CrossRef]
- Ye, W.M.; Chen, Y.G.; Chen, B.; Wang, Q.; Wang, J. Advances on the knowledge of the buffer/backfill properties of heavily-compacted GMZ bentonite. Eng. Geol. 2010, 116, 12–20. [Google Scholar] [CrossRef]
- Mukherjee, K.; Mishra, A.K. Evaluation of Hydraulic and Strength Characteristics of Sand-Bentonite Mixtures with Added Tire Fiber for Landfill Application. J. Environ. Eng. 2019, 145, 04019026. [Google Scholar] [CrossRef]
- Otoko, G.R.; Otoko, G.U. The Permeability of Ocean Sand with Bentonite. Int. J. Eng. Technol. Res. 2014, 2, 1–6. Available online: https://www.researchgate.net/publication/266200763 (accessed on 15 November 2022).
- Pawar, R.R.; Lalhmunsiama; Bajaj, H.C.; Lee, S.M. Activated bentonite as a low-cost adsorbent for the removal of Cu (II) and Pb (II) from aqueous solutions: Batch and column studies. J. Ind. Eng. Chem. 2016, 34, 213–223. [Google Scholar] [CrossRef]
- Komine, H. Simplified evaluation for swelling characteristics of bentonites. Eng. Geol. 2004, 71, 265–279. [Google Scholar] [CrossRef]
- Anirudhan, T.S.; Ramachandran, M. Adsorptive removal of basic dyes from aqueous solutions by surfactant modified bentonite clay (organoclay): Kinetic and competitive adsorption isotherm. Process Saf. Environ. Prot. 2015, 95, 215–225. [Google Scholar] [CrossRef]
- Kaya, A.; Ören, A.H. Adsorption of zinc from aqueous solutions to bentonite. J. Hazard. Mater. 2005, 125, 183–189. [Google Scholar] [CrossRef]
- Liu, Z.R.; Zhou, S.Q. Adsorption of copper and nickel on Na-bentonite. Process Saf. Environ. Prot. 2010, 88, 62–66. [Google Scholar] [CrossRef]
- Yu, K.; Xu, J.; Jiang, X.; Liu, C.; McCall, W.; Lu, J.L. Stabilization of heavy metals in soil using two organo-bentonites. Chemosphere. 2017, 184, 884–891. [Google Scholar] [CrossRef] [PubMed]
- Yu, C.; Yang, Y.; Wu, Z.X.; Jiang, J.F.; Liao, R.P.; Deng, Y.F. Experimental study on the permeability and self-healing capacity of geosynthetic clay liners in heavy metal solutions. Geotext. Geomembr. 2021, 49, 413–419. [Google Scholar] [CrossRef]
- Dutta, J.; Mishra, A.K. Influence of the presence of heavy metals on the behaviour of bentonites. Environ. Earth Sci. 2016, 75, 993. [Google Scholar] [CrossRef]
- Xu, C.; Liao, X.Y.; Li, Z.B. Influence of Solution Characteristics on Swelling and Hydraulic Performance of Geosynthetic Clay Liners. Geosynth. Civ. Environ. Eng. 2009, 58–63. [Google Scholar] [CrossRef]
- Cabrera, C.; Gabaldón, C.; Marzak, P. Sorption characteristics of heavy metal ions by a natural zeolite. J. Chem. Technol. Biot. 2005, 80, 477–481. [Google Scholar] [CrossRef]
- Abollino, O.; Aceto, M.; Malandrino, M.; Sarzanini, C.; Mentasti, E. Adsorption of heavy metals on Na-montmorillonite. Effect of pH and organic substances. Water Res. 2003, 37, 1619–1627. [Google Scholar] [CrossRef]
- Iskander, A.L.; Khald, E.M.; Sheta, A.S. Zinc and manganese sorption behavior by natural zeolite and bentonite. Ann. Agric. Sci. 2011, 56, 43–48. [Google Scholar] [CrossRef]
- Salem, A.; Akbari, S.R. Removal of lead from solution by combination of natural zeolite–kaolin–bentonite as a new low-cost adsorbent. Chem. Eng. J. 2011, 174, 619–628. [Google Scholar] [CrossRef]
- Sen, T.K.; Gomez, D. Adsorption of zinc (Zn2+) from aqueous solution on natural bentonite. Desalination 2011, 267, 286–294. [Google Scholar] [CrossRef]
- Badollp-Almaraz, V.; Trocellier, P.; Dávila-Rangel, I. Adsorption of aqueous Zn(II) species on synthetic zeolites. Nucl. Instrum. Methods B 2003, 210, 424–428. [Google Scholar] [CrossRef]
- Amutenya, E.L.M.; Zhou, F.S.; Liu, J.L.; Long, W.J.; Ma, L.; Liu, M.; Lv, G.M. Preparation of humic acid-bentonite polymer composite: A heavy metal ion adsorbent. Heliyon 2022, 8, e09720. [Google Scholar] [CrossRef] [PubMed]
- Cao, L.P.; Li, Z.H.; Xiang, S.Y.; Huang, Z.H.; Roger, R.; Liu, Y.H. Preparation and characteristics of bentonite–zeolite adsorbent and its application in swine wastewater. Bioresour. Technol. 2019, 284, 448–455. [Google Scholar] [CrossRef] [PubMed]


| Content/ Parameter | Bentonite | Bentonite + 12.50% Zeolite | Bentonite + 25% Zeolite | Bentonite + 50% Zeolite | |
|---|---|---|---|---|---|
| KL | 3.55 × 10⁻⁴ | 3.54 × 10⁻⁴ | 3.02 × 10⁻⁴ | 2.45 × 10⁻⁴ | |
| Langmuir | qm | 145.90 | 181.80 | 253.60 | 423.40 |
| R2 | 0.93 | 0.94 | 0.96 | 0.95 | |
| KF | 0.51 | 0.42 | 0.39 | 0.33 | |
| Freundlich | n | 1.60 | 1.46 | 1.33 | 1.25 |
| R2 | 0.96 | 0.96 | 0.96 | 0.96 |
Publisher’s Note: MDPI stays neutral with regard to jurisdictional claims in published maps and institutional affiliations. |
© 2022 by the authors. Licensee MDPI, Basel, Switzerland. This article is an open access article distributed under the terms and conditions of the Creative Commons Attribution (CC BY) license (https://creativecommons.org/licenses/by/4.0/).
Share and Cite
Xu, S.; Fu, Y.; Wang, J.; Lv, J.; Xu, X.; Wei, W.; Wang, Z. Effect of Zeolite Content on Permeability of Stone Chip-Bentonite-Zeolite Mixture Using a Single Solution. Appl. Sci. 2022, 12, 11732. https://doi.org/10.3390/app122211732
Xu S, Fu Y, Wang J, Lv J, Xu X, Wei W, Wang Z. Effect of Zeolite Content on Permeability of Stone Chip-Bentonite-Zeolite Mixture Using a Single Solution. Applied Sciences. 2022; 12(22):11732. https://doi.org/10.3390/app122211732
Chicago/Turabian StyleXu, Sifa, Yajun Fu, Jun Wang, Jianwei Lv, Xiaobing Xu, Weiwei Wei, and Zhe Wang. 2022. "Effect of Zeolite Content on Permeability of Stone Chip-Bentonite-Zeolite Mixture Using a Single Solution" Applied Sciences 12, no. 22: 11732. https://doi.org/10.3390/app122211732
APA StyleXu, S., Fu, Y., Wang, J., Lv, J., Xu, X., Wei, W., & Wang, Z. (2022). Effect of Zeolite Content on Permeability of Stone Chip-Bentonite-Zeolite Mixture Using a Single Solution. Applied Sciences, 12(22), 11732. https://doi.org/10.3390/app122211732