
Optimization of 99mTc-MAA SPECT/CT Imaging for 90Y Radioembolization Using a 3D-Printed Phantom

 , , and
Abstract
1. Introduction
2. Materials and Methods
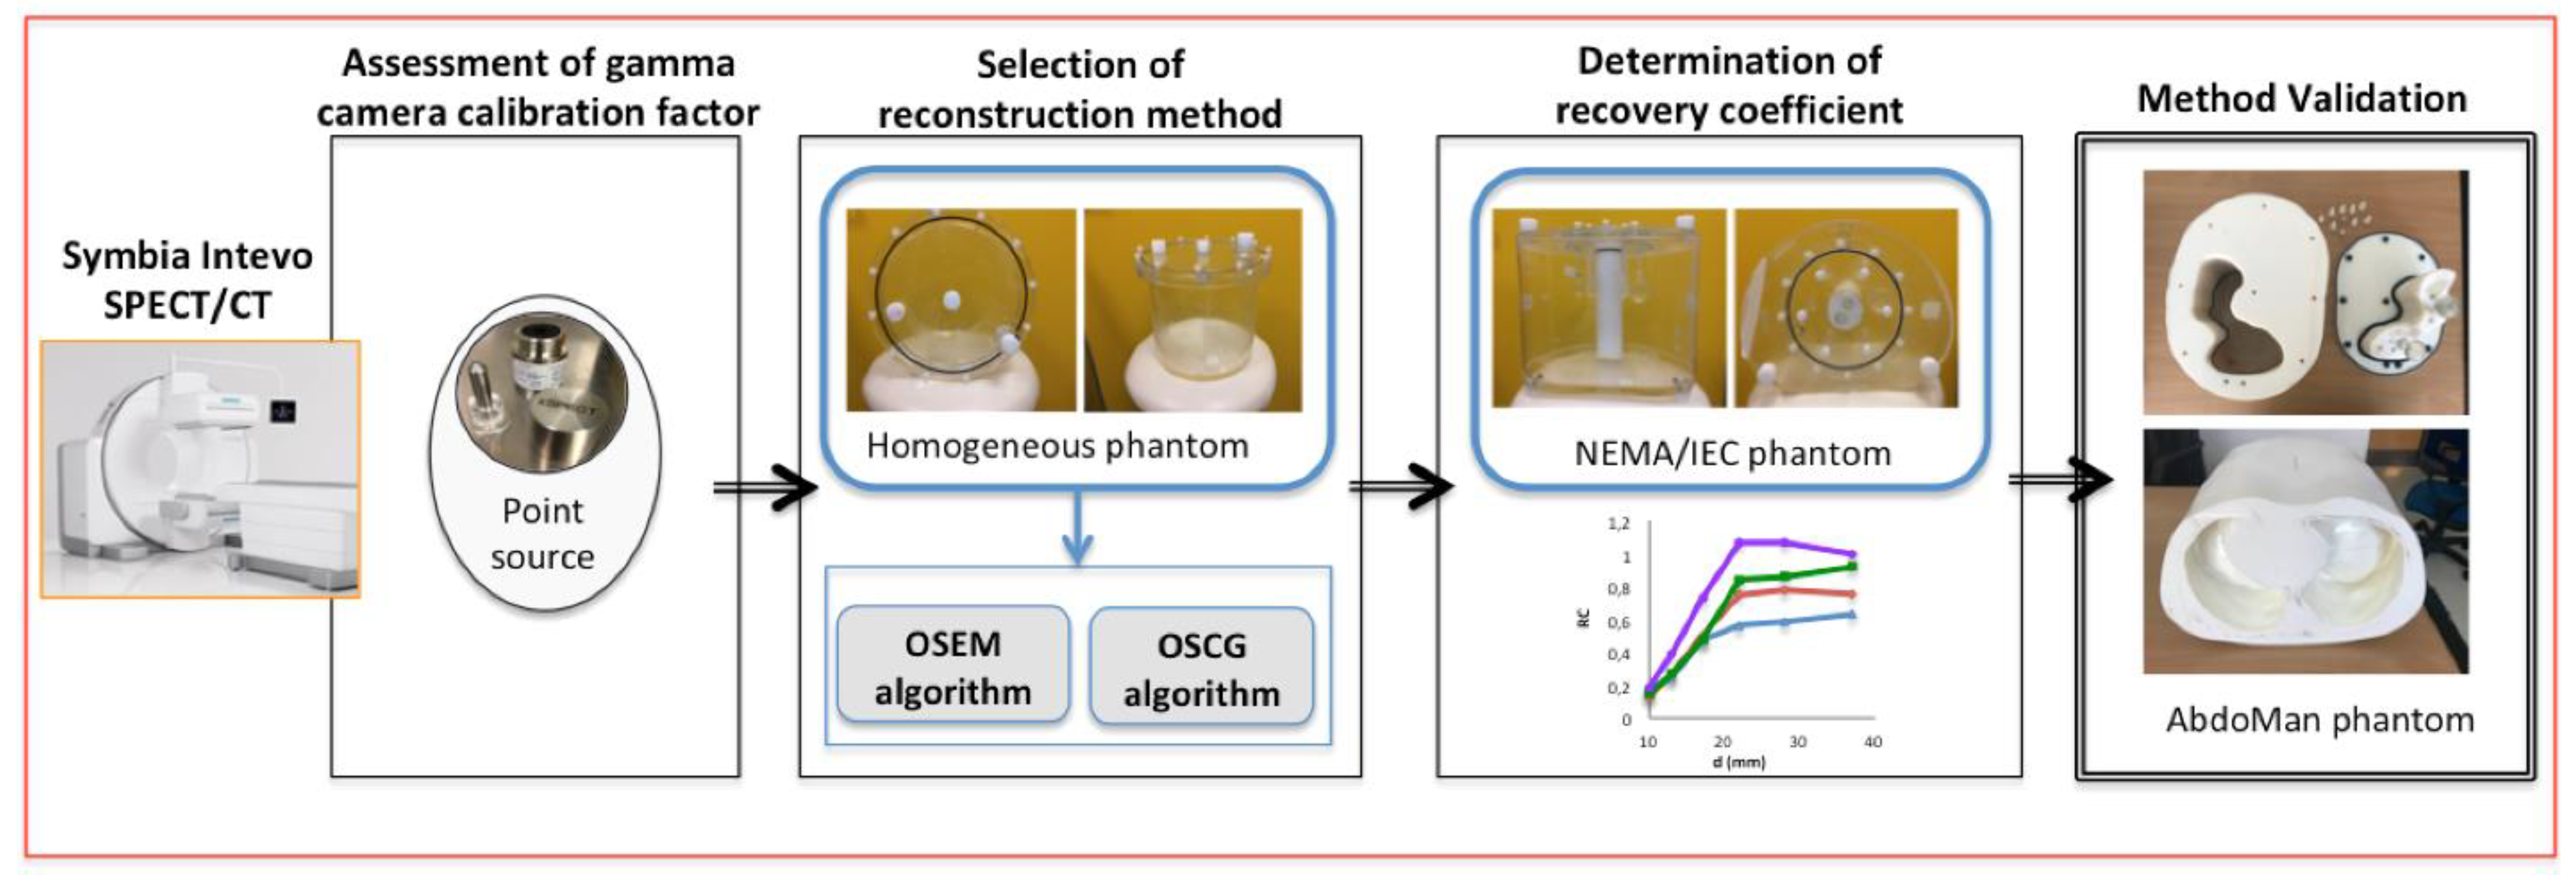
- (1)
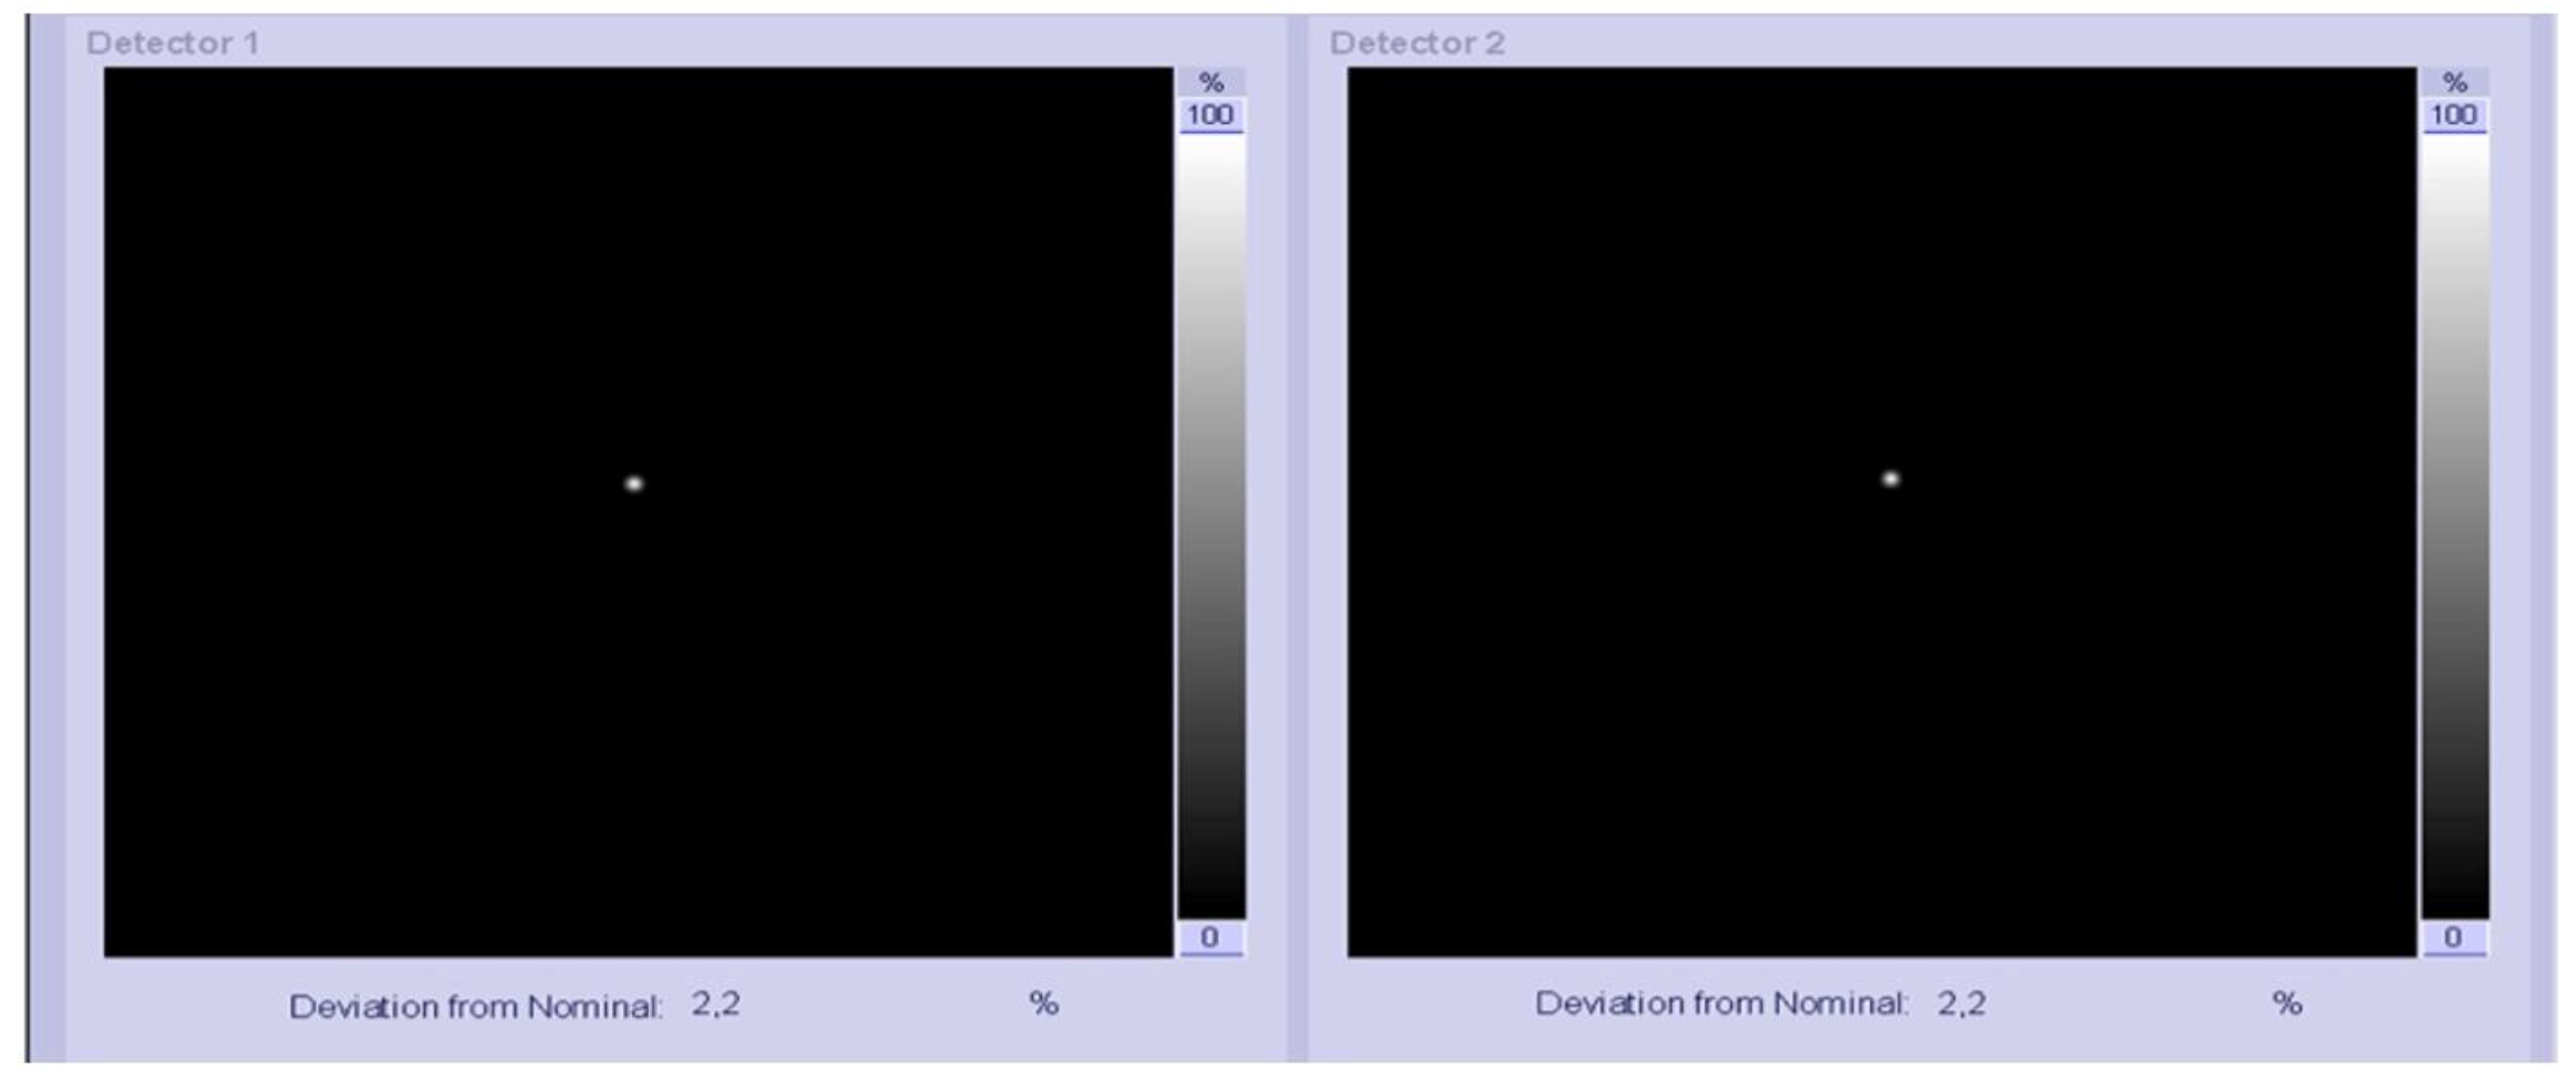
- Assessment of gamma camera calibration factor using a NIST traceable 57Co point source;
- (2)
- Selection of reconstruction method: using the calibration factor derived from the previous step, data acquisition of a homogeneous cylindrical phantom was performed in order to assess the best reconstruction method. Two algorithms were tested (the OSEM and OSCG algorithm) using the built-in quantitative xSPECT package. The selected algorithm was then used to reconstruct raw data in step (3) and (4);
- (3)
- Determination of recovery coefficient: acquisition of the NEMA-IEC phantom provided with 6 fillable spheres was carried out in order to assess recovery coefficients for small volumes;
- (4)
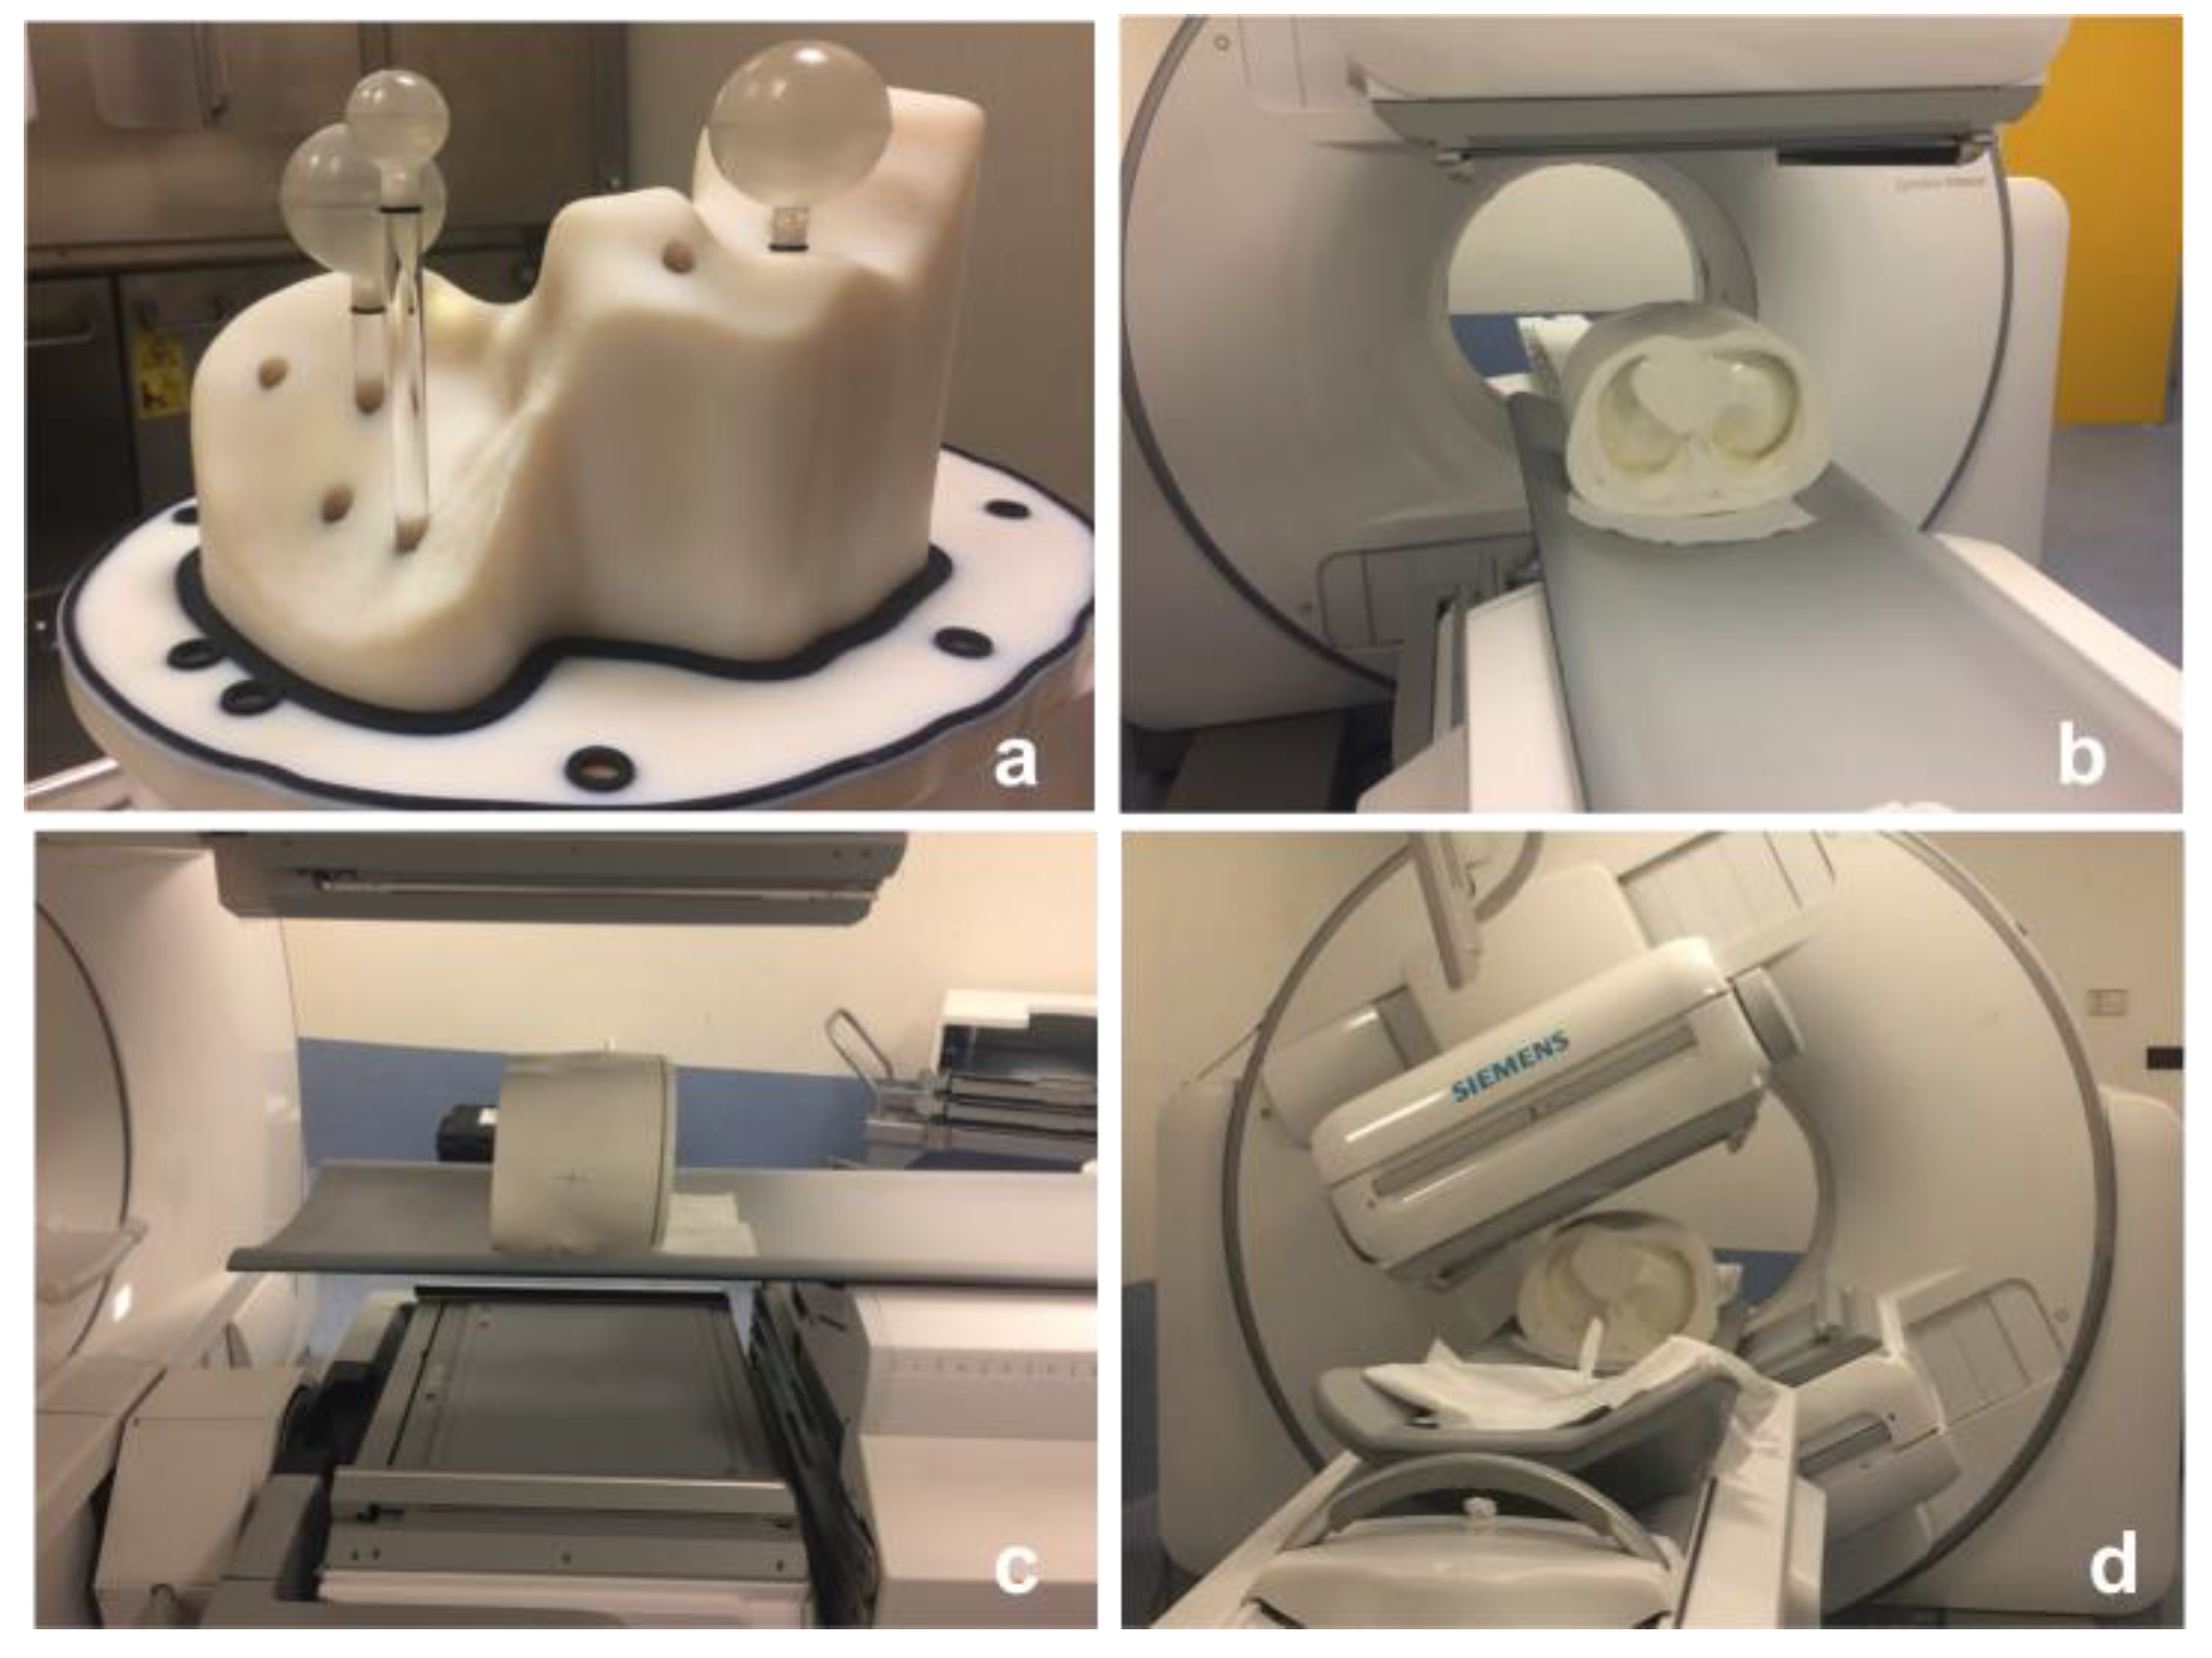
- Method validation: using information elicited from the previous steps, the quantification procedure was validated using a 3D-printed anthropomorphic phantom provided with fillable spheres simulating hepatic lesions.
2.1. Assessment of Gamma Camera Calibration Factor

| Phantom | Nominal Volume (mL) | Length (cm) | Outside Diameter (cm) |
|---|---|---|---|
| Point-like source | 0.1 | 0.01 | 0.01 |
| Homogeneous cylindrical | 6462 | 17 | 22 |
| NEMA/IEC | 9700 | 18 | 30 |
| Abdo-Man | 1783 | 25.1 | 34.2 |
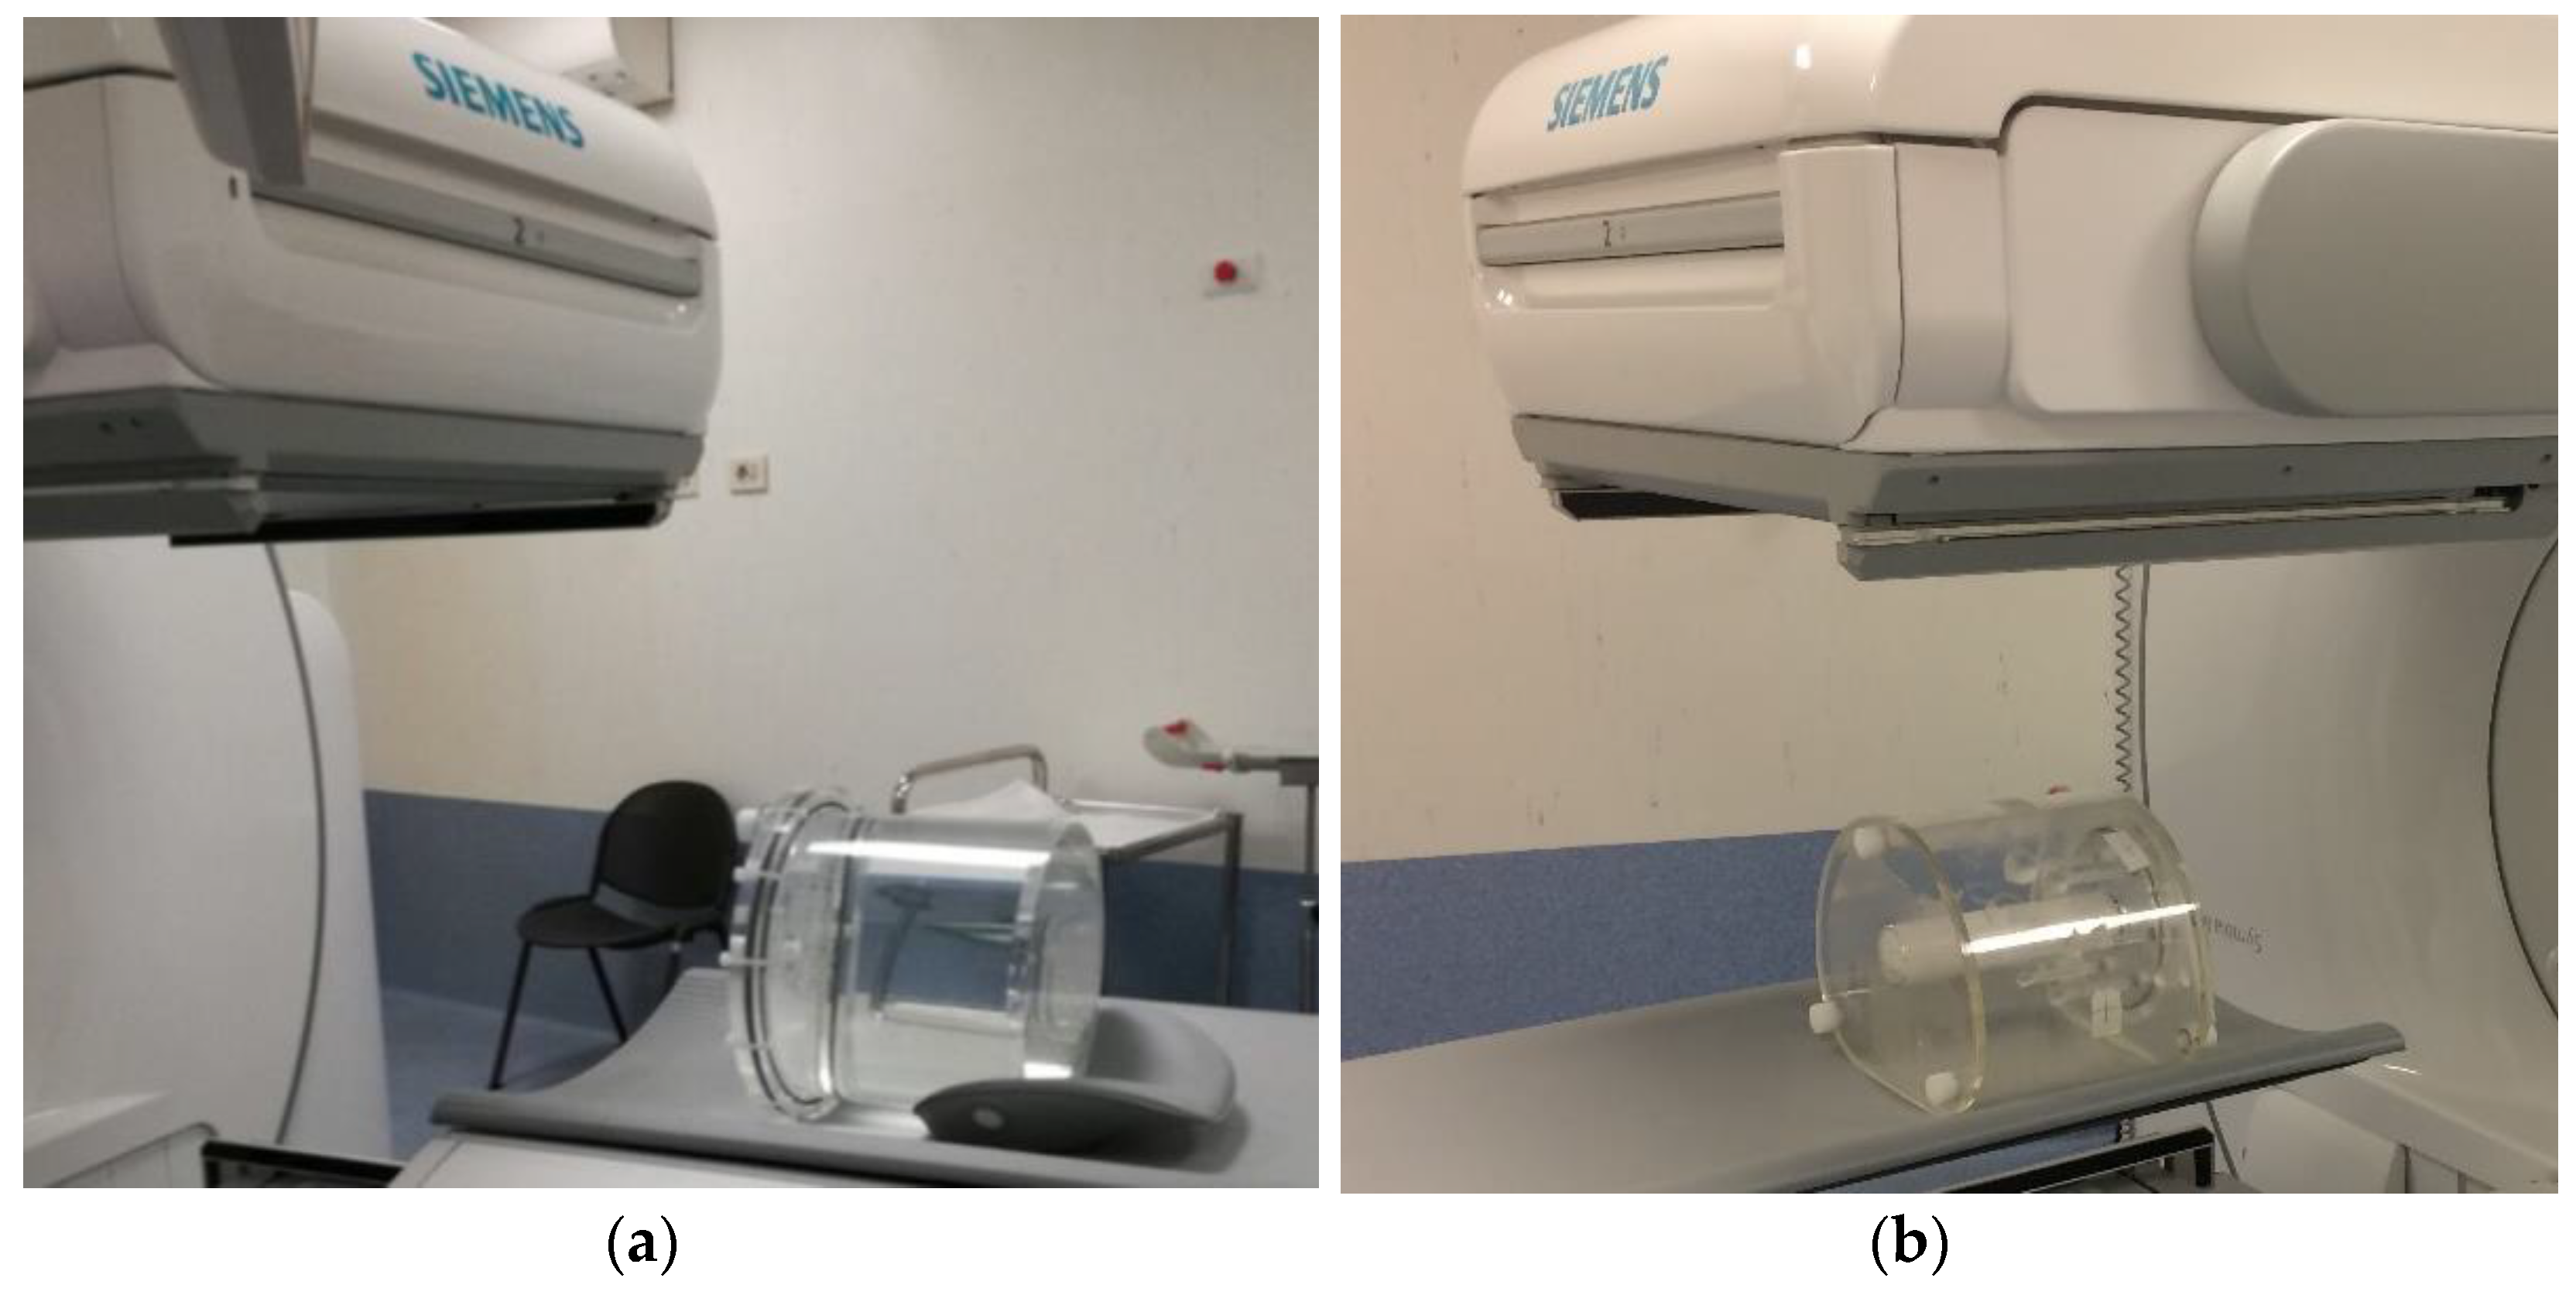
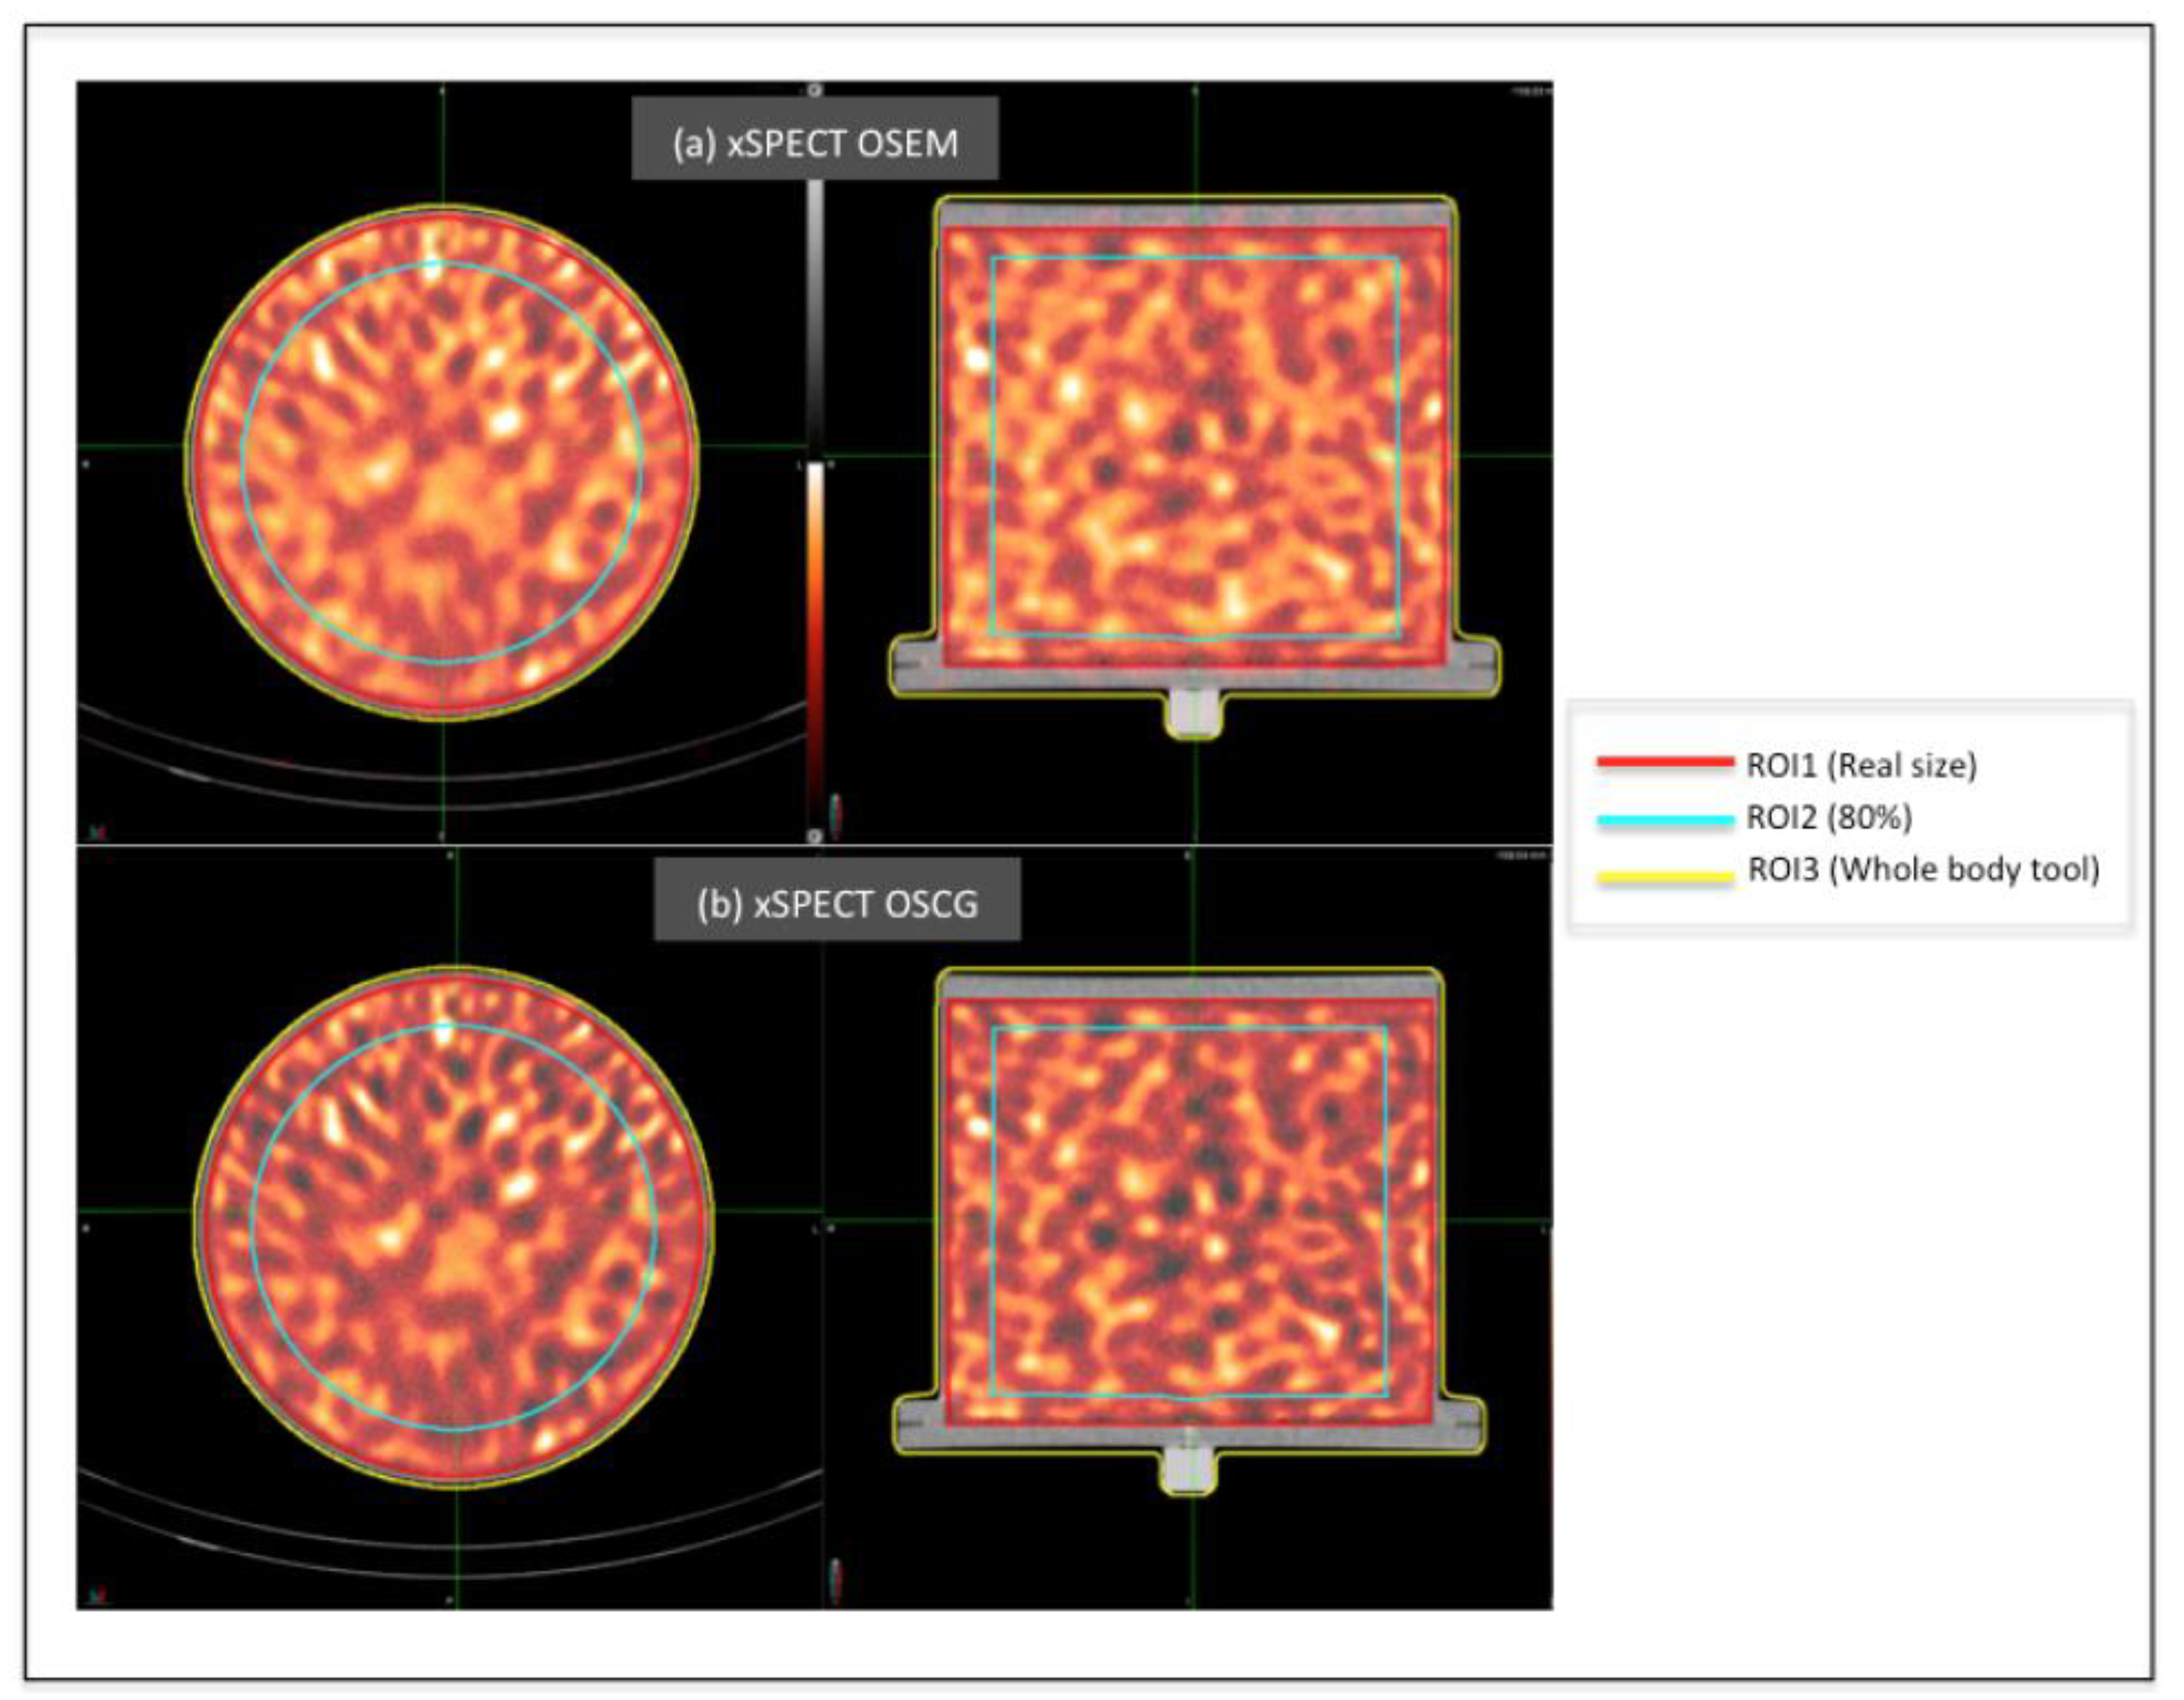
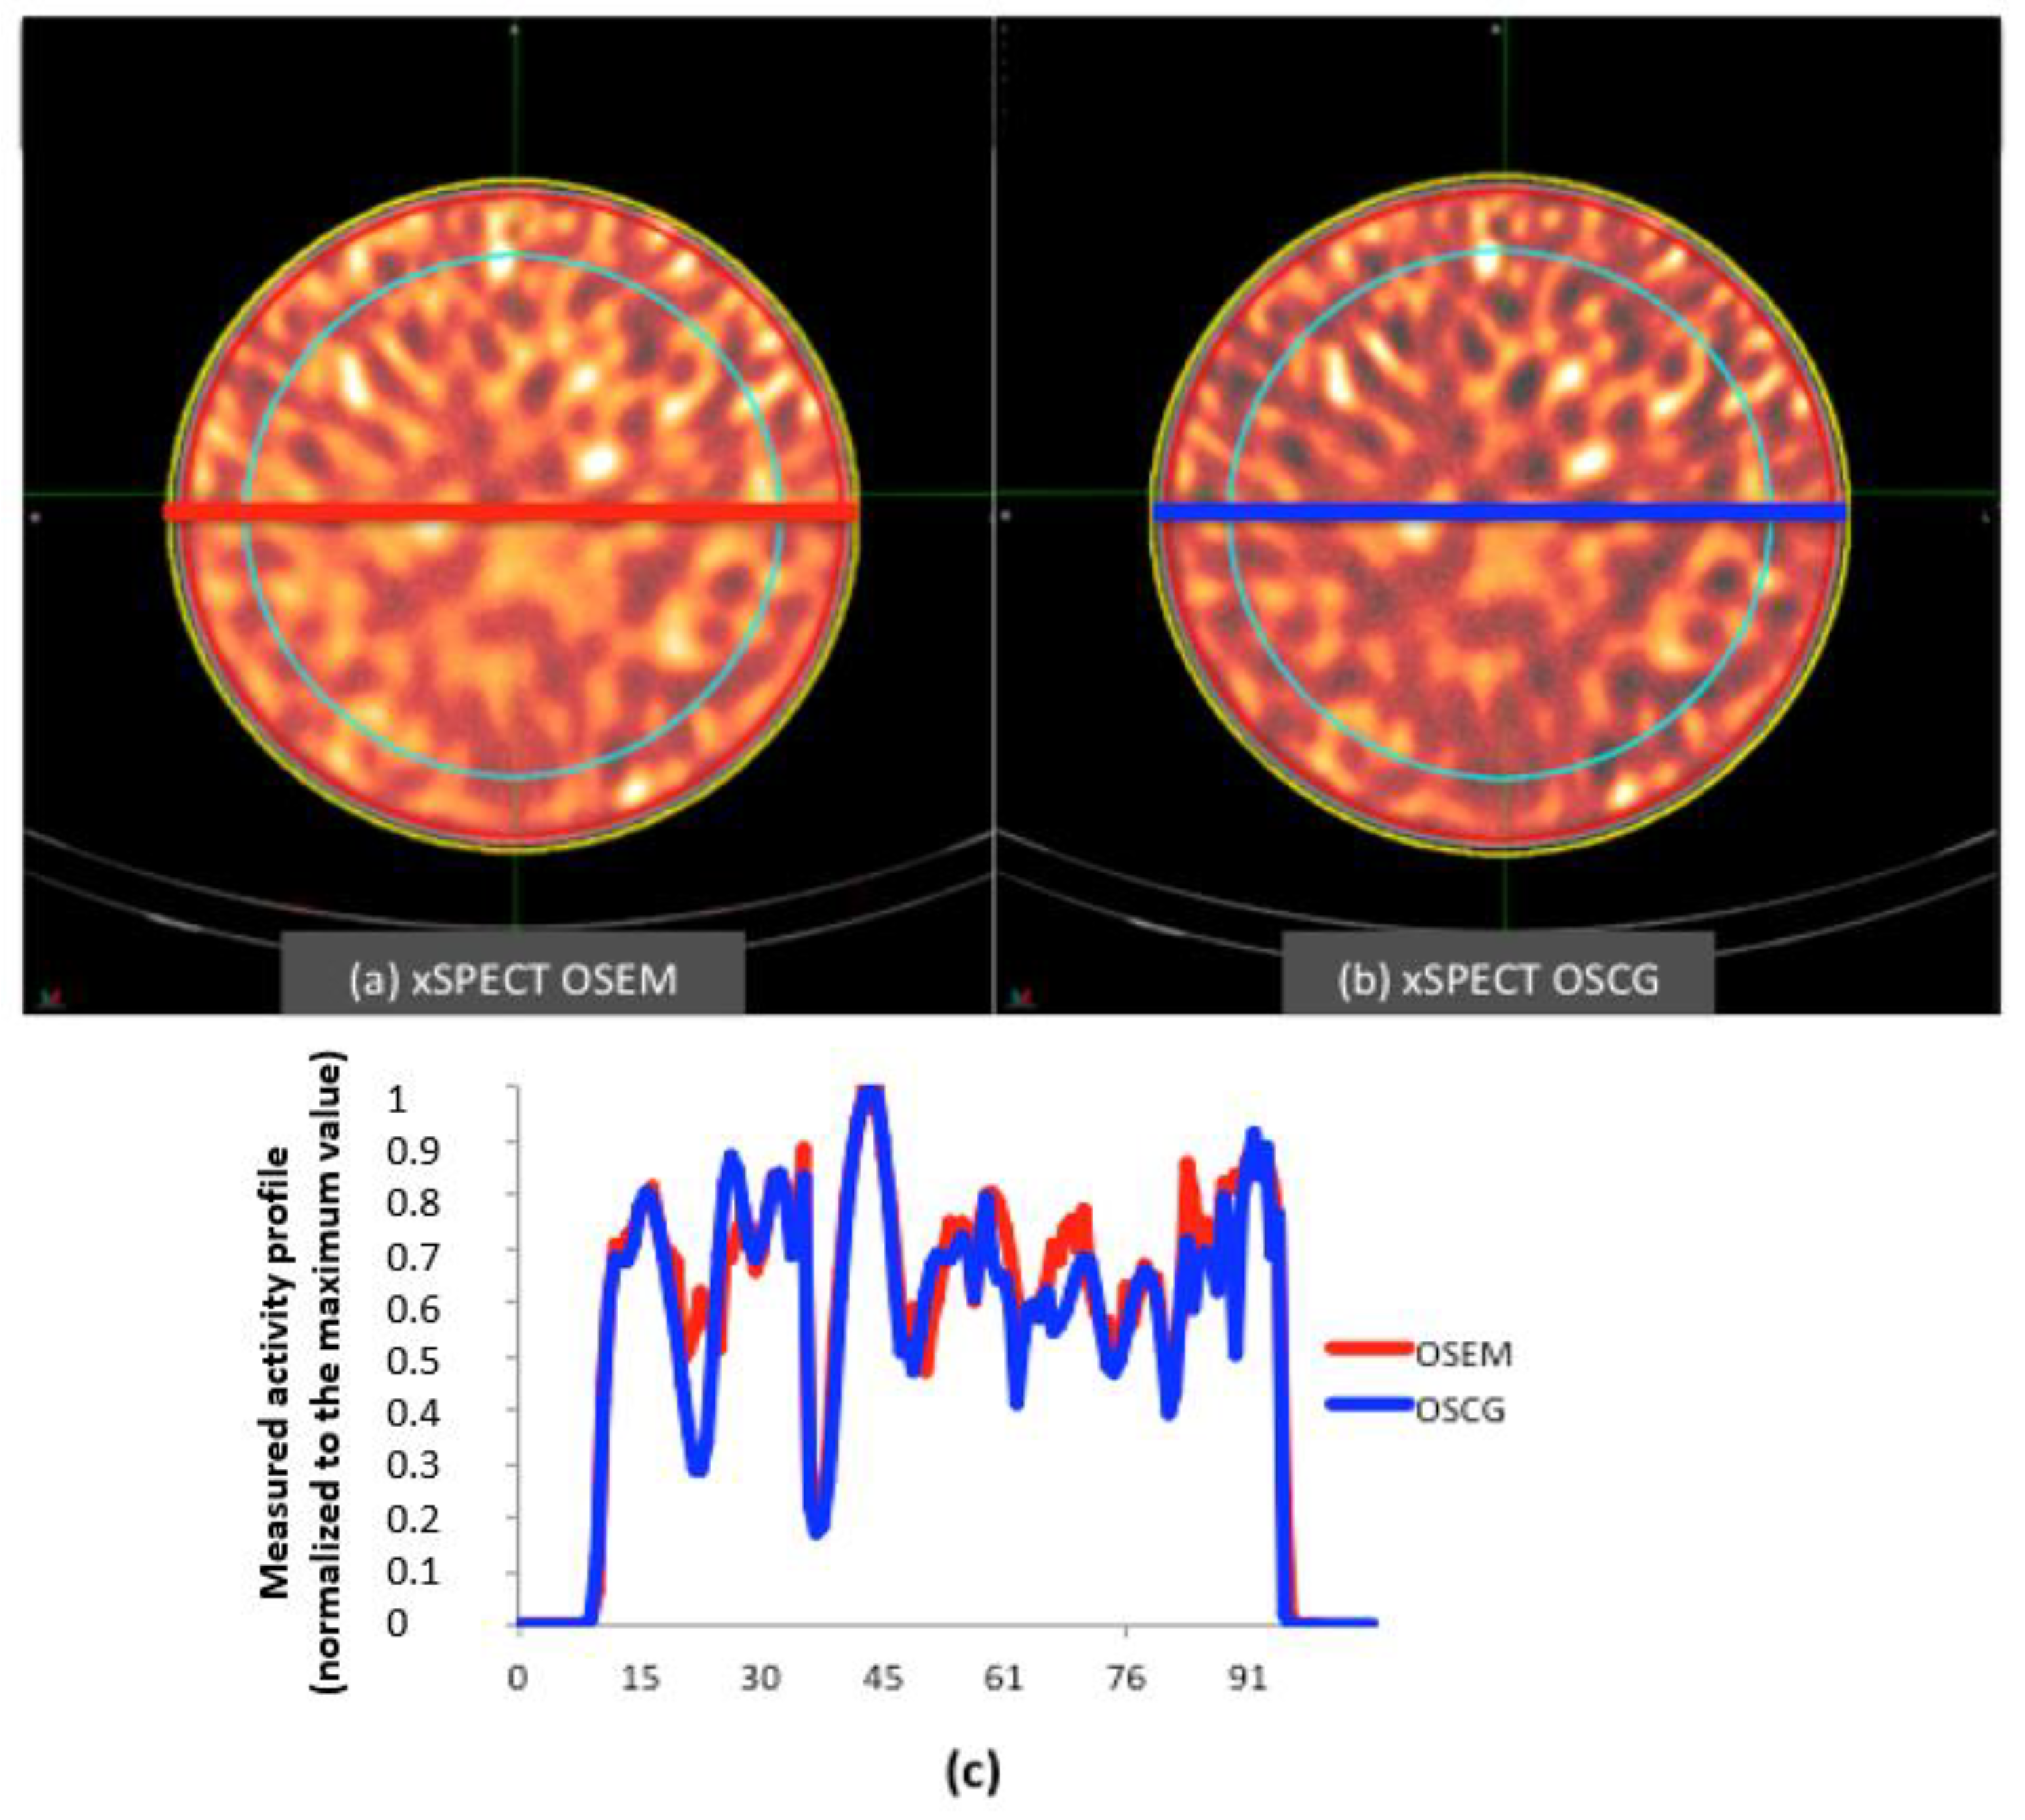
2.2. Selection of Reconstruction Method Using a Cylindrical Phantom
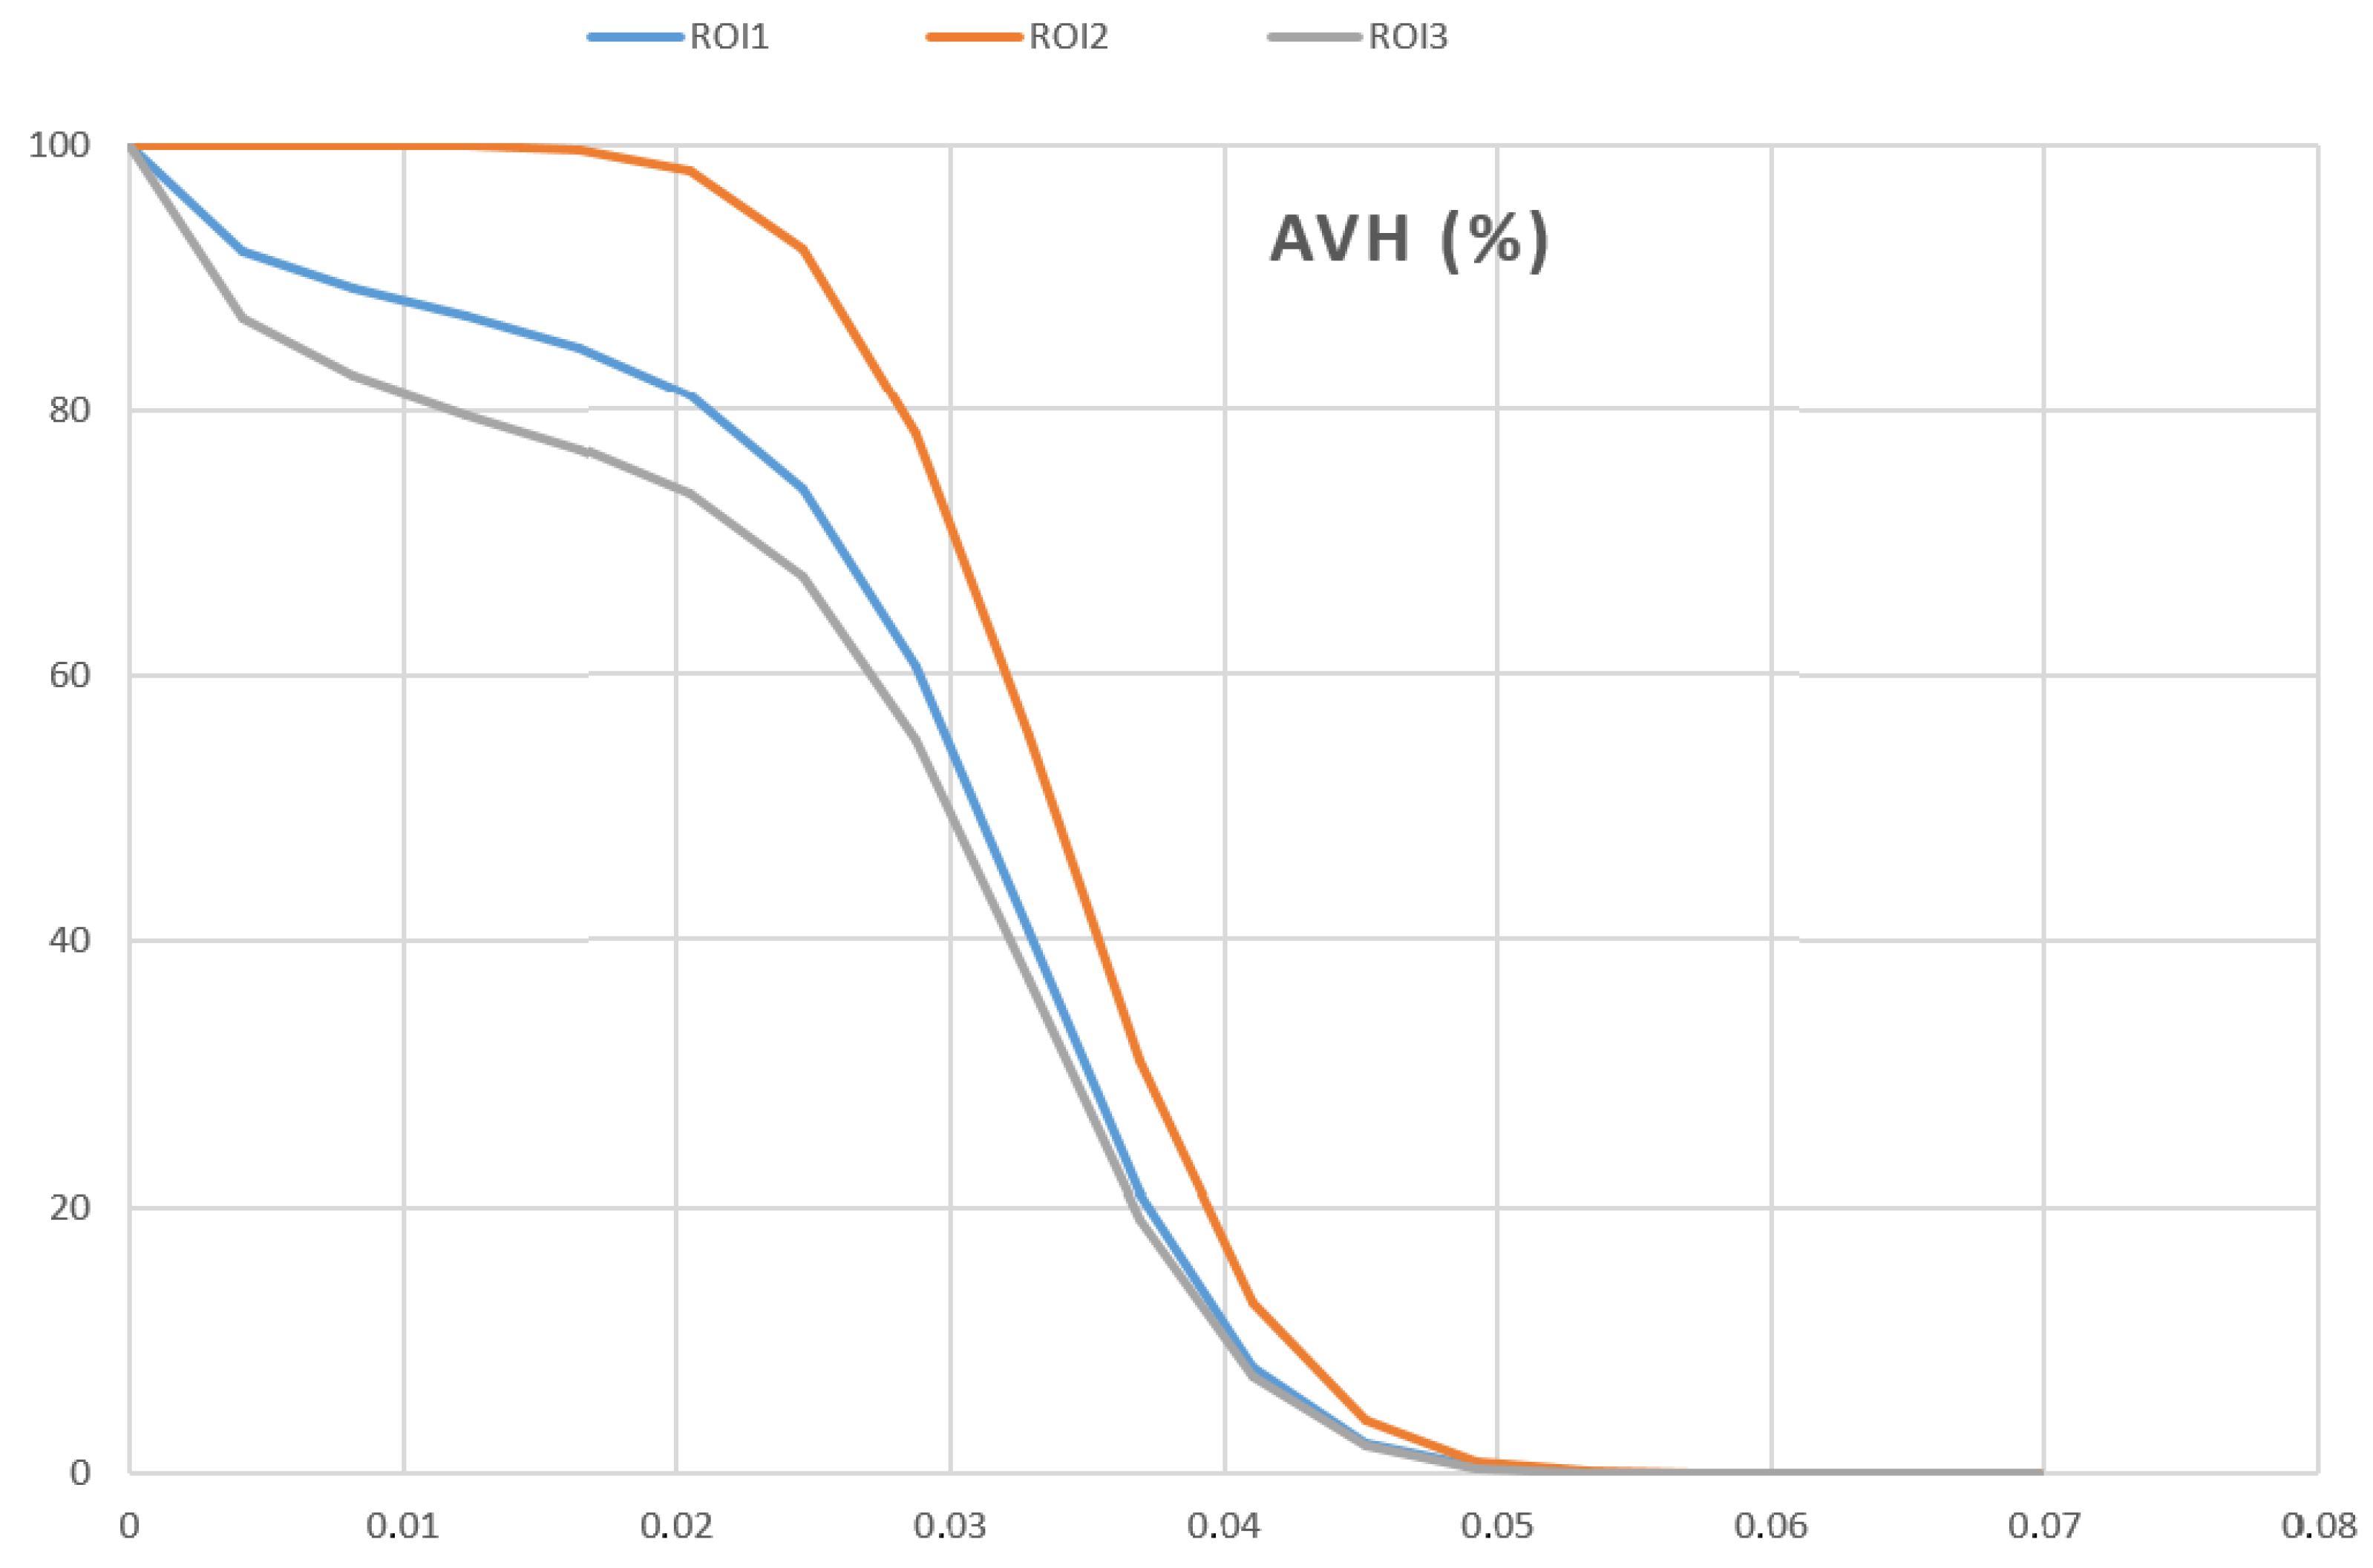
- Recovery coefficient in a uniform geometry ():
- The , representative of the image noise was evaluated according to the following formula [17]:
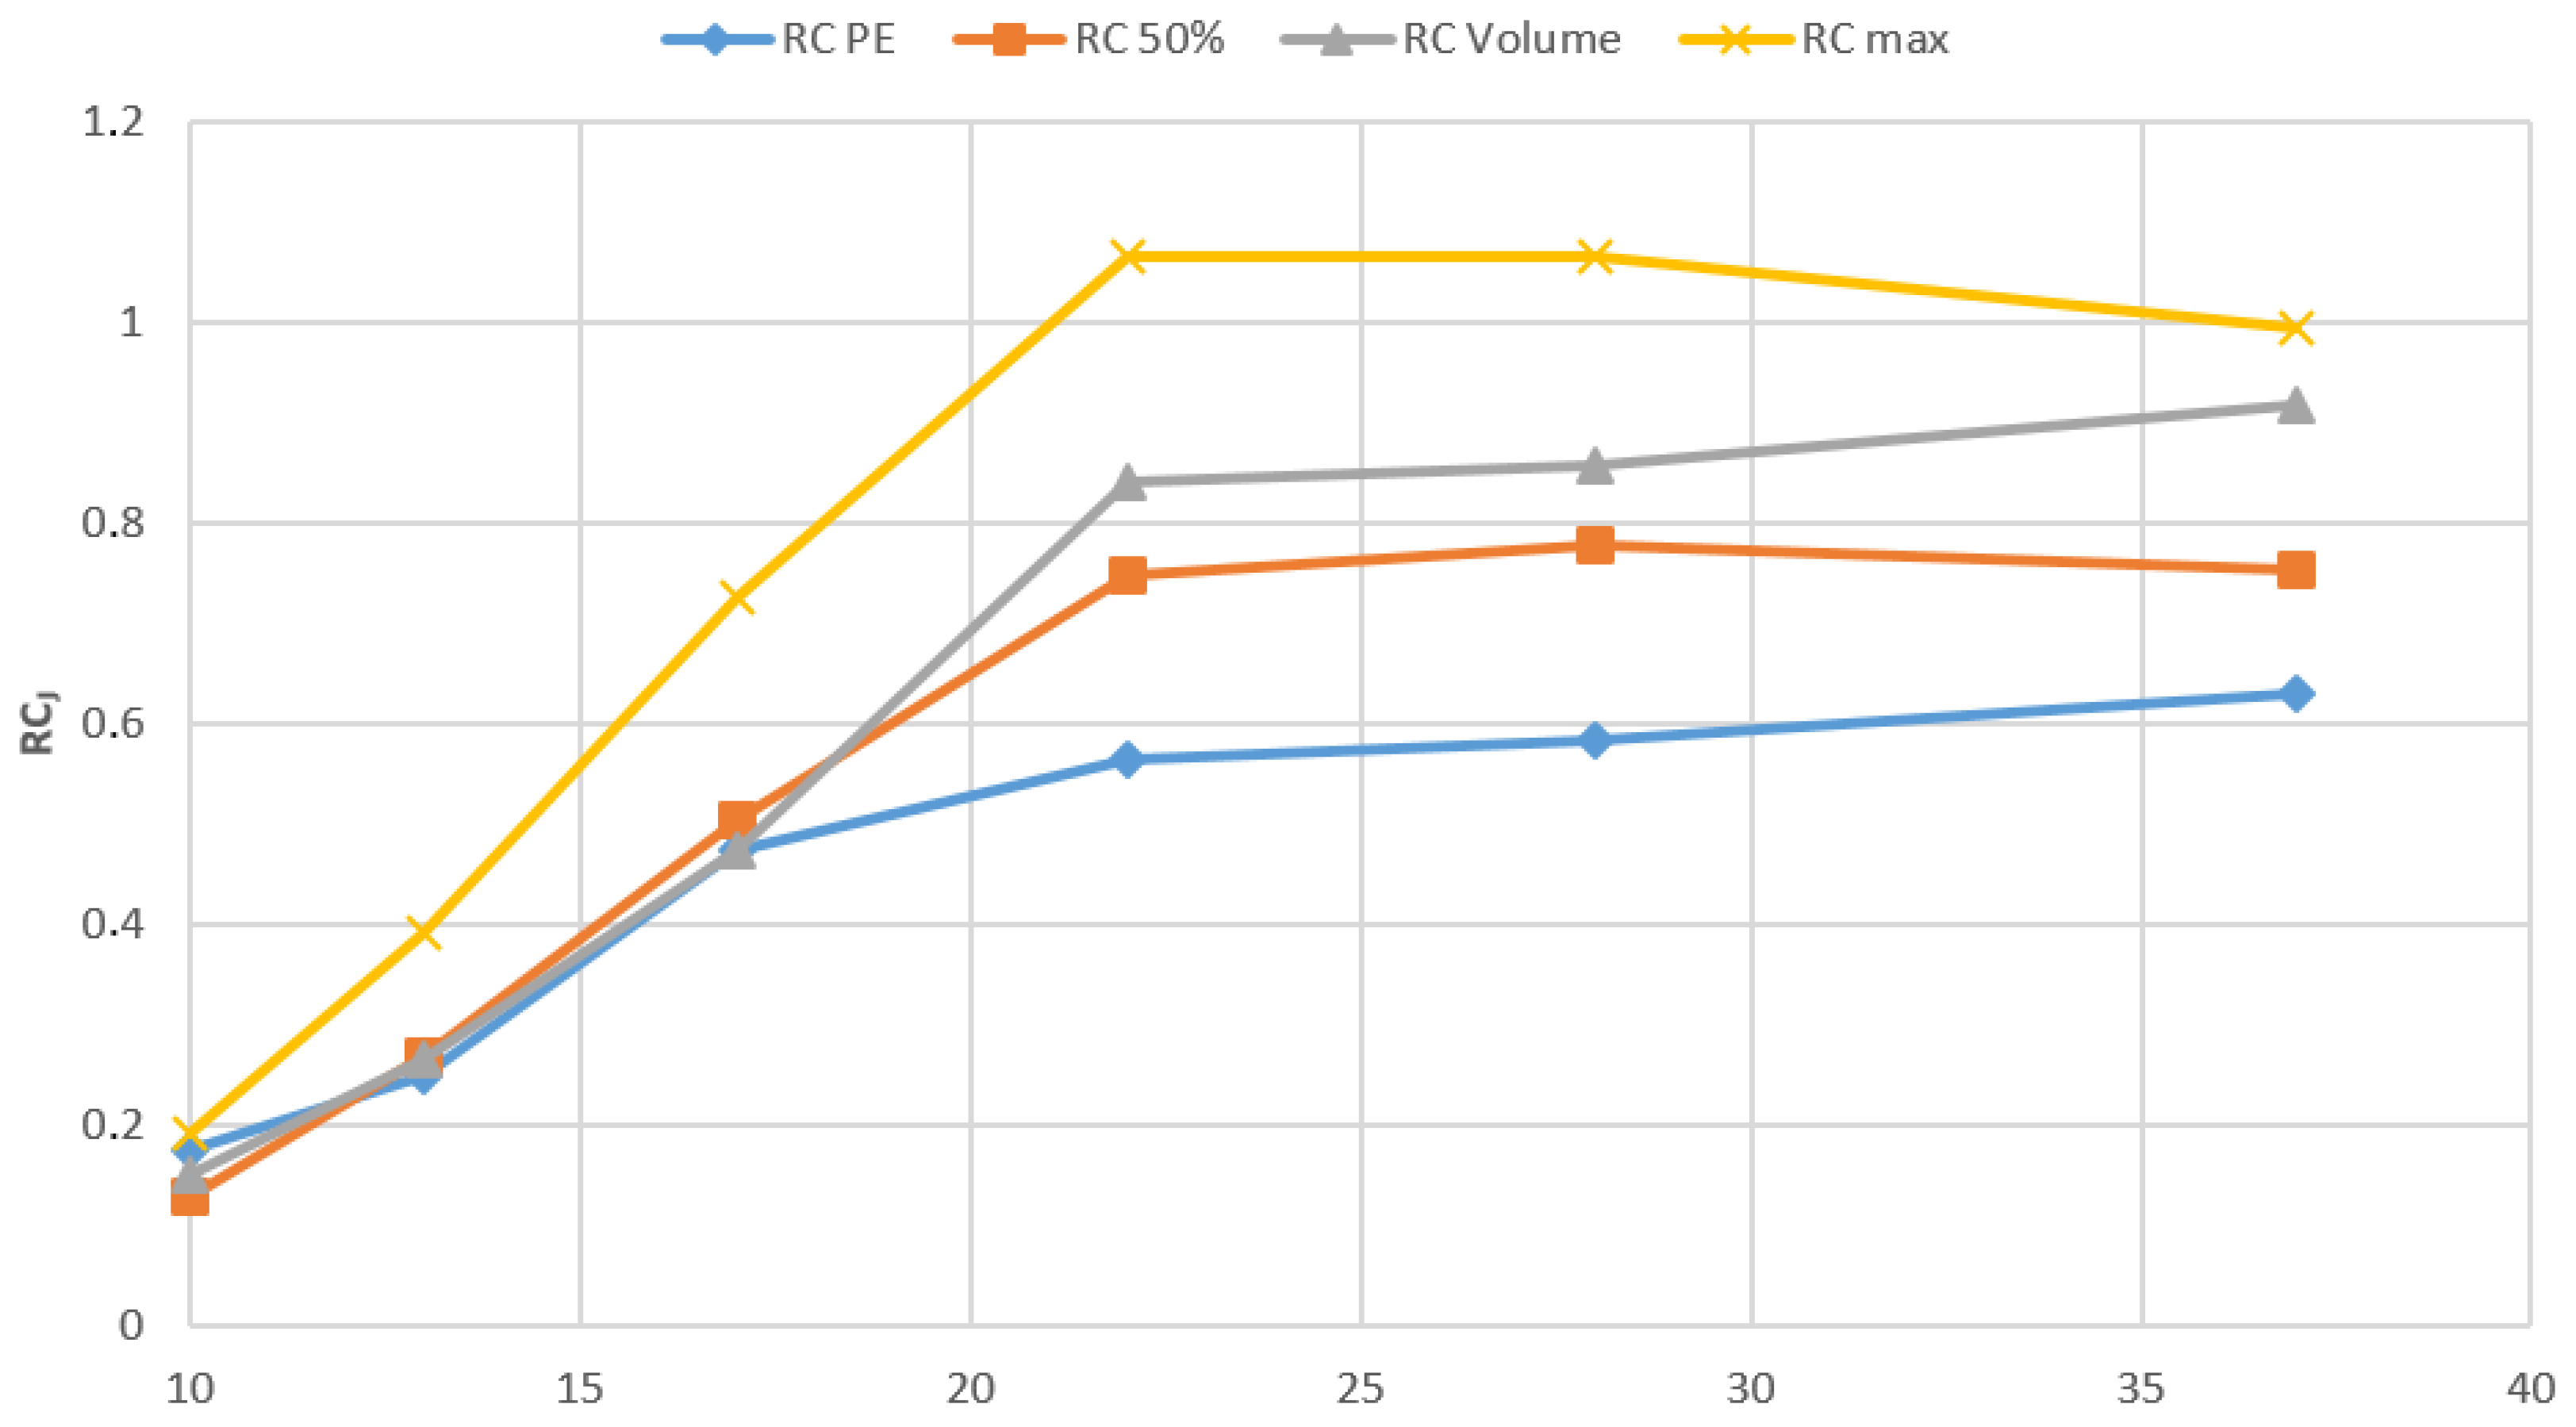
2.3. Determinations of Recovery Coefficients Using the NEMA/IEC Phantom
- is the measured maximum voxel value (in terms of activity concentration) for a given spherical insert (j = 1 to 6);
- is the average voxel value for each hot insert volume of interest (VOI) defined by a 3D iso-contour at 50% adapted for background as recommended by the EANM Guidelines for FDG tumor PET imaging [23].
- is the average voxel values for each hot insert VOI assessed with the PET- Edge (PE) tool, a gradient-based technique that detects the steepest drop off in SUV values to create the contour boundary automatically.
- is the average voxel values for each VOI corresponding to the physical volume of each sphere. In this work we used a semi-automatic segmentation method to obtain 3D spherical contours (2D/3D brush tool) adopting the physical diameter of the inserts
2.4. Workflow Validation Using Abdo-Man
3. Results
3.1. Point Source
3.2. Homogeneous Cylindrical Phantom
3.3. NEMA/IEC Phantom
3.4. Abdo-Man Phantom
4. Discussion
4.1. Homogeneous Cylindrical Phantom
4.2. NEMA/IEC Phantom
4.3. AbdoMan Phantom
4.4. Limitations of the Study
5. Conclusions
Author Contributions
Funding
Institutional Review Board Statement
Informed Consent Statement
Data Availability Statement
Acknowledgments
Conflicts of Interest
Abbreviations
| RE | Radioembolization |
| SPECT | Single Photon Emission Computed Tomography |
| CT | Computed Tomography |
| OSEM | Ordered Subset Expectation–Maximization |
| OSCG | Ordered Subset Conjugated Gradient |
| ROI | Region of Interest |
| PET | Positron Emission Tomography |
| HCC | Hepato Cellular Carcinoma |
| MAA | Macro Aggregated Albumin |
| NEMA | National Electrical Manufacturers Association |
| IEC | International Electrotechnical Commission |
| MIM | Medical Image Merge |
| DICOM | Digital Imaging and COmmunications in Medicine |
| AAPM | American Association of Physicists in Medicine |
| MIRD | Medical Internal Radiation Dose |
| SUV | Standardized Uptake Value |
| 2D | Two Dimension |
| 3D | Three Dimension |
| LEHR | Low-Energy High-Resolution |
| NIST | National Institute of Standards and Technology |
| EANM | European Association of Nuclear Medicine |
| FDG | Fluoro-Deoxy-Glucose |
| VOI | Volume of Interest |
| MRI | Magnetic Resonance Imaging |
| PMMA | Poly Methyl Metha Acrylate |
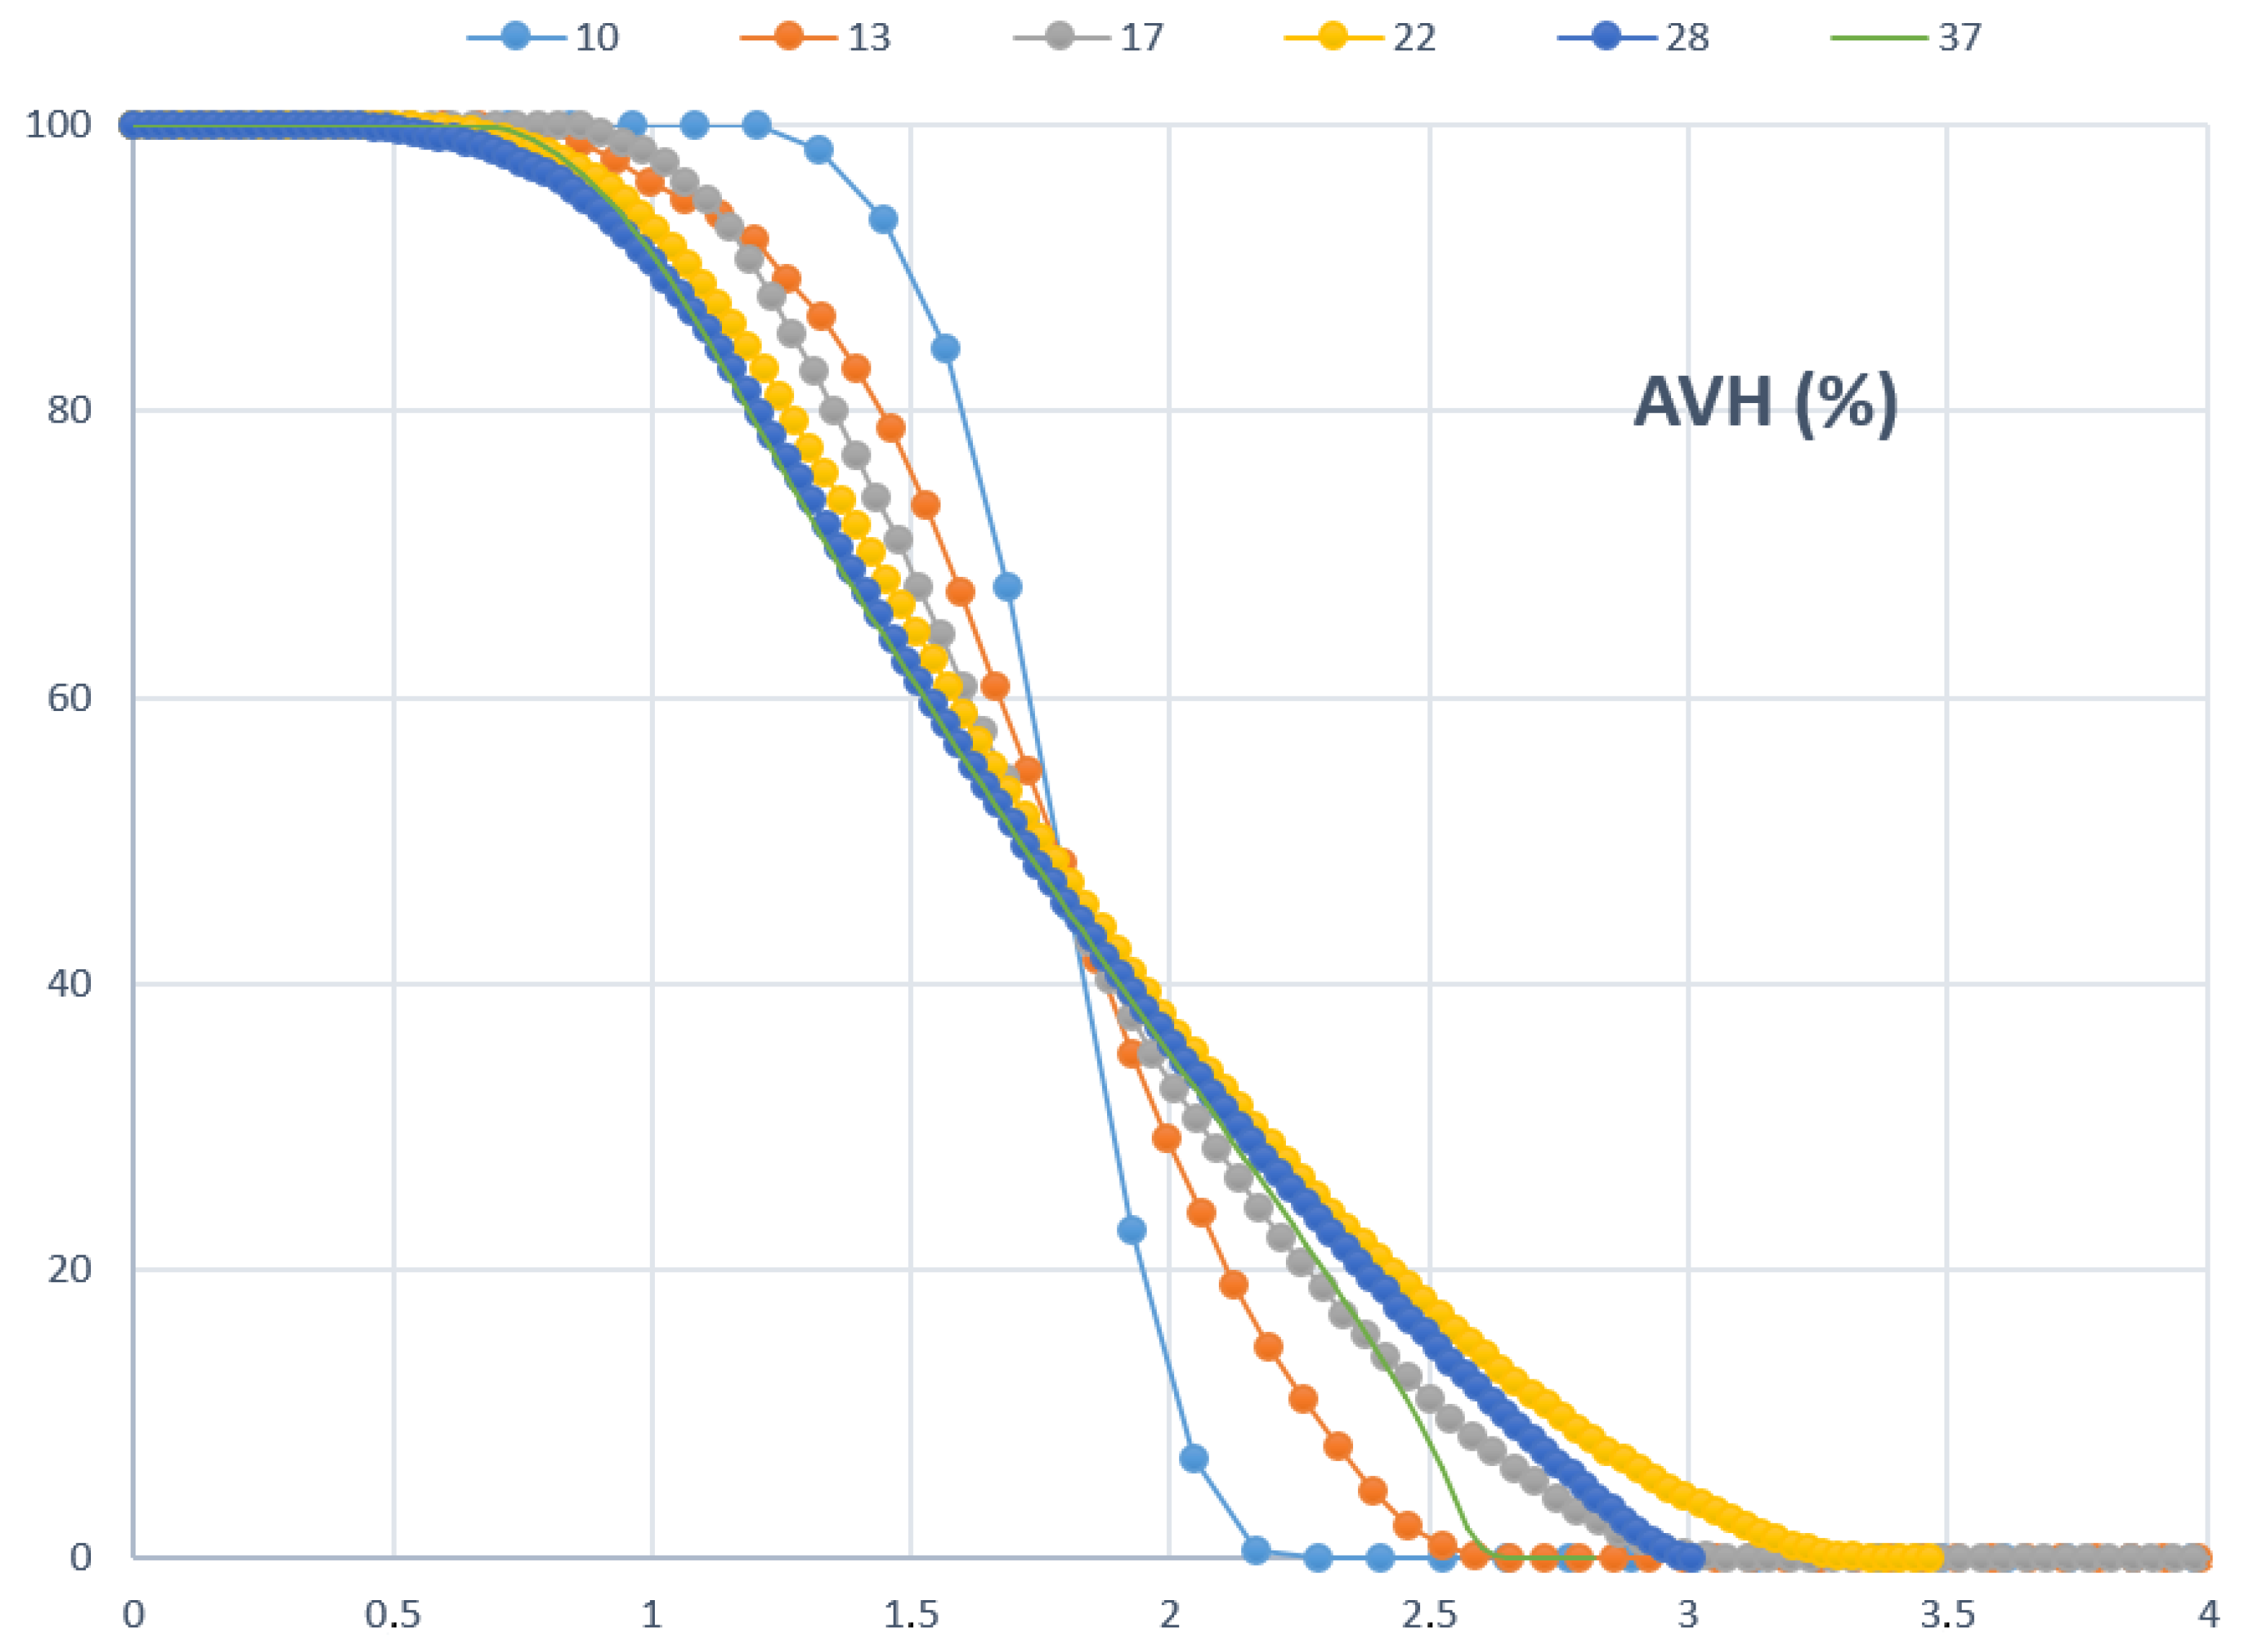
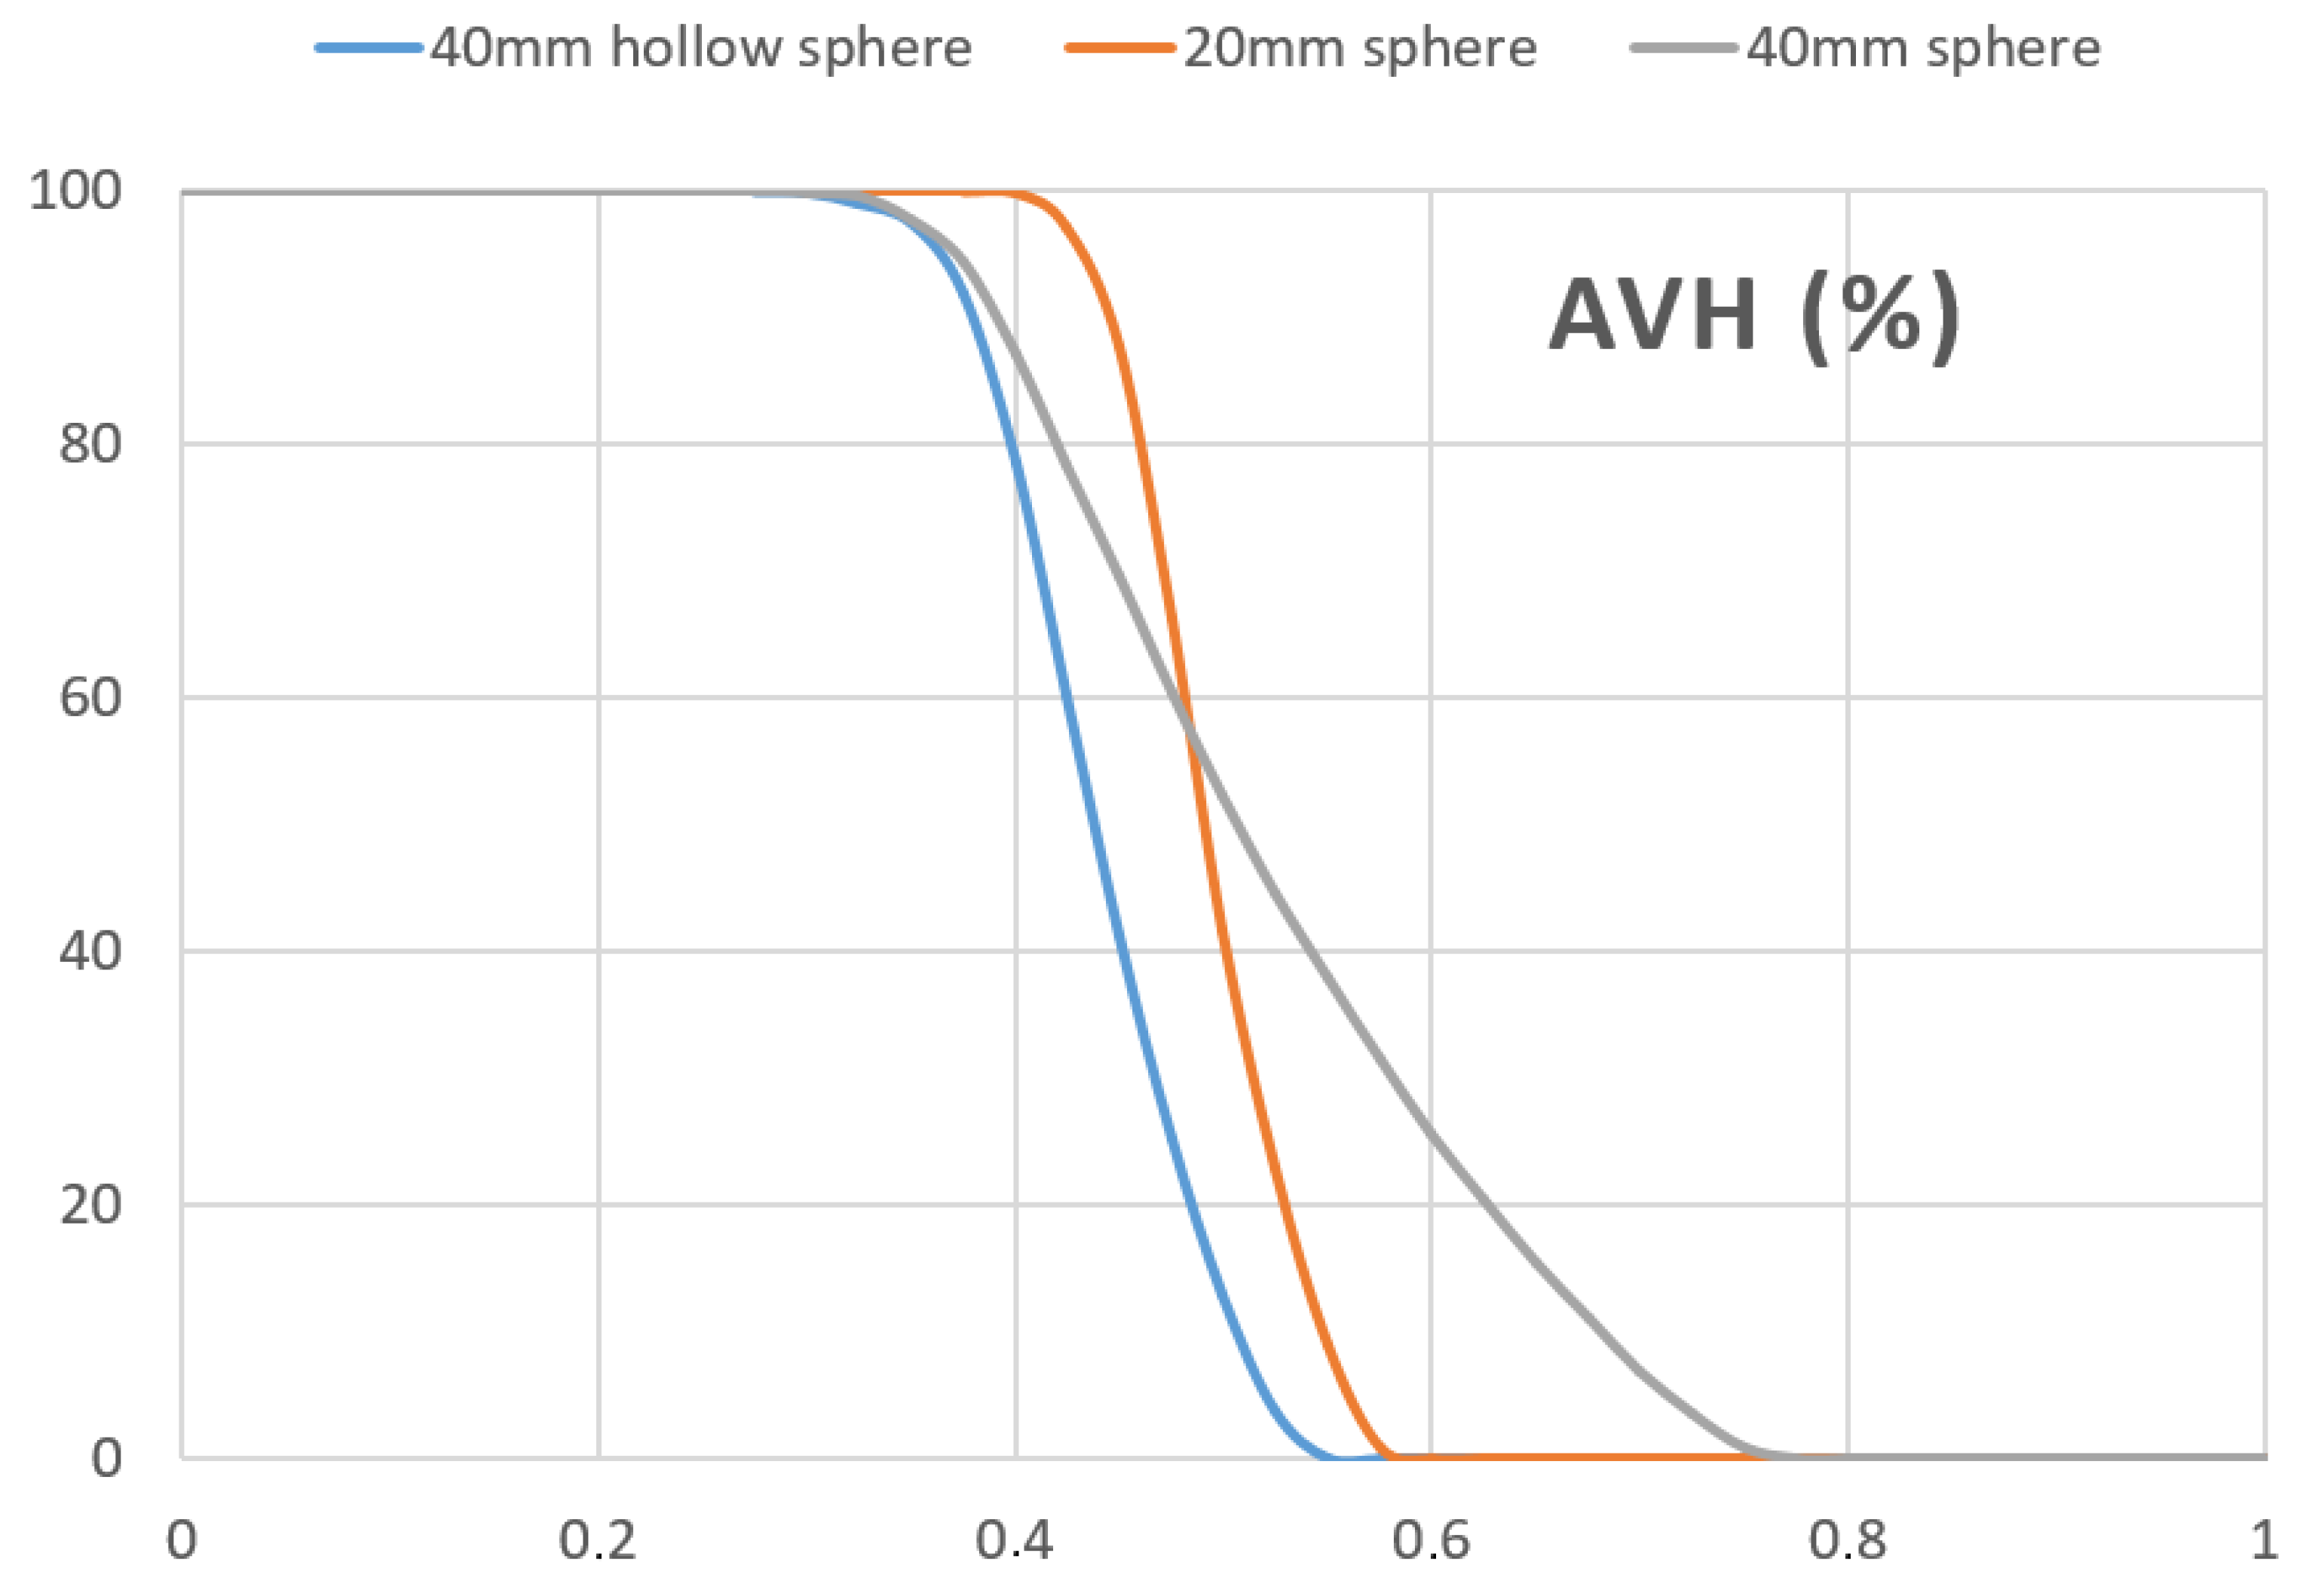
| AVHs | Activity Volume Histograms |
References
- Sung, H.; Ferlay, J.; Siegel, R.; Laversanne, M.; Soerjomataram, I.; Jemal, A.; Bray, F. Global Cancer Statistics 2020: GLOBOCAN Estimates of Incidence and Mortality Worldwide for 36 Cancers in 185 Countries. CA Cancer J. Clin. 2021, 71, 209–249. [Google Scholar] [CrossRef]
- Wong, M.; Jiang, J.; Goggins, W.; Liang, M.; Fang, Y.; Fung, F.; Leung, C.; Wang, H.; Wong, G.; Wong, V.; et al. International incidence and mortality trends of liver cancer: A global profile. Sci. Rep. 2017, 7, 45846. [Google Scholar] [CrossRef]
- Soerjomataram, I.; Lortet-Tieulent, J.; Parkin, D.; Ferlay, J.; Mathers, C.; Forman, D.; Bray, F. Global burden of cancer in 2008: A systematic analysis of disability-adjusted life-years in 12 world regions. Lancet 2012, 380, 1840–1850. [Google Scholar] [CrossRef]
- Altekruse, S.; McGlynn, K.; Reichman, M. Hepatocellular Carcinoma Incidence, Mortality, and Survival Trends in the United States From 1975 to 2005. J. Clin. Oncol. 2009, 27, 1485–1491. [Google Scholar] [CrossRef]
- Khan, S.; Davidson, B.; Goldin, R.; Heaton, N.; Karani, J.; Pereira, S.; Rosenberg, W.; Tait, P.; Taylor-Robinson, S.; Thillainayagam, A.; et al. Guidelines for the diagnosis and treatment of cholangiocarcinoma: An update. Gut 2012, 61, 1657–1669. [Google Scholar] [CrossRef]
- Kennedy, A.; Nutting, C.; Coldwell, D.; Gaiser, J.; Drachenberg, C. Pathologic response and microdosimetry of 90Y microspheres in man: Review of four explanted whole livers. Int. J. Radiat. Oncol. Biol. Phys. 2004, 60, 1552–1563. [Google Scholar] [CrossRef]
- Sato, K.; Lewandowski, R.; Bui, J.; Omary, R.; Hunter, R.; Kulik, L.; Mulcahy, M.; Liu, D.; Chrisman, H.; Resnick, S.; et al. Treatment of Unresectable Primary and Metastatic Liver Cancer with Yttrium-90 Microspheres (TheraSphere®): Assessment of Hepatic Arterial Embolization. CardioVascular Interv. Radiol. 2006, 29, 522–529. [Google Scholar] [CrossRef]
- Srinivas, S.; Shrikanthan, S.; Yu, N.; Kost, S.; Gurajala, R.; Karuppasamy, K. Treatment planning part II: Procedure simulation and prognostication. In Handbook of Radioembolization: Physics, Biology, Nuclear Medicine, and Imaging; Pasciak, A., McKinney, J., Bradley, Y., Eds.; CRC Press/Taylor & Francis: Boca Raton, FL, USA, 2017. [Google Scholar]
- Gulec, S.; Mesoloras, G.; Stabin, M. Dosimetric techniques in 90Y-microsphere therapy of liver cancer: The MIRD equations for dose calculations. J. Nucl. Med. 2006, 47, 1209–1211. [Google Scholar]
- Ho, S.; Lau, W.; Leung, T.; Chan, M.; Ngar, Y.; Johnson, P.; Li, A. Partition model for estimating radiation doses from yttrium-90 microspheres in treating hepatic tumours. Eur. J. Nucl. Med. 1996, 23, 947–952. [Google Scholar] [CrossRef]
- Pasciak, A.; Bourgeois, A.; Bradley, Y. A Comparison of Techniques for 90Y PET/CT Image-Based Dosimetry Following Radioembolization with Resin Microspheres. Front. Oncol. 2014, 4, 121. [Google Scholar] [CrossRef]
- D’Arienzo, M.; Pimpinella, M.; Capogni, M.; De Coste, V.; Filippi, L.; Spezi, E.; Patterson, N.; Mariotti, F.; Ferrari, P.; Chiaramida, P.; et al. Phantom validation of quantitative Y-90 PET/CT-based dosimetry in liver radioembolization. EJNMMI Res. 2017, 7, 94. [Google Scholar] [CrossRef]
- Kao, Y.; Hock Tan, A.; Burgmans, M.; Irani, F.; Khoo, L.; Gong Lo, R.; Tay, K.; Tan, B.; Hoe Chow, P.; Eng Ng, D.; et al. Image-Guided Personalized Predictive Dosimetry by Artery-Specific SPECT/CT Partition Modeling for Safe and Effective 90Y Radioembolization. J. Nucl. Med. 2012, 53, 559–566. [Google Scholar] [CrossRef]
- Garin, E.; Rolland, Y.; Lenoir, L.; Pracht, M.; Mesbah, H.; Porée, P.; Laffont, S.; Clement, B.; Raoul, J.; Boucher, E. Utility of Quantitative 99mTc-MAA SPECT/CT for 90yttrium-Labelled Microsphere Treatment Planning: Calculating Vascularized Hepatic Volume and Dosimetric Approach. Int. J. Mol. Imaging 2011, 398051. [Google Scholar] [CrossRef]
- Gear, J.; Cummings, C.; Craig, A.; Divoli, A.; Long, C.; Tapner, M.; Flux, G. Abdo-Man: A 3D-printed anthropomorphic phantom for validating quantitative SIRT. EJNMMI Phys. 2016, 3, 17. [Google Scholar] [CrossRef]
- D’Arienzo, M.; Cazzato, M.; Cozzella, M.; Cox, M.; D’Andrea, M.; Fazio, A.; Fenwick, A.; Iaccarino, G.; Johansson, L.; Strigari, L.; et al. Gamma camera calibration and validation for quantitative SPECT imaging with 177Lu. Appl. Radiat. Isot. 2016, 112, 156–164. [Google Scholar] [CrossRef]
- Gnesin, S.; Leite Ferreira, P.; Malterre, J.; Laub, P.; Prior, J.; Verdun, F. Phantom Validation of Tc-99m Absolute Quantification in a SPECT/CT Commercial Device. Comput. Math. Methods Med. 2016, 4360371. [Google Scholar] [CrossRef]
- American Association of Physicists in Medicine. The Selection, Use, Calibration, and Quality Assurance of Radionuclide Calibrators Used in Nuclear Medicine; Report of AAPM Task Group 181; AAPM: College Park, MD, USA, 2012. [Google Scholar]
- Zhao, W.; Esquinas, P.; Hou, X.; Uribe, C.; Gonzalez, M.; Beauregard, J.; Dewaraja, Y.; Celler, A. Determination of gamma camera calibration factors for quantitation of therapeutic radioisotopes. EJNMMI Phys. 2018, 5, 8. [Google Scholar]
- Armstrong, I.; Hoffmann, S. Activity concentration measurements using a conjugate gradient (Siemens xSPECT) reconstruction algorithm in SPECT/CT. Nucl. Med. Commun. 2016, 37, 1212–1217. [Google Scholar] [CrossRef]
- D’Arienzo, M.; Cozzella, M.; Fazio, A.; Cazzato, M.; Ungania, S.; Iaccarino, G.; D’Andrea, M.; Schmidt, K.; Kimiaei, S.; Strigari, L. Quantitative 177Lu SPECT imaging using advanced correction algorithms in non-reference geometry. Phys. Med. 2016, 32, 1745–1752. [Google Scholar] [CrossRef]
- Iida, H.; Eberl, S.; Kim, K.; Tamura, Y.; Ono, Y.; Nakazawa, M.; Sohlberg, A.; Zeniya, T.; Hayashi, T.; Watabe, H. Absolute quantitation of myocardial blood flow with 201Tl and dynamic SPECT in canine: Optimisation and validation of kinetic modelling. Eur. J. Nucl. Med. Mol. Imaging 2008, 35, 896–905. [Google Scholar] [CrossRef]
- Boellaard, R.; Delgado-Bolton, R.; Oyen, W.; Giammarile, F.; Tatsch, K.; Eschner, W.; Verzijlbergen, F.; Barrington, S.; Pike, L.; Weber, W.; et al. FDG PET/CT: EANM procedure guidelines for tumour imaging: Version 2.0. Eur. J. Nucl. Med. Mol. Imaging 2014, 42, 328–354. [Google Scholar] [CrossRef] [PubMed]
- Garin, E.; Tselikas, L.; Guiu, B.; Chalaye, J.; Edeline, J.; de Baere, T.; Assenat, E.; Tacher, V.; Robert, C.; Terroir-Cassou-Mounat, M.; et al. Personalised versus standard dosimetry approach of selective internal radiation therapy in patients with locally advanced hepatocellular carcinoma (DOSISPHERE-01): A randomised, multicentre, open-label phase 2 trial. Lancet Gastroenterol. Hepatol. 2021, 6, 17–29. [Google Scholar] [CrossRef]
- Levillain, H.; Duran Derijckere, I.; Ameye, L.; Guiot, T.; Braat, A.; Meyer, C.; Vanderlinden, B.; Reynaert, N.; Hendlisz, A.; Lam, M.; et al. Personalised radioembolization improves outcomes in refractory intra-hepatic cholangiocarcinoma: A multicenter study. Eur. J. Nucl. Med. Mol. Imaging 2019, 46, 2270–2279. [Google Scholar] [CrossRef]
- Gholami, Y.; Willowson, K.; Bailey, D. Towards personalised dosimetry in patients with liver malignancy treated with 90Y-SIRT using in vivo-driven radiobiological parameters. EJNMMI Phys. 2022, 9, 49. [Google Scholar] [CrossRef] [PubMed]
- Willowson, K.; Eslick, E.; Bailey, D. Individualised dosimetry and safety of SIRT for intrahepatic cholangiocarcinoma. EJNMMI Phys. 2021, 8, 65. [Google Scholar] [CrossRef] [PubMed]
- Sciuto, R.; Rea, S.; Pizzi, G.; Vallati, G.E.; Strigari, L. Radioembolization of Hepatic Metastases with 90Y-Microspheres: Indications and Procedure. In Clinical Applications of Nuclear Medicine Targeted Therapy; Bombardieri, E., Seregni, E., Evangelista, L., Chiesa, C., Chiti, A., Eds.; Springer: Cham, Switzerland, 2018. [Google Scholar]
- Läppchen, T.; Meier, L.; Fürstner, M.; Prenosil, G.; Krause, T.; Rominger, A.; Klaeser, B.; Hentschel, M. 3D printing of radioactive phantoms for nuclear medicine imaging. EJNMMI Phys. 2020, 7, 22. [Google Scholar] [CrossRef] [PubMed]
- Gillett, D.; Marsden, D.; Ballout, S.; Attili, B.; Bird, N.; Heard, S.; Gurnell, M.; Mendichovszky, I.; Aloj, L. 3D printing 18F radioactive phantoms for PET imaging. EJNMMI Phys. 2021, 8, 38. [Google Scholar] [CrossRef]


| Software | Algorithm | Parameters |
|---|---|---|
| xSPECT | OSEM | 8 iterations, 4 subsets, no filters |
| OSCG | 24 iterations, 2 subsets, 2.5 mm Gaussian filter |
| ROIs | (MBq/mL) | (MBq/mL) | (MBq/mL) | RCug | COV(%) |
|---|---|---|---|---|---|
| ROI 1 | 0.030 (±5%) | 0.0301 | 0.007 | 1.00 | 23% |
| ROI 2 | 0.030 (±5%) | 0.0305 | 0.007 | 1.02 | 22% |
| ROI 3 | 0.030 (±5%) | 0.0278 | 0.010 | 0.93 | 36% |
| ID | Abdo-Man | (MBq/mL) | (MBq/mL) | (%) |
|---|---|---|---|---|
| Liver | Liver | 0.103 (±5%) | 0.104 | +1.17% |
| S40 | 40 mm sphere | 0.517 (±5%) | 0.509 | −1.51% |
| S20 | 20 mm sphere | 0.517 (±5%) | 0.537 | +3.87% |
| S9 | 40 mm hollow sphere | 0.517 (±5%) | 0.387 | −25.18% |
Publisher’s Note: MDPI stays neutral with regard to jurisdictional claims in published maps and institutional affiliations. |
© 2022 by the authors. Licensee MDPI, Basel, Switzerland. This article is an open access article distributed under the terms and conditions of the Creative Commons Attribution (CC BY) license (https://creativecommons.org/licenses/by/4.0/).
Share and Cite
Ungania, S.; D’Arienzo, M.; Nocentini, S.; D’Andrea, M.; Bruzzaniti, V.; Marconi, R.; Mezzenga, E.; Cassano, B.; Infusino, E.; Guerrisi, A.; et al. Optimization of 99mTc-MAA SPECT/CT Imaging for 90Y Radioembolization Using a 3D-Printed Phantom. Appl. Sci. 2022, 12, 10022. https://doi.org/10.3390/app121910022
Ungania S, D’Arienzo M, Nocentini S, D’Andrea M, Bruzzaniti V, Marconi R, Mezzenga E, Cassano B, Infusino E, Guerrisi A, et al. Optimization of 99mTc-MAA SPECT/CT Imaging for 90Y Radioembolization Using a 3D-Printed Phantom. Applied Sciences. 2022; 12(19):10022. https://doi.org/10.3390/app121910022
Chicago/Turabian StyleUngania, Sara, Marco D’Arienzo, Sandro Nocentini, Marco D’Andrea, Vicente Bruzzaniti, Raffaella Marconi, Emilio Mezzenga, Bartolomeo Cassano, Erminia Infusino, Antonino Guerrisi, and et al. 2022. "Optimization of 99mTc-MAA SPECT/CT Imaging for 90Y Radioembolization Using a 3D-Printed Phantom" Applied Sciences 12, no. 19: 10022. https://doi.org/10.3390/app121910022
APA StyleUngania, S., D’Arienzo, M., Nocentini, S., D’Andrea, M., Bruzzaniti, V., Marconi, R., Mezzenga, E., Cassano, B., Infusino, E., Guerrisi, A., Soriani, A., & Strigari, L. (2022). Optimization of 99mTc-MAA SPECT/CT Imaging for 90Y Radioembolization Using a 3D-Printed Phantom. Applied Sciences, 12(19), 10022. https://doi.org/10.3390/app121910022