1. Introduction
External beam radiotherapy is gradually evolving towards real-time adaptive radiotherapy (ART) [
1], which itself is being developed as a new paradigm in radiation oncology [
2]. However, ART is, at present, not standardised or widely employed [
3]. This is due, not only to the time-consuming processes of the delineation of the targets and organs at risk on the daily computed tomography (CT) images and treatment re-planning, but also to the limited quality of the daily on-board cone beam computed tomography (CBCT) images. Such limitations add practical constraints to the ability to delineate structures manually and estimate the daily delivered dose accurately, and they also contribute to the limited accuracy of the registration between the daily CBCT and planning CT images [
4]. The development of automated tools that enable high-quality ART is likely to lead to significant efficiency gains and foster wider clinical uptake [
5].
In the process of delivering automated ART solutions, a challenging task is the validation of the image registration algorithms for clinical use, as their performance depends on the complexity and quality of the images used in the registration task [
6]. In the ART workflow, the deformable vector field (DVF), which is generated during the deformable image registration (DIR), could also be applied for dose mapping and dose accumulation purposes. In this process, any uncertainty in the DVF generation would be propagated directly to the calculated dose map.
Considerable research has been done in the investigation of DIR accuracy, primarily through the creation of evaluation metrics. Multi-institutional studies have been performed to validate the use of DIR algorithms [
7,
8] and these found variations in the DIR performance among different institutions as a result of differences in the procedure, therefore, the accuracy of the DIR was found to be site-specific. A recent survey by Viergever et al. [
9] highlighted that the validation of the DIR registration is currently an urgent problem to solve.
The report of the American Association of Physicists in Medicine (AAPM) Task Group 132 (TG132) [
10] provided an essential set of guidelines for the quality assurance (QA) and quality control of the image registration operations for the overall clinical process. The TG132 report recommends a series of tests and corresponding metrics that should be evaluated and reported during the image registration software verification.
The TG132 suggests the use of a known DVF to test deformable image registration [
10]; this method is generally used with digital phantoms that consist of two image sets linked via a known DVF (ground truth). Several phantom data sets have been generated by the TG132 [
10] for use in QA programmes for this purpose. However, a few groups found an incompatibility of certain digital phantoms, provided by the TG132 report, with commercial software [
11,
12], and/or they found some of the provided phantom images were still limited in their utility. For example, only a pelvic anatomical phantom was made publicly available for DIR verification, and only a single known transformation (refDVF) was provided for test purposes [
10]. Pukala et al. [
13] reported the differences observed between 10 virtual head and neck (HN) phantoms for DIR verification over five different commercial software systems; these results emphasized the need to assess the DIR accuracy on each considered clinical DIR.
A recent (2021) UK survey [
14] highlighted that there is a need for additional guidelines, training and better tools for commissioning DIR software and the evaluation of registration results, which should include the development of recommendations on which quantitative metrics to use. Moreover, in a recent publication, the NRG Oncology medical physics subcommittee working group, composed of nine institutions, reported the limitations of commercial systems in implementing the TG132-recommended metrics [
11], due to the inconsistency of the DVF format exported from each individual commercial system with the format of the refDVF provided by the AAPM. The lack of proper Digital Imaging and Communications in Medicine (DICOM) [
15] standard definitions for this registration-type limits the direct comparison between the user-provided DVF and the gold-standard refDVF and further limits the interpretability and usability outside the original system.
Shi et al. [
16] investigated the correlation between contour-based metrics and DVF errors. They reported a moderate correlation between the contour propagation and accurate dose deformation, and the summation/accumulation within each contour. Therefore, for adaptive radiation therapy, the accurate dose deformation and summation/accumulation within each contour is determined by the DVF accuracy.
Several studies have been conducted to validate the reliability of DVF accuracy. Veiga et al. [
17,
18] tested the transformations that mapped the anatomy between the planning CT and CBCT, which were obtained using four different DIR approaches. The data from five HN patients were used to evaluate the performance of each implementation, based on geometrical matching, the physical properties of the DVFs and the similarity between the warped dose distributions. They found a variability between the different DIR algorithms used, in terms of impact on the uncertainties in the dose warping.
As reported in Paganelli et al. [
19], the main limitation of these approaches relies on the fact that a deformation field may fulfil the requirements of physical fidelity, but still differ from the underlying ground truth of the deformation, without conveying any information on the DIR uncertainties and related dose errors. Indeed, a global validation of user-obtained DVF against ground-truth DVF is considered the most accurate DIR evaluation method, yet the ground-truth DVF is not always available in a clinical setting.
This paper is focused on DIR verification for HN adaptive radiotherapy. Practical guidelines and dedicated phantoms for clinical implementation are still needed to test the accuracy of deformable image registration (DIR) in various clinical situations. The registration between the CT and CBCT image sets can be considered a multimodal registration problem. The consistency of the pixel intensity values between the two modalities is restricted because the image quality of CBCT is poorer than that of CT [
20], and CBCT images are commonly affected by artefacts due to scatter contamination and truncated CBCT patient volumes [
21].
The use of digital phantoms for CT-CBCT DIR QA is limited by the fact that the applied transformations are not patient-specific but are based on pre-defined DVFs. Furthermore, the deformed images of digital phantoms do not have any representative noise variation, inherent in the CBCT images of an actual patient [
6]. It is possible to overcome such limitations using images of a physical phantom acquired with the systems and acquisition protocols used in clinical practice. Physical phantoms do not reflect the complexity of real human anatomy, which is affected by many factors, such as the setup variation, organ motion and organ deformation. These factors contribute to the inherent differences between CT and CBCT images, even if both image sets are obtained on the same day. However, the use of a rigid anthropomorphic phantom allows the acquisition of image datasets with identical anatomy for both the CT and CBCT scans. This is the main reason for the use of physical anthropomorphic phantom images in the presented method instead of real patient images: the patient’s CT and CBCT scans are always different, due to patient organ motion and setup uncertainties. This ensures robust and reliable comparisons by providing a reference, as any discrepancies between the primary CT and CBCT images would be purely related to the performance of the DIR algorithm.
In this study, the images of a commercial anthropomorphic phantom to include common OARs as recommended by international guidelines [
22] were processed. The aim of this study was to build and test a novel workflow for the verification of patient-based DIR in HN ART, using the developed phantom images.
2. Materials and Methods
2.1. Digitally Enhanced Phantom
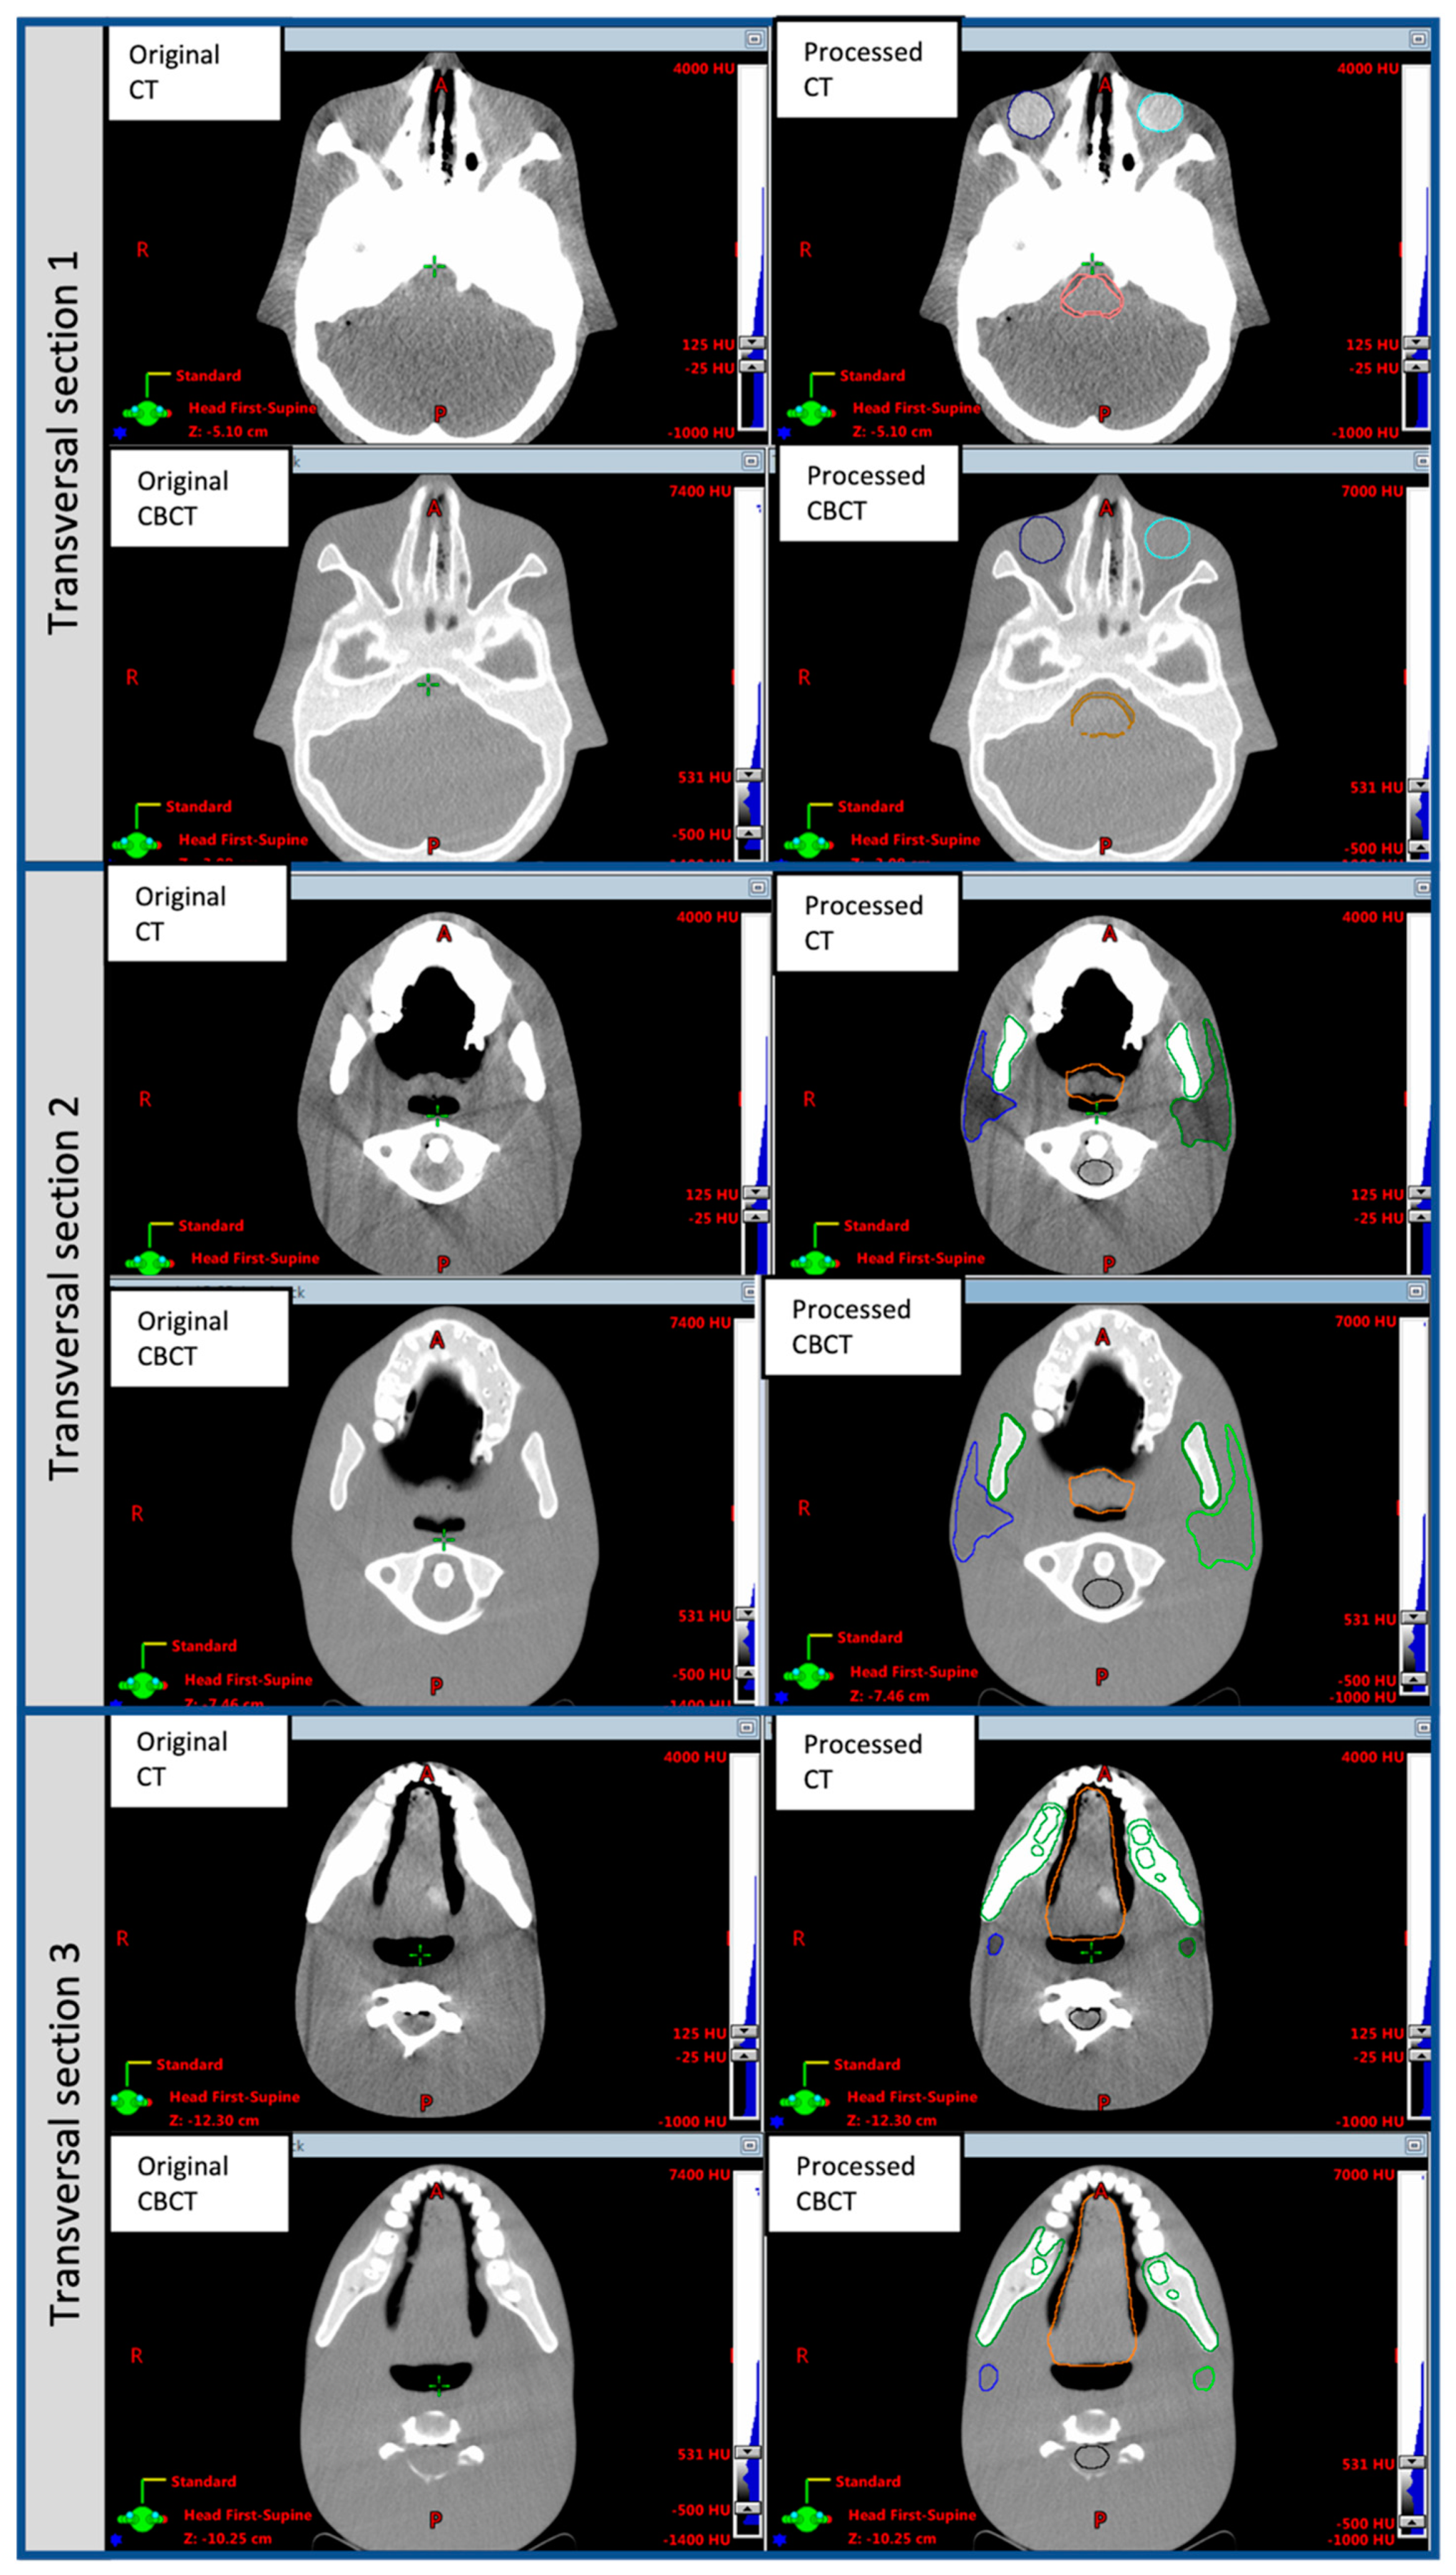
In this study, the ATOM Max Dental and Diagnostic Head Phantom Model-711 (CIRS, Norfolk, VA, USA) (HN phantom) was used. The HN phantom approximates to the average male human head in both size and structure. The original phantom includes detailed 3D anthropomorphic anatomy, such as the brain, bone, larynx, trachea, sinus, nasal cavities and teeth. The bones contain both cortical and trabecular components. The teeth include the distinct dentine, enamel and root structures, including the nerves. The sinus cavities are fully open.
The HN phantom was scanned with both CT and CBCT. The CT image datasets were acquired using a GE Hi-Speed (General Electric Company, Boston, MA, USA) scanner, with the acquisition parameters set in agreement with our clinical HN protocol (120 KV, 100 mA, 2 mm slice thickness). As a second step, the CBCT image sets were acquired on a TrueBeam STx linear accelerator (Varian Medical Systems, Palo Alto, CA, USA), using our HN image acquisition protocols (HN modality). To acquire the entire head of the phantom, a multi-scan CBCT was performed, and the data were combined using the TrueBeam STx advanced reconstruction module. For the CBCT images, the linear attenuation to the Hounsfield Unit (HU) values calibration was done using scans of the Catphan 504 phantom, following the Varian TrueBeam acceptance procedure manual [
23], by assigning the HU values from the Catphan manual to the reconstructed raw image values of the seven material inserts, followed by a linear fit.
Both the CT and CBCT image sets were post-processed to digitally insert several OARs which are not present in the original phantom, including the brainstem, oral cavity, left and right parotid glands, larynx and eyes. Firstly, a radiation oncologist (MG) drew outlines of these anatomical structures on the phantom CT and CBCT images, following international guidelines [
22], for their standard shape, anatomical position and volume.
Subsequently, the original HU values were replaced with surrogate HU values for all the above-mentioned structures, using an in-house developed script based on the MATLAB code (The Mathworks, Natick, MA, USA) and the Computational Environment for Radiological Research tool (CERR,
http://www.github.com/cerr/CERR, accessed on 20 February 2020) [
24]. The surrogate HU value in each voxel,
i, of a given organ OAR,
, was derived using the following equation:
where
and
are the mean HU values over the voxels included in a ROI belonging to a specific organ (
and the tissue around that organ (
averaged over a set of 10 real patient CT or CBCT images, respectively;
is the HU value in the original HN phantom CT or CBCT image for each voxel.
The
and
parameters were measured by taking the mean value of several (typically four) square ROIs of 10 × 10 pixels, placed in different positions inside the OAR and its surrounding tissue, to reflect the typical HU variation in real patient images. These mean values were then averaged over a set of 10 pairs of actual patient CT and CBCT images. This process was done separately for the CT and CBCT image sets (i.e., for each patient, one CT and one CBCT image were considered). Using this method, the intrinsic noise of each image type, the CT and CBCT, was maintained in the digitally modified phantom image sets. The post-processed phantom images are in the standard DICOM [
15] format, in order to be compatible with different image registration systems. In the rest of the manuscript, the phantom image set is referred to as the post-processed enhanced phantom CT.
2.2. Workflow
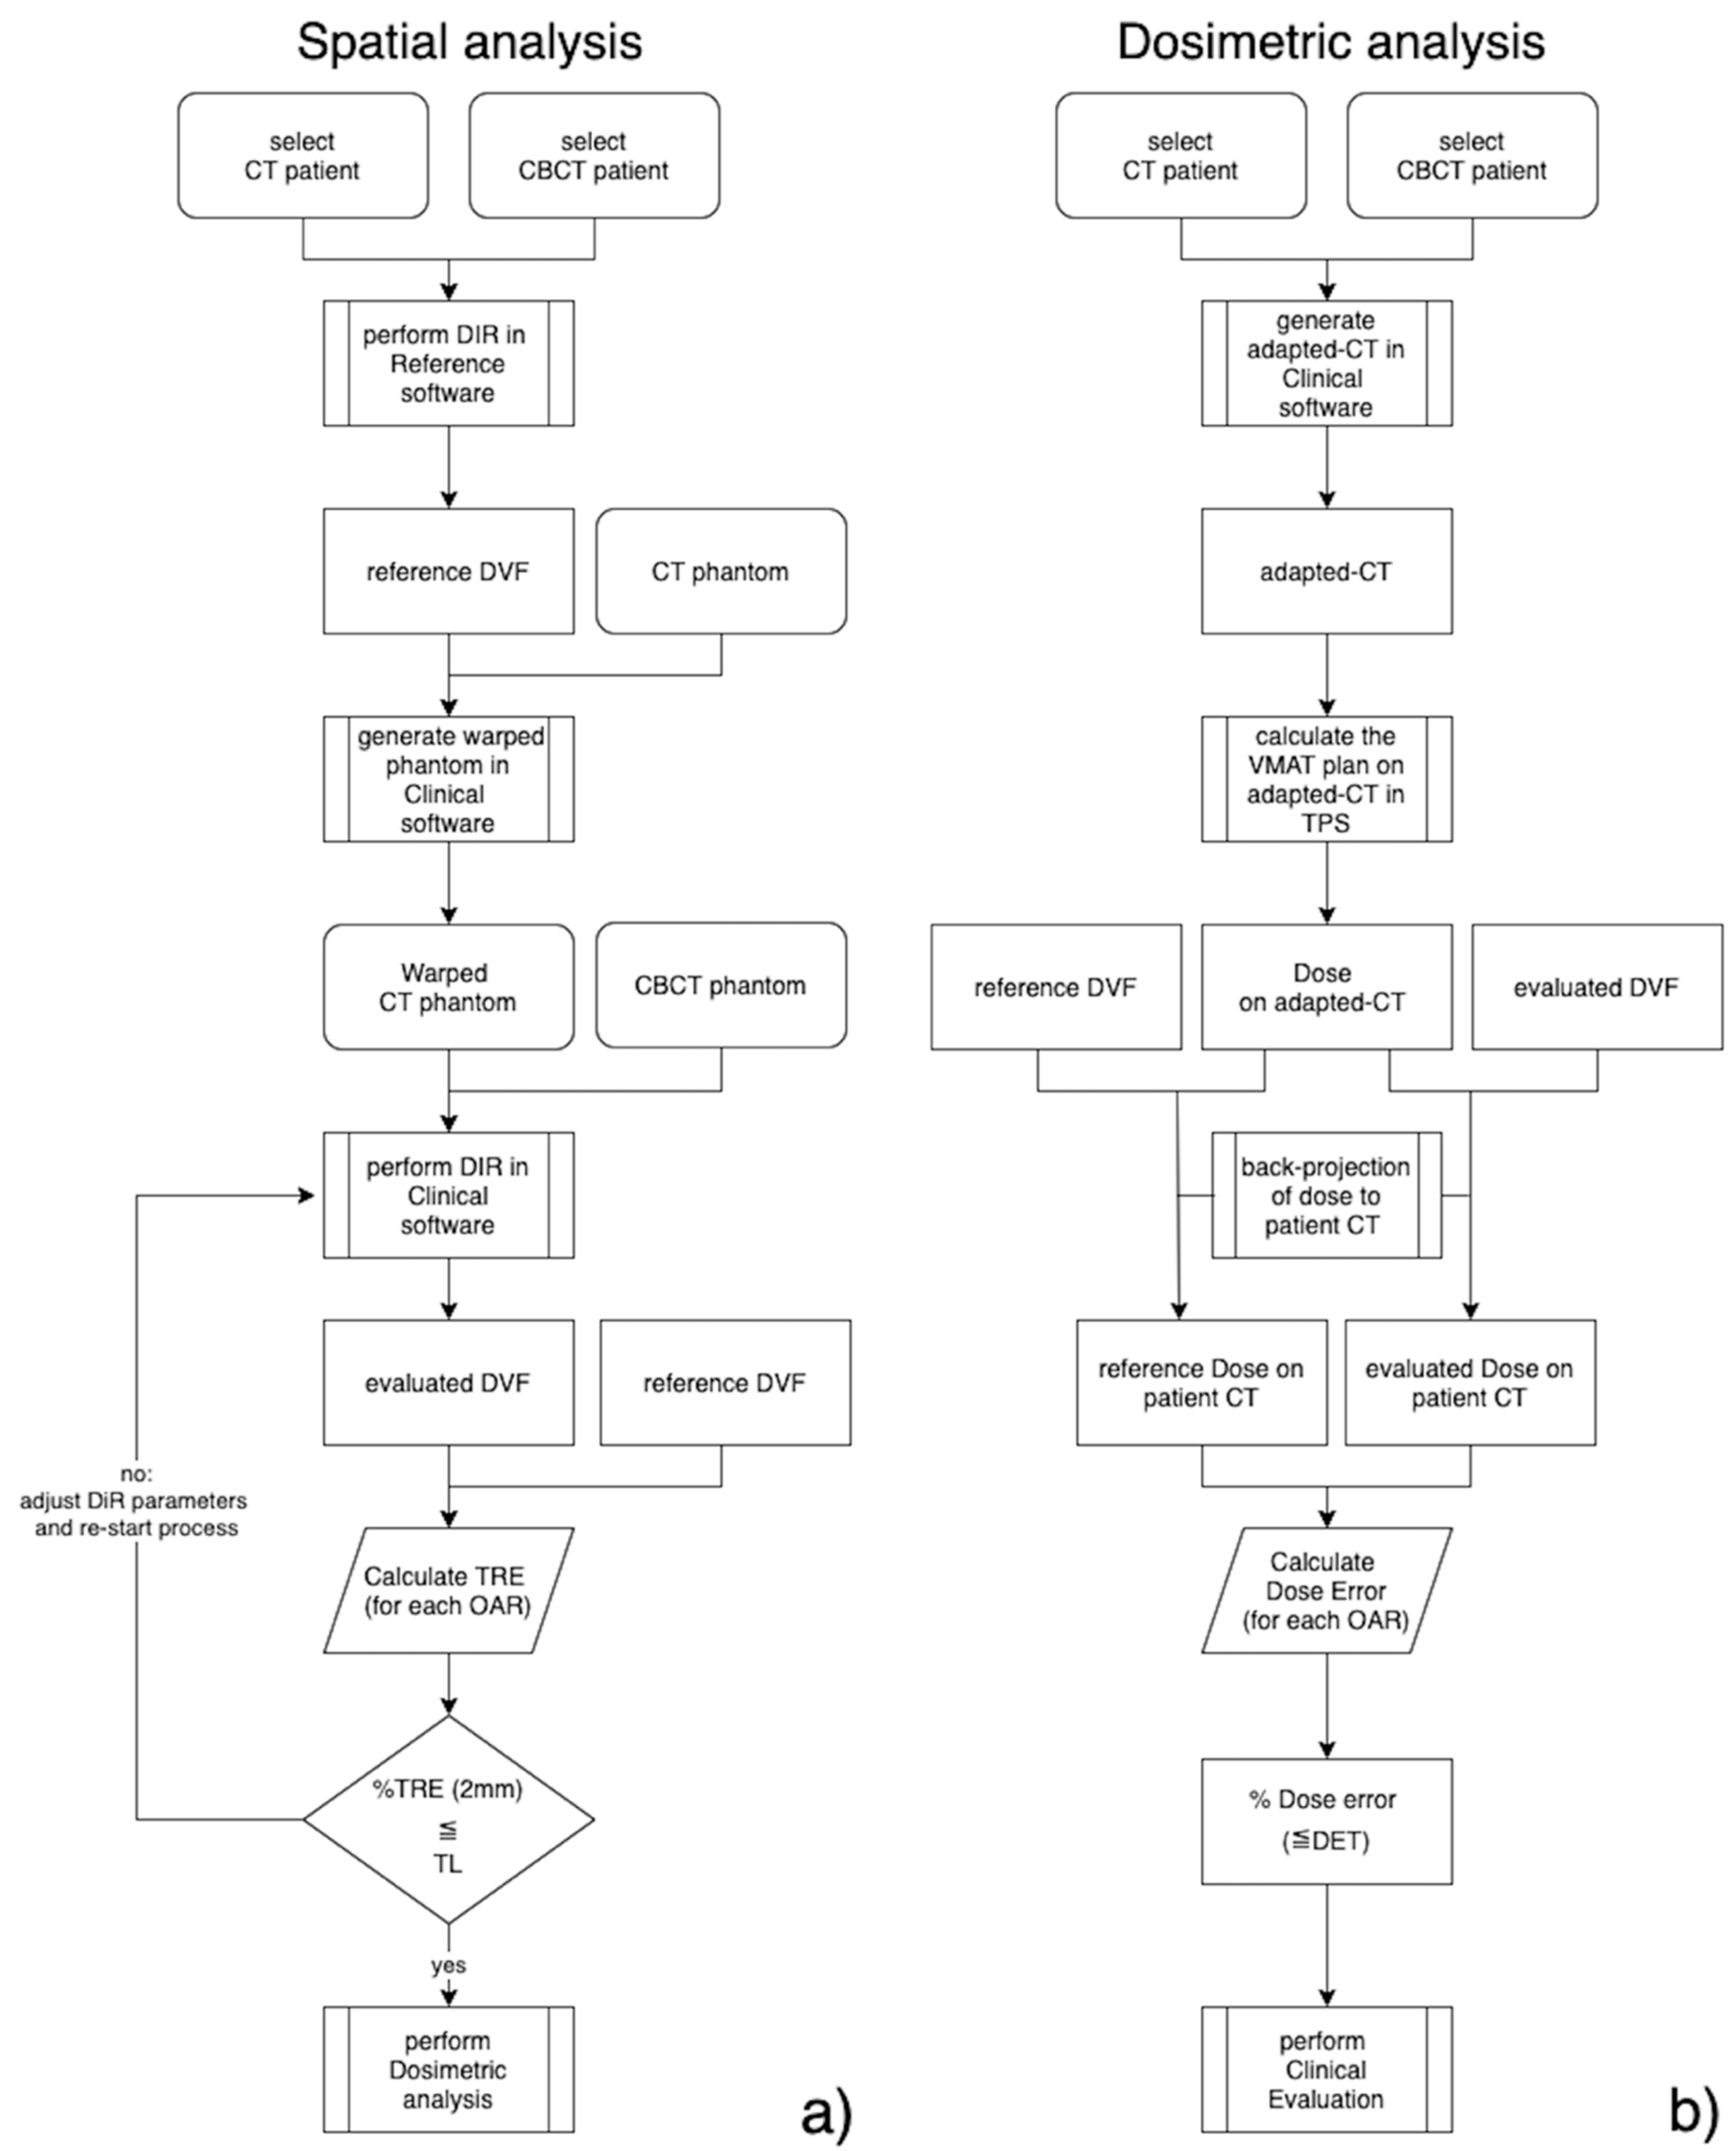
The method used to validate the DIR applied to the CT-CBCT image pairs was based on a known transformation for each voxel [
6]. This method requires an independent ‘third-party’ image registration software system to generate the reference DVF. We will refer to the third-party software as the ‘reference DIR software’, as it will be used to generate a reference DVF. The only requirement for the reference and the clinical DIR software systems should be the independence of each other in the DIR procedure to avoid biasing the results. As a guarantee of the correctness of the procedure, it is not essential that the reference software should be any more accurate in the DIR process than the clinical one.
The set of selected clinical patient images (CT and CBCT) that must be tested are registered using the reference software (see
Figure 1a, spatial analysis workflow). This registration is considered as the reference for the patient CT-CBCT data sets (refDVF). As a second step, the HN phantom CT images are artificially deformed into ‘warped’ phantom CT (wCT) images by applying the refDVF transformation. Using the clinical DIR software, the phantom CBCT image is registered with the wCT phantom image, generating a test DVF to be evaluated (testDVF). Note that the term refDVF relates to the patient image registration throughout, whereas the term testDVF always refers to the warped phantom CT and phantom CBCT DIR.
The quality of the registration was assessed as the ability of the clinical software to replicate the refDVF, artificially introduced into the phantom wCT images. The target registration error (TRE) was computed as a metric to evaluate the difference between the refDVF and the testDVF (
Section 2.5). As recommended by the TG132, the percentage of voxels with a TRE within 2 mm was compared with a designated Operative Tolerance Level (OTL) value (
Section 2.6). If the testDVF does not overcome the OTL analysis, the evaluated registration process should be re-started, adjusting certain registration parameters, such as the volume of interest.
The propagation of dosimetric errors due to differences in the DIR maps is schematized in
Figure 1b, labelled as the dosimetric analysis workflow. The VMAT clinical treatment plans were recomputed in the clinical TPS for each patient’s CBCT adapted-CT images to avoid bias in the dose calculation (see
Section 2.4), and back-projected to the corresponding patient’s CT images, via both the refDVF and testDVF, generating reference dose (refDose) and evalutated dose (testDose) arrays, respectively. The dosimetric differences between the refDose and testDose should be evaluated in conjunction with clinical radiation oncologists.
2.3. Clinical Data
Ten clinical patients with advanced oropharyngeal cancer who underwent radiotherapy at our institution were randomly selected from the departmental database. All the plans used volumetric modulated arc therapy (VMAT, RapidArc) to treat three targets at dose levels of 69.96, 59.40 and 54.45 Gy in 33 fractions, with a simultaneous integrated boost generated with an Eclipse Treatment Planning System (TPS) v.13.6 (Varian Medical Systems, Palo Alto, CA, USA). Bilateral neck irradiation was delivered to all the patients, with involved high-dose PTV on the right side for six patients, the left side for two patients, and centrally for the remaining two patients. For each treatment fraction, a CBCT scan was acquired, using the clinical HN protocol, before delivering treatment to assess the patient setup and anatomical variation. All the CBCT images were automatically saved in an ARIA database (Varian Medical Systems, Palo Alto, CA, USA). The published studies have shown that the anatomic changes in HN cancer patients are more pronounced in the first half of treatment [
25] and, based on our clinical institute experience, that re-planning requests are often performed in the second half of treatment. Hence, for each patient, the CBCT scans performed around the middle (fraction #16) and latter parts of the treatment course (fraction #26) were extracted from the imaging database for further analysis.
2.4. Demonstration of Clinical Application
The extracted pairs of CBCT and planning CT images for the 10 clinical patients selected were imported into MICE Toolkit v.1.1.0 (NONPI Medical AB, Stockholm, Sweden), which was used in this study as the reference software. The MICE Toolkit was used to produce the refDVF, being the only independent DIR software available in our institute for comparison with our clinical system (Velocity AI, described below). Within the MICE, the open-source Elastix software module [
26] was employed. The registration method used in this case is of the same type as the one in the clinical platform but implemented independently. It consists of a B-spline method with an adaptive stochastic gradient descent optimiser, with the number of resolutions equal to 3, the maximum number of iterations of 1000 and an interpolator order of 3, similar to those parameters reported in the literature [
27]. The DVF from each DIR (in total, 20 DVFs) was subsequently exported in the MATLAB format, converted to the binary format, and used as the refDVF.
The Velocity AI Oncology Imaging Informatics System v.4.0 (Varian Medical System, Palo Alto, CA, USA) was the DIR module used in our institute in clinical practice. The post-processed phantom scans were imported into the Velocity AI and linked to each of the 10 patients selected for the study. Both the phantom CT and CBCT images were rigidly registered to the CT image of the patient. This was done to align the phantom CT image with the clinical refDVF to produce a more clinically realistic warped phantom CT image.
Following the workflow described in
Figure 1, using the Velocity AI, the HN phantom CT images were artificially deformed into wCT images, using each of the imported refDVFs. Then, the phantom CBCT image was registered with the phantom wCT image, generating a testDVF obtained using the Velocity AI algorithm. The ‘CBCT corrected multi-pass deformable’ modality in the Velocity AI was used to generate the testDVF. This applies a ‘fade correction’ prior to the registration, which enhances the low signal regions in the CBCT image [
28]. The Velocity AI’s primary registration algorithm uses a multi-resolution approach based on mutual information. The transform is a cubic B-spline, the interpolator is a bi-linear interpolation function, and the optimiser is based on the steepest gradient descent method [
28]. The testDVF was then exported from the Velocity AI in a binary format. This workflow was repeated for all 20 registrations for the 10 patients. To ensure that the simulated deformation could be used as a reference to validate the image registration algorithm, for each case the warped phantom CT images were carefully inspected to verify that the changes induced in the phantom scans produced by the refDVF were realistic. Each testDVF was compared to the refDVF using the MATLAB in-house scripts. The quality of the registration was assessed as the ability of the testDVF to replicate the artificially generated refDVF.
For each patient and treatment fraction considered, an adapted-CT image of each refDVF was generated in the Velocity AI. The adapted-CT images used the HU values of the patient CT image, mapped onto the CBCT image, to avoid bias in the dose calculation [
28]. The adapted-CT images were then imported into the Eclipse TPS, and the VMAT clinical treatment plans were recomputed on each patient’s adapted-CT images and sent back to the Velocity AI. To assess the dose propagation errors due to the differences in the DIR maps, the dose on the adapted-CT was back-projected to the corresponding patient CT images via both the refDVF and testDVF.
2.5. Data and Statistical Analysis
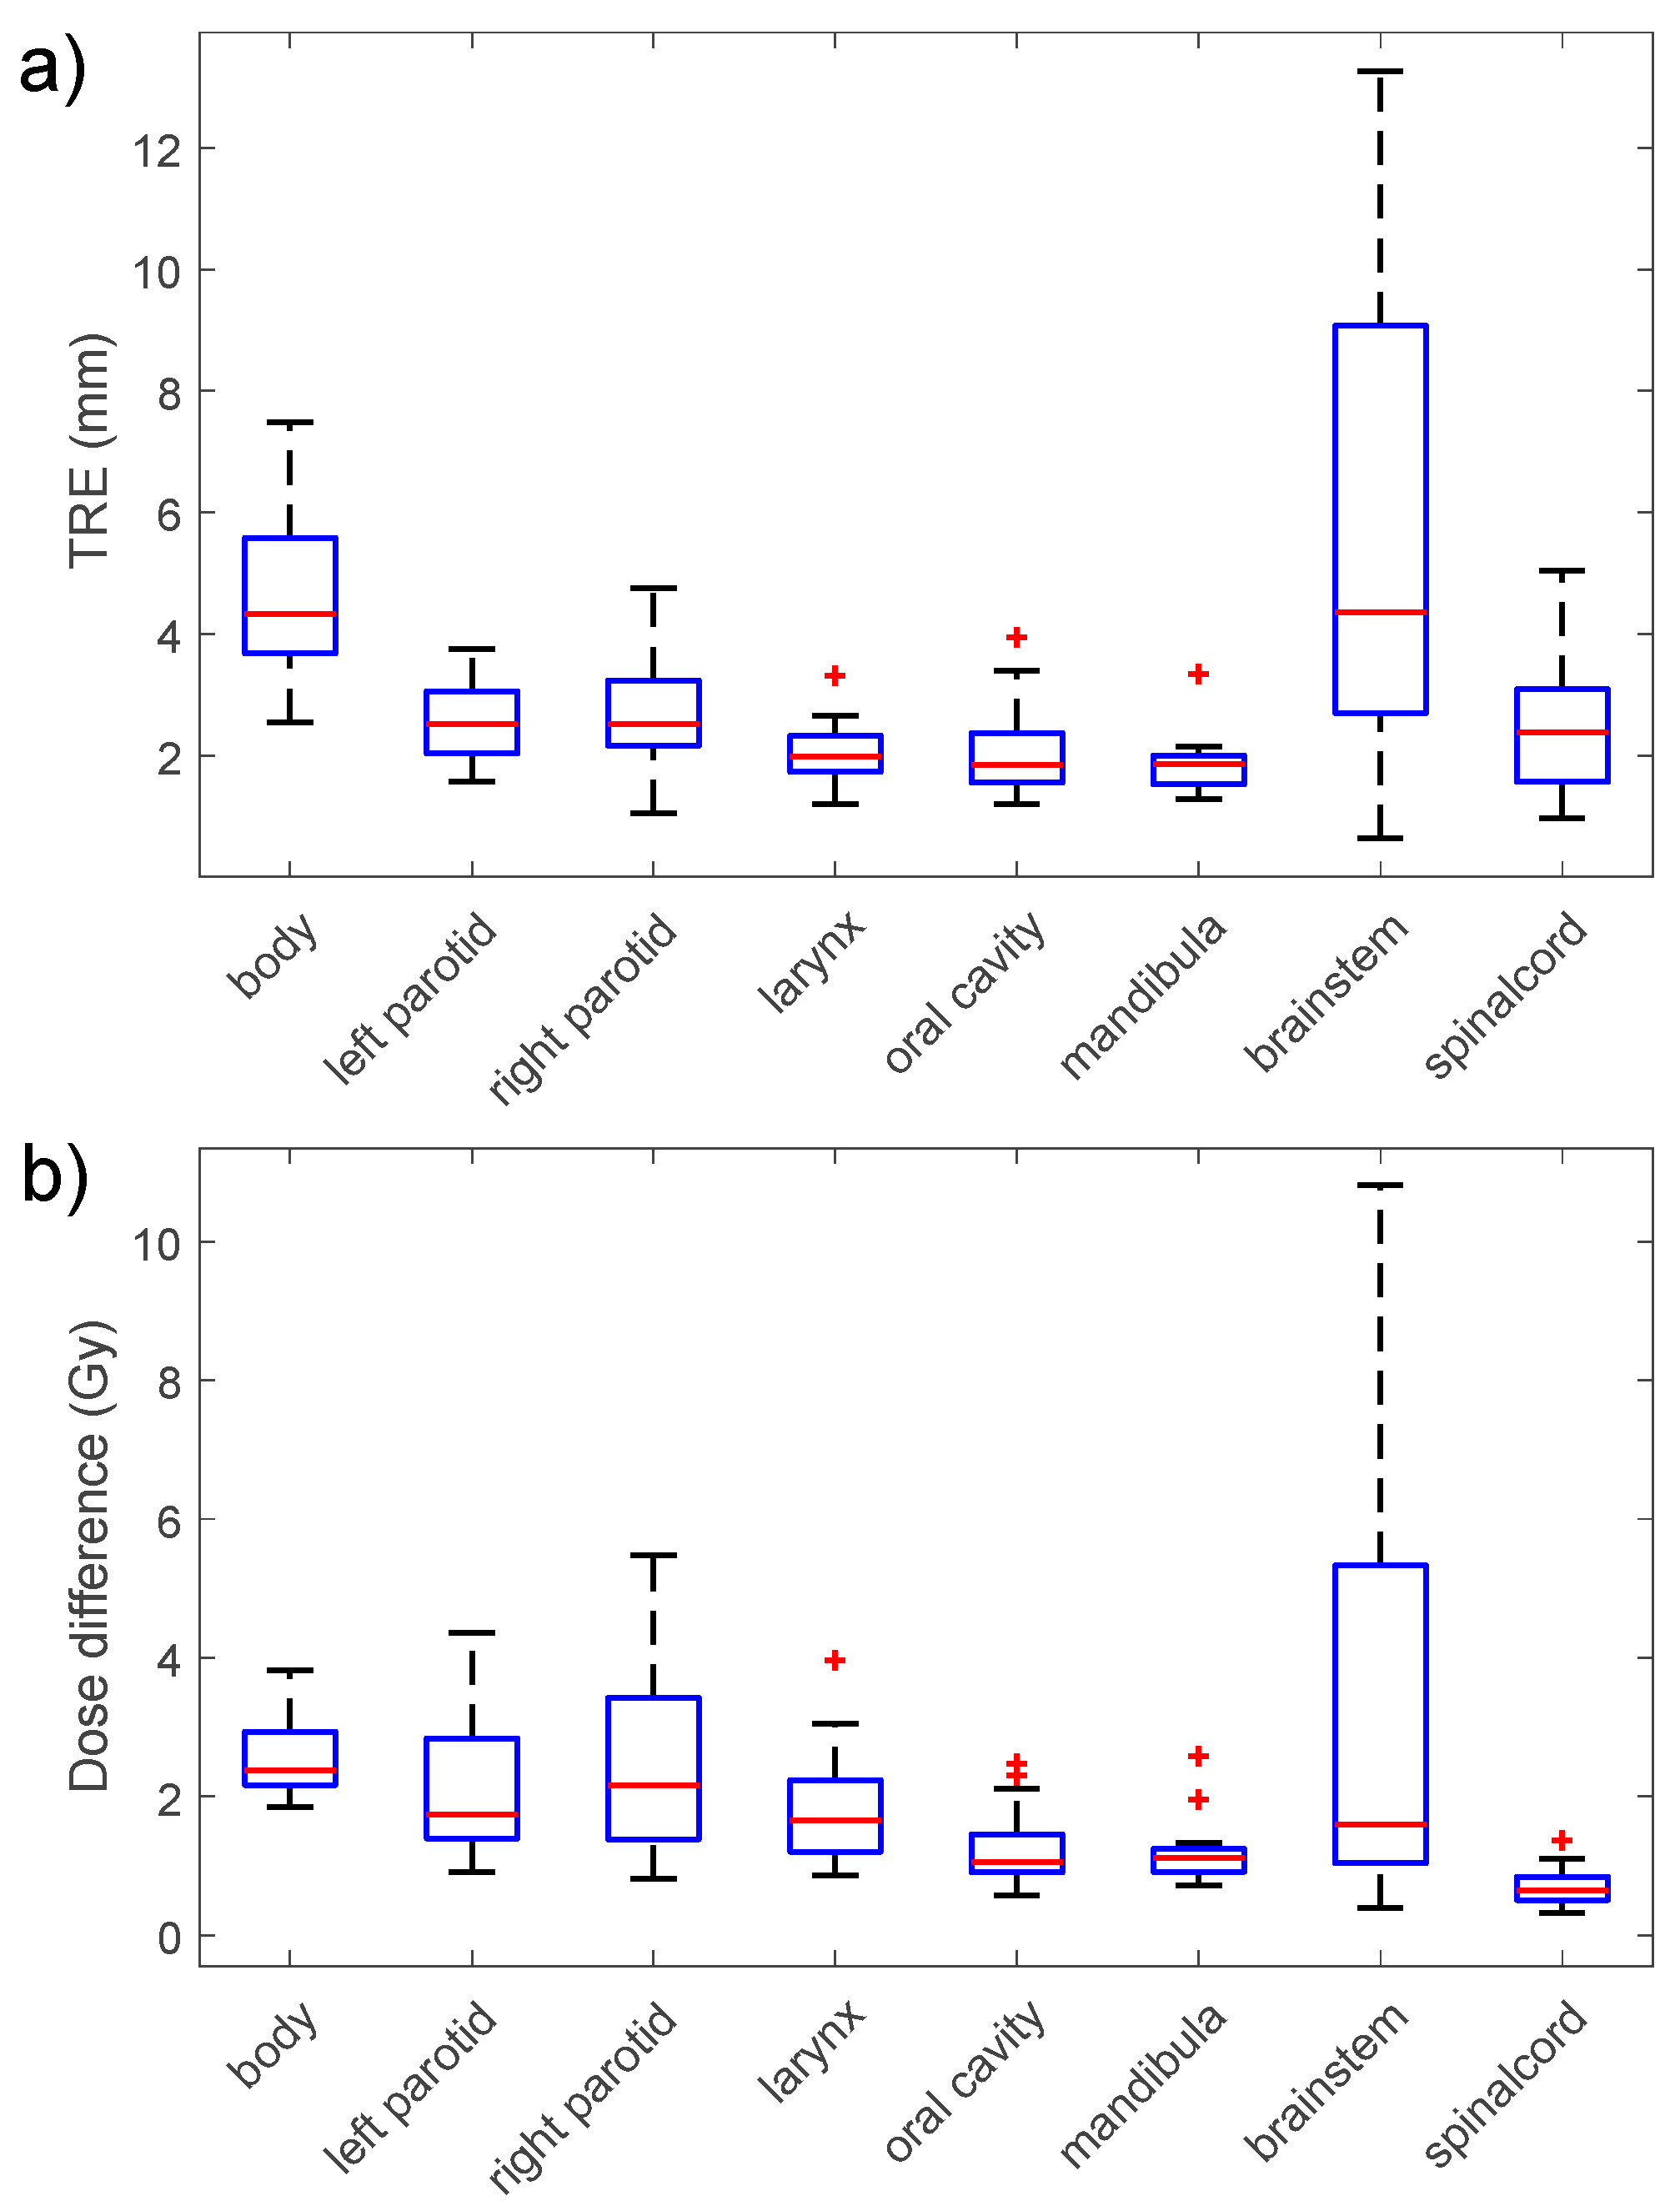
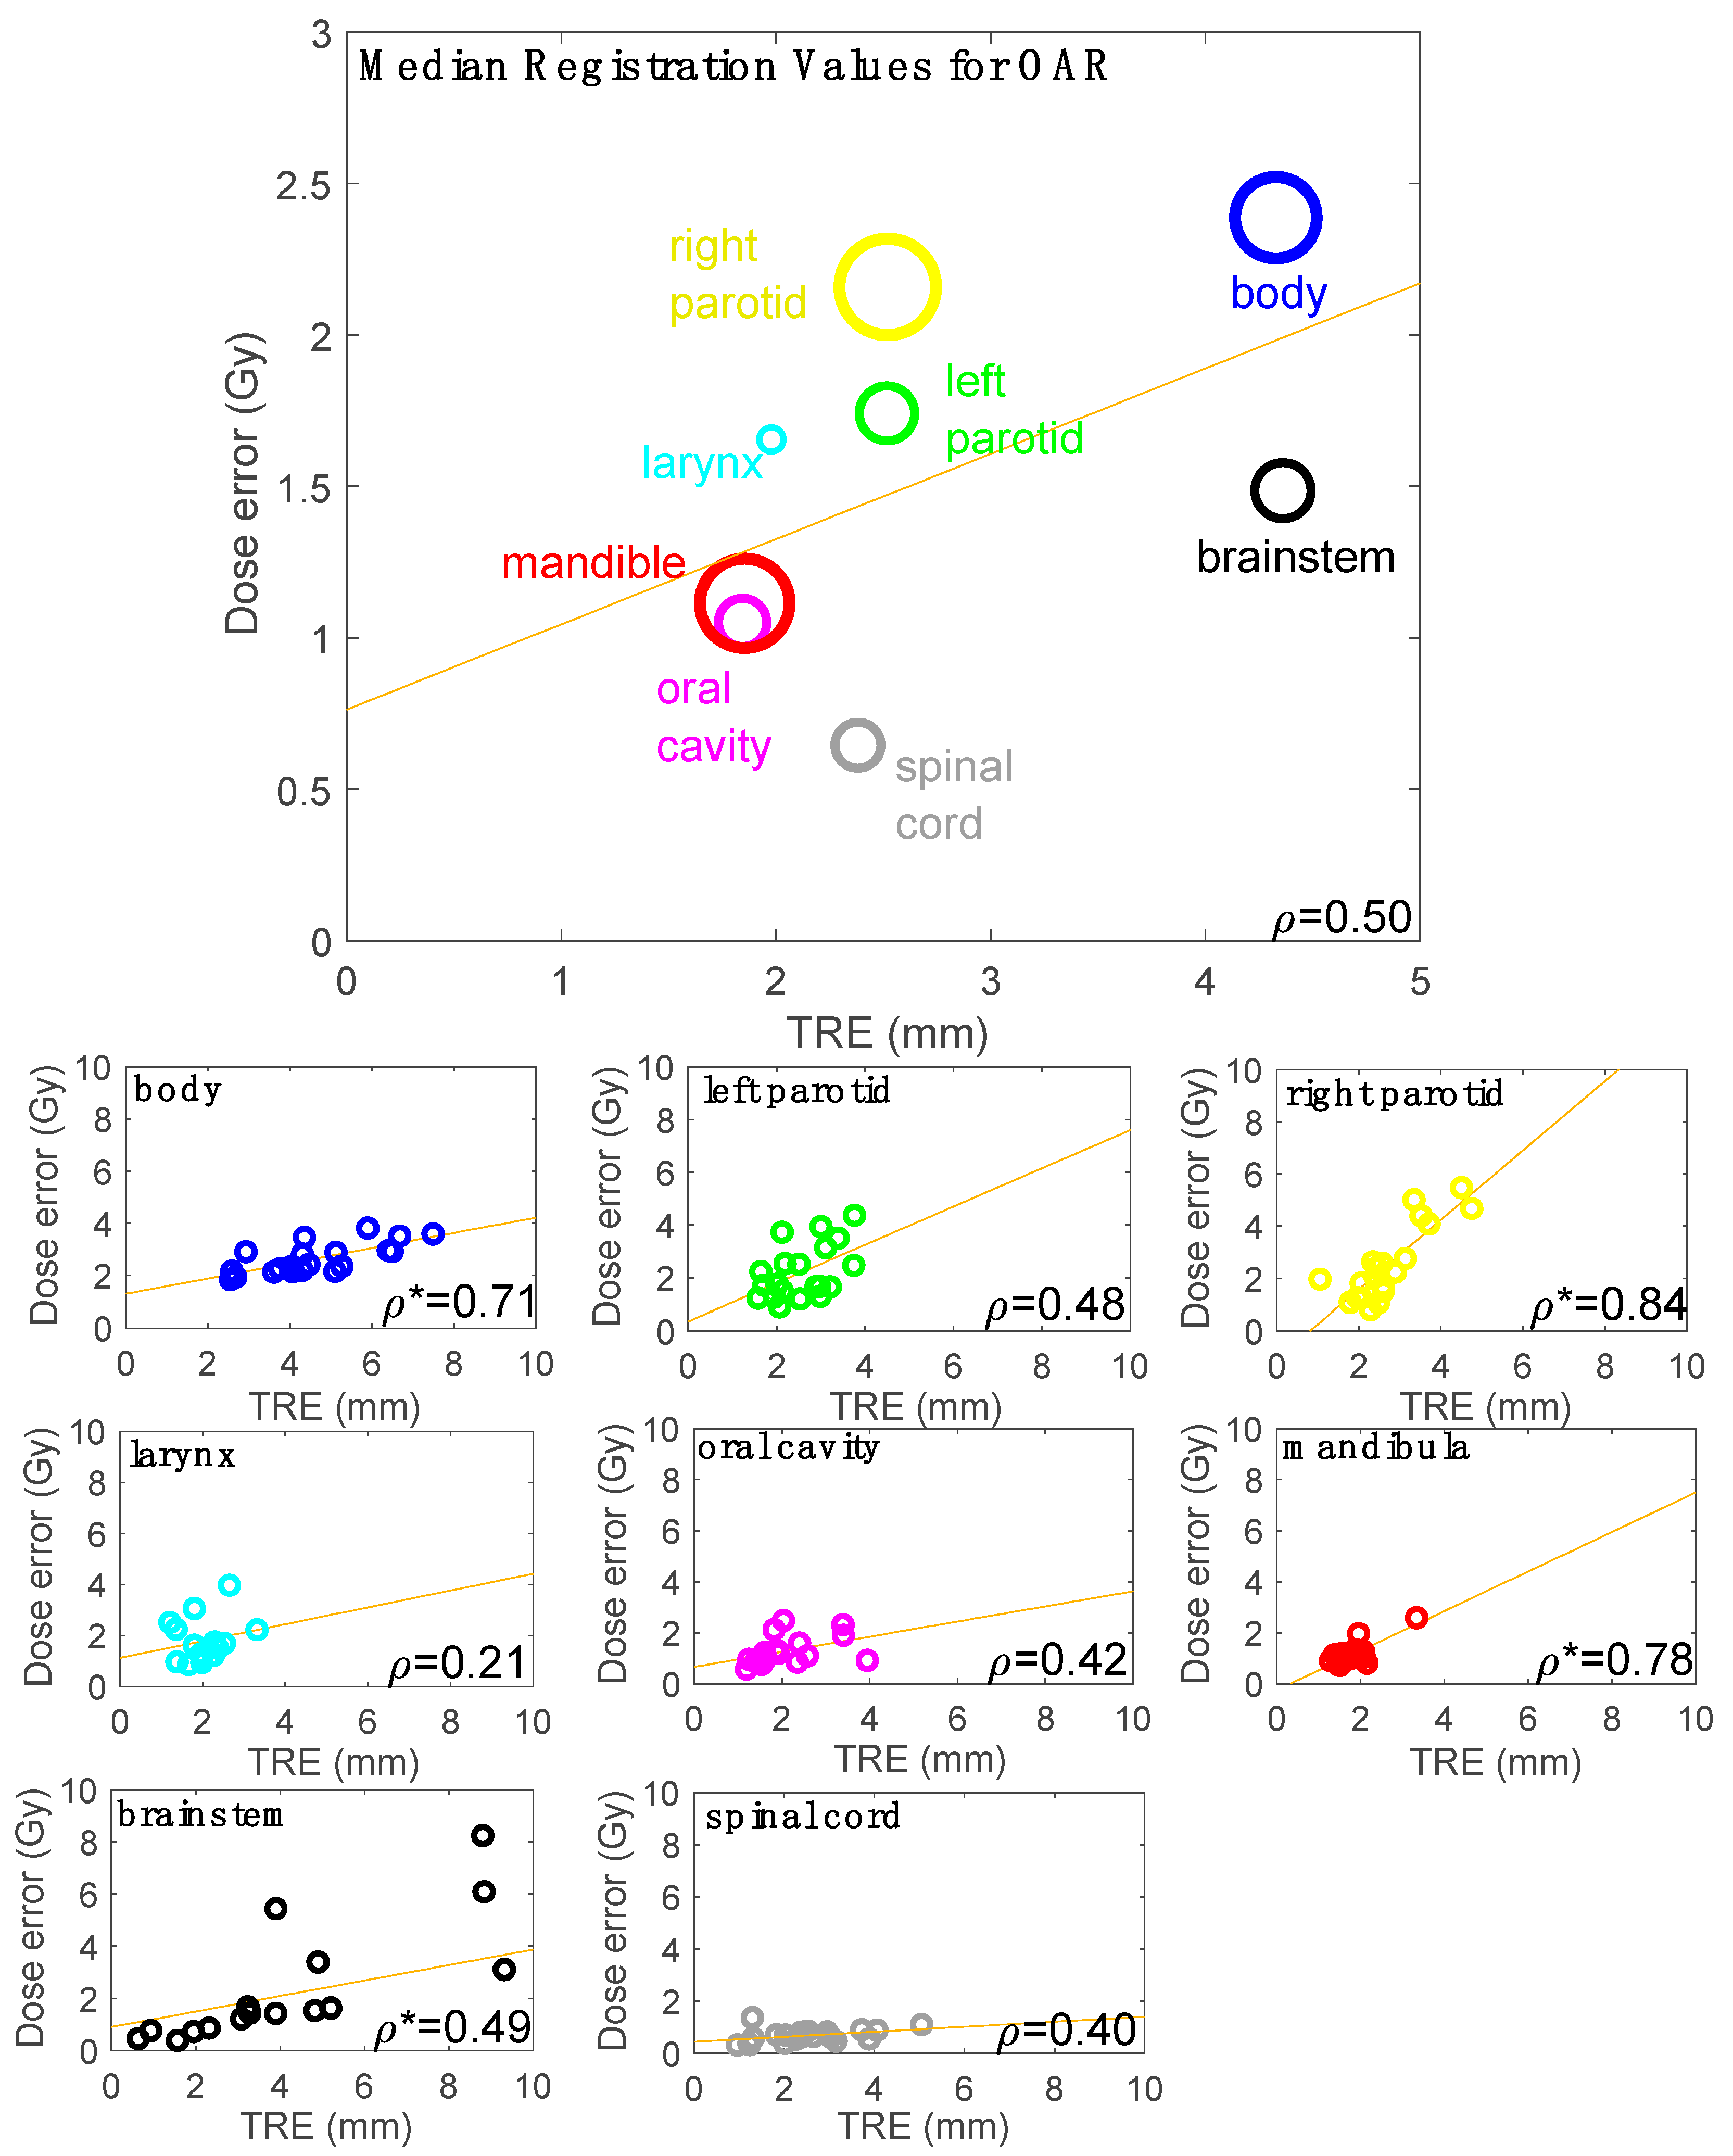
The spatial and dosimetric errors were calculated for all the voxels contained within the following OARs: the brainstem, spinal cord, mandible, left parotid, right parotid, larynx and oral cavity, as well as the external body contours. In two of our ten patients, the larynx was missing as an OAR because those patients were affected by laryngeal tumours, which were included in the clinical target volumes.
The spatial errors were calculated using the TRE [
6], which describes the difference between the co-located voxels once they have been transferred through the refDVF and testDVF. The TRE values were evaluated as a function of the treatment fraction number and the refDVF magnitude on a voxel basis. The percentage of voxels with a TRE of less than or equal to 2 mm was considered in the analysis as a significant parameter for the spatial errors, as was suggested by the AAPM-TG132 [
10].
Dose errors were calculated on the patient CT images as being the difference between the back-projected doses, using the two propagation methods (the reference vs. the evaluated). The dose errors were evaluated on a voxel basis. As a significant metric for the dose errors, the percentage of voxels within the dose error of a specific dose error threshold (DET) was calculated. In this study, a significant value for the DET was considered as 5% of the prescribed dose of 70 Gy, thus corresponding to 3.5 Gy.
The Pearson’s correlation coefficient metric was used to assess the statistical significance of the correlation of the observed TRE, as a function of the refDVF magnitude. The correlation between the dose error, TRE, dose gradients and the combination (scalar product) of these two (the TRE and the dose error) was also assessed using the Pearson’s correlation, as in a previously published similar study [
17];
p-values < 0.05 were considered significant.
2.6. Tolerance Level Based on AAPM-TG132
The AAPM TG132 Report [
10] provided digital phantoms for use in commissioning and quality assurance programmes for image registration accuracy tests. For rigid registration, TG-132 proposed 2 data sets created using the ImSimQA (Oncology Systems Limited, Shrewsbury, UK) (basic phantom data set and anatomic data set (a pelvic phantom)) for various modalities (CT, CBCT, PET, MRI-T1, and MRI-T2) for rigid registration. For the DIR accuracy assessment, the TG-132 provides a dataset pair of anatomical pelvic phantom images comprising:
a basic anatomical dataset (CT),
a basic deformation dataset, same as basic anatomical dataset with added gaussian noise variation to simulate CBCT image,
a ground-truth DVF transformation (TG132-refDVF) file in the DICOM format.
The basic anatomical phantom CT provided by the AAPM was deformed by using the provided TG132-refDVF. The registration between the warped anatomical phantom CT and basic deformed phantom (CBCT) was performed in the Velocity AI, generating the TG132-testDVF. Differences between the TG132-refDVF and TG132-testDVF were quantified in terms of the target registration error (TRE). The results of this test were used to establish an OTL for the DIR accuracy in the clinical dataset used in this study.
4. Discussion
In this study, a novel method to evaluate the quality of patient-based multimodal CT-CBCT DIR using a post-processed, digitally enhanced anthropomorphic HN phantom has been presented. All post-processed ATOM Max Dental and Diagnostic Head Phantom image datasets (CT and CBCT) are in the DICOM format, derived using the procedure described in
Section 2.1, and have been made publicly available as additional downloadable material for this paper as
Supplementary Material. This allows the use of the proposed method for CT-CBCT HN DIR accuracy evaluation in other centres, by processing the image sets with two different image registration software systems (reference and clinical), as described in
Section 2.1.
The refDVF represents the known transformation map derived with third-party reference software based on the clinically observed anatomical changes, which is then applied to create the warped phantom image. Thus, the transformation of each voxel in the warped image was known because it was deliberately applied to each voxel. As a verification method, the refDVF data did not necessarily represent the real, individual deformations of the patients, but they served as a reference to check how much the clinical algorithm under investigation (in this study, the Velocity AI) was able to reproduce the known deformation for that patient case. However, care must be taken to avoid applying a deformation derived using the same third-party algorithm that the user employs for the clinical deformation, as this would create a testDVF that was biased to the results expected from the same third-party and clinical DIR algorithms [
6]. The registration algorithms used in this work to generate the refDVFs and testDVFs were both of the same class (B-spline) but implemented independently (i.e., different optimiser, similarity measure and general parameters). Because of these differences, the registrations can be considered independent between the two software programmes, in line with the previous studies [
24,
25].
The dose error variations were found to be related to both the registrations and the OAR of interest. This is in line with the findings of Qin et al. [
29], who revealed that the impact of the DIR method on treatment dose warping is a function of the registration and is organ-specific. The OTL was derived from the material provided by the AAPM TG132 for quality assurance purposes. However, the TG132 utilised only pelvic anatomical data sets, processed using the ImSimQA, for the DIR accuracy assessment with a ground-truth transformation. Our findings confirmed that the registration accuracy is also a function of the selected organ at risk, underlying the importance of using an anatomical phantom for the DIR accuracy assessment, consistent with the clinical data considered. Thus, the OTL derived for this study, using the generic pelvic phantom proposed by the TG132, could have some limitations on the practical level. However, it was used here primarily as an exemplar to describe a suggested workflow for the DIR accuracy, as described in
Figure 1a.
In the published report on DIR validation by the AAPM’s Task Group 132, the proposed ideal goal for the TRE is 95% of voxels within 2 mm, using the Report’s provided image sets. Our results showed a considerably lower value, OTL = 45%, using the Velocity AI. The Velocity AI was previously benchmarked with different commercial DIR algorithms by Pukala et al. [
13] and found to be very similar in accuracy with respect to the other commercial software systems included in the study. Based on this, it can be assumed that the OTL value found in this study could be considered a typical practical accuracy value using the commercial software, based on the B-spline method, for the CT-CBCT DIR registration using the TG-132 basic anatomical phantom. The difference between the OTL found in this study, and the goal suggested by the AAPM-TG132, underlines the pressing need for a universally available, comprehensive library of site-specific phantom datasets with the ground-truth deformation data to determine a more robust operative tolerance level to test the DIR software.
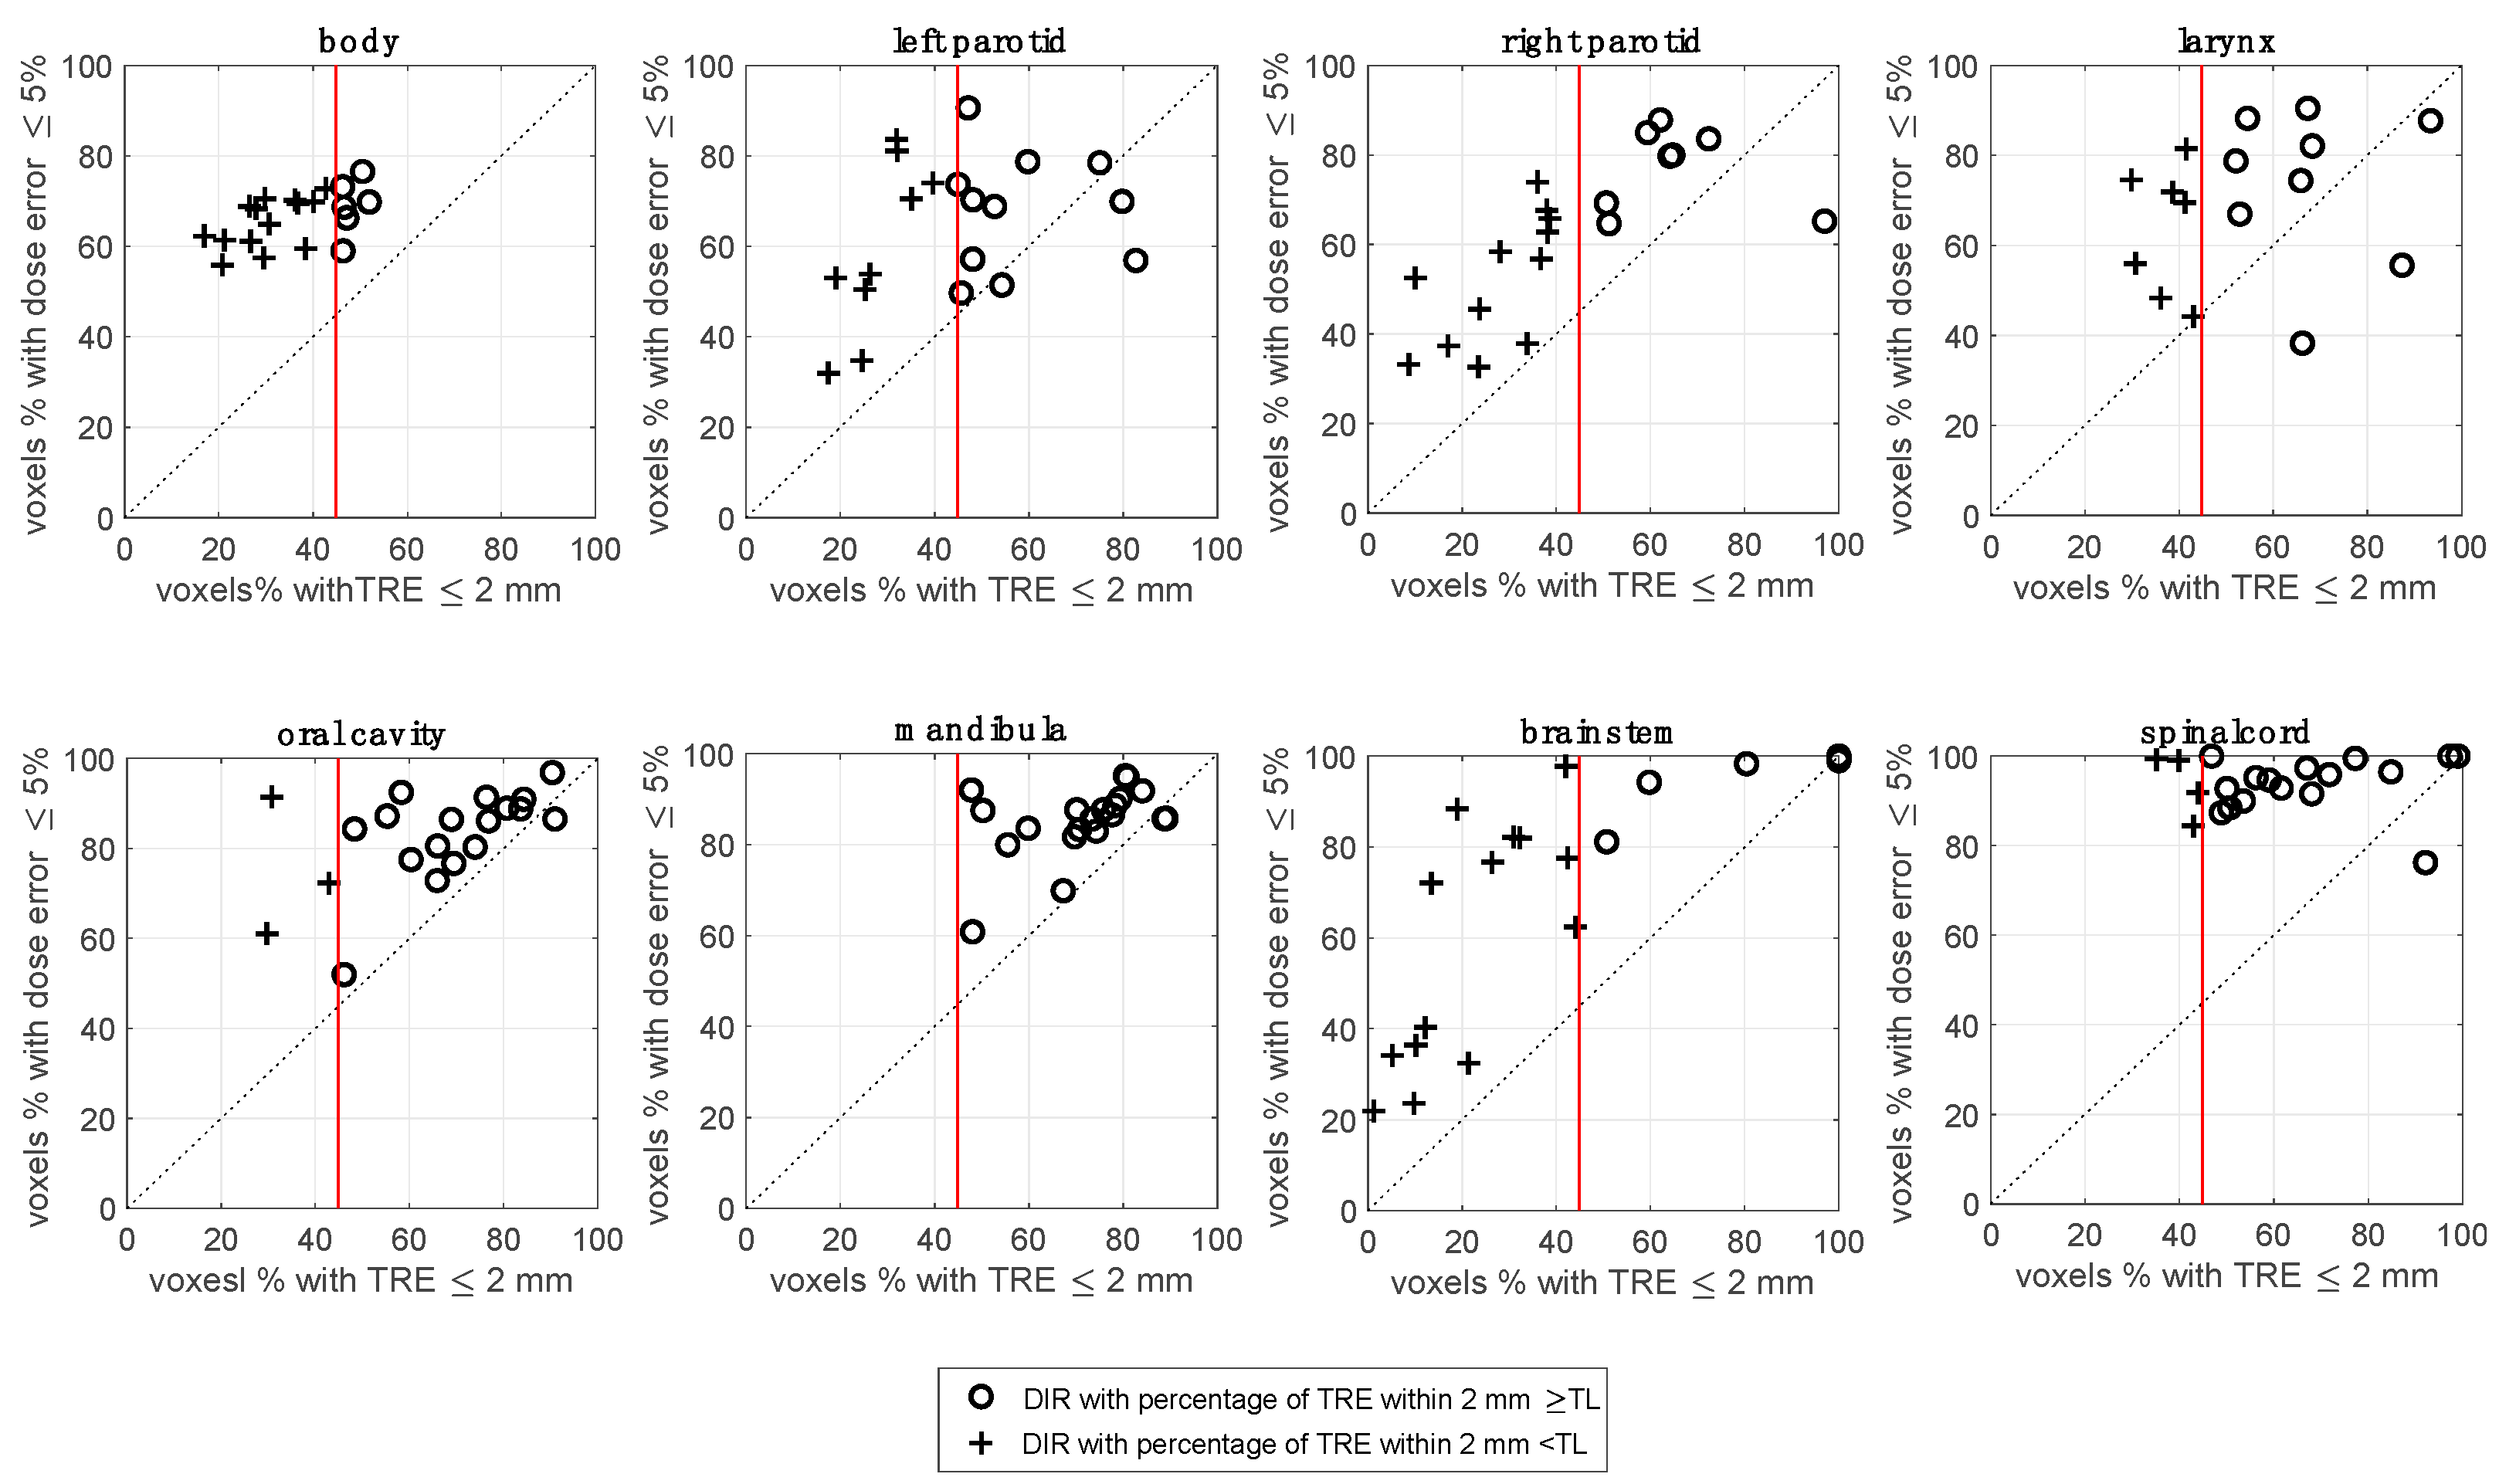
The registrations that pass the OTL for spatial accuracy can still result in a low percentage passing the dose difference criterion (as reported in
Figure 4 and
Figure 5), indicating quite a complex relationship between the dose error and TRE accuracy. One limitation, shared by the spatial DIR metrics, is the indirect relationship between the quantification of the DIR error and the effect that error has on a given dose distribution. This is a complicated issue akin to invoking the gamma criterion for an IMRT QA analysis [
32]. The TG-132 report did not suggest any tolerance goal for dose differences. For this reason, in the dosimetric analysis workflow reported in
Figure 1, we have suggested a clinical evaluation criterion for the dose difference results.
A moderate, as classified in [
30], but significant correlation on a voxel basis for both the dose gradient and the TRE with a dose difference was found. Veiga et al. [
17] observed a moderate correlation between the dose gradient and the resulting dose difference, in agreement with our findings. Murphy et al. have reported the effect of the DVF on dose-mapping and concluded that there is a complex correlation that depends on the TRE and the voxel location, relative to the dose gradient [
31]. The Pearson correlation test results were always significant (
p < 0.05) for the voxel basis approach (
Section 3.5). As reported by Schober et al. [
33], the
p-value derived from the test provides no information on how strongly the two variables are related. With large datasets, as they are in the voxel-based analysis, very small correlation coefficients can be “statistically significant.” Therefore, a statistically significant correlation must not be confused with a clinically relevant correlation.
It is important to underline that this study represents a Proof of Principle, and further work will be undertaken to explore the behaviour of the algorithm in other situations. In our experience, the clinical workflow is composed of several tasks and can be time-consuming. Using the application conditions described (software and hardware), it can require up to 30 min for a registration evaluation. However, this time depends on several factors, such as the software involved, the type of registration DIR selected, the region of interest chosen, the VMAT plan parameters and the hardware characteristics for the registration software, the dose calculation and the experience of the operator. Moreover, a separate time allowance is required for the analysis of the DVFs and dose distribution at the voxel level, using the in-house software.
4.1. Range of Application of the Method
The use of a phantom in the method has some intrinsic limitations. The lack of an initial deformation or shift between the CT and CBCT (owing to the rigidity of the phantom and not applicable with the real patient CT and CBCT images) was the basis for the reference condition of the validity of the method. Since the clinical reference DVF has the same frame of reference as the patient CT image, care must be taken to align the DICOM coordinate systems between the patient and HN phantom CT images before generating the warped phantom CT image based on the reference DVF. This was done to align the phantom CT image with the clinical refDVF to produce a more clinically realistic warped phantom CT image. Indeed, it is important that the warped phantom is created, applying as far as possible the deformation magnitude consistent with the spatial deformation of the patient images.
From a mathematical point of view, the validity of the method is consistent for every size of patient anatomy, because the quality of the registration was assessed as the ability of the clinical software to replicate the reference DVF, artificially introduced into the deformed phantom CT images. However, the rigid “coupling” between the phantom anatomy and the reference DVF should be considered carefully to ensure the clinical relevance of the reference DVF. The more the anatomy is similar between the phantom and patient, the more the clinical value of the reference DVF will be maintained when it is applied to the phantom anatomy. The quality of this coupling should be tested visually, by checking the overlap between the patient and phantom structures. A potential method to overcome the mismatch between the patient and phantom anatomy is to introduce a baseline DIR between the patient and the phantom in the coupling phase, instead of a rigid one. However, introducing this step can increase the complexity of the evaluation method, therefore it was decided to avoid this point to avoid over-complicating the workflow. Indeed, it is important to underline that, as a verification method, the refDVF data did not necessarily represent the real, individual deformations of the patients.
Moabbed et al. [
34] used a physical anthropomorphic pelvic phantom for the CT and CBCT deformable image registration with the aim of validating a DIR evaluation method for prostate cancer cases. Even if their study focused on evaluating the accuracy of the dose calculation as performed directly on the CBCT images, they presented a similar workflow to the current study for their evaluation, in that the pelvic phantom images were digitally deformed using two realistic patient-based deformation fields, after a rigid alignment between the patient and the phantom’s system of reference.
Since the OAR insertion in the HN processed phantom was done in terms of HU, and not in physical density, the processed phantom images were not suited to studies of the dose calculation accuracy, but only for the DIR registration accuracy. Indeed, the dose calculation using this method is only performed on the patient adapted-CT.
4.2. Similar DIR Accuracy Workflows to the Current Study
Our proposed method quantified the effect of the DIR on the dose distribution, focusing on the DVF accuracy. As was reported in the introduction, for adaptive radiation therapy, the accurate dose deformation and summation/accumulation within each contour is determined by the DVF accuracy [
16]. Other methods evaluated the dose deformation accuracy, focusing on the DVF.
Recently, Lowther et al. [
35] assessed the uncertainty in the dose accumulation procedure for the HN adaptive by comparing the DIR-facilitated dose accumulation using a commercial software system with the results of an in-silico model, based on the clinically observed deformations as the ground truth. HN patients CT and CBCTs images were used to generate in silico reference CBCTs and DVFs, as the ground truth, with a second reference B-spline DIR software. The in silico images, generated with an independent DIR software as the reference, were necessary to have a known reference DVF. Also, this method has the advantage of evaluating each patient-specific deformation and dose warping. However, Lowther’s method works directly on the patients’ images, making the clinical workflow simpler and reasonably quicker than the proposed one, avoiding the use of the HN phantom presented in this study, with its related inherent imitations (see
Section 4.1). The complexity of the deformations in the human body, as well as its heterogeneity in terms of the HU values, are challenging to model accurately through a phantom. On the other hand, the method implemented in our work has the advantage of replicating the HU distribution found in the OARs on clinical images. In comparison, Lowther’s method tested the DIR between the planning CT and the in silico model of the CBCT, which is different from the original CBCT in the HU and quality (the planning CT deformed to the anatomy of the CBCT of the considered fraction) and could not consider some issues of the CTBT-to-CT DIR, including the reduction in the accuracy due to the low image contrast of the real CBCT.
Pukala et al. [
13] evaluated the performance of several DIR software systems using several HN digital phantoms, in terms of both the spatial and dosimetric accuracy at the voxel level. The study created publicly available phantoms based on the CT data from head and neck cancer patients. These phantoms provide a clinically based ground-truth model that encompasses the anatomical changes that occur over the course of a typical treatment. Also, this study assessed the deformation accuracy for each voxel by comparing the entire registration DVF to the ground-truth DVF, based on the clinical scenario. One key aspect of our study was the possibility to use real patient data (the DVF and dose distributions) to evaluate each patient-specific DIR, instead of commissioning specific DIR algorithms. Moreover, the study of Pukala was focused on CT-to-CT registrations, while our study referred to multimodal CBCT-to-CT registration. The latter presents more issues in the DIR accuracy, due to the limited quality of the CBCT images.
Veiga et al. [
17] investigated the transformations that mapped the anatomy between the planning CT and CBCT using four different DIR approaches. DVFs were used to remap the dose of the day onto the planning CT. The data from five HN patients were used to evaluate the performance of each implementation, based on geometrical matching, the physical properties of the DVFs, and the similarity between the warped dose distributions. As reported in the Introduction, this approach can be useful to choose the optimal registration method, without conveying any information on the DIR uncertainties and related dose errors.
Singhrao et al. [
36] used a deformable HN phantom to test DIR algorithms, but, in practice, it is difficult to produce physical phantoms for every deformation scenario that occurs clinically.
Essentially, the novelty of our approach consists of the use of an HN anthropomorphic phantom for the CT-CBCT registration, which was digitally enhanced to include the OARs which are typical of that anatomic region, (
Figure 1), with a robust accuracy verification procedure taking into account the recommended OARs for the HN. Also, in this study, further recommendations in terms of a clinically feasible workflow and achievable thresholds for the CBCT-to-CT deformable image registration have been investigated. The findings of this study indicate that there is a need for standardised approaches and specific guidelines for different applications to supplement the overarching DIR guidelines such as the TG132.
5. Conclusions
A novel method to evaluate the quality of patient-specific multimodality CT-CBCT DIR for the adaptive radiotherapy of HN patients, based on the clinical observed changes as the ground truth, has been developed, using a digitally enhanced anthropomorphic phantom to include the common organs at risk. An established workflow and operative\ tolerance level, based on the TG132 indications, were provided. The methodology allows the direct testing of the patient-specific DIR spatial and dosimetric accuracy at the voxel level, which can produce valuable insights into their clinical impact on the adapted dose distribution.
The method was applied to test the DIR performance on a set of clinical HN patients using clinical commercial software. It was found that the DIR performance varied with the specific registration and organ, and the complex relationship between the spatial and dose errors. The results of this study suggest that the method is suitable to assess the adequacy of the DIR-based dose accumulation.
The technical requirement for using this method is the availability of an independent image registration software platform (in addition to the clinical system) and the processed phantom image sets. This work contributes to the study of the standardisation and automation of quality assurance methods for deformable image registration in radiotherapy.

 ,
, 


