Article

A Workflow for Dosimetry of 90Y Radioembolization Based on Quantitative 99mTc-MAA SPECT/CT Imaging and a 3D-Printed Phantom

1
Laboratory of Medical Physics and Expert System, IRCCS Regina Elena National Cancer Institute, 00144 Rome, Italy
2
Medical Physics, ASL Roma 6, 00041 Rome, Italy
3
Medical Physics Unit, IRCCS Istituto Romagnolo per lo Studio dei Tumori (IRST) “Dino Amadori”, 47014 Meldola, Italy
4
Radiology Department, Regina Elena National Cancer Institute, 00144 Rome, Italy
5
Nuclear Medicine Department, Regina Elena National Cancer Institute, 00144 Rome, Italy
6
Department of Medical Physics, IRCCS Azienda Ospedaliero-Universitaria di Bologna, 40139 Bologna, Italy
*
Author to whom correspondence should be addressed.
Appl. Sci. 2022, 12(20), 10541; https://doi.org/10.3390/app122010541
Submission received: 11 September 2022 / Revised: 12 October 2022 / Accepted: 14 October 2022 / Published: 19 October 2022
(This article belongs to the Special Issue Developments of Diagnostic Imaging Applied in Radiotherapy)

Abstract

:
At a time of increasing evidence for dose-effect relationships in radioembolization (RE) with 90Y-microspheres, the general consensus is that there is an urgent need for accurate treatment planning and dose assessment in patients undergoing RE treatment. This work aimed at assessing the usefulness of 99mTc macroaggregated albumin (MAA) SPECT/CT imaging for personalized provisional RE dosimetry considering a 3D-printed patientlike phantom (AdboMan phantom). A homemade tool was developed in MATLAB for image analysis and absorbed dose calculation. Two dose calculaton methods were implemented and used to calculate dose volume histograms: (I) dose kernel method and (II) local energy deposition method. The accuracy of the two different dosimetric methods was evaluated by means of 3D γ -index (1%–1 mm and 2%–2 mm) implemented in the tool. Differences between the two dose calculation methods using the 3D γ -index are within 1%–1 mm and 2%–2 mm for all AbdoMan inserts, with a passing rate of 99.9% and 100%, respectively, proving a good agreement between the two calculation methods. The present study supports the use of 99mTc-MAA SPECT acquisition for provisional dosimetry along with the local energy deposition method to convert reconstructed SPECT data into absorbed dose maps. As long as 99mTc-MAA SPECT acquisitions are performed on liver lesions larger than 40 mm, the absorbed dose computed by means of the local energy deposition method can lead to results in line with those obtained by Monte Carlo calculations.

1. Introduction

Nowadays, liver cancer still represents a global disease burden due to its extremely aggressive nature and poor survival rate, remaining an important public health issue worldwide [1,2,3]. Radioembolization (RE) with Yttrium-90 labelled glass or resin microspheres (90Y- μ s) is a well-established therapeutic modality for treating unresectable, chemo-refractary primary and secondary liver malignancies [4,5]. Patients with liver disease usually have multiple areas of metastatic spread that make difficult defining the tumor and normal parenchymal compartments [6].
The main advantage of RE with 90Y- μ s is the fact that the radio-labelled particles are injected directly into the target area leading to tumor cells death with the attempt of sparing normal parenchyma. However, microspheres can be transported into the vascular territory of the gastrointestinal organs, resulting in severe damage in up to 5% of RE cases [7]. Thus, this treatment requires accurate planning to ensure a good therapeutic response along with as few side effects as possible [8,9]. Along these lines, the absorbed dose to the tumor and to the normal liver tissue should be evaluated prior to commencing therapy [10,11]. In fact, an individualized dosimetry-based treatment planning is expected to significantly improve the clinical efficacy and cost-effectiveness [12,13]. Response to treatment is no doubt strongly related to the delivered dose distribution and target volume but also on cellular radio-sensitivity and in particular on the amount of hypoxic areas [14]. The current European legislation (EC directive 2013/59 [15]) and the requirement of the US FDA for dosimetry for new radiotherapeutics has also driven a resurgence in a field that has clinically been considered unnecessary, impractical and is often poorly understood.
In the clinical practice, dosimetric studies are generally performed using pre-treatment Tecnethium-99m-macroaggregated albumin (99mTc-MAA) images, potentially useful for determining the 90Y microspheres activity to be administered. Indeed, pre-treatment angiographic evaluation combined with 99mTc-MAA is required in order to assess the vascular anatomy of the target lesions and normal liver. Given the similarities in sizes of 90Y microspheres (20 to 40 μ m) and 99mTc-MAA (10 to 50 μ m, average particle size 35 μ m), the pattern of 99mTc-MAA deposition is assumed to be representative of the micropshere biodistribution during 90Y-RE. When used in conjunction with dosimetric models, 99mTc-MAA biodistribution images provide absorbed doses estimates in tumor lesions and normal liver parenchyma. In fact, absorbed doses can be mathematically determined by converting quantitative 99mTc-MAA SPECT data to the absolute 90Y activity maps. These maps, in turn, can be converted to absorbed doses using the available dose calculation algorithms (e.g., MIRD [16], partition [13], kernel convolution [17] or local energy deposition [17,18,19] models).
Even if the computational improvements of quantitative software related to SPECT image reconstruction process have been adopted, one of the principal limitations of SPECT/CT acquisition is its resolution, and consequently the correctness of dosimetric evaluations that can be obtained. 90Y-PET/CT represents the best choice for accurate patient-specific post-treatment dosimetry purposes, thanks to its superior resolution than SPECT/CT system and to the 90Y decay characteristics.
At present, the predictive value of 99mTc-MAA SPECT based dosimetry is still subject of debate in the scientific literature [20]. Of note, recent research reported patient population tumor dose constraints [21] providing support that dose-volume histograms in 90Y SIRT could play a role in evaluative dosimetry. Against this backdrop, the aim of this study is to develop an approach for personalized RE treatment planning based on 99mTc-MAA SPECT/CT acquisition of a 3D printed patient-like phantom (AbdoMan, developed by [22]). In particular, our study investigates the feasibility of using 99mTc-MAA SPECT/CT system (provided with XSPECT tool for reconstruction) for provisional RE dosimetry in clinical contest, comparing our results with data from Gear et al. [22]. All acquisitions and absorbed dose calculations were performed at the IRCCS Regina Elena National Cancer Institute, (Rome, Italy).

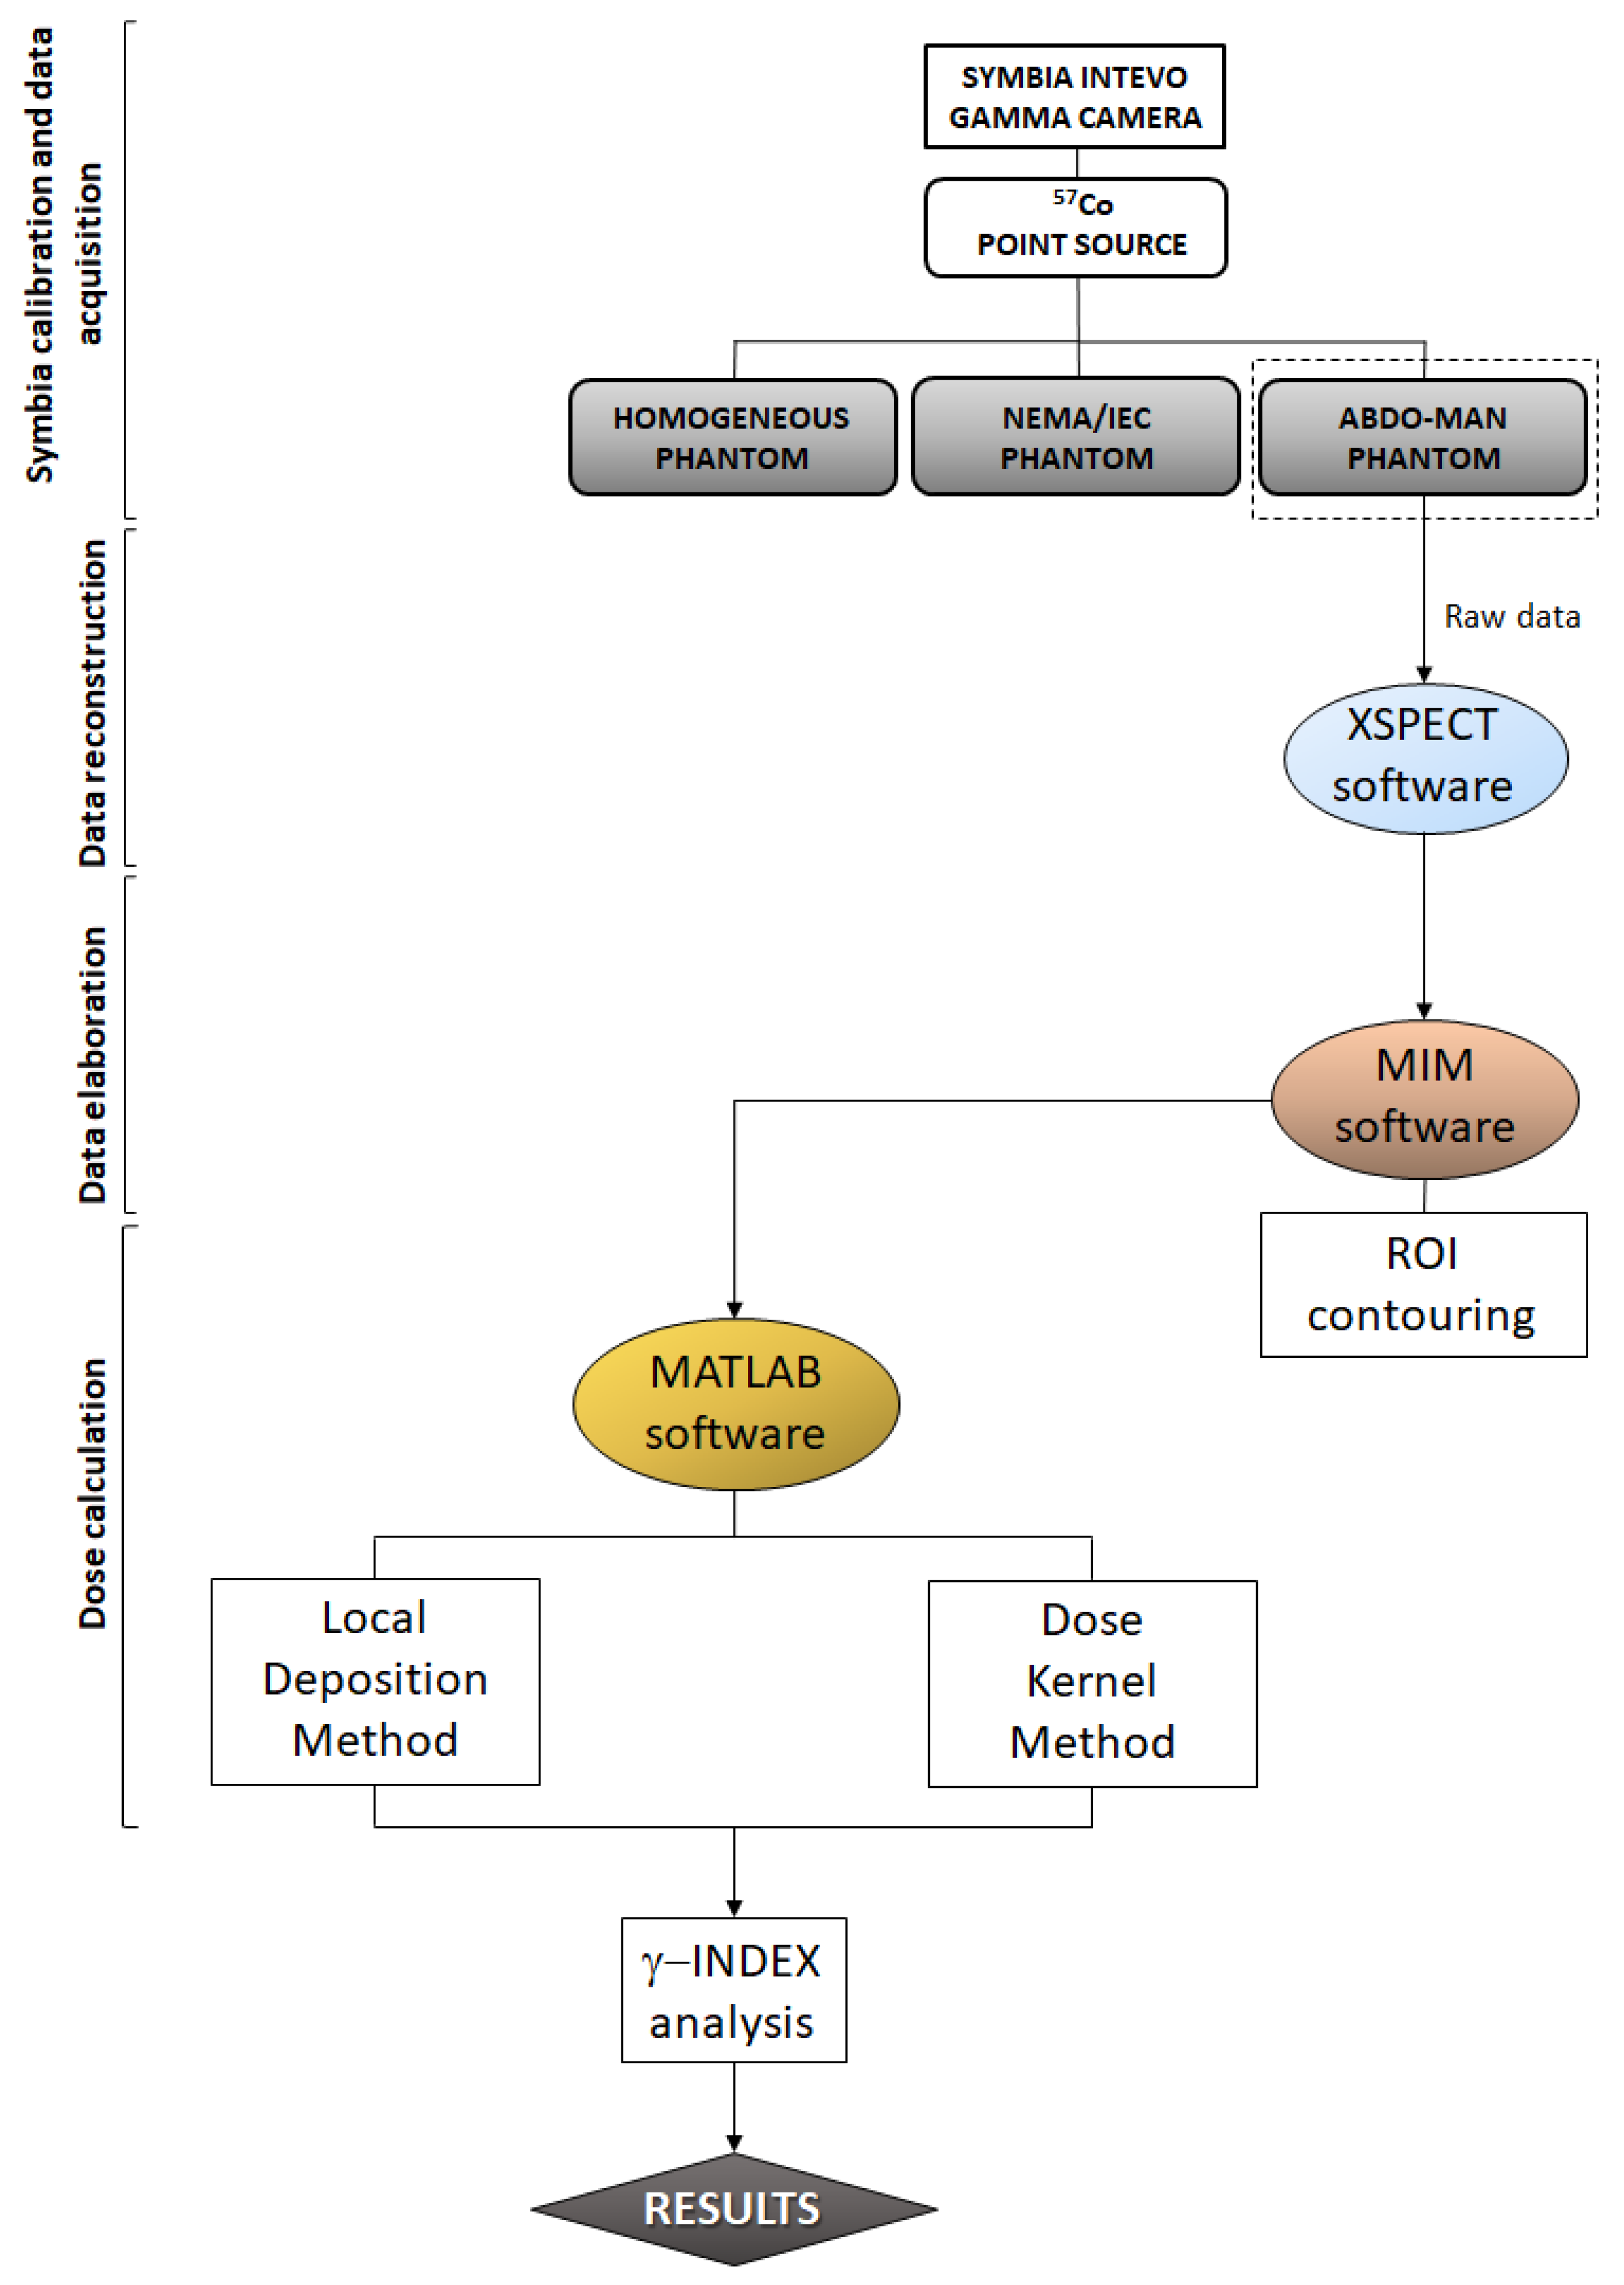
2. Materials and Methods

Activity measurements were performed using a well-type radionuclide calibrator available in our institute and traceable to the Italian National Institute of Ionizing Radiation Metrology for the geometry being measured (accuracy within ±5% at k = 2 level, as recommended by AAPM report 181 [23]). The final relative standard uncertainity on activity quantification was assessed using the approach proposed by D’Arienzo and Cox (Figure 1) [24].
The workflow of the experimental method adopted in this study is reported in Figure 2. Data were acquired by scanning four different reference geometries, both in air and in water as reported in [25]. In particular, a NIST traceable 57Co point source in air (3% accuracy) of (114.7 ± 5.7) MBq at the time of acquisition was used for system energy and sensitivity calibration. A cylindrical homogeneous phantom (Data Spectrum Corporation, Hillsborough, USA) of 6462 mL in volume and filled with a homogeneous 99mTc concentration of 0.03 MBq/mL was used for SPECT calibration. A NEMA/IEC NU2 phantom with six spherical inserts (10, 13, 17, 22, 28 and 37 mm in diameter) filled with a 99mTc activity concentration of (1.74 ± 0.10) MBq/mL was used for recovery coefficient evaluation. The results obtained pertaining this investigation are reported in [26]. Finally, in order to assess the activity accuracy of our SPECT system and to perform a bench-test scenario related to a RE patient-like SPECT imaging acquisition, the AbdoMan anthropomorphic phantom [22] was used. In particular, this phantom is provided with a fillable liver compartment (1783 ml in volume) where three spherical inserts mimicking patient lesions are located: two spherical and homogeneous inserts of 20 mm and 40 mm in diameter and a 40 mm in diameter hollow sphere with 25 mm in diameter fillable inner sphere to simulate a necrotic lesion. A 99mTc activity concentration of (0.103 ± 0.05) MBq/ml and (0.53 ± 0.03) MBq/ml was used for the liver compartment and spherical lesions, respectively, providing a liver-to-lesion concentration of 1:5 (representative of the selective RE treatments currently performed in our institute).

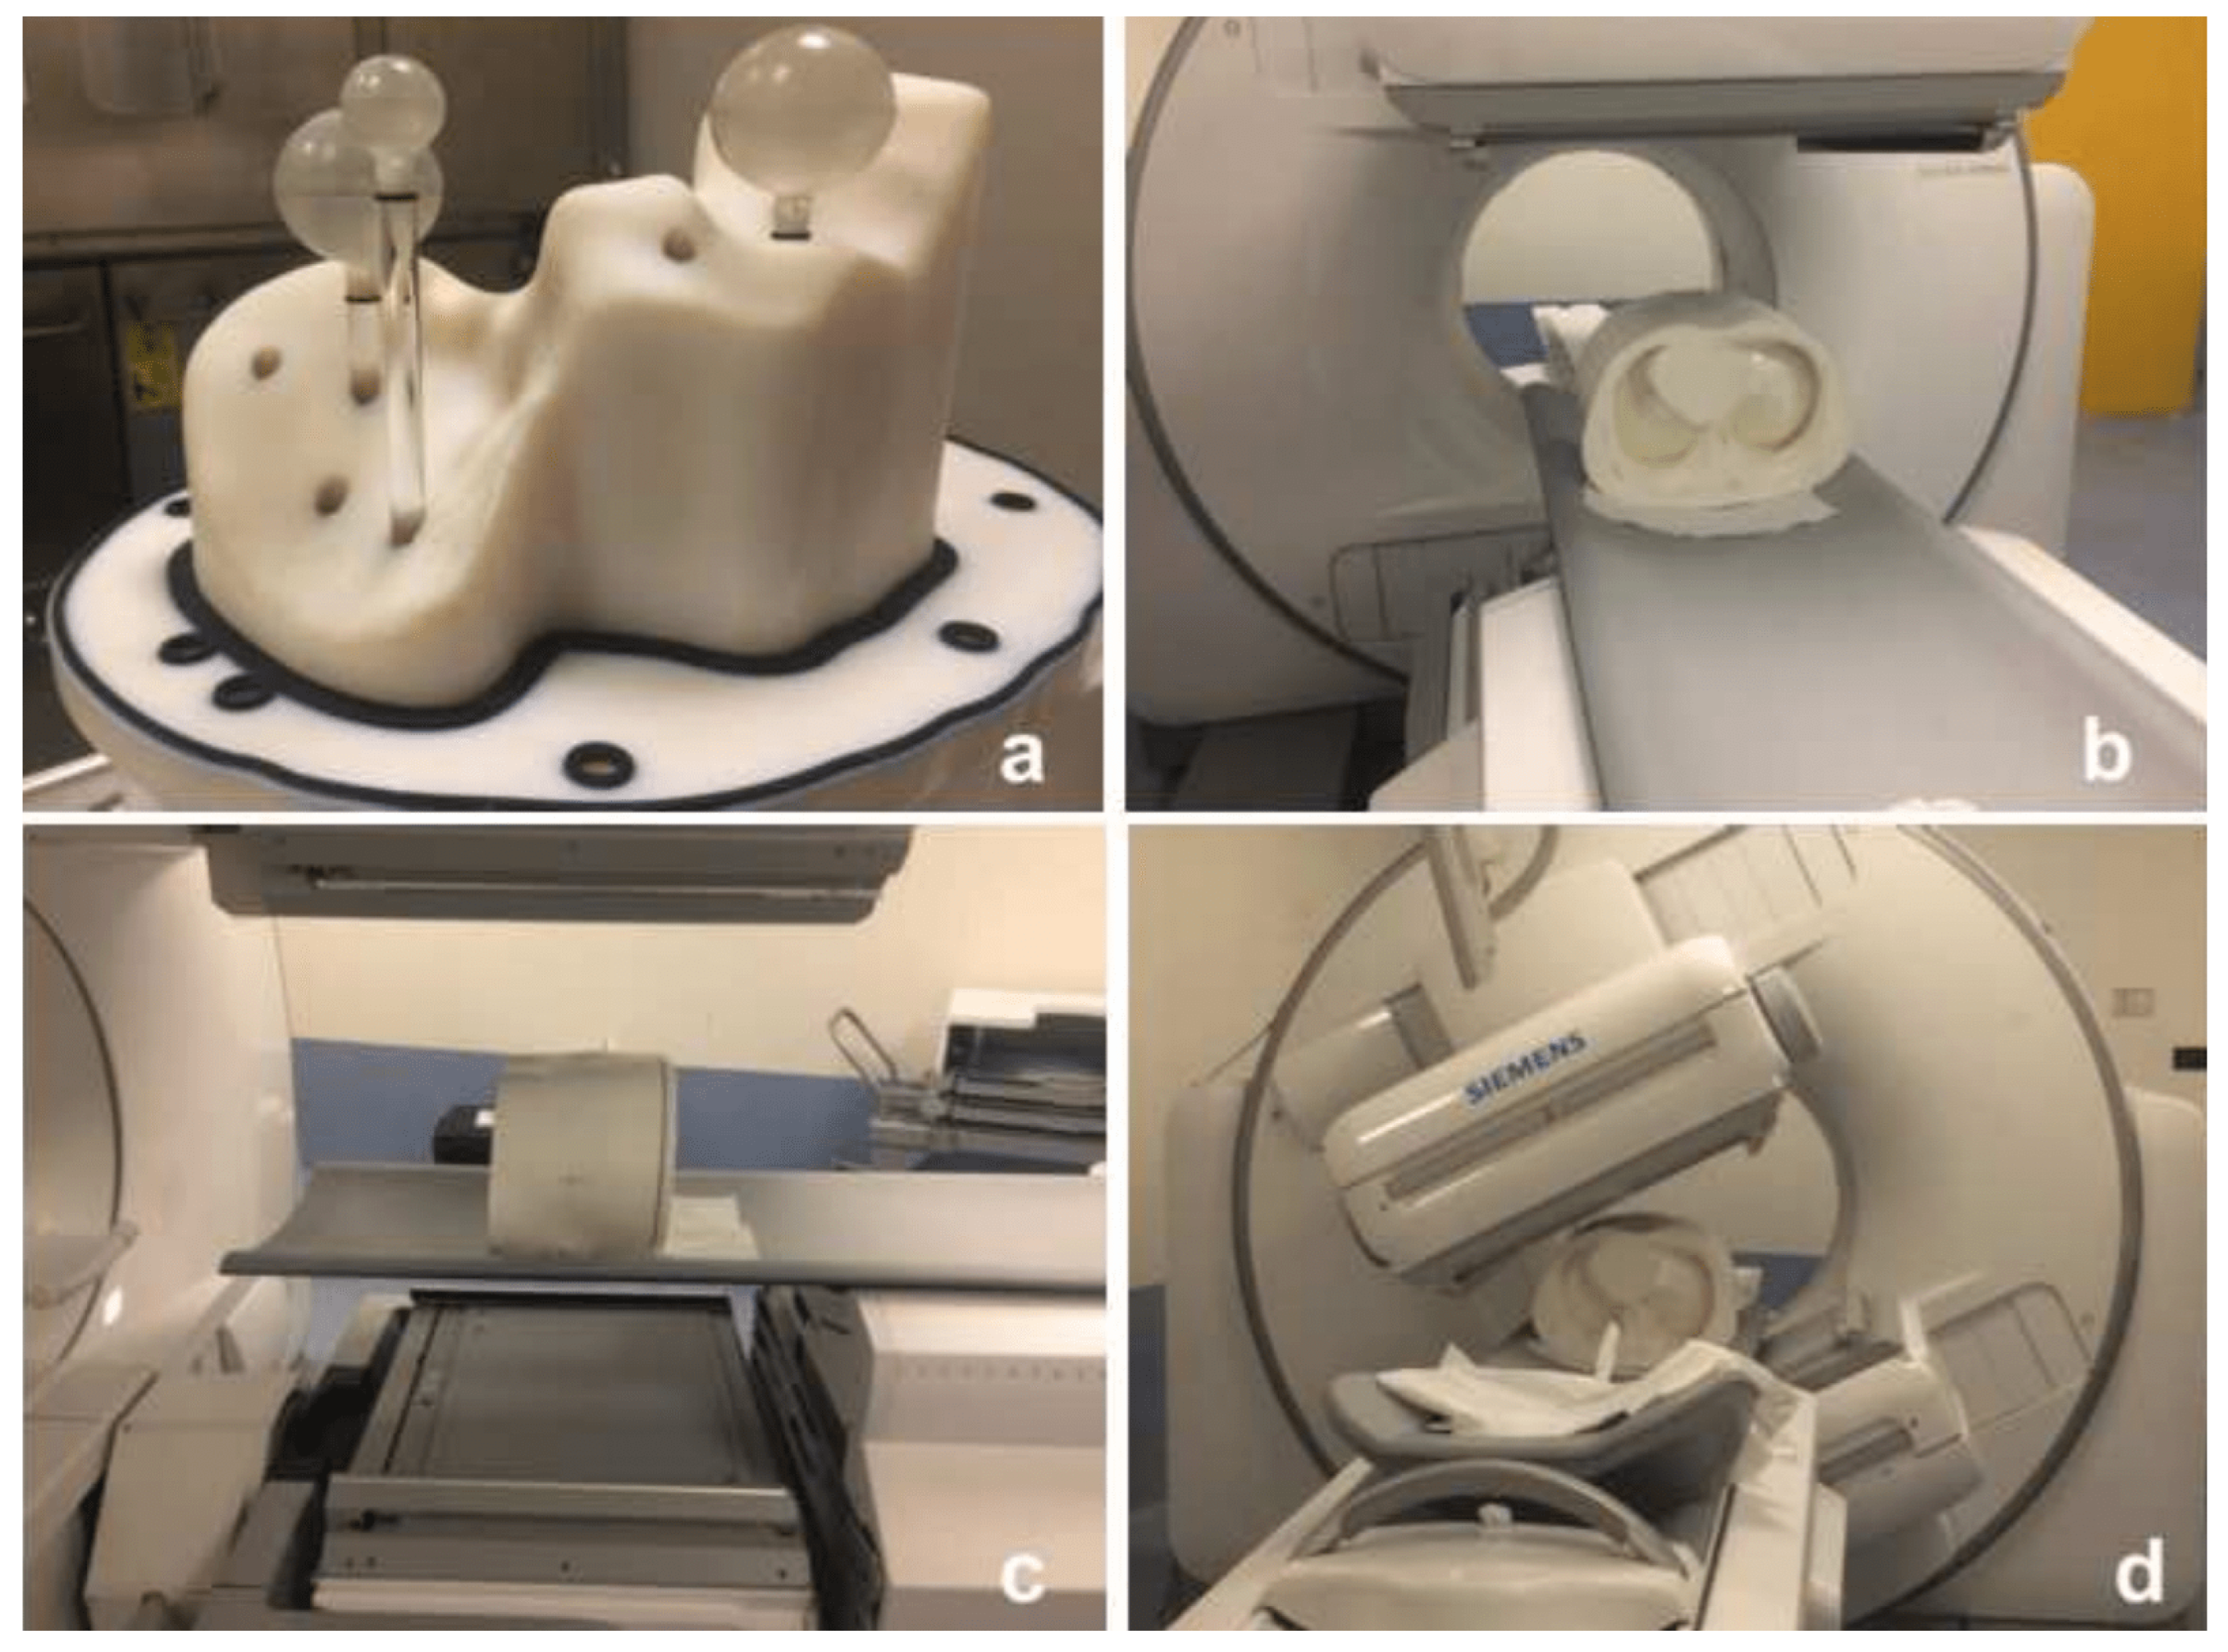
2.1. Data Acquisition and Reconstruction

SPECT/CT imaging was performed with an hybrid dual head gamma camera (Symbia Intevo, Siemens, Erlangen, Germany). In order to simulate clinical conditions, SPECT images were acquired using the protocol currently adopted in our institute for provisional dosimetry of patients undergoing RE treatments. In particular, the SPECT system was equipped with Low Energy High Resolution (LEHR) collimators. For each scan 72 projections were acquired in step & shoot mode, with angular step of 5°. Total angular range was 360° (180° per detector). For each acquisition, circular orbits were performed with the gamma camera at fixed distance from the phantom that was positioned at the center of the field of view. The acquisition time was 30 s per projection. The matrix size was 256 × 256 with a pixel size of 2.39 mm2. A 15% energy window width was used for photopeak emission of 99mTc at 140 keV.
Following emission tomography, a CT scan was performed for each phantom in the axial mode using a tube voltage of 140 kV and matrix size was 512 × 512. The raw SPECT data of the phantoms were reconstructed directly at the Symbia Intevo SPECT/CT workstation by means of the built-in software xSPECT from the same vendor. Ordered Subset Expectation Maximization (OSEM) algorithm, together with attenuation and scatter correction, were used during the SPECT image reconstruction process. In particular, 8 iterations and 4 subsets with no pre- and post-reconstruction filter were used.

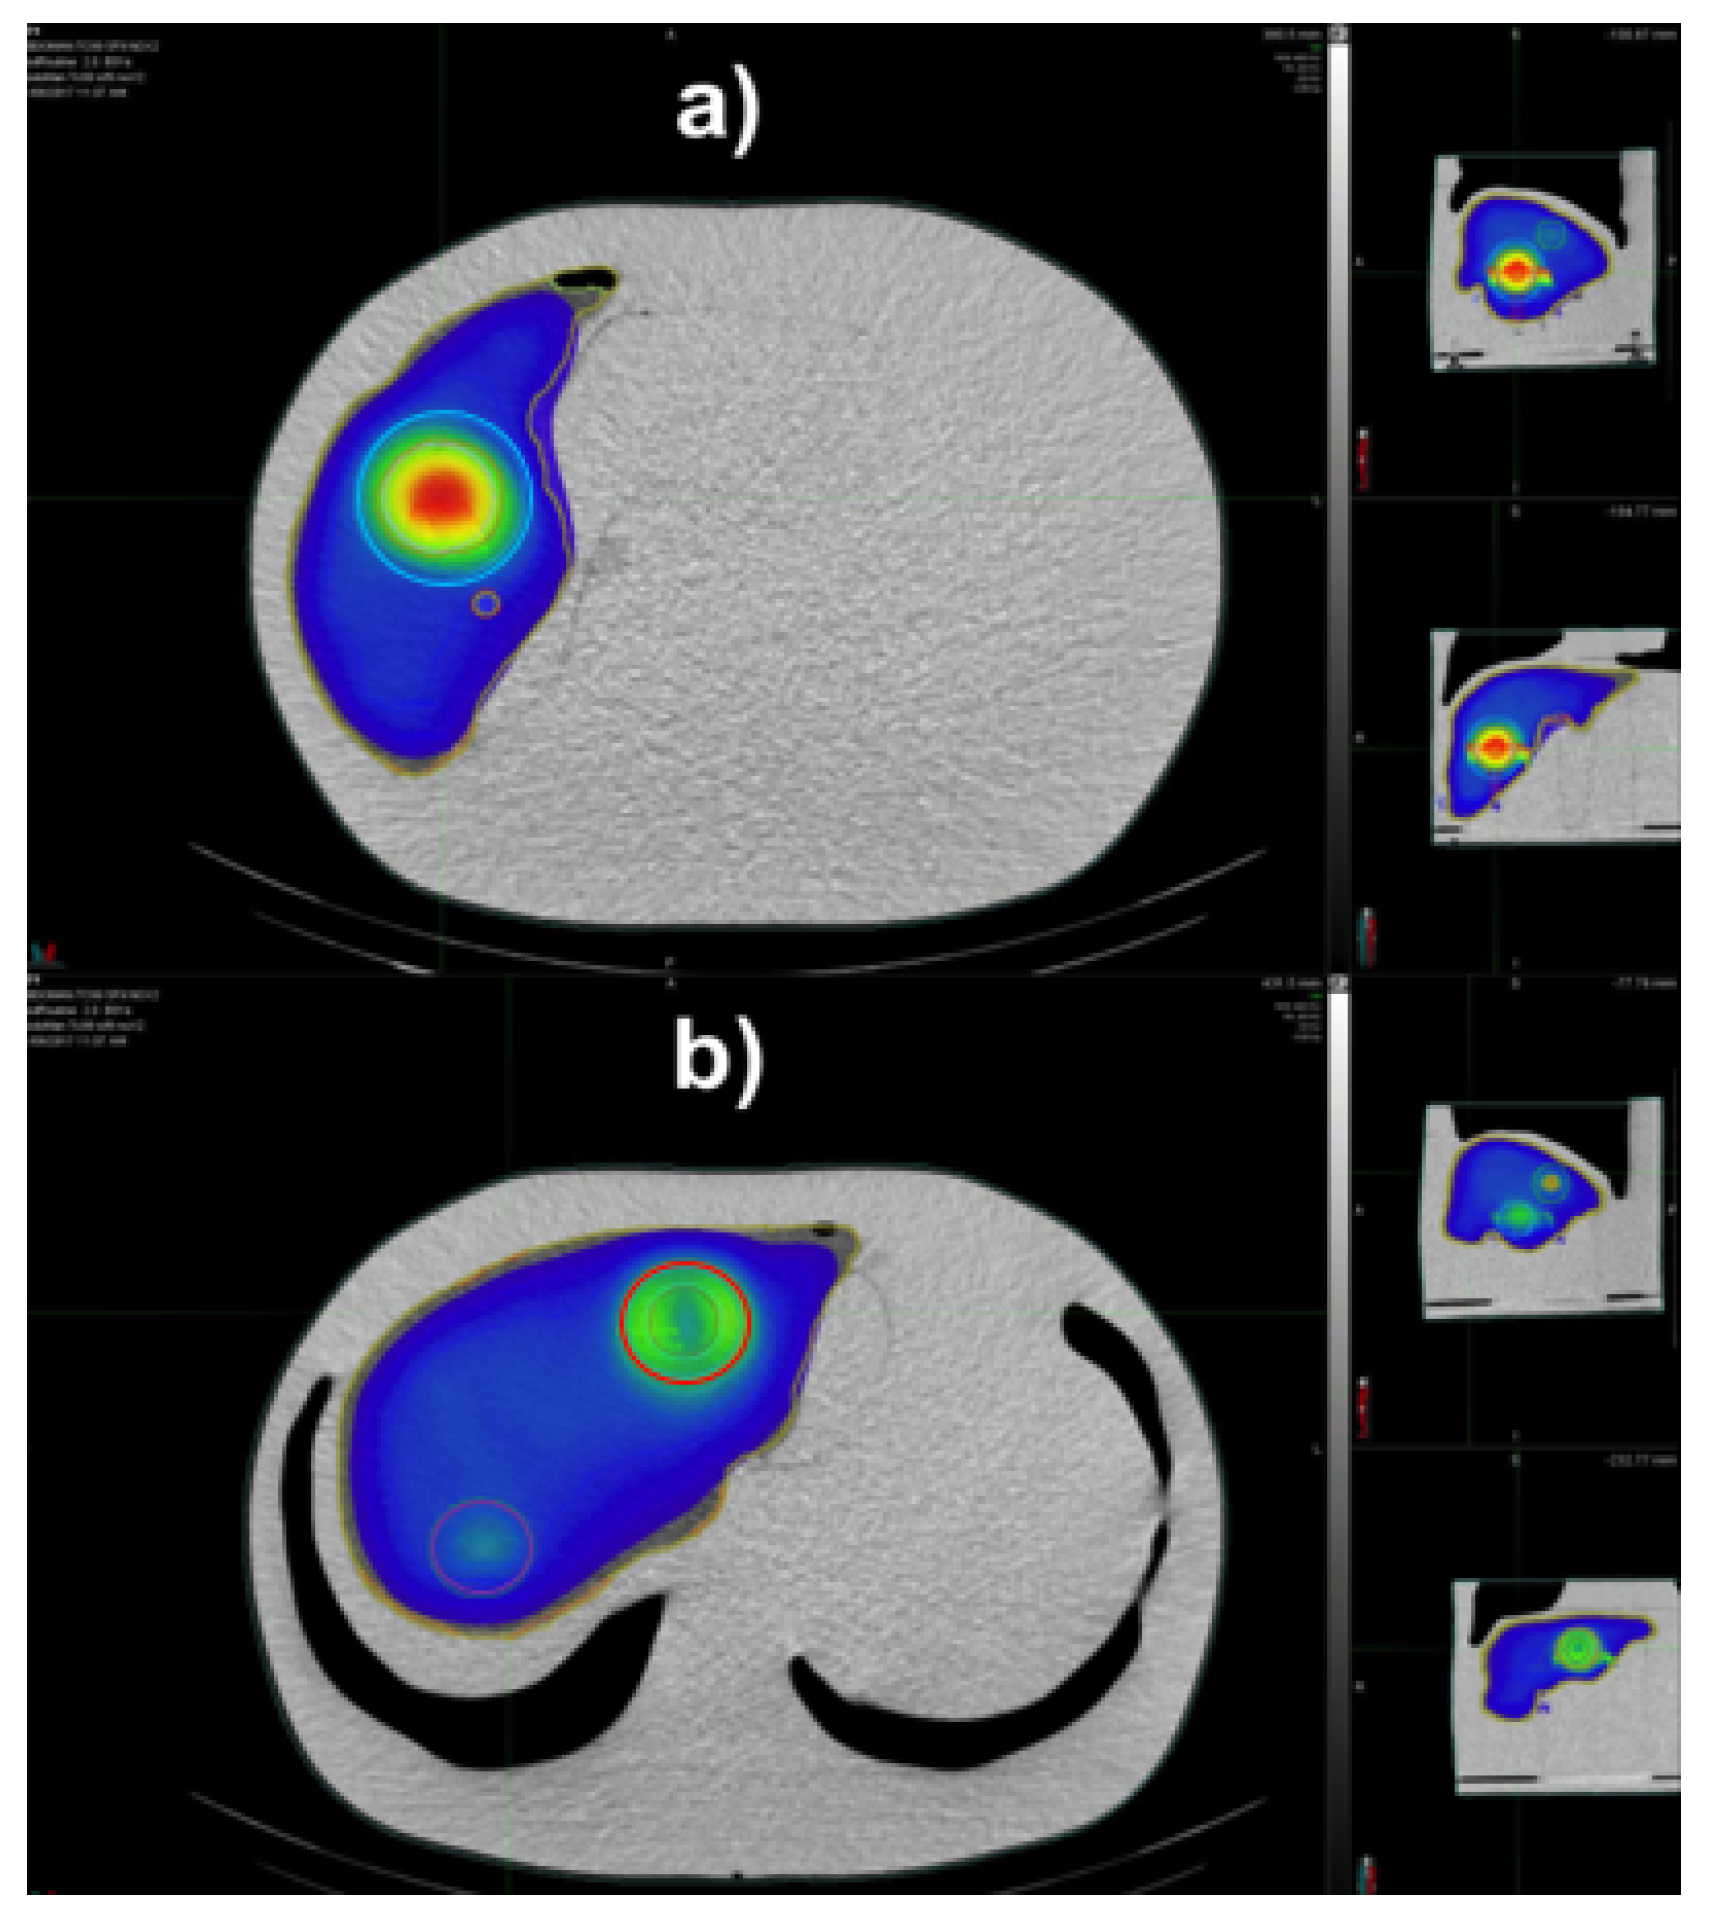
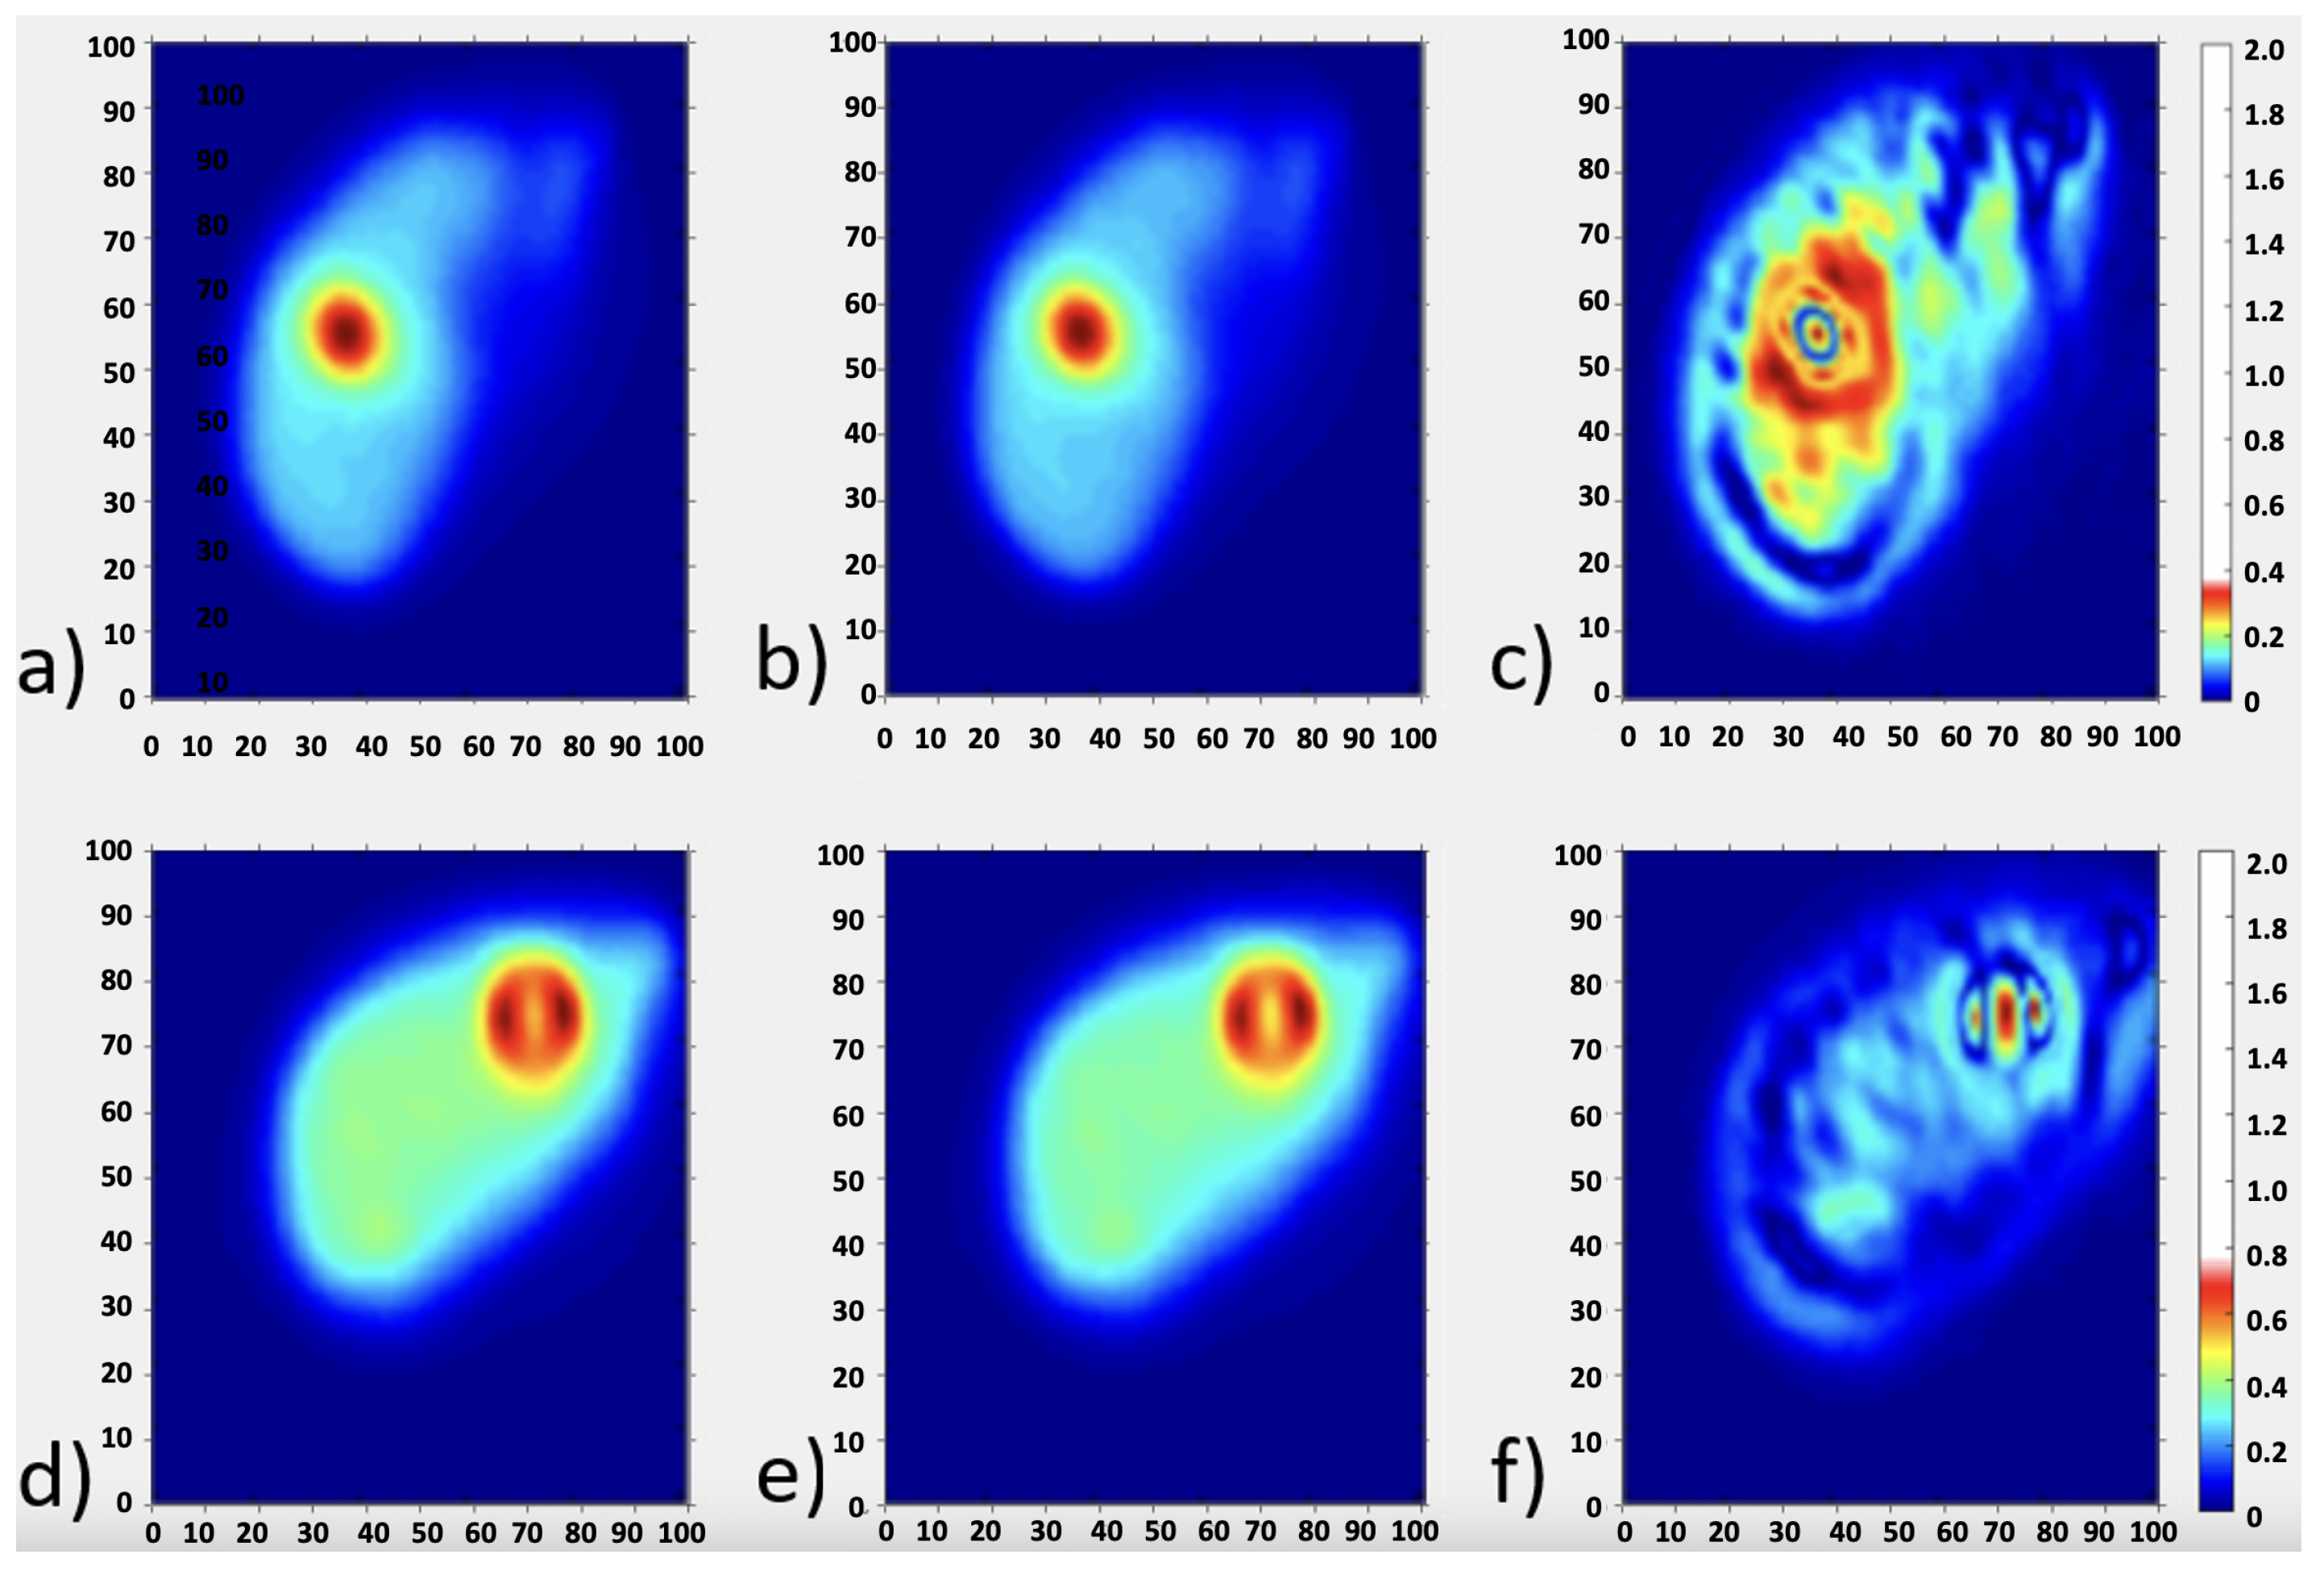
2.2. Image Segmentation, Dose Calculation and Data Comparison

After SPECT/CT reconstruction of the AbdoMan phantom, images were exported in DICOM format from the xSPECT software and imported into the MIM software (v6.1.7 Software, Inc., Cleveland, OH, USA) where volume of interest (VOI) related to the liver compartment and spherical inserts were drawn. SPECT/CT images along with the contoured structures were exported in DICOM format and used as input for a home-made tool developed in MATLAB (R2014b, Natick, MA, USA) that converted reconstructed SPECT activity images into absorbed dose maps. Dose volume histograms (DVH) for the defined structures were also calculated. Dose calculation was performed using both the dose-kernel method (DKM) and the local energy deposition method (LDM). Concerning the DKM, the MATLAB tool tool allows loading the dose kernel generated using EGSnrc Monte Carlo code for the specific dimension of cubic voxels of investigated SPECT [27]. The convolution algorithm implemented in the MATLAB tool allows the calculation of the absorbed dose from 90Y by the convolution of the 3D activity concentration matrix A ( x , y , z ) with the 3D dose kernel for 90Y, K ( x , y , z ) , according to the following equation:
D ( x , y , z ) = 1 λ K ( x , y , z ) A ( x , y , z ) = 1 λ K ( x x , y y , z z ) · A ( x , y , z ) d x d y d z d i s c r e t e s p a c e 1 λ x y z K ( x x , y y , z z ) · A ( x , y , z ) d x d y d z
where A ( x , y , z ) is the 3D activity concentration matrix obtained by product of the reconstructed SPECT phantom data and the SPECT calibration factor, K ( x , y , z ) is the Monte Carlo derived 3D dose-kernel and λ = l n ( 2 ) / T 1 / 2 is the decay constant of 90Y. 90Y resin/glass microspheres are a permanent implant with a relative distribution that does not change after the infusion, having a negligible biological elimination. For the LDM, the energy released by charged particles is assumed to be locally absorbed within the same voxel as the decay. Moreover, the full width at half maximum of the point spread function is assumed be larger than the dose kernel. Hence, the dose at a single voxel can be calculated from the average energy ( E a v g ) released per decay of 90Y based on the probability density function Ψ ( E ) for emission:
E a v g = 0 E × Ψ ( E ) d E = 0.935 M e V = 1.498 × 10 13 J
In addition, the committed total energy released per unit volume, E c o m , by an initial activity concentration A 0 [MBq/mL] in a voxel can be estimated as:
E c o m = A 0 E a v g 0 e λ · t d t = A 0 λ × ( 1.498 × 10 13 ) ( J m L )
Being λ the decay constant of 90Y since microspheres are a permanent implant and there is no biological removal of the radiopharmaceutical. The energy deposited into the voxel, E c o m can be converted into the absorbed dose, D v o x e l , using the voxel density, ρ (kg/mL):
D v o x e l = E c o m ( J / m L ) ρ ( k g / m L )
Equation (4) then becomes:
D v o x e l = A 0 λ ( 1.498 × 10 13 ) ρ ( G y )
And ultimately [28]:
D v o x e l ( G y ) = A 0 ( B q m L ) ( 4.986 × 10 8 ) ( J · s ) ρ ( k g / m L )
Using Equations (1) and (6), the MATLAB tool generates two dose matrixes in *.mat format as well as in RTDOSE-DICOM format. The obtained dose matrixes have been compared each other by means of the 3D γ -index method [29] using the 2%–2 mm, 1%–1 mm criteria and the one obtained by means of the DKM was used as reference in the comparison. Finally, a comparison between the DVHs obtained for the AbdoMan VOIs and those generated using Monte Carlo simulation [22,30] (considered as reference) was performed in order to assess pros and cons of a provisional 90Y based on 99mTc-MAA SPECT acquisition. In particular, estimated doses and volumes of DVHs were obtained from the plots of Gear et al. [22] using the web-based software https://automeris.io/WebPlotDigitizer/ (accessed on 21 September 2021). DHVs were scaled to take in account the differences in used total activity with respect to the one reported in Gear et al., while preserving the relative activity concentrations in all the insertions.

3. Results

In Table 1 the nominal and reconstructed activity concentrations of the liver compartment and spherical inserts considered in the AbdoMan phantom are reported, together with their relative deviations. The largest difference was found for the 40 mm diameter hollow sphere, most likely due to the intrinsic limitation in resolution of the SPECT system and the presence of partial volume effects (PVE) which result in an underestimated dose value (−26.4%). In fact, the 40 mm hollow sphere is provided with a 25 mm solid inner representing the deposition of microspheres in a thin rim (i.e., 15 mm, comparable with the SPECT spatial resolution). As the VOI’s volume exceedes the SPECT spatial resolution, the differences between the activity concentration drops, with deviations of −3.8%, +1.9% and +1.0% for the 20 mm, 40 mm sphere and liver compartment, respectively. As expected, the minor underestimation (−3.8%) of the small 20 mm can be imputable to PVE. The quantitative accuracy is confirmed by visual inspection of the color wash dose maps reported in Figure 3 for the 40 mm sphere (Figure 3a, cyan circle) and the 40 mm hollow sphere (Figure 3b, red circle). Figure 3a shows a uniform dose distribution with minor blurring at the edge of the sphere due to spill-out effects. Figure 3b shows both the 40 mm hollow sphere and the 20 mm solid sphere. The apparent activity resulting inside the hollow sphere in Figure 3b is due to spill-out of counts from the object edges to the sphere core.
Figure 4 shows the dose maps obtained by means of the two dose calculation methods: (a,d) DKM and (b,e) LDM at different slices of the AbdoMan phantom. In particular, the central section of the 40 mm sphere is reported in Figure 4a,b, while the 20 mm sphere and 40 mm hollow sphere are reported in Figure 4d,e. The quantitative comparison in terms of γ -map on the same slices considered are reported in Figure 4c,f. As shown, there are no regions of the map where the γ -index violates the imposed criteria. In particular, the 3D γ -index provided a passing rate of 100% and 99.9% for the criteria 2%–2 mm and 1%–1 mm, respectively, showing that the two dose methods resulted to be equivalent.
In terms of dose difference between the SPECT absorbed dose obtained by means of LDM and DKM and related to the AbdoMan inserts and liver compartment, the results are reported in Table 2. Our results indicate that the xSPECT software in combination with dose kernel and local energy deposition methods is likely to provide satisfactory results, with differences estimates within 5% (20 mm and 40 mm hollow sphere) and 10% (40 mm sphere).
Cumulative DVHs reported in Figure 5 were generated by means of the LDM and DKM. Recovery coefficients for our SPECT/CT system (0.86, 0.75 and 0.92 for the 40 mm, 20 mm and 40 mm hollow sphere, respectively) were used to account for partial volume effects [26].
For the 40 mm diameter sphere the DVH shows a slow fall-off referred to the spill-out effect, while for the 20 mm and the 40 mm hollow sphere the DVH drops more rapidly due to intrinsic limitation of the SPECT system.
Of note, our results compare with varying degrees of accuracy with those reported by Gear et al. [22]. The DVH related to the 40 hollow sphere is in excellent agreement with (rescaled) MC-based DVH (Figure 6a), assumed to be the reference. As expected, the 20 mm sphere results in lower dose values when compared with MC data (Figure 6b) obtained for the same sphere. Along the same lines, the DVH of the 40 mm hollow sphere differs from DVH assessed by MC calculation (Figure 6c). As already discussed, most likely such differences are due to the intrinsic limitation in resolution of the SPECT system and the presence of partial volume effects (PVE) which result in a systematic underestimation of dose values. Finally, for the liver compartment the same results found between liver and MC DVHs in [22] have been confirmed in this study (Figure 6d).

4. Discussion

RE with 90Y- μ s represents a well established treatment option in radiation therapy of HCC and metastatic liver lesions thanks to the peculiar modality of 90Y- μ s administration. In fact, radiolabeled particles are injected through the hepatic artery and become trapped at the precapillary level emitting lethal internal radiation. This mechanism limits exposure to the surrounding normal parenchyma, thereby permitting higher dose delivery than with external beam radiotherapy. However, healthy liver may receive a dosage higher than the tolerance dose when non-dosimetric methods are adopted for the selection of the 90Y- μ s activity to be injected. In addition, microspheres can be transported into the vascular territory of the gastrointestinal organs, resulting in severe damage in less than 5% of RE cases [7]. Thus, accurate treatment planning is mandatory to ensure a good therapeutic outcome menawhile limiting side effects.

4.1. Role of Predictive Dosimetry with 99mTc-MAA SPECT
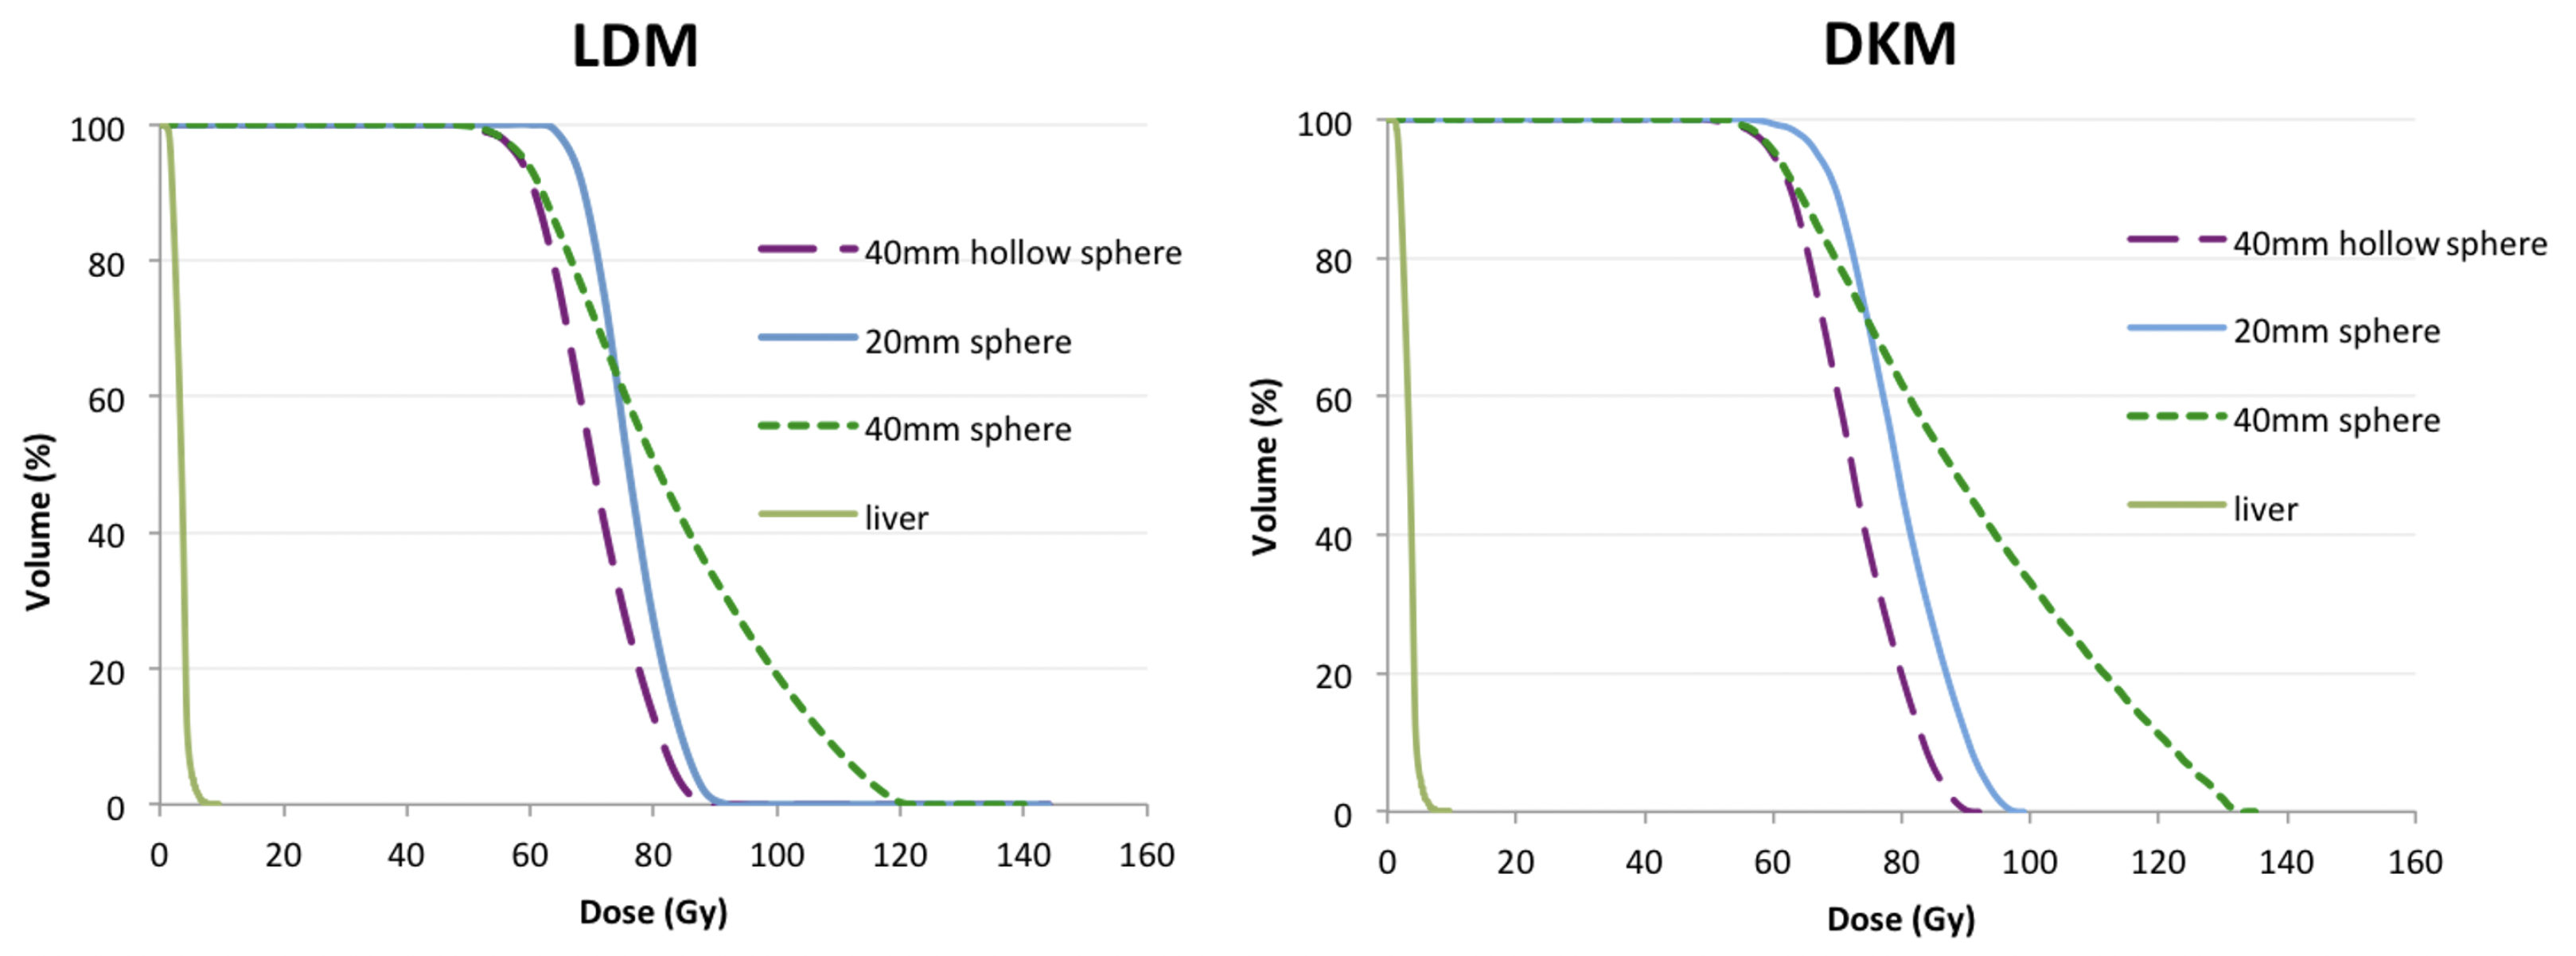
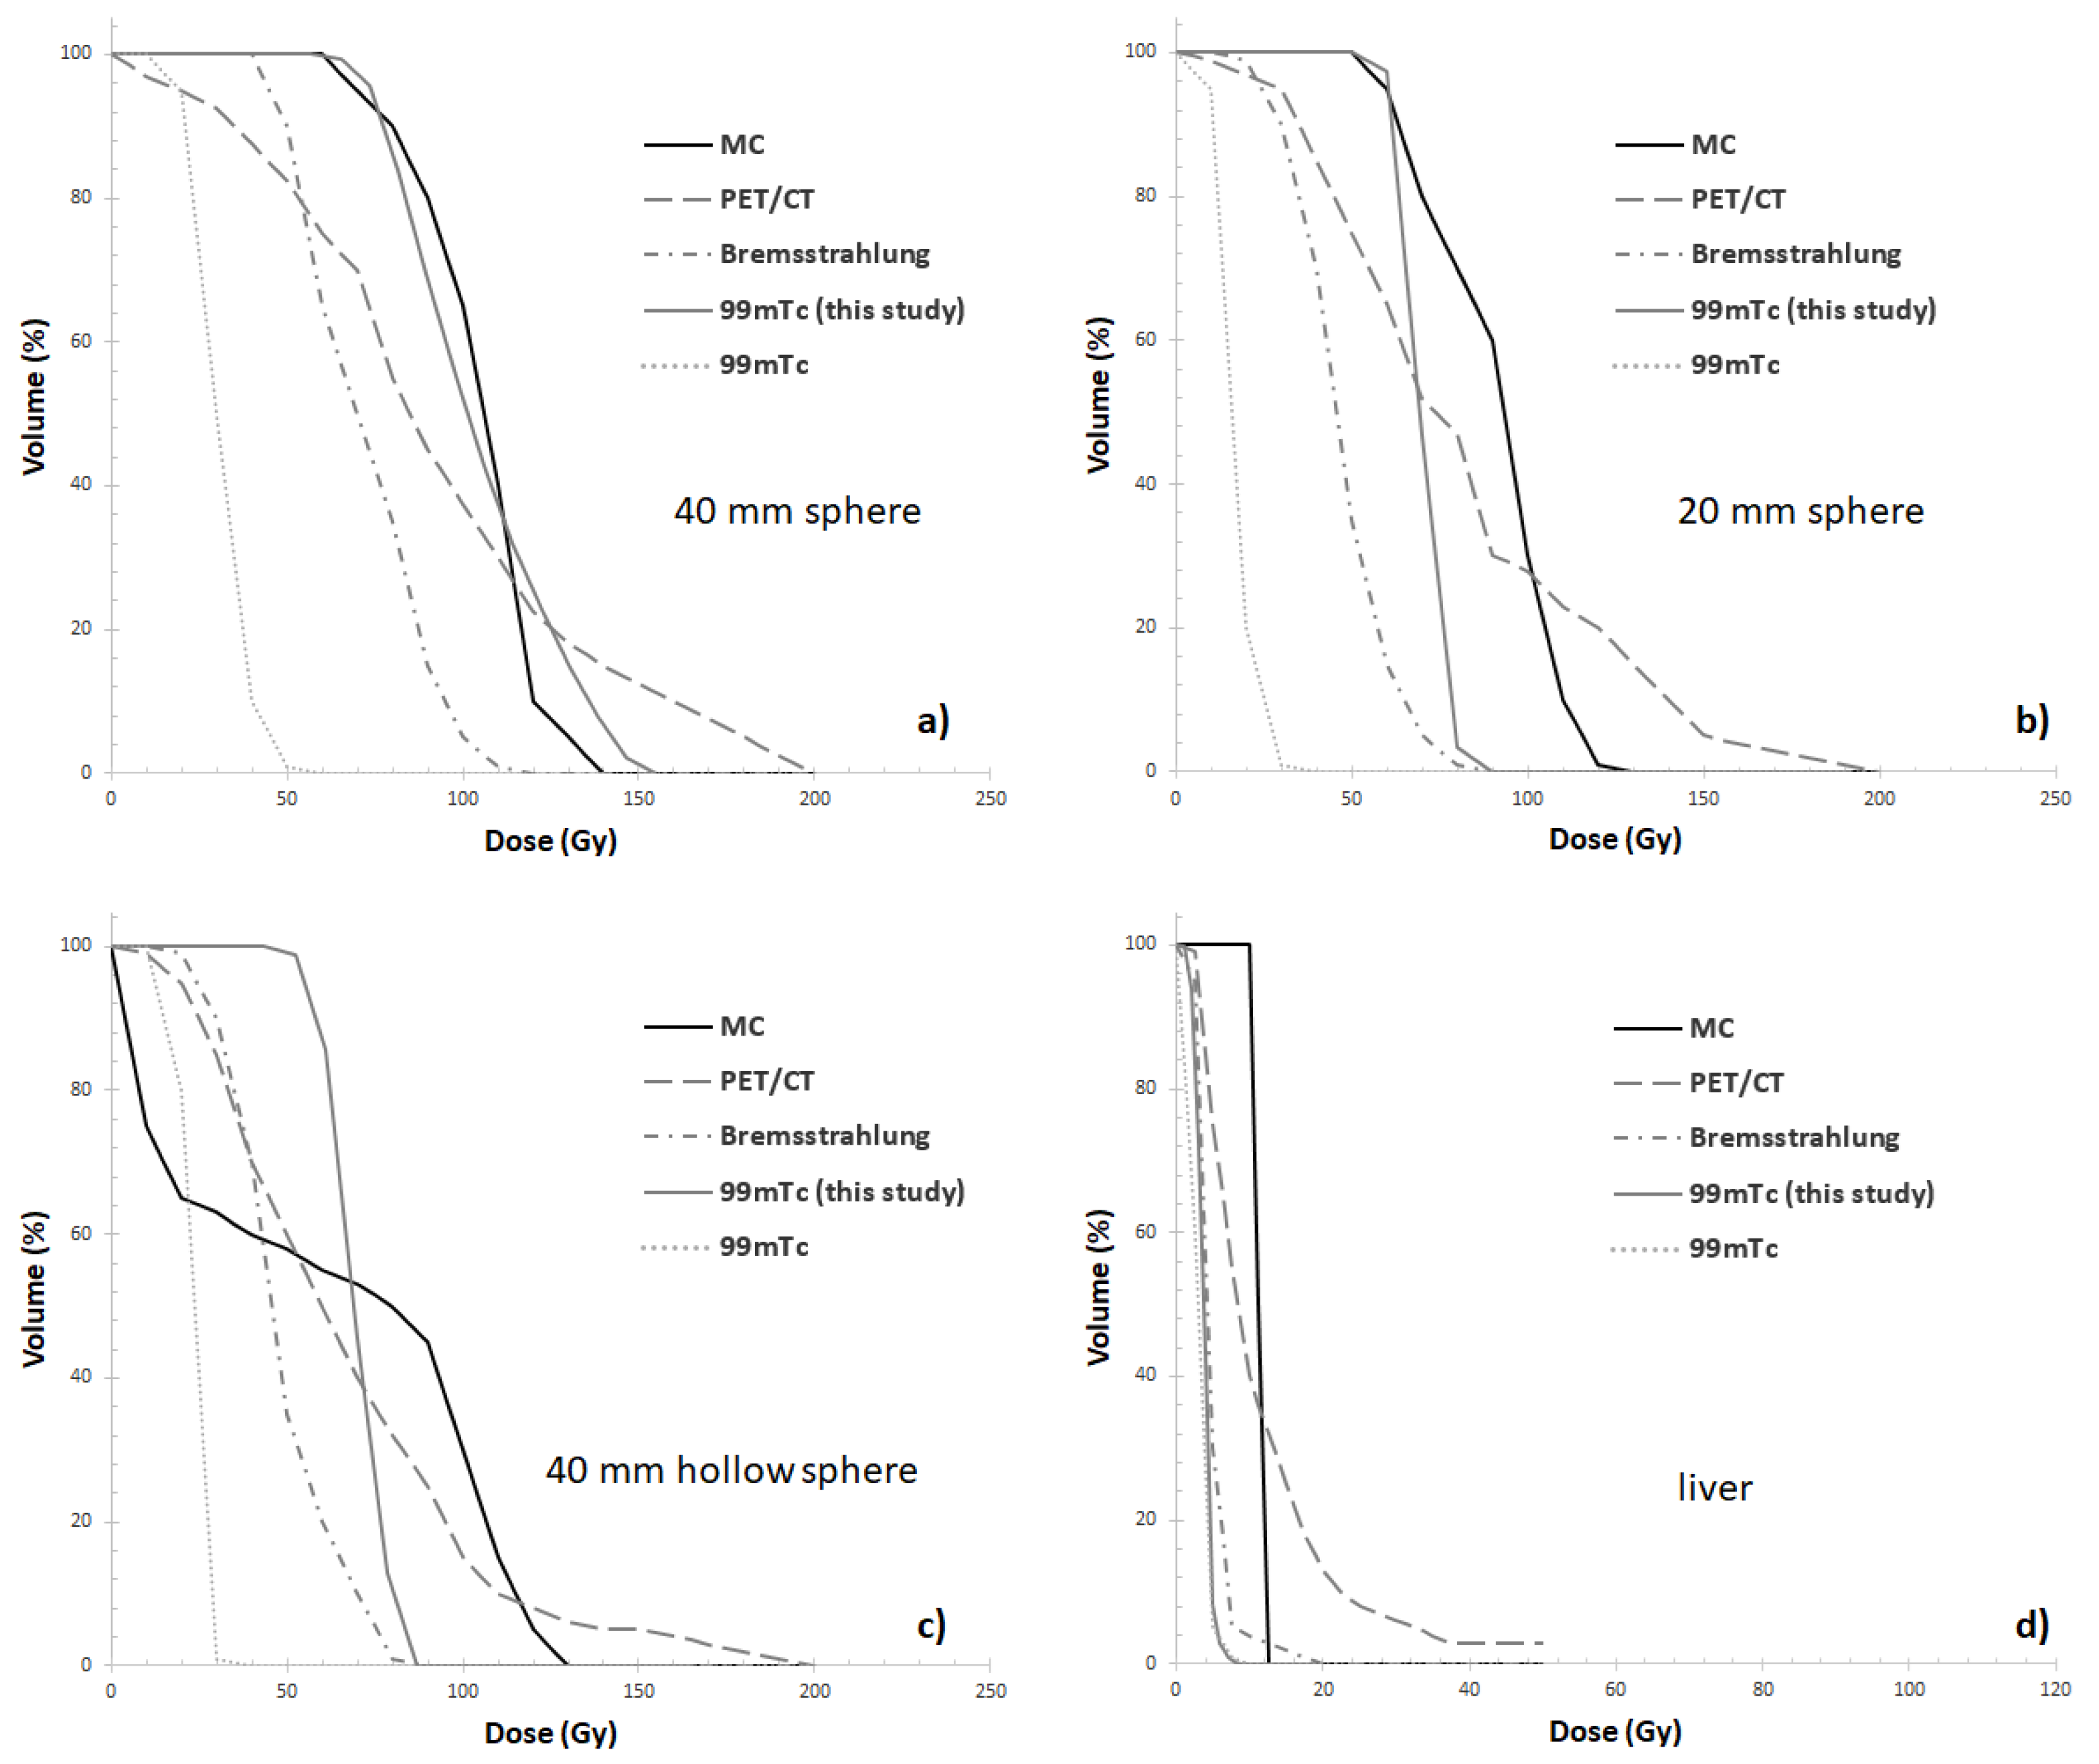
Nowadays, the use of PET/CT systems for 90Y- μ s dosimetry purposes is a well established approach since 90Y PET reflects the tumor heterogeneity better than traditional bremsstrahlung 90Y SPECT [28,31,32]: this is crucial to obtain reliable estimates of 90Y- μ s activity distribution, essential for the assessment of the dose delivered to hepatic tumours. However it should be noted that 90Y-PET can be performed after the administration of micropsheres thereby allowing only for post-therapy dosimetry.
At present, predictive dosimetry with 99mTc-MAA SPECT has been demonstrated to improve the average quality of treatment and recent EANM guidelines encourages the use of 99mTc-MAA for therapy optimization [33]. However it should be stressed that the potential to perform accurate dosimetric treatment planning relies on the predictive accuracy of 99mTc-MAA for 90Y microsphere distribution and the general consensus is that the decision to treat an individual solely on the bases of the predicted lesion-absorbed dose is a delicate matter [33]. Moreover, the predictive value for dose evaluation based on 99mTc-MAA SPECT is still subject of debate in the literature [20,21].
Against this backdrop, our study aims to support the use of 99mTc-MAA SPECT acquisition for provisional dosimetry along with the local energy deposition method to convert reconstructed SPECT data into absorbed dose maps. In particular, as long as 99mTc-MAA SPECT reconstructions are related to liver lesions with dimension comparable to the 40 mm in diameter sphere, the absorbed dose computed by means of the local energy deposition method can lead to results in line with those obtained by Monte Carlo computation. Our findings confirm previous research [28]. This is because the tumor dimension exceeds the SPECT system resolution and has the potential to overcome or reduce image artifacts (e.g., PVE). On the other hand, 99mTc-MAA SPECT reconstructions related to small liver lesions (approximately 20 mm) or larger areas presenting an hypoxic necrotic core should be analyzed with care for a correct interpretation in a clinical setting.

4.2. DVH Analysis

Regarding DHVs analysis, in the present study the DVHs of the 40 mm sphere is in excellent agreement with MC, while larger deviations were found for smaller lesions and for the liver compartment. Of note, only the DVH of the 40 mm sphere is superior to 90Y-PET/CT data found in [22]. Moreover, in the range 50–60% of cumulative dose-volume related to 40 mm hollow sphere, the absorbed dose values related to 90Y-PET/CT [22] and our 99mTc-MAA SPECT/CT compare favourably with MC data.
The large deviation found for the liver compartment with respect to the MC DVH (Figure 6d) is in agreement with what reported by Gear et al [22]. In the present study only the liver compartment was contoured using an automated segmentation technique. In future work, investigating the impact of the segmentation method on the accuracy of dose estimates might prove important.
The present study adds to a growing corpus of research showing the potential accuracy of the local deposition method for absorbed dose calculations in molecular radiotherapy. In addition, these findings provide additional information on the use of 3D printed printing technology in molecular radiotherapy. In fact, the demand for 3D printed phantoms is constantly rising and gaining an ever-increasing interest not only in nuclear medicine [34,35,36], but also in diagnostic radiology [37] and radiation therapy [38]. In particular, in the field of nuclear medicine, PET/CT and SPECT/CT scanner validation is a key requirement to participate in multicenter clinical studies. This essential to ensure comparability between various scanner types and brands. At present, nuclear imaging systems are generally validated under different clinical scenarios using physical phantoms based on hollow cylinders containing hollow spheres, which present a somewhat limited geometric complexity. The recent introduction, over the last 10 years of 3D printing techniques allows the reparation of phantoms of almost any shape, including anthropomorphic phantoms including different organs and highly irregular tumor lesions. Future research should continue to explore the validation of dose calculation algorithms and imaging correction techniques on 3D printed phantoms to assess the uncertainty in the measurement processes involved in internal absorbed dose calculations.

5. Conclusions

In conclusion, our study suggests that the use of 99mTc SPECT acquisitions, together with the local energy deposition dose computational method, outperforms bremsstrahlung SPECT imaging and provide results similar to Monte Carlo calculation for liver lesions exceeding the SPECT resolution limit. For liver lesions with hypoxic necrotic core or lesions whose size is close to the SPECT system resolution, a preliminary characterization of the system should be performed comparing the scanner performance against a reference phantom or geometry standard. Against this backdrop, an accurate characterization of the SPECT scanner has the potential to provide a set of quantifiable results and specific metrics that may serve as a point of reference against which clinical data can be compared. Further research is needed to extend results to different SPECT/CT systems and additional anthropomorphic phantom. In addition, further studies aiming at assessing the impact of different image processing/reconstruction software could prove quite beneficial to the literature.

Author Contributions

Conceptualization, S.U., M.D. and L.S.; methodology, E.M., S.U. and S.U.; validation, G.P., E.M. and S.R.; formal analysis, S.U., M.D. and E.M.; investigation, S.U. and M.D.; data curation, S.U., M.D., G.P., G.V. and A.S.; writing—original draft preparation, S.U., L.S., A.I. and M.D.; writing—review and editing, E.M., M.D. and L.S.; supervision R.S.; project administration, R.S. and L.S. All authors have read and agreed to the published version of the manuscript.

Funding

This work was partially supported by the grant from the Associazione Italiana per la Ricerca sul Cancro (AIRC) to LS (IG #20809).

Institutional Review Board Statement

Not applicable.

Informed Consent Statement

Not applicable.

Acknowledgments

The AbdoMan phantom used in this research work was kindly provided by J. Gear and G. Flux.

Conflicts of Interest

The authors declare no conflict of interest.

Abbreviations

The following abbreviations are used in this manuscript:
RERadioembolization
SPECTSingle Photon Emission Computed Tomography
OSEMOrdered Subset Expectation Maximization
CTComputed Tomography
VOIVolume of Interest
PETPositron Emission Tomography
MAAMacroaggregated Albumin
DKMdose kernel method
LDMlocal energy deposition method
DVHsdose volume histograms
μ smicrospheres
EBRTExternal Beam Radiotherapy

References

  1. Ferlay, J.; Soerjomataram, I.; Dikshit, R.; Eser, S.; Mathers, C.; Rebelo, M.; Parkin, D.M.; Forman, D.; Bray, F. Cancer incidence and mortality worldwide: Sources, methods and major patterns in globocan 2012. Int. J. Cancer 2015, 5, E359–E386. [Google Scholar] [CrossRef] [PubMed]
  2. Bray, F.; Ren, J.S.; Masuyer, E.; Ferlay, J. Estimates of global cancer prevalence for 27 sites in the adult population in 2008. Int. J. Cancer 2013, 132, 1133–1145. [Google Scholar] [CrossRef] [PubMed]
  3. Altekruse, S.F.; McGlynn, K.A.; Reichman, M.E. Hepatocellular carcinoma (hcc) incidence, mortality, and survival trends in the united states from 1975 to 2005. J. Clin. Oncol. 2009, 27, 1485–1491. [Google Scholar] [CrossRef] [PubMed] [Green Version]
  4. Zurkiya, O.; Ganguli, S. Beyond hepatocellular carcinoma and colorectal metastasis: The expanding applications of radioembolization. Front. Oncol. 2014, 150, 2850. [Google Scholar] [CrossRef] [Green Version]
  5. Sato, K.T.; Lewandowski, R.J.; Mulcahy, M.F.; Atassi, B.; Ryu, R.K.; Gates, V.L.; Nemcek, A.A.; Barajat, O.; Benson, A.; Mandal, R.; et al. Unresectable chemorefractory liver metastases: Radioembolization with 90Y microspheressafety, efficacy, and survival. Radiology 2008, 247, 507–515. [Google Scholar] [CrossRef]
  6. Cutsem, E.V.; Cervantes, A.; Adam, R.; Sobrero, A.; Krieken, J.H.V.; Aderka, D.; Aguilar, E.A.; Bardelli, A.; Benson, A.; Bodoky, G.; et al. Esmo consensus guidelines for the management of patients with metastatic colorectal cancer. Ann. Oncol. 2016, 27, 1386–1422. [Google Scholar] [CrossRef]
  7. Ahmadzadehfar, H.; Sabet, A.; Biermann, K.; Muckle, M.; Brockmann, H.; Kuhl, C.; Wilhelm, K.; Biersack, H.-J.; Ezzidin, S. The significance of 99mTc SPECT/CT liver perfusion imaging in treatment planning for 90Y-microsphere selective internal radiation treatment. J. Nucl. Med. 2009, 51, 1206–1212. [Google Scholar] [CrossRef] [Green Version]
  8. Sato, K.; Lewandowski, R.J.; Bui, J.T.; Omary, R.; Hunter, R.D.; Kulik, L.; Mulcahy, M.; Chrisman, H.; Nemcek, A.A.; Vogelzang, R.; et al. Treatment of unresectable primary andmetastatic liver cancer with yttrium-90 microspheres (TheraSphere): Assessment of hepatic arterial embolization. Cardiovasc. Intervent. Radiol. 2006, 29, 522–529. [Google Scholar] [CrossRef]
  9. Lam, M.G.; Goris, M.L.; Iagaru, A.H.; Mittra, E.S.; Louie, J.D.; Sze, D.Y. Prognostic utility of 90Y radioembolization dosimetry based on fusion 99mTc macroaggregated albumin-99mTc-sulfur colloid spect. J. Nucl. Med. 2013, 12, 2055–2061. [Google Scholar] [CrossRef] [Green Version]
  10. Garin, E.; Rolland, Y.; Lenoir, L. Utility of quantitative 99mTc SPECT/CT for yttrium labelled microsphere treatment planning: Calculating vascularized hepatic volume and dosimetric approach. Int. J. Mol. Imaging 2011, 2011, 51. [Google Scholar] [CrossRef]
  11. Hamami, M.E.; Poeppel, T.D.; Muller, S.; Heusner, T.; Bockisch, A.; Hilgard, P.; Antoch, G. Spect/ct with 99mTc-MAA in radioembolization with 90y microspheres in patients with hepatocellular cancer. J. Nucl. Med. 2009, 50, 688–692. [Google Scholar] [CrossRef] [PubMed] [Green Version]
  12. Srinivas, S.; Shrikanthan, S.; Yu, N.; Kost, S.; Gurajala, R.; Karuppasamy, K. Treatment Planning Part Thesis Ii: Procedure Simulation And Prognostication. In Handbook of Radioembolization: Physics, Biology, Nuclear Medicine, and Imaging; Pasciak, A., McKinney, J., Bradleyed, Y., Eds.; CRC Press/Taylor & Francis: Boca Raton, CA, USA, 2017; p. 70. [Google Scholar]
  13. Kao, Y.H.; Tan, A.E.H.; Burgmans, M.C.; Irani, F.G.; Khoo, L.S.; Lo, R.H.G.; Tay, K.H.; Tan, B.S.; Chow, P.K.; Eng, D.C.; et al. Image-guided personalized predictive dosimetry by artery-specific SPECT/CT partition modeling for safe and effective 90Y radioembolization. J. Nucl. Med. 2012, 53, 559–566. [Google Scholar] [CrossRef] [PubMed] [Green Version]
  14. Strigari, L.; Sciuto, R.; Rea, S.; Carpanese, L.; Pizzi, G.; Soriani, A.; Iaccarino, G.; Benassi, M.; Ettorre, G.M.; Maini, C.L. Efficacy and toxicity related to treatment of hepatocellular carcinoma with 90y-sir spheres: Radiobiologic considerations. J. Nucl. Med. 2010, 9, 1377–1385. [Google Scholar] [CrossRef] [Green Version]
  15. European Council. Directive 2013/59/Euratom on basic safety standards for protection against the dangers arising from exposure to ionizing radiation and repealing Directives 89/618/Euratom, 90/641/Euratom, 96/29/Euratom, 97/43/Euratom and2003/122/Euratom. Off. J. Eur. Union 2013, L13, 1–73. Available online: http://data.europa.eu/eli/dir/2013/59/oj (accessed on 21 September 2021).
  16. Dewaraja, Y.K.; Frey, E.C.; Sgouros, G.; Brill, A.B.; Roberson, P.; Zanzonico, P.B.; Ljunberg, M. MIRD pamphlet no. 23: Quantitative spect for patient-specific 3-dimensional dosimetry in internal radionuclide therapy. J. Nucl. Med. Off. Publ. Soc. Nucl. Med. 2012, 8, 1310–1325. [Google Scholar] [CrossRef] [Green Version]
  17. Pasciak, A.S.; Bourgeois, A.C.; Bradley, Y.C. A comparison of techniques for 90Y PET/CT image-based dosimetry following radioembolization with resin microspheres. Front. Oncol. 2014, 4, 121. [Google Scholar] [CrossRef] [Green Version]
  18. Ljungberg, M.; Gleisner, K.S. Personalized dosimetry for radionuclide therapy using molecular imaging tools. Biomedicines 2016, 4, 25. [Google Scholar] [CrossRef] [Green Version]
  19. Ljungberg, M.; Sjogreen-Gleisner, K. The accuracy of absorbed dose estimates in tumours determined by quantitative spect: A monte carlo study. Acta Oncol. 2011, 6, 981–989. [Google Scholar] [CrossRef] [PubMed]
  20. Garin, E.; Rolland, Y.; Ladffont, S.; Edelin, J. Clinical impact of 99mTc-MAA SPECT/CT-based dosimetry in the radioembolization of liver malignancies with 90Y-loaded microsphere. Eur. J. Nucl. Med. Mol. Imaging 2016, 43, 559–575. [Google Scholar] [CrossRef] [Green Version]
  21. Veenstra, E.B.; Ruiter, S.J.S.; de Haas, R.J.; Bokkers, R.P.H.; Jong, K.P.D.; Noordzij, W. Post-treatment three-dimensional voxel-based dosimetry after Yttrium-90 resin microsphere radioembolization in HCC. Eur. J. Nucl. Med. Mol. Imaging 2022, 12, 9. [Google Scholar] [CrossRef]
  22. Gear, J.; Cummings, C.; Craig, A.J.; Divoli, A.; Long, C.D.C.; Tapner, M.; Flux, G.D. Abdoman: A 3D-printed anthropomorphic phantom for validating quantitative SIRT. EJNMMI Phys. 2016, 3, 17. [Google Scholar] [CrossRef] [PubMed]
  23. American Association of Physicists in Medicine. The Selection, Use, Calibration, and Quality Assurance of Radionuclide Calibrators Used in Nuclear Medicine; Report of AAPM Task Group 181; American Association of Physicists in Medicine: College Park, MD, USA, 2012. [Google Scholar]
  24. D’Arienzo, M.; Cox, M. Uncertainty Analysis in the Calibration of an Emission Tomography System for Quantitative Imaging. Comput. Math. Methods Med. 2017, 9, 9830386. [Google Scholar] [CrossRef] [PubMed] [Green Version]
  25. D’Arienzo, M.; Cazzato, M.; Cozzella, M.L.; Cox, M.; Ungania, S.; Fazio, A.; Fenwick, A.; Iaccarino, G.; Johansson, L.; Strigari, L.; et al. Gamma camera calibration and validation for quantitative spect imaging with (177)lu. Appl. Radiat. Isotop. 2016, 112, 156–164. [Google Scholar] [CrossRef] [PubMed]
  26. Ungania, S.; Nocentini, S.; Iaccarino, G.; D’Andrea, M.; D’Arienzo, M.; Cacciatore, A.; Sciuto, R.; Vallati, G.E.; Pizzi, G.; Strigari, L.; et al. [OA165] Optimization of quantitative 99MTC-MAA SPECT/CT imaging for 90Y radioembolization: A 3D-printed phantom study. Phys. Med. 2018, 52, 10022. [Google Scholar] [CrossRef]
  27. Strigari, L.; Menghi, E.; D’Andrea, M.; Benassi, M. Monte Carlo dose voxel kernel calculations of beta-emitting and Auger-emitting radionuclides for internal dosimetry: A comparison between EGSnrcMP and EGS4. Med. Phys. 2006, 33, 3383–3389. [Google Scholar] [CrossRef]
  28. D’Arienzo, M.; Pimpinella, M.; Capogni, M.; Coste, V.D.; Filippi, L.; Spezi, E.; Patterson, N.; Mariotti, F.; Ferrari, P.; Chiaramida, P.; et al. Phantom validation of quantitative Y-90 PET/CT-based dosimetry in liver radioembolization. EJNMMI Res. 2017, 7, 1. [Google Scholar] [CrossRef] [Green Version]
  29. Low, D.A.; Dempsey, J.F. Evaluation of the gamma dose distribution comparison method. Med. Phys. 2003, 30, 156–164. [Google Scholar] [CrossRef] [Green Version]
  30. Maughan, N.M.; Garcia-Ramirez, J.; Arpidone, M.; Swallen, A.; Laforest, R.; Goddu, S.M.; Parikh, P.J.; Zoberi, J.E. Validation of Post-Treatment PET-Based Dosimetry Software for Hepatic Radioembolization of Yttrium-90 Microspheres. Med Phys. 2019, 46, 2394–2402. [Google Scholar] [CrossRef]
  31. D’Arienzo, M.; Filippi, L.; Chiaramida, P.; Cianni, R.; Salvatori, R.; Scopinaro, F.; Bagni, O. Absorbed dose to lesion and clinical outcome after liver radioembolization with 90Y microspheres: A case report of PET-based dosimetry. Ann. Nucl. Med. 2013, 27, 676–680. [Google Scholar] [CrossRef]
  32. D’Arienzo, M. Dosimetry by 90Y internal pair production PET imaging after liver radioembolization: How well can we quantify the absorbed dose to lesions? Nuov. Cim. 2017, 40C, 97. [Google Scholar]
  33. Chiesa, C.; Sjogreen-Gleisner, K.; Walrand, S.; Strigari, L.; Flux, G.; Gear, J.; Stokke, C.; Gabina, M.; Bernhardt, P.; Konijnenberg, M. EANM dosimetry committee series on standard operational procedures: A unified methodology for 99mTc-MAA pre- and 90Y peri-therapy dosimetry in liver radioembolization with 90Y microspheres. EJNMMI Phys. 2021, 8, 394. [Google Scholar] [CrossRef] [PubMed]
  34. Läppchen, T.; Meier, L.; Fürstner, M.; Prenosil, G.; Krause, T.; Rominger, A.; Klaeser, B.; Hentschel, M. 3D printing of radioactive phantoms for nuclear medicine imaging. EJNMMI Phys. 2020, 7, 22. [Google Scholar] [CrossRef] [PubMed]
  35. Tran-Gia, J.; Schlögl, S.; Lassmann, M. Design and Fabrication of Kidney Phantoms for Internal Radiation Dosimetry Using 3D Printing Technology. J. Nucl. Med. 2016, 57, 1998–2005. [Google Scholar] [CrossRef] [PubMed] [Green Version]
  36. Green, S.; Grice, J. Technical note: 3D-printed phantom for dedicated cardiac protocols and geometries in nuclear medicine. Med. Phys. 2021, 49, 943–951. [Google Scholar] [CrossRef] [PubMed]
  37. Okkalidis, N. 3D printing methods for radiological anthropomorphic phantoms. Phys. Med. Biol. 2022, 67, 15TR04. [Google Scholar] [CrossRef]
  38. Tino, R.; Yeo, A.; Leary, M.; Brandt, M.; Kron, T. A Systematic Review on 3D-Printed Imaging and Dosimetry Phantoms in Radiation Therapy. Technol. Cancer Res. Treat. 2019, 18, 153303381987020. [Google Scholar] [CrossRef]
Figure 1. AbdoMan 3D printed phantom used in this study. (a) the phantom is provided with a fillable liver compartment containing three spherical inserts: two spherical and homogeneous inserts of 20 mm and 40 mm in diameter and a 40 mm in diameter hollow sphere with 25 mm in diameter fillable inner sphere to simulate a necrotic lesion. (b,c) phantom positioning in the SPECT/CT system and (d) SPECT/CT image acquisition of the phantom.
Applsci 12 10541 g001
Figure 2. Flowchart of the experimental method adopted in this study.
Applsci 12 10541 g002
Figure 3. 3D dose distribution for the AbdoMan phantom visualized with MIM color wash tool for the liver section and the 40 mm spheres (a), the 20 mm and 40 mm hollow sphere with 25 mm insert (b).
Applsci 12 10541 g003
Figure 4. The dose distributions for AbdoMan phantom reconstructed with xSPECT software using dose kernel method (a,d) and local energy deposition method (b,e) for two different slice’s location corresponding to the three investigated spheres. (c,f) γ -maps related to the slices considered.
Applsci 12 10541 g004
Figure 5. Cumulative dose-volume histograms for the three lesions and the entire liver volume of AbdoMan phantom using local energy deposition method (LDM, (left)) and Dose kernel method (DKM, (right)).
Applsci 12 10541 g005
Figure 6. Cumulative DVH comparisons between 99mTc SPECT/CT of this study and those (rescaled) reported by Gear et al. in [19] for Monte Carlo (MC), 90Y-PET/CT (PET/CT), 90Y-SPECT/CT (Bremsstrahlung) and 99mTc SPECT/CT (99mTc) for the AbdoMan inserts (a) 40 mm sphere, (b) 20 mm sphere, (c) 40 mm hollow sphere with 25 mm solid inner sphere, simulating a neovascular rim around a necrotic core) and (d) liver compartment.
Applsci 12 10541 g006
Table 1. Comparison between nominal ( C n o m ) and reconstructed C r e c o n activity concentrations related to the AbdoMan phantom.
Abdoman C nom (MBq/mL) C recon (MBq/mL) Δ ( % )
20 mm sphere0.5300.510−3.8%
40 mm sphere0.5300.540+1.9%
40 mm hollow sphere0.5300.390−26.4%
Liver compartment0.1030.104+1.0%
Table 2. Lesions and liver mean activity within the AbdoMan phantom obtained by means of the LDM and DKM.
AbdoManD mean -LDMD mean -KDM Δ (%)
Liver4 Gy4 Gy0%
40 mm sphere80 Gy87 Gy8.7%
20 mm sphere76 Gy79 Gy4%
40 mm hollow sphere70 Gy72 Gy2.4%
Publisher’s Note: MDPI stays neutral with regard to jurisdictional claims in published maps and institutional affiliations.

