Abstract
The aim of this study was to analyze the effect of a low-carbohydrate–high-protein diet, enriched with cholesterol (LCHPch), on body weight, lipid metabolism, as well as kidney and liver function in rats. Wistar rats (N = 18, male) were randomly allocated into experimental groups and fed a modified AIN-93G diet with the addition of 1% cholesterol (AINch, WDch and LCHPch diets) for 8 weeks. Despite the lack of significant differences in the final body weight and liver weight of animals, the kidneys of rats in the LCHPch group were considerably heavier compared to the control group. Serum total cholesterol and the sum of low- and very-low-density fractions of cholesterol as well as ALT activity were significantly increased in the LCHPch rats in comparison to the AINch group. Simultaneously, the highest content of liver fat was obtained for animals from LCHPch group. It was also shown that both WDch and LCHPch diets significantly changed fatty acid profile in the adipose tissue of rats compared to control, with a significant increase in SFA and MUFA and a decrease in PUFA. Non-alcoholic fatty liver disease was observed in rats fed not only WDch but also LCHPch diets. The detailed mechanism still needs to be investigated to prevent the organism from the harmful effects of macronutrient dietary imbalance.
1. Introduction
The Western diet (WD), which is a palatable carbohydrate- and fat-enriched diet, is one of the main contributors for the higher incidence and prevalence of obesity and related dysfunctions in humans [1]. The increase in diseases, such as type 2 diabetes mellitus, obesity and components of metabolic syndrome, parallels a rise in prevalence of nonalcoholic fatty liver disease (NAFLD) [2]. According to these authors, in NAFLD, hepatocyte fat accumulation is observed. Nowadays, it is one of the most common causes of chronic liver disease worldwide (20–40% of population in Western countries and 5–40% of general populations in Asia-Pacific region) [3].
The growing worldwide epidemic of obesity and concerns over its complications (including “fatty liver”) have prompted interest in interventions, such as low-carbohydrate diets [4]. For the enhancement of a multitude of clinical states, the therapeutic use of reduced-carbohydrate diets has been studied [5,6,7].
These diets, including the LCHP (low-carbohydrate, high-protein) diet, attract special attention, being one of the most popular diets. Indeed, protein is an essential macronutrient needed by the human body for growth and maintenance. However, high-protein diets are promoted intensively by the nutritional supplements industry for the loss of body fat and/or the development of muscles [8]. On the contrary, several researchers claim that high-dietary-protein intake could cause disorders [9]. Despite the fact that a short-term high-protein diet could be necessary in several pathological conditions, such as malnutrition, it is evident that too much protein could be useless or even harmful for human health [10].
Extra protein is not used efficiently by the body and may force a metabolic load onto various organs, such as kidneys and liver [8]. There is evidence that protein may raise the risk of coronary artery disease, stroke, diabetes and several types of cancer. An atherosclerotic effect from the LCHP diet was also confirmed in some previous studies [11,12]. Moreover, the high-meat diets may also be associated with higher risk for coronary heart disease as a result of intakes of cholesterol and saturated fat [8]. These conflicting results have initiated a debate over the benefits and risks of such diets and this is why our study concept was to enrich with 1% cholesterol, not only for the LCHP diet, but also the AIN-93G and Western diets, to determine the potential health consequences for the organism. A hypercholesterolemia rat model obtained by feeding with a 0.5–1.0% cholesterol-supplemented diet is commonly used for cardiovascular and cerebrovascular disease studies [13]. Dietary cholesterol has a negative effect on TAG metabolism and consequently leads to hepatic steatosis. Cholesterol administration affects hepatic lipid metabolism in rats [13].
Nonalcoholic fatty liver disease (NAFLD), being a leading cause of chronic disease of the liver, has an estimated occurrence of 20–30% in the general population. NAFLD is higher in individuals having metabolic risk factors [14,15,16]. In the development of NAFLD [17], diet plays a crucial role. This disease could be regarded as an important health concern due to its associated morbidity and mortality [18,19].
It is crucial to understand the potential hepatic lesions that can result from dietary modifications since the primary metabolic reactions occur in the liver. Despite several publications related to a high-protein diet, their results are still inconclusive [2].
2. Materials and Methods
2.1. Animals, Diets and Experimental Procedures
The study was performed on eighteen 6-week-old male albino Wistar rats, weighing 174 g ± 22.5, from the Institute of Animal Production in Krakow. Animals were housed in standard conditions (temperature 22 ± 2 °C, humidity at 75%, with a 12-h day:night cycle). After acclimatization, they were randomly divided into 1 of 3 groups (N = 6 each, with 2 rats per cage) for 8 weeks. Animals had ad libitum access to food and drinking water. Diet and water intake were monitored daily. Body weight was measured at the beginning of the study and weekly thereafter.
The semisynthetic AIN-93G diet served as a ”positive control” diet (fat: 7%, protein 20%) [20] and Western diet as a “negative control” (fat: 21%, protein 20%). In turn, LCHP diet contained 21% fat and 52.4% protein. The compositions of the experimental WD and LCHP diets were based on Foo et al. [4]. Cholesterol (1%) was added to all diets and this is why the names of experimental groups are marked with “ch” in subscript (AINch, WDch, LCHPch). A detailed composition of diets is given in Table 1.

Table 1.
Composition of experimental diets (%).
On the final day of the study, rats were anesthetized (thiopental: 25 mg/100 g body mass; Biochemie GmbH, Kundl, Austria). The hearts, livers and kidneys of rats were removed and weighed. Abdominal adipose tissue was also dissected.
Animal treatments were conducted in accordance with Polish regulations and the Guidelines for Animal Care and Treatment of the European Union and approved by 1st Local Ethics Committee in Krakow (Approval No 80/2014).
2.2. Sampling and Analyses
2.2.1. Blood Parameters
After 4 weeks of experiment blood samples were collected from rats’ tails into test tubes, centrifuged (1500× g, 15 min) to obtain serum samples and stored at −80 °C for further analyses (parameters marked with “½” in subscript). At the end of the study (after 8 weeks) blood samples were collected from the left ventricle of the heart into test tubes and centrifuged (1500× g, 15 min). Serum samples were stored at −80 °C for further analyses.
The parameters in rat serum were analyzed using commercially available kits from Alpha Diagnostics, Warszawa, Poland: i.e., the activity of ALT (no A6624-050), AST (A6661-050) and the level of creatinine (K6413-125) and uric acid (K6681-050); TC; Liquick Cor-Chol 60 No 2-204 (Cormay, Lublin, Poland) for total cholesterol, HDL-C; Olympus Diagnostica GmbH No OSR 6287 (Hamburg, Germany) for HDL cholesterol and TAG; Liquick Cor-TG 30 No 2-262 (Cormay, Lublin, Poland) for triacylglycerol (TAG) determinations. The LDL + VLDL cholesterol were calculated as the difference between TC and HDL cholesterol and glucose level in blood was analyzed using AccuCheck kit (Roche Diagnostics Polska Sp. z o.o).
Atherogenic index (AI) was calculated according to Sa’adah et al. [21]
Moreover, the ratios of TCH/HDL as well as TAG/HDL were also calculated according to Seo et al. [22].
2.2.2. Liver Fat Determination
Liver fat (%) was determined using Automatic Soxtec Avanti 2050 Extraction System. The principle of fat determination is the continuous, multiple extraction of the freeze-dried product with diethyl ether, evaporation of the organic solvent and determination of the fat content.
2.2.3. Histological Examination of Rat Livers
A part of each liver was removed and fixed in 4% buffered paraformaldehyde (pH 7.4). Then the tissues were placed in sucrose (30%). After 24 h tissues were embedded (OCT), sectioned serially (7 µm) and then washed in water (3 min), rinsed with 60% isopropanol (1–2 min), stained with Oil Red O (ORO) (30 min) (24 mL of saturated solution of ORO with 16 mL of distilled water), washed in water (5 min) and mounted in glycerin jelly. The ratio ORO area to tissue area (%) counted in 20× fields was calculated and compared to steatosis grades where <5% means 0 (none), whereas 5–33% means 1 (mild), 34–66% means 2 (moderate) and >66% means 3 (severe).
2.2.4. Fatty Acid Profile in Abdominal Adipose Tissue
The abdominal adipose tissue was dissected from rats. The fatty acids profile was analyzed using GCMS analyzer (Shimadzu GC-MS, Model QP 5050A), by the method described previously [23].
2.3. Statistical Analysis
Data were presented as the mean ± SD. A one-way ANOVA followed by post hoc Tukey’s multiple range test was used to determine the differences between groups using Statistica v. 13.3 (StatSoft, Inc., Tulsa, OK, USA). The results were considered as significant at p < 0.05.
3. Results
Body weights (BWs) were measured weekly to calculate the BW gain in animals during the feeding experiment. There were no significant differences in body weights between the LCHPch and AINch groups (p > 0.05). However, a decreasing tendency was observed after week 5 until the end of the study. Moreover, taking into consideration three groups (AINch, WDch and LCHPch), the lowest body weight was noticed in LCHPch-fed rats (Figure 1). No significant difference (p > 0.05) was found in the final body weight between groups at the end of the experiment. The intake of diets was significantly differentiated only at week 6, with the highest value obtained for group WDch (+25% vs. LCHPch, +20% vs. AINch) (Figure 2). Statistically significant differences in the weights of the kidneys and hearts were observed after 8 weeks of feeding (Table 2). The organs mentioned above were considerably heavier in the rats from the LCHPch group in comparison to the animals from the control group. In turn, the livers of rats were not significantly affected (p > 0.05).
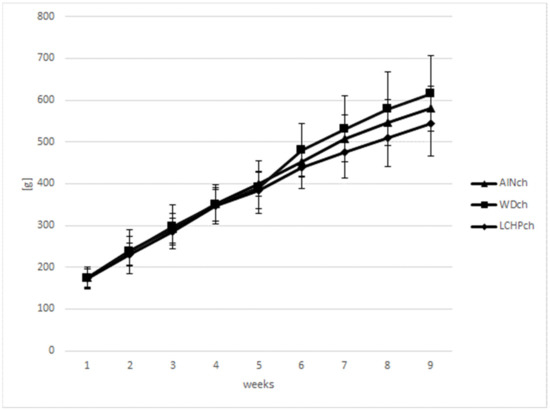
Figure 1.
Body weight gain (g) of rats fed AINch, WDch (Western diet) or LCHPch (low-carbohydrate–high-protein) diets enriched with 1% cholesterol during the experiment (0–8 weeks).
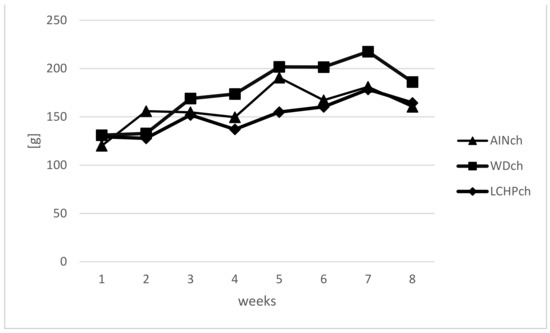
Figure 2.
Intake of diet (g) of rats fed AINch, WDch (Western diet) or LCHPch (low-carbohydrate–high-protein) diets enriched with 1% cholesterol during the experiment (0–8 weeks).
Table 2.
Body weights, weight gain, diet and water intake as well as the weights of liver, kidney and heart of Wistar rats after 8 weeks of feeding: AINch; WDch (Western diet) or LCHPch (low-carbohydrate–high-protein) diets, enriched with 1% cholesterol.
Serum lipid profile was measured in all experimental groups—after 4 and 8 weeks of feeding (Table 3). Serum total cholesterol (TCH) in rats fed the LCHP diet was not varied from that in the other groups. However, the difference between the AINch and LCHPch group was at a level of 50% after 8 weeks of the experiment compared to 20% after 4 weeks. Meanwhile, animals from the WDch group were characterized by significantly higher concentrations of TAG and LDL + VLDL cholesterol (vs. AINch), whereas the LCHP diet intake caused a significant increase in LDL + VLDL levels after 8 weeks, with a simultaneous enhancement in atherogenic index (AI), as well as TAG/HDL ratio (Table 3). Uric acid concentration (Table 4) was increased (p < 0.05) in the WDch group, whereas an increasing tendency was observed in the LCHPch group (+41% vs. AINch group).
Table 3.
Serum lipid profile, atherogenic index, TCH/HDL and TAG/HDL ratios of rats after 4 (marked as ½) and 8 weeks of feeding: AINch, WDch (Western diet) or LCHPch (low-carbohydrate–high-protein) diets, enriched with 1% cholesterol.
Table 4.
The concentration/activity of examined biochemical parameters in blood of rats after 8 weeks of feeding: AINch, WDch (Western diet) or LCHPch (low-carbohydrate–high-protein) diets, enriched with 1% cholesterol.
As shown in Table 4, a statistically significant increase in serum ALT was observed in the LCHPch group compared to the AINch-fed rats, whereas AST activity remained unchanged.
No significant changes (p > 0.05) in serum creatinine concentrations as well as glucose fasting levels between all experimental groups were observed.
It was shown (see Table 5 and Figure 3) that both the WDch and LCHPch diets significantly changed the fatty acid profile in adipose tissue of rats compared to AINch. Myristic acid, palmitic acid, margaric acid, stearic acid and vaccenic acid were increased in both WDch and LCHPch rats, but linoleic acid and linolenic acid were decreased. SFA as well as MUFA were significantly increased in WDch and LCHPch, but PUFA was decreased (p < 0.05).
Table 5.
Fatty acid profile (%) in adipose tissue of rats after 8 weeks of feeding: AINch, WDch (Western diet) or LCHPch (low-carbohydrate–high-protein) diets enriched with 1% cholesterol.
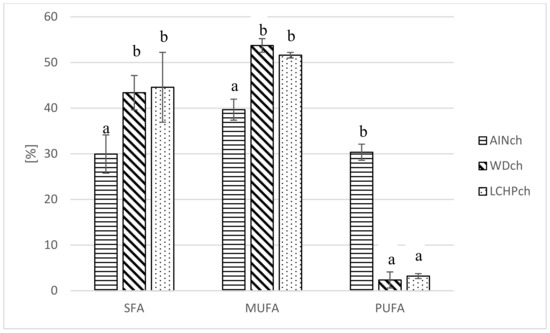
Figure 3.
Comparison of fatty acid share (%) (SFA, MUFA, PUFA) in adipose tissue of rats depending on their diet (AINch, WDch, LCHPch). The means marked with letters a and b are significantly different (p < 0.05).
After 8 weeks of feeding, animals fed the LCHPch or WDch diet had more (p < 0.05) fat in their livers than the AINch group (4.2- or 3.5-fold higher values, respectively) (Figure 4). Histological analysis confirmed the above observation. Liver steatosis was observed in rats fed WDch as well as in LCHPch diets (Figure 5b,c, respectively). Results of calculation for ORO staining/tissue area (%) were 3.25 ± 2.67, 11.64 ± 3.43 and 31.91 ± 14.75 in AINch, WDch and LCHPch groups, respectively (Figure 6).
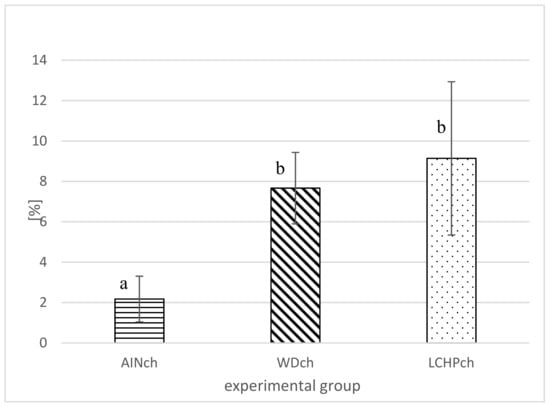
Figure 4.
Liver fat (%) of rats after 8 weeks of feeding (AINch, WDch or LCHPch diets), enriched with 1% cholesterol. The means marked with letters a and b are significantly different (p < 0.05).
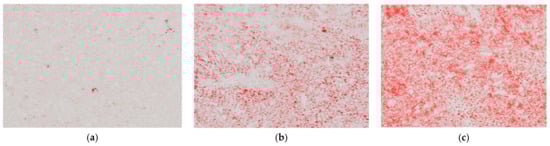
Figure 5.
Histological appearance of liver of: (a) AINch, (b) WDch (c) LCHPch rats (200×) stained with ORO.
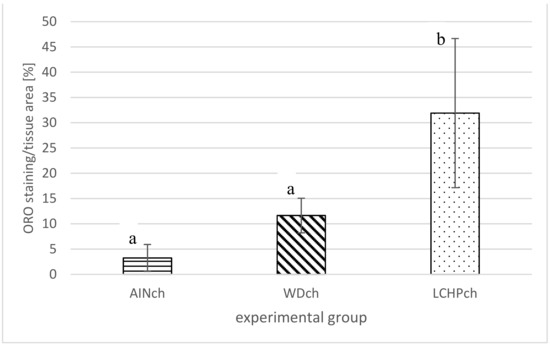
Figure 6.
ORO staining/tissue area (%) of liver of rats after 8 weeks of feeding: AINch, WDch or LCHPch diets, enriched with 1% cholesterol. The means marked with letters a and b are significantly different (p < 0.05).
4. Discussion
A high-protein diet has been proposed to promote weight loss and has been one of the most popular weight-loss strategies [24], but its effect on lipid metabolism still remains unclear. High-protein diets, compared with high-carbohydrate or high-fat diets, provide a higher level of satiety for a longer period of time, which could lead to long-term reduced energy intake [25,26]. Indeed, in our study, the diet intake in the LCHPch group was lower, but statistical significance was observed only in week 6. Meanwhile, the body weight remained unchanged, despite decreasing tendency from the same week. Garbow et al. [2] noticed hepatic enlargement (under conditions of 50% protein in the diet). We did not observe significant changes in the liver weight, despite an increasing tendency in the LCHPch group.
When considering serum lipid profile, it was observed that LCHPch diet intake caused significant enhancement of LDL + VLDL concentration.
In addition to LDL + VLDL, data for TCH, HDL and TAG make up the primary lipid panel for the diagnosis of hyperlipidemia and enable the estimation of cardiovascular (CV) risk [27].
Atherogenic index (AI) is an indicator of the magnitude of atherosclerosis [21]. The higher the AI, the more elevated the potential occurrence of atherosclerosis and prevalence of CV disease. Sa’adah et al. [21] showed that a lipid-rich diet after 30 days increased AI significantly (p < 0.01) from 0.61 to 5.7. In our study, AI was also enhanced as a consequence of feeding animals not only a WDch diet (as expected), but also the LCHPch diet. Therefore, the risk of CV disease was increased. Another biomarker for CV risk is the ratio of TCH/HDL [28]. Moreover, the TCH/HDL and TAG/HDL ratio correlates with the degree of hepatic fat [29]. Among markers for insulin resistance as well as predisposition to CVD, current research has focused on the TAG/HDL ratio, being the best predictor of insulin resistance [30].
In addition to this, in our experiment, after 8 weeks of feeding, WDch rats had the highest (among all groups) serum uric acid (UA) levels. Uric acid is a weak acid (pKa = 5.75) and almost all circulates in the serum as monosodium urate [31]. Liu et al. [32] suggested that uric acid may affect lipid metabolism in rats, causing abnormal lipid levels. Knowing that dyslipidemia is a crucial risk factor for atherosclerosis, hyperuricemia should, therefore, be considered as an important agent in the occurrence and development of this disease [32].
The effect of the LCHP diet enriched with 1% cholesterol (LCHPch group) on the activity of hepatic enzymes (ALT and AST) was observed in our study. Alanine aminotransferase (ALT) and aspartate aminotransferase (AST) measurements are considered precise liver function tests. It is known that high levels of such enzymes confirm liver damage, which involves hepatocyte destruction [2,33]. In our previous article, we showed a significant increase in liver weight in rats fed the LCHP diet (as compared to control AIN-93G), whereas liver aminotransferase activities were unchanged. However, it is known that the absence of elevated liver enzymes does not exclude NAFLD diagnosis [11]. In the present study we observed increased ALT activity, without statistically significant alterations in AST level. On the other hand, Backhed et al. [34] shown an increase in the level of liver enzymes, with the same degree of increase in dietary protein content. No alteration in the levels of the enzymes after long-term administration of a very low-carbohydrate, low-protein diet in C57BL/6J mice was observed. In turn, in a study by Jean et al. [35], animals fed a diet consisting of 50% protein had high ALT and normal AST in comparison to those receiving an AIN-93M diet. These results were interpreted as hepatic lesions. Oarada et al. [36] observed an increase in ALT and AST to the same degree, in terms of enhancement of protein in diet. These authors concluded that protein (independently of other macronutrients) is a risk factor for liver injury.
The main histological characteristic of nonalcoholic fatty liver disease (NAFLD) is the fat accumulation within hepatocytes in the form of TAG (a lesion originally termed “steatosis”). Thus, the minimum criterion for the histological diagnosis of this disease is more than 5% steatotic hepatocytes in a liver tissue section [37,38]. The steatosis extent is often evaluated semi-quantitatively, with the most reproducible method based on the division of the liver parenchyma into thirds. Then, the percentage involvement by steatotic hepatocytes is categorized as follows: 0–5%—none; 5–33%—mild steatosis; 33–66%—moderate steatosis; and more than 66%—severe steatosis [39,40]. Histological assays performed in the present study showed that, in the case of animals from the LCHPch group, the involvement by steatotic hepatocytes with their liver tissue was at a level that corresponds to mild steatosis (compared to no steatosis in AINch group and mild steatosis in WDch). Many studies have shown that NAFLD can result from hepatitis infection, type II diabetes, a high-fat diet, lack of exercise or a combination of these factors [41]. Histologically, NAFLD may include steatosis alone. Additionally, it can comprise also changes associated with hepatocyte ballooning, nonalcoholic steatohepatitis, such as inflammation, necrosis and fibrosis. VanSaun et al. [41] showed that a high-fat diet caused hepatic steatosis. Accumulation of lipids within the mice hepatocytes was induced by consumption of a 42% fat diet. Similar results were obtained by Velázquez at al. [42]. Prolonged (80 wks HFD) feeding led to steatosis. Compared to a standard diet, a significant increase in lipid deposition in the livers of high-fat-diet-fed mice was observed [43]. In the study of Echeverría et al. [44], 12-week HFD feeding induced macrovesicular liver steatosis, with a 6.5-fold elevation in the steatosis score in comparison to the control group. In our studies, it was observed that not only the WDch but also the LCHPch diet enriched with cholesterol also induced liver steatosis in rats. Moreover, the highest lipid concentration in the livers was observed in rats fed the LCHPch diet. Garcia Caraballo et al. [45] showed that a high-protein diet has an antisteatotic and antiobesogenic impact. Additionally, it prevents fatty liver in mice without inducing side effects. However, in this experiment, a diet containing ~35% energy from protein, 5–10% energy from fat and 55–60% energy from carbohydrate was used.
Serum VLDL-TGs enriched with SFAs are highly correlated with insulin resistance and adiposity. The LC diet decreased these VLDL particles and TG SFAs without affecting whole-body adiposity [46]. Added to this, liver fat accumulation creates self-reinforcing cycles that contribute to type 2 diabetes. Fatty liver leads to enhanced export of VLDL, which increases fat delivery to all tissues [47].
The dietary intake of fatty acids (FAs) affects the overall composition and distribution of FAs in the body. Adipose tissue is known as the body’s largest energy storage organ in the form of TAG, being mobilized (through the lipolysis pathway) to deliver energy to other organs [48]. In our study, a significant increase in SFA as well as MUFA share was observed in WDch and LCHPch, while PUFA was decreased as compared to the AINch group.
It should also be emphasized that the kidney is an organ that plays a crucial role in the metabolism of protein [49]. There is evidence that high-protein-diet intake promotes a worse urinary and morphological renal profile, whereas plasma parameters are less clearly affected [50]. Indeed, in our study, the kidneys of rats in the LCHPch group were significantly (p < 0.05) heavier compared to the organs in the control group. Similarly, a tendency to increase creatinine level was also observed (+18% in LCHPch group vs. AINch group). In turn, Bertani et al. (1989) indicated a strong correlation between proteinuria and renal lesions due to the intake of semi-purified protein near 35 en % throughout the rodent lifespan. Moreover, a diet with 35% of its energy from protein caused kidney damage in Sprague–Dawley rats [51]. Several authors also highlight the effect of metabolic acidosis on kidney hypertrophy. In rats with metabolic acidosis, higher renal weight was shown [52] (Menegon et al., 1998).
The intake of Western diet leads to the rapid development of NAFLD in animal models [53]. There is also evidence that significant metabolic changes in the liver of rats fed with high-fat [54] or high-fat and high-carbohydrate [55] diets cause non-alcoholic steatohepatosis. Moreover, high-fat and/or high-carbohydrate-feeding studies reported that inflammatory and lipid metabolism markers increase, whereas oxidative stress defense markers decrease [56]. Although the LCHP diet does appear to have beneficial effects on body weight as well as glucose homeostasis, its overall safety remains unclear. Impairments in hepatic and renal functions are proposed as examples of the suspected adverse effects of high-protein diets [11,57]. It must be emphasized that hypertrophy of liver and kidney was induced after only two weeks of feeding the mice with the LCHP diet [58]. Additionally, the most recent papers show that excessive intake of a low-carbohydrate and high-protein diet causes an adverse effect not only on cardiovascular function [59] but also decreases erectile function in rats [60].
To sum up, protein enhancement is a popular and controversial dietary trend, but potential effects for health, specifically liver and kidney condition, need further investigation, in a broad range of parameters.
5. Conclusions
The present study attempted to obtain a wider view of the topic concerned on the possible benefits and risks of low-carbohydrate–high-protein diets enriched with cholesterol.
The obtained results demonstrated that the LCHPch diet affected the condition of the rat liver, leading to NAFLD (similar to WDch diet). Furthermore, the serum lipid profile, the activity of alanine aminotransferase, as well as the kidneys’ weight were significantly increased in the LCHPch group.
Through this research, it could be concluded that further studies are strongly needed to explain the detailed mechanism of action in the LCHPch diet. It is crucial to establish the safety and suitability of such a diet. The necessary dietary precautions must be indicated to avoid harmful effects, including the enhancement of cardiovascular risk as well as non-alcoholic fatty liver disease development.
Author Contributions
Conceptualization, R.B.K.; methodology, R.B.K., M.F.-Ż., E.K.; software, E.K.; validation, E.K.; formal analysis, E.K.; investigation, K.T.; writing—original draft preparation, K.T., R.B.K.; writing—review and editing, R.B.K., K.T., M.F.-Ż.; visualization, M.F.-Ż.; supervision, R.B.K. All authors have read and agreed to the published version of the manuscript.
Funding
The research was funded by a subsidy 070015-D020 and 72000-D020 from the Polish Ministry of Education and Science for the University of Agriculture in Krakow.
Institutional Review Board Statement
The animal study protocol was approved by the 1st Local Ethics Committee in Krakow of Jagiellonian University Medical College (protocol code 80/2014, 21.05.2014).
Informed Consent Statement
Not applicable.
Data Availability Statement
The data presented in this study are available on request from the corresponding author.
Conflicts of Interest
The authors declare no conflict of interest.
References
- García-Montero, C.; Fraile-Martínez, O.; Gómez-Lahoz, A.M.; Pekarek, L.; Castellanos, A.J.; Noguerales-Fraguas, F.; Coca, S.; Guijarro, L.G.; García-Honduvilla, N.; Asúnsolo, A.; et al. Nutritional Components in Western Diet Versus Mediterranean Diet at the Gut Microbiota–Immune System Interplay. Implications for Health and Disease. Nutrients 2021, 13, 699. [Google Scholar] [CrossRef] [PubMed]
- Garbow, J.R.; Doherty, J.M.; Schugar, R.C.; Travers, S.; Weber, M.L.; Wentz, A.E.; Ezenwajiaku, N.; Cotter, D.G.; Brunt, E.M.; Crawford, P.A. Hepatic steatosis, inflammation, and ER stress in mice maintained long term on a very low-carbohydrate ketogenic diet. Am. J. Physiol. Gastrointest. Liver Physiol. 2011, 300, G956–G967. [Google Scholar] [CrossRef]
- Badman, M.K.; Pissios, P.; Kennedy, A.R.; Koukos, G.; Flier, J.S.; Maratos-Flier, E. Hepatic fibroblast growth factor 21 is regulated by PPARalpha and is a key mediator of hepatic lipid metabolism in ketotic states. Cell Metab. 2007, 5, 426–437. [Google Scholar] [CrossRef] [PubMed]
- Foo, S.Y.; Heller, E.R.; Wykrzykowska, J.; Sullivan, C.J.; Manning-Tobin, J.J.; Moore, K.J.; Gerszten, R.E.; Rosenzweig, A. Vascular effects of a low-carbohydrate high-protein diet. Proc. Natl. Acad. Sci. USA 2009, 106, 15418–15423. [Google Scholar] [CrossRef] [PubMed]
- Gardner, C.D.; Kiazand, A.; Alhassan, S.; Kim, S.; Stafford, R.S.; Balise, R.R.; Kraemer, H.C.; King, A.C. Comparison of the Atkins, Zone, Ornish, and LEARN diets for change in weight and related risk factors among overweight premenopausal women: The Weight Loss Study: A randomized trial. JAMA 2007, 297, 969–977. [Google Scholar] [CrossRef] [PubMed]
- Kirk, J.K.; Graves, D.E.; Craven, T.E.; Lipkin, E.W.; Austin, M.; Margolis, K.L. Restricted-carbohydrate diets in patients with type 2 diabetes: A meta-analysis. J. Am. Diet Assoc. 2008, 108, 91–100. [Google Scholar] [CrossRef]
- Foster, G.D.; Wyatt, H.R.; Hill, J.O.; Makris, A.P.; Rosenbaum, D.L.; Brill, C.; Stein, R.I.; Mohammed, B.S.; Miller, B.; Rader, D.J.; et al. Weight and metabolic outcomes after 2 years on a low-carbohydrate vs. low-fat diet: A randomized trial. Ann. Intern. Med. 2010, 153, 147–157. [Google Scholar] [CrossRef] [PubMed]
- Delimaris, I. Adverse effects associated with protein intake above the recommended dietary allowance for adults. ISRN Nutr. 2013, 18, 126929. [Google Scholar] [CrossRef] [PubMed]
- Bilsborough, S.; Mann, N. A review of issues of dietary protein intake in humans. Int. J. Sport Nutr. Exerc. Metab. 2006, 16, 129–152. [Google Scholar] [CrossRef] [PubMed]
- Kafatos, A.; Hatzis, C. Clinical Nutrition for Medical Students; University of Crete: Rethymno, Greece, 2008. [Google Scholar]
- Kostogrys, R.B.; Franczyk-Żarów, M.; Maślak, E.; Topolska, K. Effect of low carbohydrate high protein (LCHP) diet on lipid metabolism, liver and kidney function in rats. Environ. Toxicol. Pharmacol. 2015, 39, 713–719. [Google Scholar] [CrossRef] [PubMed]
- Wrobel, T.P.; Marzec, K.M.; Chlopicki, S.; Maślak, E.; Jasztal, A.; Franczyk-Żarów, M.; Czyżyńska-Cichoń, I.; Moszkowski, T.; Kostogrys, R.B.; Baranska, M. Effects of Low Carbohydrate High Protein (LCHP) diet on atherosclerotic plaque phenotype in ApoE/LDLR−/− mice: FT-IR and Raman imaging. Sci. Rep. 2015, 5, 14002. [Google Scholar] [CrossRef] [PubMed]
- Wang, Y.; Zhang, B.; Xue, Y.; Li, Z.; Wang, J.; Xue, C.; Yanagita, T. The mechanism of dietary cholesterol effects on lipids metabolism in rats. Lipids Health Dis. 2010, 14, 4. [Google Scholar] [CrossRef] [PubMed]
- Williams, C.D.; Stengel, J.; Asike, M.I.; Torres, D.M.; Shaw, J.; Contreras, M.; Landt, C.L.; Harrison, S.A. Prevalence of nonalcoholic fatty liver disease and nonalcoholic steatohepatitis among a largely middle-aged population utilizing ultrasound and liver biopsy: A prospective study. Gastroenterology 2011, 140, 124–131. [Google Scholar] [CrossRef] [PubMed]
- Machado, M.; Marques-Vidal, P.; Cortez-Pinto, H. Hepatic histology in obese patients undergoing bariatric surgery. J. Hepatol. 2006, 45, 600–606. [Google Scholar] [CrossRef] [PubMed]
- Targher, G.; Bertolini, L.; Padovani, R.; Rodella, S.; Tessari, R.; Zenari, L.; Day, C.; Arcaro, G. Prevalence of nonalcoholic fatty liver disease and its association with cardiovascular disease among type 2 diabetic patients. Diabetes Care 2007, 30, 1212–1218. [Google Scholar] [CrossRef]
- Mirmiran, P.; Amirhamidi, Z.; Ejtahed, H.S.; Bahadoran, Z.; Azizi, F. Relationship between Diet and Non-alcoholic Fatty Liver Disease: A Review Article. Iran J. Public Health 2017, 46, 1007–1017. [Google Scholar] [PubMed]
- Musso, G.; Gambino, R.; Cassader, M.; Pagano, G. Meta-analysis: Natural history of non-alcoholic fatty liver disease (NAFLD) and diagnostic accuracy of non-invasive tests for liver disease severity. Ann. Med. 2011, 43, 617–649. [Google Scholar] [CrossRef] [PubMed]
- Armstrong, M.J.; Adams, L.A.; Canbay, A.; Syn, W.K. Extrahepatic complications of nonalcoholic fatty liver dis-ease. Hepatology 2014, 59, 1174–1197. [Google Scholar] [CrossRef] [PubMed]
- Reeves, P.G.; Nielsen, F.H.; Fahey, G.C. AIN-93 purified diets for laboratory rodents: Final report of the American Institute of Nutrition ad hoc Writing Committee on the reformulation of the AIN-76A rodent diet. J. Nutr. 1993, 123, 1939–1951. [Google Scholar] [CrossRef] [PubMed]
- Sa’adah, N.N.; Purwani, K.I.; Nurhayati, A.P.D.; Ashuri, N.M. Analysis of Lipid Profile and Atherogenic Index in Hyperlipidemic Rat (Rattus norvegicus Berkenhout, 1769) that Given The Methanolic Extract of Parijoto (Medinilla speciosa). AIP Conf. Proc. 2017, 1854, 020031. [Google Scholar]
- Seo, E.Y.; Ha, A.W.; Kim, W.K. α-Lipoic acid reduced weight gain and improved the lipid profile in rats fed with high fat diet. Nutr. Res. Pract. 2012, 6, 195–200. [Google Scholar] [CrossRef]
- Franczyk-Żarów, M.; Szymczyk, B.; Kostogrys, R.B. Effects of dietary conjugated linoleic acid and selected vegetable oils or vitamin E on fatty acid composition of hen egg yolks. Ann. Anim. Sci. 2019, 19, 171–186. [Google Scholar] [CrossRef]
- Serdula, M.K.; Mokdad, A.H.; Williamson, D.F.; Galuska, D.A.; Mendlein, J.M.; Heath, G.W. Prevalence of attempting weight loss and strategies for controlling weight. JAMA 1999, 282, 1353–1358. [Google Scholar] [CrossRef] [PubMed]
- Latner, J.D.; Schwartz, M. The effects of a high-carbohydrate, high-protein or balanced lunch upon later food intake and hunger ratings. Appetite 1999, 33, 119–128. [Google Scholar] [CrossRef] [PubMed]
- Weigle, D.S.; Breen, P.A.; Matthys, C.C.; Callahan, H.S.; Meeuws, K.E.; Burden, V.R.; Purnell, J.Q. A high-protein diet induces sustained reductions in appetite, ad libitum caloric intake, and body weight despite compensatory changes in diurnal plasma leptin and ghrelin concentrations. Am. J. Clin. Nutr. 2005, 82, 41–48. [Google Scholar] [CrossRef] [PubMed][Green Version]
- Langlois, M.R.; Nordestgaard, B.G. Which Lipids Should Be Analyzed for Diagnostic Workup and Follow-up of Patients with Hyperlipidemias? Curr. Cardiol. Rep. 2018, 20, 88. [Google Scholar] [CrossRef] [PubMed]
- Asencio-Barrientos, C.N.; Torres López, E.; Mejía-Loza, M.I.S.; Barrios-Lupitou, L.C.; Pérez y López, N.; García Ruíz, E.; González-Angulo, J.A.; Juárez-Valdés, E.I.; Hernández-Solís, J.I.; Citalan-Poroj, H.W.; et al. Total cholesterol/high-density lipoprotein cholesterol ratio, high-density lipoprotein triglycerides/colesterol with hepatic fat infiltration grade in non-alcoholic fat liver. Ann. Hepatol. 2020, 19, 11–12. [Google Scholar] [CrossRef]
- Jasso-Baltazar, E.A.; Solís-Galindo, F.A.; Muñoz-Hernández, M.A. Sustained viral response in patients with hepatitis C and chronic kidney disease in hemodialysis and treatment with direct acting antivirals in the UMAE 71. Ann. Hepatol. 2020, 19, 23–25. [Google Scholar] [CrossRef]
- Volek, J.S.; Feinman, R.D. Carbohydrate restriction improves the features of Metabolic Syndrome. Metabolic Syndrome may be defined by the response to carbohydrate restriction. Nutr. Metab. 2005, 2, 31. [Google Scholar] [CrossRef]
- McMullen, M. Fructose Increases Uric Acid Contributing to Metabolic Syndrome. Herbal, Nutritional and Dietary Strategies to Reduce Uric Acid. OBM Integr. Compliment. Med. 2018, 3, 22. [Google Scholar] [CrossRef]
- Liu, Z.; Chen, T.; Niu, H.; Ren, W.; Li, X.; Cui, L.; Li, C. The Establishment and Characteristics of Rat Model of Atherosclerosis Induced by Hyperuricemia. Stem Cells Int. 2016, 2016, 1365257. [Google Scholar] [CrossRef] [PubMed]
- Dushay, J.; Chui, P.C.; Gopalakrishnan, G.S.; Varela-Rey, M.; Crawley, M.; Fisher, F.M.; Badman, M.K.; Martinez-Chantar, M.L.; Maratos-Flier, E. Increased fibroblast growth factor 21 in obesity and nonalcoholic fatty liver disease. Gastroenterology 2010, 139, 456–463. [Google Scholar] [CrossRef] [PubMed]
- Backhed, F.; Manchester, J.K.; Semenkovich, C.F.; Gordon, J.I. Mechanisms underlying the resistance to diet-induced obesity in germ-free mice. Proc. Natl. Acad. Sci. USA 2007, 104, 979–984. [Google Scholar] [CrossRef] [PubMed]
- Jean, C.; Rome, S.; Mathé, V.; Huneau, J.F.; Aattouri, N.; Fromentin, G.; Achagiotis, C.L.; Tomé, D. Metabolic evidence for adaptation to a high protein diet in rats. J. Nutr. 2001, 131, 91–98. [Google Scholar] [CrossRef] [PubMed]
- Oarada, M.; Tsuzuki, T.; Nikawa, T.; Kohno, S.; Hirasaka, K.; Gonoi, T. Refeeding with a high-protein diet after a 48 h fast causes acute hepatocellular injury in mice. Br. J. Nutr. 2012, 107, 1435–1444. [Google Scholar] [CrossRef]
- Neuschwander-Tetri, B.A.; Caldwell, S.H. Nonalcoholic steatohepatitis: Summary of an AASLD Single Topic Conference. Hepatology 2003, 37, 1202–1219. [Google Scholar] [CrossRef]
- Brunt, E.M.; Tiniakos, D.G. Alcoholic and nonalcoholic fatty liver disease. In Surgical Pathology of the GI Tract, Liver, Biliary Tract and Pancreas, 2nd ed.; Odze, R.D., Goldblum, J.R., Eds.; Elsevier: Philadelphia, PA, USA, 2009; pp. 1007–1014. [Google Scholar]
- Brunt, E.M.; Janney, C.G.; Di Bisceglie, A.M.; Neuschwander-Tetri, B.A.; Bacon, B.R. Nonalcoholic steatohepatitis: A proposal for grading and staging the histological lesions. Am. J. Gastroenterol. 1999, 94, 2467–2474. [Google Scholar] [CrossRef]
- Fedchuk, C.L.; Nascimbeni, F.; Pais, R.; Charlotte, F.; Housset, C.; Ratziu, V. Performance and limitations of steatosis biomarkers in patients with nonalcoholic fatty liver disease. Aliment. Pharmacol. Ther. 2014, 40, 1209–1222. [Google Scholar] [CrossRef]
- VanSaun, M.N.; Lee, I.K.; Washington, M.K.; Matrisian, L.; Gorden, D.L. High Fat Diet Induced Hepatic Steatosis Establishes a Permissive Microenvironment for Colorectal Metastases and Promotes Primary Dysplasia in a Murine Model. Am. J. Pathol. 2009, 175, 355–364. [Google Scholar] [CrossRef]
- Velázquez, K.T.; Enos, R.T.; Bader, J.E.; Sougiannis, A.T.; Carson, M.S.; Chatzistamou, I.; Carson, J.A.; Nagarkatti, P.S.; Nagarkatti, M.; Murphy, E.A. Prolonged High-Fat-Diet Feeding Promotes Non-Alcoholic Fatty Liver Disease and Alters Gut Microbiota in Mice. World J. Hepatol. 2019, 11, 619–637. [Google Scholar] [CrossRef]
- Feng, D.; Zou, J.; Su, D.; Mai, H.; Zhang, S.; Li, P.; Zheng, X. Curcumin prevents high-fat diet-induced hepatic steatosis in ApoE−/− mice by improving intestinal barrier function and reducing endotoxin and liver TLR4/NF-κB inflammation. Nutr. Metab. 2019, 16, 79. [Google Scholar] [CrossRef] [PubMed]
- Echeverría, F.; Valenzuela, R.; Bustamante, A.; Álvarez, D.; Ortiz, M.; Soto-Alarcon, S.A.; Muñoz, P.; Corbari, A.; Videla, L.A. Attenuation of high-fat diet-induced rat liver oxidative stress and steatosis by combined hydroxytyrosol- (HT-) eicosapentaenoic acid supplementation mainly relies on HT. Oxid. Med. Cell. Longev. 2018, 2, 5109503. [Google Scholar] [CrossRef] [PubMed]
- Hyde, P.; Sapper, T.; Crabtree, C.; LaFountain, R.A.; Bowling, M.L.; Buga, A.; Fell, B.; McSwiney, F.T.; Dickerson, R.M.; Miller, V.J.; et al. Dietary carbohydrate restriction improves metabolic syndrome independent of weight loss. JCI Insight 2019, 4, e128308. [Google Scholar] [CrossRef]
- Garcia Caraballo, S.C.; Comhair, T.M.; Dejong, C.H.C.; Lamers, W.H.; Koehler, S.E. Dietary Treatment of Fatty Liver: High Dietary Protein Content Has an Antisteatotic and Antiobesogenic Effect in Mice. Biochim. Biophys. Acta Mol. Basis Dis. 2017, 1863, 1789–1804. [Google Scholar] [CrossRef] [PubMed]
- Feinman, R.D.; Pogozelski, W.K.; Astrup, A.; Bernstein, R.K.; Fine, E.J.; Westman, E.C.; Accurso, A.; Frassetto, L.; Gower, B.A.; McFarlane, S.I. Dietary carbohydrate restrictionas the first approach in diabetes management: Critical review and evidence base. Nutrition 2015, 31, 1–13. [Google Scholar] [CrossRef] [PubMed]
- Large, V.; Peroni, O.; Letexier, D.; Ray, H.; Beylot, M. Metabolism of lipids in human white adipocyte. Diabetes Metab. 2004, 30, 294–309. [Google Scholar] [CrossRef]
- Aparicio, V.A.; Nebot, E.; Garcia-del Moral, R.; Machado-Vilchez, M.; Porres, J.; Sanchez, M.C.; Aranda, P. High-protein diets and renal status in rats. Nutr. Hosp. 2013, 28, 232–237. [Google Scholar]
- Ambuhl, P.M. Protein intake in renal and hepatic disease. Int. J. Vitam. Nutr. Res. 2011, 81, 162–172. [Google Scholar] [CrossRef]
- Wakefield, A.; House, J.; Ogborn, M.; Weiler, H.; Aukema, H. A diet with 35 % of energy from protein leads to kidney damage in female Sprague-Dawley rats. Br. J. Nutr. 2011, 106, 656–663. [Google Scholar] [CrossRef]
- Menegon, L.F.; Figueiredo, J.F.; Gontijo, J.A. Effect of metabolic acidosis on renal tubular sodium handling in rats as determined by lithium clearance. Braz. J. Med. Biol. Res. 1998, 31, 1269–1273. [Google Scholar] [CrossRef]
- Ishimoto, T.; Lanaspa, M.A.; Rivard, C.J.; Roncal-Jimenez, C.A.; Orlicky, D.J.; Cicerchi, C.; McMahan, R.H.; Abdelmalek, M.F.; Rosen, H.R.; Jackman, M.R.; et al. High-fat and high-sucrose (western) diet induces steatohepatitis that is dependent on fructokinase. Hepatology 2013, 58, 1632–1643. [Google Scholar] [CrossRef] [PubMed]
- Dos Santos Lacerda, D.; Garbin de Almeida, M.; Teixeira, C.; De Jesus, A.; Da Silva Pereira, J.E.; Martins Bock, P.; Pegas Henriques, J.A.; Gomez, R.; Dani, C.; Funchal, C. Biochemical and physiological parameters in rats fed with high-fat diet: The protective effect of chronic treatment with purple grape juice (Bordo Variety). Beverages 2018, 4, 100. [Google Scholar] [CrossRef]
- Panchal, S.K.; Poudyal, H.; Iyer, A.; Nazer, R.; Alam, A.; Diwan, V.; Kauter, K.; Sernia, C.; Campbell, F.; Ward, L.; et al. High-carbohydrate high-fat diet-induced metabolic syndrome and cardiovascular remodeling in rats. J. Cardiovasc. Pharmacol. 2011, 57, 611–624. [Google Scholar] [CrossRef] [PubMed]
- Yang, R.L.; Li, W.; Shi, Y.H.; Le, G.W. Lipoic acid prevents high-fat diet-induced dyslipidemia and oxidative stress: A microarray analysis. Nutrition. 2008, 24, 582–588. [Google Scholar] [CrossRef] [PubMed]
- Monteiro, M.E.; Xavier, A.R.; Oliveira, F.L.; Porphirio Filho, J.S.; Azeredo, V.B. Apoptosis induced by a low-carbohydrate and high- protein diet in rat livers. World J. Gastroenterol. 2016, 14, 22, 5165–5172. [Google Scholar] [CrossRef]
- Higashida, K.; Terada, S.; Li, X.; Inoue, S.; Iida, N.; Kitai, S.; Nakai, N. Low-carbohydrate high-protein diet diminishes the insulin response to glucose load via suppression of SGLT-1 in mice. Biosci. Biotechnol. Biochem. 2019, 83, 365–371. [Google Scholar] [CrossRef]
- Kostogrys, R.B.; Franczyk-Żarów, M.; Maślak, E.; Gajda, M.; Mateuszuk, Ł.; Jackson, C.L.; Chłopicki, S. Low carbohydrate, high protein diet promotes atherosclerosis in apolipoprotein E/low-density lipoprotein receptor double knockout mice (apoE/LDLR−/−). Atherosclerosis 2012, 223, 327–331. [Google Scholar] [CrossRef]
- Kataoka, T.; Hidaka, J.; Suzuki, J.; Mori, T.; Nakamura, D.; Hotta, Y.; Sanagawa, A.; Maeda, Y.; Furukawa-Hibi, Y.; Kimura, K. Evaluating the Effects of Low Carbohydrate and High Protein Diet on Erectile Function in Rats. Sex Med. 2022, 10, 100500. [Google Scholar] [CrossRef]


Publisher’s Note: MDPI stays neutral with regard to jurisdictional claims in published maps and institutional affiliations. |
© 2022 by the authors. Licensee MDPI, Basel, Switzerland. This article is an open access article distributed under the terms and conditions of the Creative Commons Attribution (CC BY) license (https://creativecommons.org/licenses/by/4.0/).