
The Application of Eye-Tracking Technology in the Assessment of Radiology Practices: A Systematic Review


Abstract
:1. Introduction
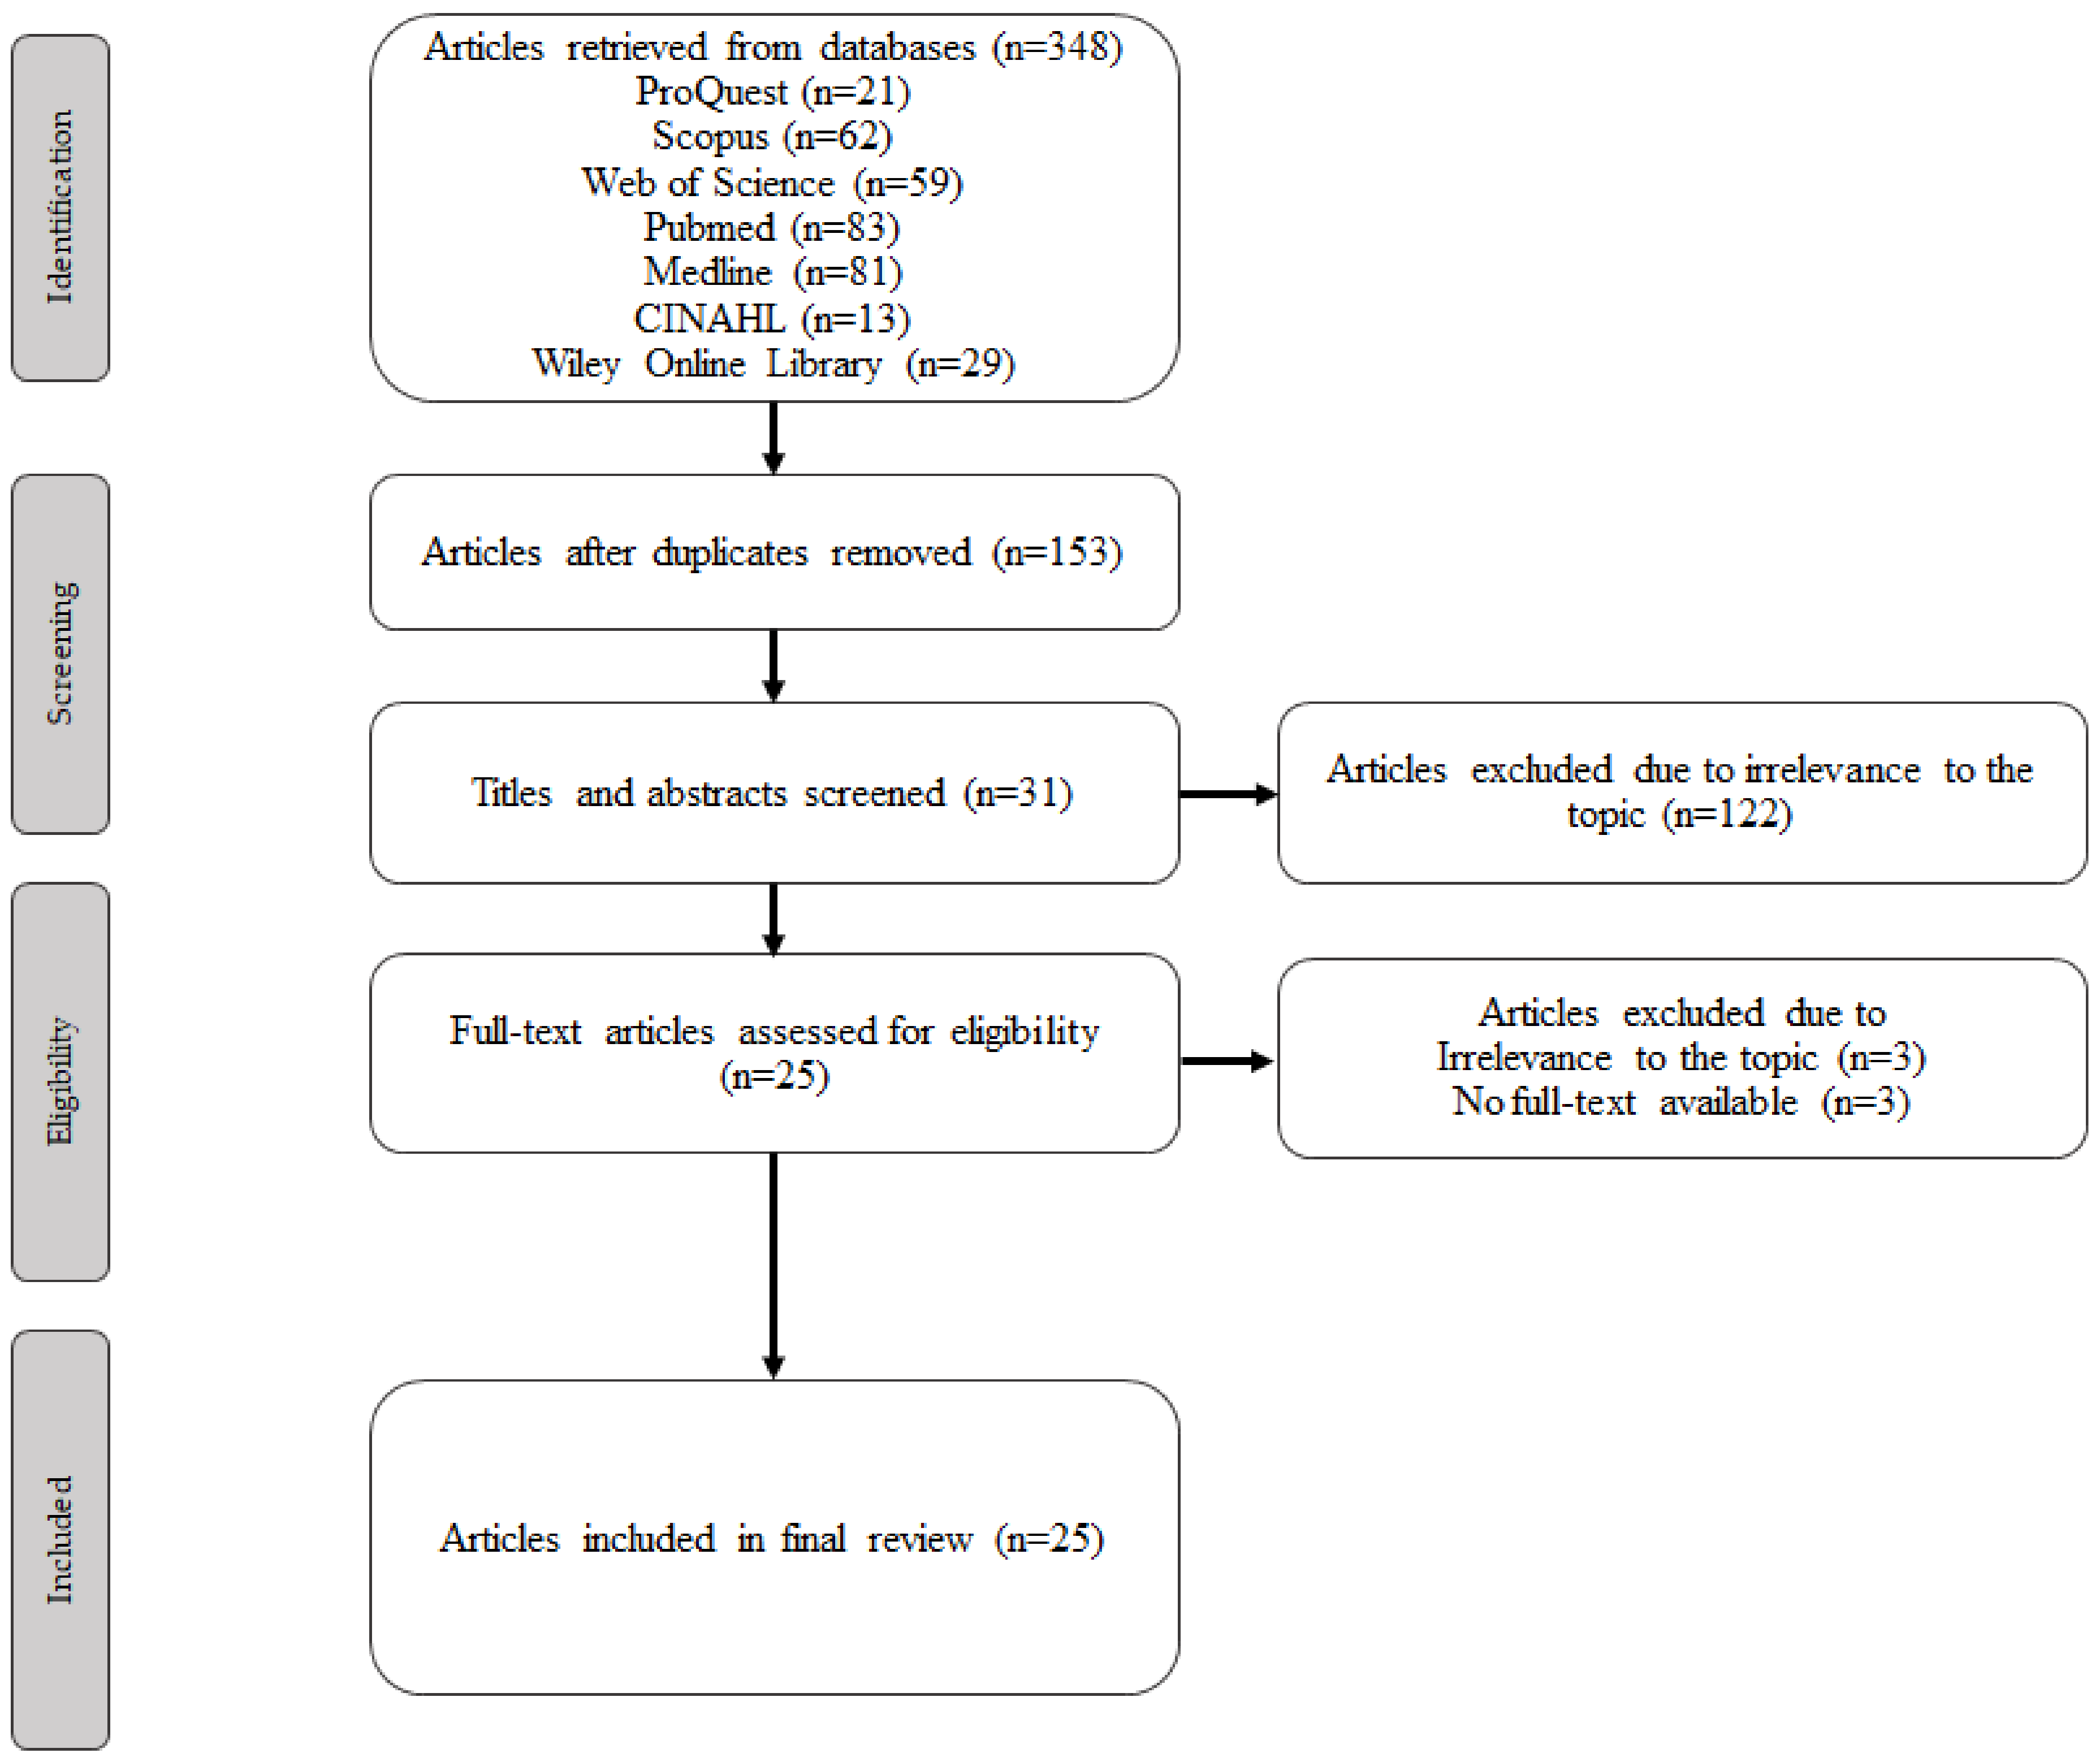
2. Methodology
2.1. Search Strategy
2.2. Data Extraction and Analysis
3. Results
Key Findings
4. Discussion
4.1. Overarching Themes
4.2. Competency Assessment Evaluation
4.2.1. Speed
4.2.2. Accuracy
4.2.3. Confidence
4.2.4. Eye-Metrics
4.2.5. Fatigue and Competency
4.3. Educational Tool Evaluation
4.4. Visual Search Behaviour Evaluation
4.5. Assistive Aid Evaluation
5. Limitations
6. Conclusions
Author Contributions
Funding
Institutional Review Board Statement
Informed Consent Statement
Data Availability Statement
Acknowledgments
Conflicts of Interest
References
- Hammoud, R.I.; Mulligan, J.B. Introduction to eye monitoring. In Passive Eye Monitoring: Algorithms, Applications and Experiments; Hammoud, R.I., Ed.; Springer: Berlin/Heidelberg, Germany, 2008; pp. 1–19. [Google Scholar]
- Wu, C.-C.; Wolfe, J.M. Eye movements in medical image perception: A selective review of past, present and future. Vision 2019, 3, 32. [Google Scholar] [CrossRef]
- Harezlak, K.; Kasprowski, P. Application of eye tracking in medicine: A survey, research issues and challenges. Comput. Med. Imaging Graph. 2018, 65, 176–190. [Google Scholar] [CrossRef] [PubMed]
- Davies, A.; Brown, G.; Vigo, M.; Harper, S.; Horseman, L.; Splendiani, B.; Hill, E.; Jay, C. Exploring the relationship between eye movements and electrocardiogram interpretation accuracy. Sci. Rep. 2016, 6, 38227. [Google Scholar] [CrossRef] [PubMed]
- Bruno, M.; Walker, E.A.; Abujudeg, H.H. Understanding and confronting our mistakes: The epidemiology of error in radiology and strategies for error reduction. Radiographics 2015, 35, 1668–1676. [Google Scholar] [CrossRef]
- Bushby, L.P.; Courtier, J.L.; Glastonbury, C.M. Bias in radiology: The how and why od misses and misinterpretations. Radiographics 2018, 38, 236–247. [Google Scholar] [CrossRef]
- Itri, J.N.; Tappouni, R.R.; McEachern, R.O.; Pesch, A.J.; Patel, S.H. Fundamentals of diagnostic error in imaging. Radiographics 2018, 38, 1846–1865. [Google Scholar] [CrossRef] [PubMed]
- Brunyè, T.T.; Drew, T.; Weaver, D.L.; Elmore, J.G. A review of eye tracking for understanding and improving diagnostic interpretation. Cogn. Res. Princ. Implic. 2019, 4, 1–16. [Google Scholar] [CrossRef] [PubMed]
- Ganesan, A.; Alakhras, M.; Brennan, P.C.; Mello-Thomas, C. A review of factors influencing radiologists’ visual search behaviour. J. Med. Imaging Radiat. Oncol. 2018, 62, 747–757. [Google Scholar] [CrossRef] [PubMed]
- Moher, D.; Shamseer, L.; Clarke, M.; Ghersi, D.; Liberati, A.; Petticrew, M.; Shekelle, P.; Stewart, L.A.; PRISMA-P Group. Preferred reporting items for systematic review and meta-analysis protocols (PRISMA-P) 2015 statement. Syst. Rev. 2015, 4, 1–9. [Google Scholar] [CrossRef] [PubMed]
- Stewart, L.A.; Clarke, A.; Rovers, M.; Riley, R.D.; Simmonds, M.; Stewart, G.; Tierney, J.F. Preferred reporting items for a systematic review and meta-analysis of individual participant data: The PRISMA-IPD Statement. JAMA 2015, 313, 1657–1665. [Google Scholar] [CrossRef]
- Kmet, L.M.; Lee, R.C.; Cook, L.S. Standard Quality Assessment Criteria for Evaluating Primary Research Papers from a Variety of Fields; Alberta Heritage Foundation for Medical Research: Edmonton, AB, Canada, 2004; Available online: https://era.library.ualberta.ca/items/48b9b989-c221-4df6-9e35-af782082280e/view/a1cffdde-243e-41c3-be98-885f6d4dcb29/standard_quality_assessment_criteria_for_evaluating_primary_research_papers_from_a_variety_of_fields.pdf (accessed on 22 April 2022).
- McLaughlin, L.; Hughes, C.M.; Bond, R.; McConnell, J.; McFadden, S.L. The effect of a digital training tool to aid chest image interpretation: Hybridising eye tracking technology and a decision support tool. Radiography 2021, 27, 505–511. [Google Scholar] [CrossRef]
- Quen, M.T.Z.; Mountstephens, J.; The, Y.G.; Teo, J. Medical image interpretation training with a low-cost eye tracking and feedback system: A preliminary study. Healthc. Technol. Lett. 2021, 8, 97–103. [Google Scholar] [CrossRef]
- Kok, E.M.; Jarodzka, H.; de Bruin, A.B.H.; BinAmir, H.A.N.; Robben, S.G.F.; van Merriënboer, J.J.G. Systematic viewing in radiology: Seeing more, missing less? Adv. Health Sci. Educ. Theory Pract. 2016, 21, 189–205. [Google Scholar] [CrossRef] [PubMed]
- Kok, E.M.; de Bruin, A.B.H.; Leppink, J.; van Merriënboer, J.J.G.; Robben, S.G.F. Case comparisons: An efficient way of learning radiology. Acad. Radiol. 2015, 22, 1226–1235. [Google Scholar] [CrossRef] [PubMed]
- STROBE. STROBE Checklists. Available online: https://www.strobe-statement.org/checklists/ (accessed on 1 May 2022).
- Brams, S.; Ziv, G.; Hooge, I.T.C.; Levin, O.; De Brouwere, T.; Verschakelen, J.; Dauwe, S.; Williams, A.M.; Wagemans, J.; Helsen, W.F. Focal lung pathology detection in radiology: Is there an effect of experience on visual search behavior? Atten. Percept. Pyschophys. 2020, 82, 2837–2850. [Google Scholar] [CrossRef]
- Crowe, E.M.; Gilchrist, I.D.; Kent, C. New approaches to the analysis of eye movement behaviour across expertise while viewing brain MRIs. Cogn. Res. Princ. Implic. 2018, 3, 1–14. [Google Scholar] [CrossRef]
- Lèvêque, L.; Berg, B.V.; Bosmans, H.; Cockmartin, L.; Keupers, M.; Ongeval, C.V.; Liu, H. A statistical evaluation of eye-tracking data of screening mammography: Effects of expertise and experience on image reading. Signal. Process. Image Commun. 2019, 78, 86–93. [Google Scholar] [CrossRef]
- Turgeon, D.P.; Lam, E.W.N. Influence of experience and training on dental students’ examination performance regarding panoramic images. J. Dent. Educ. 2016, 80, 156–164. [Google Scholar] [CrossRef]
- Wood, G.; Knapp, K.M.; Rock, B.; Cousens, C.; Roobottom, C.; Wilson, M.R. Visual expertise in detecting and diagnosing skeletal fractures. Skelet. Radiol. 2013, 42, 165–172. [Google Scholar] [CrossRef]
- McLaughlin, L.; Bond, R.; Hughes, C.; McConnell, J.; McFadden, S. Computing eye gaze metrics for the automatic assessment of radiographer performance during X-ray image interpretation. Int. J. Med. Inform. 2017, 105, 11–21. [Google Scholar] [CrossRef] [PubMed]
- Gnanasekaran, F.P.; Nirmal, L.; Sujitha, P.; Bhayyaa, R.; Muthu, M.S.; Cho, V.Y.; King, N.M.; Anthonappa, R.P. Visual interpretation of panoramic radiographs in dental students using eye-tracking technology. J. Dent. Educ. 2022, 86, 887–892. [Google Scholar] [CrossRef] [PubMed]
- Giovinco, N.A.; Sutton, S.M.; Miller, J.D.; Rankin, T.M.; Gonzalez, G.W.; Najafi, B.; Armstrong, D.G. A passing glance? Differences in eye tracking and gaze patterns between trainees and experts reading plain film bunion radiographs. J. Foot Ankle Surg. 2015, 54, 382–391. [Google Scholar] [CrossRef] [PubMed]
- Hanley, J.; Warren, D.; Glass, N.; Tranel, D.; Karam, M.; Buckwalter, J. Visual interpretation of plain radiographs in orthopaedics using eye-tracking technology. Iowa Orthop. J. 2017, 37, 225–231. [Google Scholar] [PubMed]
- Kelly, B.S.; Rainford, L.A.; Darcy, S.P.; Kavanagh, E.C.; Toomey, R.J. The development of expertise in radiology: In chest radiograph interpretation, “Expert” Search Pattern May Predate “Expert” levels of diagnostic accuracy for pneumothorax identification. Radiology 2016, 280, 252–260. [Google Scholar] [CrossRef]
- Vogel, D.; Schulze, R. Viewing patterns regarding panoramic radiographs with different pathological lesions: An eye-tracking study. Dentomaxillofac. Radiol. 2021, 50, 20210019. [Google Scholar] [CrossRef] [PubMed]
- Bahaziq, A.; Jadu, F.M.; Jan, A.M.; Baghdady, M.; Feteih, R.M. A comparative study of the examination pattern of panoramic radiographs using eye-tracking software. J. Contemp. Dent. Pract. 2019, 20, 1436–1441. [Google Scholar] [PubMed]
- Bertram, R.; Kaakinen, J.; Bensch, F.; Helle, L.; Lantto, E.; Niemi, P.; Lundbom, N. Eye movements of radiologists reflect expertise in CT study interpretation: A potential tool to measure resident development. Radiology 2016, 281, 805–815. [Google Scholar] [CrossRef] [PubMed]
- Botelho, M.G.; Ekambaram, M.; Bhuyan, S.Y.; Kan Yeung, A.W.; Tanaka, R.; Bornstein, M.M.; Kar, Y.L. A comparison of visual identification of dental radiographic and nonradiographic images using eye tracking technology. Clin. Exp. Dent. Res. 2020, 6, 59–69. [Google Scholar] [CrossRef]
- Matsumoto, H.; Terao, Y.; Yugeta, A.; Fukuda, H.; Emoto, M.; Furubayashi, T.; Okano, T.; Hanajima, R.; Ugawa, Y. Where do neurologists look when viewing brain CT images? an eye-tracking study involving stroke cases. PLoS ONE 2011, 6, e28928. [Google Scholar]
- Kelahan, L.C.; Fong, A.; Blumenthal, J.; Kandaswamy, S.; Ratwani, R.M.; Filice, R.W. The radiologist’s gaze: Mapping three-dimensional visual search in computed tomography of the abdomen and pelvis. J. Digit. Imaging 2018, 32, 234–240. [Google Scholar] [CrossRef]
- Hanna, T.N.; Zygmont, M.E.; Peterson, R.; Theriot, D.; Shekhani, H.; Johnson, J.-O.; Krupinski, E.A. The Effects of Fatigue from Overnight Shifts on Radiology Search Patterns and Diagnostic Performance. J. Am. Coll. Radiol. 2018, 15, 1709–1716. [Google Scholar] [CrossRef]
- Ba, A.; Shams, M.; Schmidt, S.; Eckstein, M.P.; Verdun, F.R.; Bochud, F.O. Search of low-contrast liver lesions in abdominal CT: The importance of scrolling behavior. J. Med. Imaging 2020, 7, 045501. [Google Scholar] [CrossRef] [PubMed]
- Venjakob, A.C.; Marnitz, T.; Phillips, P.; Mello-Thoms, C.R. Image size influences visual search and perception of hemorrhages when reading cranial CT: An eye-tracking study. Hum. Factors 2016, 58, 441–451. [Google Scholar] [CrossRef]
- Rubin, G.D.; Roos, J.E.; Tall, M.; Harrawood, B.; Bag, S.; Ly, D.L.; Seaman, D.M.; Hurwitz, L.M.; Napel, S.; Choudhury, K.R. Characterizing Search, Recognition, and Decision in the Detection of Lung Nodules on CT Scans: Elucidation with Eye Tracking. Radiology 2014, 271, 276–286. [Google Scholar] [CrossRef] [PubMed]
- Krupinski, E.A. Impact of patient photos on detection accuracy, decision confidence and eye-tracking parameters in chest and abdomen images with tubes and lines. J. Digit. Imaging 2019, 32, 827–831. [Google Scholar] [CrossRef] [PubMed]
- Tekin, E.; Roediger, H.L. III. The range of confidence scales does not affect the relationship between confidence and accuracy in recognition memory. Cogn. Res. Princ. Implic. 2017, 2, 1–13. [Google Scholar]

| Boolean Operator | Term | Field |
|---|---|---|
| 1.0 | “eye tracking” OR “eye monitor *” OR “eye-tracking” OR “gaze monitor *” OR “gaze tracking” OR “eye gaze *” | Abstract |
| 2.0 AND | Interpret * OR competenc * OR performance * | Abstract |
| 3.0 AND | Radiograph * OR xray * OR x-ray * OR “general radiograph *” OR “computed tomography” OR “magnetic resonance *” | Abstract |
| Article | Year | Description of Question and Aim | Study Design | Method of Participant Selection | Participant Demographics | Randomisation | Investigator Blinding | Participant Blinding | Outcome Measurements | Sample Sizing | Analysis Methods | Variance Estimation | Confounding Variables | Report of Results | Conclusions | Quality Assessment |
|---|---|---|---|---|---|---|---|---|---|---|---|---|---|---|---|---|
| McLaughlin et al. [13] | 2021 | 2 | 2 | 2 | 2 | 2 | N/A | N/A | 2 | 2 | 2 | 2 | 1 | 2 | 2 | 23/24 96% |
| Quen et al. [14] | 2021 | 2 | 2 | 1 | 2 | N/A | N/A | N/A | 1 | 1 | 0 | 0 | 1 | 1 | 2 | 13/22 59% |
| Kok et al. [15] | 2016 | 2 | 2 | 2 | 2 | 2 | N/A | N/A | 2 | 2 | 2 | 2 | 2 | 2 | 2 | 24/24 100% |
| Kok et al. [16] | 2015 | 2 | 2 | 2 | 2 | N/A | N/A | N/A | 2 | 2 | 2 | 2 | 2 | 2 | 2 | 22/22 100% |
| Brams et al. [18] | 2020 | 2 | 1 | 1 | 2 | N/A | N/A | N/A | 2 | 2 | 2 | 2 | 1 | 2 | 1 | 18/22 82% |
| Crowe et al. [19] | 2018 | 2 | 2 | 2 | 2 | N/A | N/A | N/A | 2 | 2 | 2 | 2 | 1 | 2 | 2 | 21/22 95% |
| Lèvêque et al. [20] | 2019 | 2 | 2 | 0 | 2 | N/A | N/A | N/A | 2 | 2 | 2 | 1 | 2 | 2 | 2 | 19/22 86% |
| Turgeon and Lam [21] | 2015 | 2 | 1 | 2 | 2 | N/A | N/A | N/A | 2 | 2 | 2 | 2 | 1 | 2 | 2 | 20/22 91% |
| Wood et al. [22] | 2013 | 2 | 1 | 2 | 2 | N/A | N/A | N/A | 2 | 2 | 2 | 2 | 2 | 2 | 2 | 21/22 95% |
| McLaughlin et al. [23] | 2017 | 2 | 1 | 2 | 2 | N/A | N/A | N/A | 2 | 2 | 2 | 1 | 1 | 2 | 2 | 19/22 86% |
| Gnanasekaran et al. [24] | 2022 | 2 | 1 | 1 | 1 | N/A | N/A | N/A | 2 | 2 | 2 | 0 | 2 | 2 | 2 | 17/22 77% |
| Giovinco et al. [25] | 2015 | 2 | 1 | 1 | 1 | N/A | N/A | N/A | 2 | 1 | 2 | 2 | 0 | 2 | 2 | 16/22 73% |
| Hanley et al. [26] | 2017 | 2 | 2 | 2 | 2 | N/A | N/A | N/A | 2 | 1 | 2 | 2 | 1 | 2 | 2 | 20/22 91% |
| Kelly et al. [27] | 2016 | 2 | 2 | 2 | 2 | N/A | N/A | N/A | 2 | 1 | 2 | 2 | 1 | 2 | 2 | 20/22 91% |
| Vogel and Schulze [28] | 2021 | 2 | 1 | 2 | 2 | N/A | N/A | N/A | 2 | 2 | 2 | 2 | 2 | 2 | 2 | 21/22 95% |
| Bahaziq et al. [29] | 2019 | 2 | 1 | 2 | 2 | N/A | N/A | N/A | 1 | 0 | 1 | 0 | 1 | 1 | 2 | 13/22 59% |
| Bertram et al. [30] | 2016 | 2 | 2 | 2 | 2 | N/A | N/A | N/A | 2 | 2 | 0–1 | 2 | 2 | 2 | 2 | 21/22 95% |
| Botelho et al. [31] | 2019 | 2 | 1 | 2 | 2 | N/A | N/A | N/A | 2 | 1 | 1 | 2 | 2 | 2 | 2 | 19/22 86% |
| Matsumoto et al. [32] | 2011 | 2 | 1 | 2 | 2 | N/A | N/A | N/A | 2 | 2 | 2 | 2 | 1 | 2 | 2 | 20/22 91% |
| Kelahan et al. [33] | 2019 | 1 | 1 | 0–1 | 2 | N/A | N/A | N/A | 2 | 1 | 1 | 0 | 2 | 2 | 2 | 15/22 68% |
| Hanna et al. [34] | 2018 | 2 | 2 | 2 | 2 | N/A | N/A | N/A | 2 | 2 | 2 | 2 | 2 | 2 | 2 | 22/22 100% |
| Ba et al. [35] | 2020 | 2 | 1 | 0 | 2 | N/A | N/A | N/A | 2 | 1 | 2 | 2 | 1 | 2 | 2 | 17/22 77% |
| Venjakob et al. [36] | 2016 | 2 | 2 | 2 | 2 | N/A | N/A | N/A | 2 | 1–2 | 2 | 2 | 1 | 2 | 2 | 21/22 95% |
| Rubin et al. [37] | 2015 | 2 | 2 | 2 | 2 | N/A | N/A | N/A | 1 | 1 | 2 | 2 | 2 | 2 | 2 | 20/22 91% |
| Krupinski [38] | 2019 | 2 | 1 | 0 | 0 | N/A | N/A | N/A | 2 | 0 | 2 | 2 | 2 | 2 | 2 | 15/22 68% |
| Author and Date | Purpose | Setting | Participants | Research Style | Relevant Findings |
|---|---|---|---|---|---|
| COMPETENCY ASSESSMENT EVALUATION | |||||
| Brams et al. 2020 [18] | To explore main theories of radiologic search patterns across groups of different experience using eye-gaze metric analysis in the interpretation of chest x-rays | Belgium | n= 41 15x medical students 2nd–4th years (MS) 13x medical residents (MR) 13x radiology residents (RR) | Observation; Cross-Sectional | The gaze metrics demonstrated that the RR were able to detect pathology at above chance level, in comparison to the MR and MS which at chance level. Additionally, RR and MR had faster response times and longer average fixation durations in comparison to MS. |
| Crowe et al. 2018 [19] | To differentiate the gaze/scanning patterns across different educational levels in the interpretation of brain tumour images (MRI) | UK | Experiment 1 and 2: n = 35 18x undergraduate students (excl. medicine, dentistry and veterinary) 10x medical students (3rd or 4th years) 7x experts (trainees and consultant neurologists and consultant neuroradiologists) | Observation; Cross-Sectional | There was a clear distinction between experience and accuracy and sensitivity. Additionally, the experts scanning patterns which were similar to each other whilst the medical students did not. |
| Lèvêque et al. 2019 [20] | To evaluate the difference of different levels of expertise in the interpretation of mammograms via the use of eye-tracking equipment | Belgium | n= 8 3x expert radiologists 3x trainee radiologists 2x physicists | Observation; Cross-Sectional | There was no difference in the mean fixation duration amongst experts, however, trainees had a shorter mean fixation. Physicists’ fixation duration was significantly longer than experts. Trainees and physicists deviated from the expert focus points, however trainees have a greater focus on area of interest than physicist participants. |
| Turgeon and Lam 2015 [21] | To compare the visual search strategies of oral and maxillofacial radiologists (OMR) and dental undergraduate students in the interpretation of panoramic dental x-rays via eye-tracking | Canada | n= 45 30x 4th year dental students 15x OMRs | Observation; Cross-Sectional | The OMR covered more gaze distance than students for normal anatomical radiographs. For pathological images, the OMRs demonstrated faster analysis, fewer eye fixations, fewer saccades and less time to first fixation (within area of interest). The OMR group covered less distance than students for obvious pathologies. |
| Wood et al. 2012 [22] | To analyse the perpetual differences in radiographic interpretation of skeletal fractures between experts and novices | UK | n= 30 10x undergraduate radiography students (novices) 10x pre-Fellowship radiology trainees (intermediates) 10x post-Fellowship radiologists (experts) | Observation; Cross-Sectional | The most experienced group was most accurate in diagnosis, confident and the fastest of the participants. They had a faster determination of the fracture site and a greater fixation duration in that area, and this was most pronounced in detecting subtle fractures. |
| McLaughlin et al. 2017 [23] | To investigate the general image interpretation of general radiographs between different expert groups of radiographers | UK | n= 58 21x radiography students 19x qualified radiographers 18x reporting radiographers | Observation; Cross-Sectional | Reporting radiographers were 15% more accurate than radiography students and radiographers, and also had a longer interpretation time and greater confidence level. |
| Gnanasekaran et al. 2022 [24] | To evaluate the gaze patterns of dental undergraduates when analysing panoramic radiographs | Australia | n= 65 65x dental undergraduates (5th year) | Observation; Cross-Sectional | Most participants failed to conclude a correct diagnosis, and the search patterns of the participants did not demonstrate sequential interpretation of the panoramic radiographs. |
| Giovinco et al. 2015 [25] | To evaluate the differences between experienced and novice surgeons in the interpretation of pre-surgical hallux valgus plain radiographs. | USA | n= 16 7x advanced surgeons (AS) 9x novice surgeons (NS) | Observation; Cross-Sectional | The AS group demonstrated that they moved their attention faster through the radiograph and spent less examination time determining clinical diagnosis. NS spent most of their time in searching behaviour. There was no significance found for accuracy. |
| Hanley et al. 2017 [26] | To quantitatively evaluate the differences between novice and expert orthopaedic trainees using eye-gaze metrics whilst analysing pelvic radiographs | USA | n= 23 2x 4th year medical students 4x 1st year residents 4x 2nd year residents 3x 3rd year residents 6x 4th year residents 4x 5th year residents | Observation; Cross-Sectional | Whilst there was no relationship between identification of a fracture and experience, there was a relationship between the accurate identification of normal anatomy and expertise. Additionally, participants with more experience classified the fractures more effectively. Greater expertise correlated with a shorter interpretation time and fewer fixations. |
| Kelly et al. 2016 [27] | To evaluate the development of chest radiograph interpretation skill in medical training by comparing diagnostic accuracy and eye-gaze metrics. | Ireland | n= 21 7x medical interns 5x senior house officers (i.e., 2nd year medical residents—not radiology) 4x radiology registrars 5x consultant radiologists | Observation; Cross-Sectional | There was a significant difference in accuracy between consultants and registrars. All the eye-gaze metrics and total reading time decreased with experience. Chest interpretation skill increased with experience. |
| Vogel and Schulze 2021 [28] | To evaluate the viewing patterns of dental students during different level of education in the analysis of panoramic radiographs | Germany | n= 48 24x second clinical semester students (tested in both 1st [2a] and 2nd semester [2e]) 24x fifth clinical semester students (tested once [5a]) | Observation; Cross-Sectional (Part Cohort) | More experience appears to correlate with an improvement in diagnostic capacity, and participants with greater expertise studied the radiograph more completely. The 2e cohort was the fastest viewing time, however the 5a cohort was more accurate. The time spent analysing the radiograph was not shown to correlate to diagnostic ability. |
| Bahaziq et al. 2019 [29] | To investigate differences between expert and novice orthodontists in the examination of panoramic radiographs via eye-gaze metrics | Saudi Arabia | n= 136 72x novice orthodontists 64x expert orthodontists | Observation; Cross-Sectional. | No significance was found within the eye-gaze metrics. Expert orthodontists were found to spend a significantly longer time interpreting radiographs. There was no difference noted in the interpretation skills between participants. |
| Bertram et al. 2016 [30] | To investigate markers of expertise via visual markers in different levels of medical education of abdominal CT studies | Finland | n= 41 15x early residents 14x advanced residents 12x specialists | Observation; Cross-Sectional | Specialists and advanced residents had longer fixation durations than early residents. Early residents detected a lower amount of low visual contrast lesions than specialists’ counterparts. |
| Botelho et al. 2019 [31] | To differentiate the gaze patterns and identification ability between junior hospital dental officers and dental surgery assistants for radiographic (panoramic images) and non-radiographic images | Hong Kong | n= 18 9x Junior Hospital Dental Officers (JHDO) 9x Dental surgery assistants (DSA) | Observation; Cross-Sectional | There were no significant differences pertaining to gaze metrics between the participants. The JHDOs had a higher percentage for area of interest identification and categorisation in the radiographic images. |
| Matsumoto et al. 2011 [32] | To investigate the neurologist search pattern of brain CT images and analyse the deployment of visual attention using eye-tracking saliency mop generation. | Japan | n= 30 15x neurologists 15x controls (other medical professionals who do not have any education in interpreting brain CT) | Observation; Cross-Sectional | High salient areas were common fixations amongst both control and neurologist groups, however the neurologist groups also had high fixations on areas of low salience and high clinical importance. |
| Kelahan et al. 2019 [33] | To evaluate the scanning patterns of radiologists via eye-gaze tracking whilst analysing abdominopelvic CT | USA | n= 17 9x attendings 8x trainees (radiologists) | Observation; Cross-Sectional | There were similarities concluded between trainees and attendings in most eye-gaze metrics. Attendings did have a lower fixation frequency, suggesting greater efficiency. |
| Hanna et al. 2018 [34] | To evaluate the impact of overnight shifts on fatigue, visual search and diagnostic performance of radiologists | USA | n= 12 5x faculty radiologists 7x resident radiologists | Observation: Cross-Sectional | Overall statistics demonstrated that fatigued professionals interpreted at a slower rate with higher inaccuracies. Some eye-metrics were shown to increase in frequency during fatigued states. |
| EDUCATIONAL TOOL EVALUATION | |||||
| McLaughlin et al. 2021 [13] | To evaluate an education tool for radiographic interpretation (for which eye-tracking assisted in programming) via eye-tracking data and performance | UK | n= 47 12x reporting radiographers trained in chest image interpretation 35x reporting radiographers trained in MSK interpretation | Randomised Controlled Trial | The interventional group scored higher in diagnostic accuracy than the control group, with true positive diagnoses and true negative diagnoses increasing. False positive rates decreased for the interventional group. Interventional group was significantly more confident. |
| Quen et al. 2020 [14] | To evaluate whether the use of low-cost eye-tracking equipment provides adequate feedback for pedagogical development in the interpretation of chest x-rays | Malaysia | n= 8 (medical officers) Split into two groups (Treatment and Control) | Non-Randomised Controlled Trial | There were no significant differences in accuracy, however the treatment group had faster decision speeds. Treatment groups also commented on the confidence boost. The tool was also rated qualitatively by the tutor and students as a positive tool for learning. |
| Kok et al. 2016 [15] | To investigate the relationship between systematic viewing, diagnostic accuracy and complete review (via education of participants) of an image in radiographic interpretation using eye-tracking | Netherlands | Experiment 1 n = 30 11x final year medical students 10x radiology residents 9x radiologists Experiment 2 n = 75 75x 2nd year medical students | Non-Randomised Controlled Trial | #1 The data suggests a lack of relationship between systematic viewing analysis techniques and coverage and diagnostic performance. Expert interpretation is more systematic that that of students (p = 0.02). #2 There was a significant relationship demonstrated between coverage and systematic viewing techniques (p < 0.01), however this did not relate to specificity or sensitivity. |
| VISUAL SEARCH BEHAVIOUR EVALUATION | |||||
| Ba et al. 2020 [35] | To investigate the scrolling techniques of radiologists whilst analysing liver CT imaging using eye-gaze tracking to establish understanding of scrolling behaviour | Switzerland | n= 20 1x undergraduate medical student 16x radiology residents 2x fellows 1x experienced radiologist | Observation; Cross-Sectional | The use of eye-gaze metrics was an inferior analysis tool. Radiologists who performed with a greater number of courses covered more volume at a greater rate, found a greater number of metastases and also made fewer search errors. |
| Venjakbob et al. 2016 [36] | To investigate the interpretation differences by radiologists of different stack modes (small and large) of cranial computed tomography slices | Germany | n= 21 21x radiologists | Observation; Cross-Sectional | Small stack CT mode is better for overview and motion perception, however large stack CT mode is better for detailed analyses. There was no overall difference in performance between the two stack modes. |
| Rubin et al. 2014 [37] | To evaluate the search patterns, recognition and detection of lung nodules in CT images by radiologists | USA/Canada | n= 13 radiologists with varying level of experience | Observation: Cross Sectional | Radiologists seem to search less than half of the lung parenchyma although encompassing 75% of nodules in their search volume. Significant inter-reader variations exist in radiologists’ search and detection capabilities of lung nodules. Synchronized recording of eye tracking offers insight into development of consistently effective screening method in detection of lung nodules. |
| ASSISTIVE AID EVALUATION | |||||
| Kok et al. 2015 [16] | To evaluate the usage of comparison films (of different or same diseases) in the image interpretation accuracy, via the use of eye-gaze metric analysis | Netherlands | n= 84 84x 3rd year medical students | Randomised Controlled Trial | The highest level of efficiency was found between same-disease and different-disease comparisons for improvement of accuracy (p < 0.05). Eye tracking tool provides insight into the comparison process when students interpreted radiographs. |
| Krupinski 2019 [38] | To evaluate whether the use of patient photographs aids in the interpretation accuracy of radiographic images to determine the correct placement of tubes and lines | USA | n= 6 6x radiology residents | Observation; Cross-Sectional | The addition of patient photographs improves the radiographic detection of tube placement. Data has also been shown on the extra time spent on interpreting when photograph is added. Decision confidence was significantly increased with the addition of photographs. |
Publisher’s Note: MDPI stays neutral with regard to jurisdictional claims in published maps and institutional affiliations. |
© 2022 by the authors. Licensee MDPI, Basel, Switzerland. This article is an open access article distributed under the terms and conditions of the Creative Commons Attribution (CC BY) license (https://creativecommons.org/licenses/by/4.0/).
Share and Cite
Arthur, E.; Sun, Z. The Application of Eye-Tracking Technology in the Assessment of Radiology Practices: A Systematic Review. Appl. Sci. 2022, 12, 8267. https://doi.org/10.3390/app12168267
Arthur E, Sun Z. The Application of Eye-Tracking Technology in the Assessment of Radiology Practices: A Systematic Review. Applied Sciences. 2022; 12(16):8267. https://doi.org/10.3390/app12168267
Chicago/Turabian StyleArthur, Elizabeth, and Zhonghua Sun. 2022. "The Application of Eye-Tracking Technology in the Assessment of Radiology Practices: A Systematic Review" Applied Sciences 12, no. 16: 8267. https://doi.org/10.3390/app12168267
APA StyleArthur, E., & Sun, Z. (2022). The Application of Eye-Tracking Technology in the Assessment of Radiology Practices: A Systematic Review. Applied Sciences, 12(16), 8267. https://doi.org/10.3390/app12168267