
Soil Erosion Assessment Using the RUSLE Model, Remote Sensing, and GIS in the Shatt Al-Arab Basin (Iraq-Iran)


Abstract
1. Introduction
2. Study Area
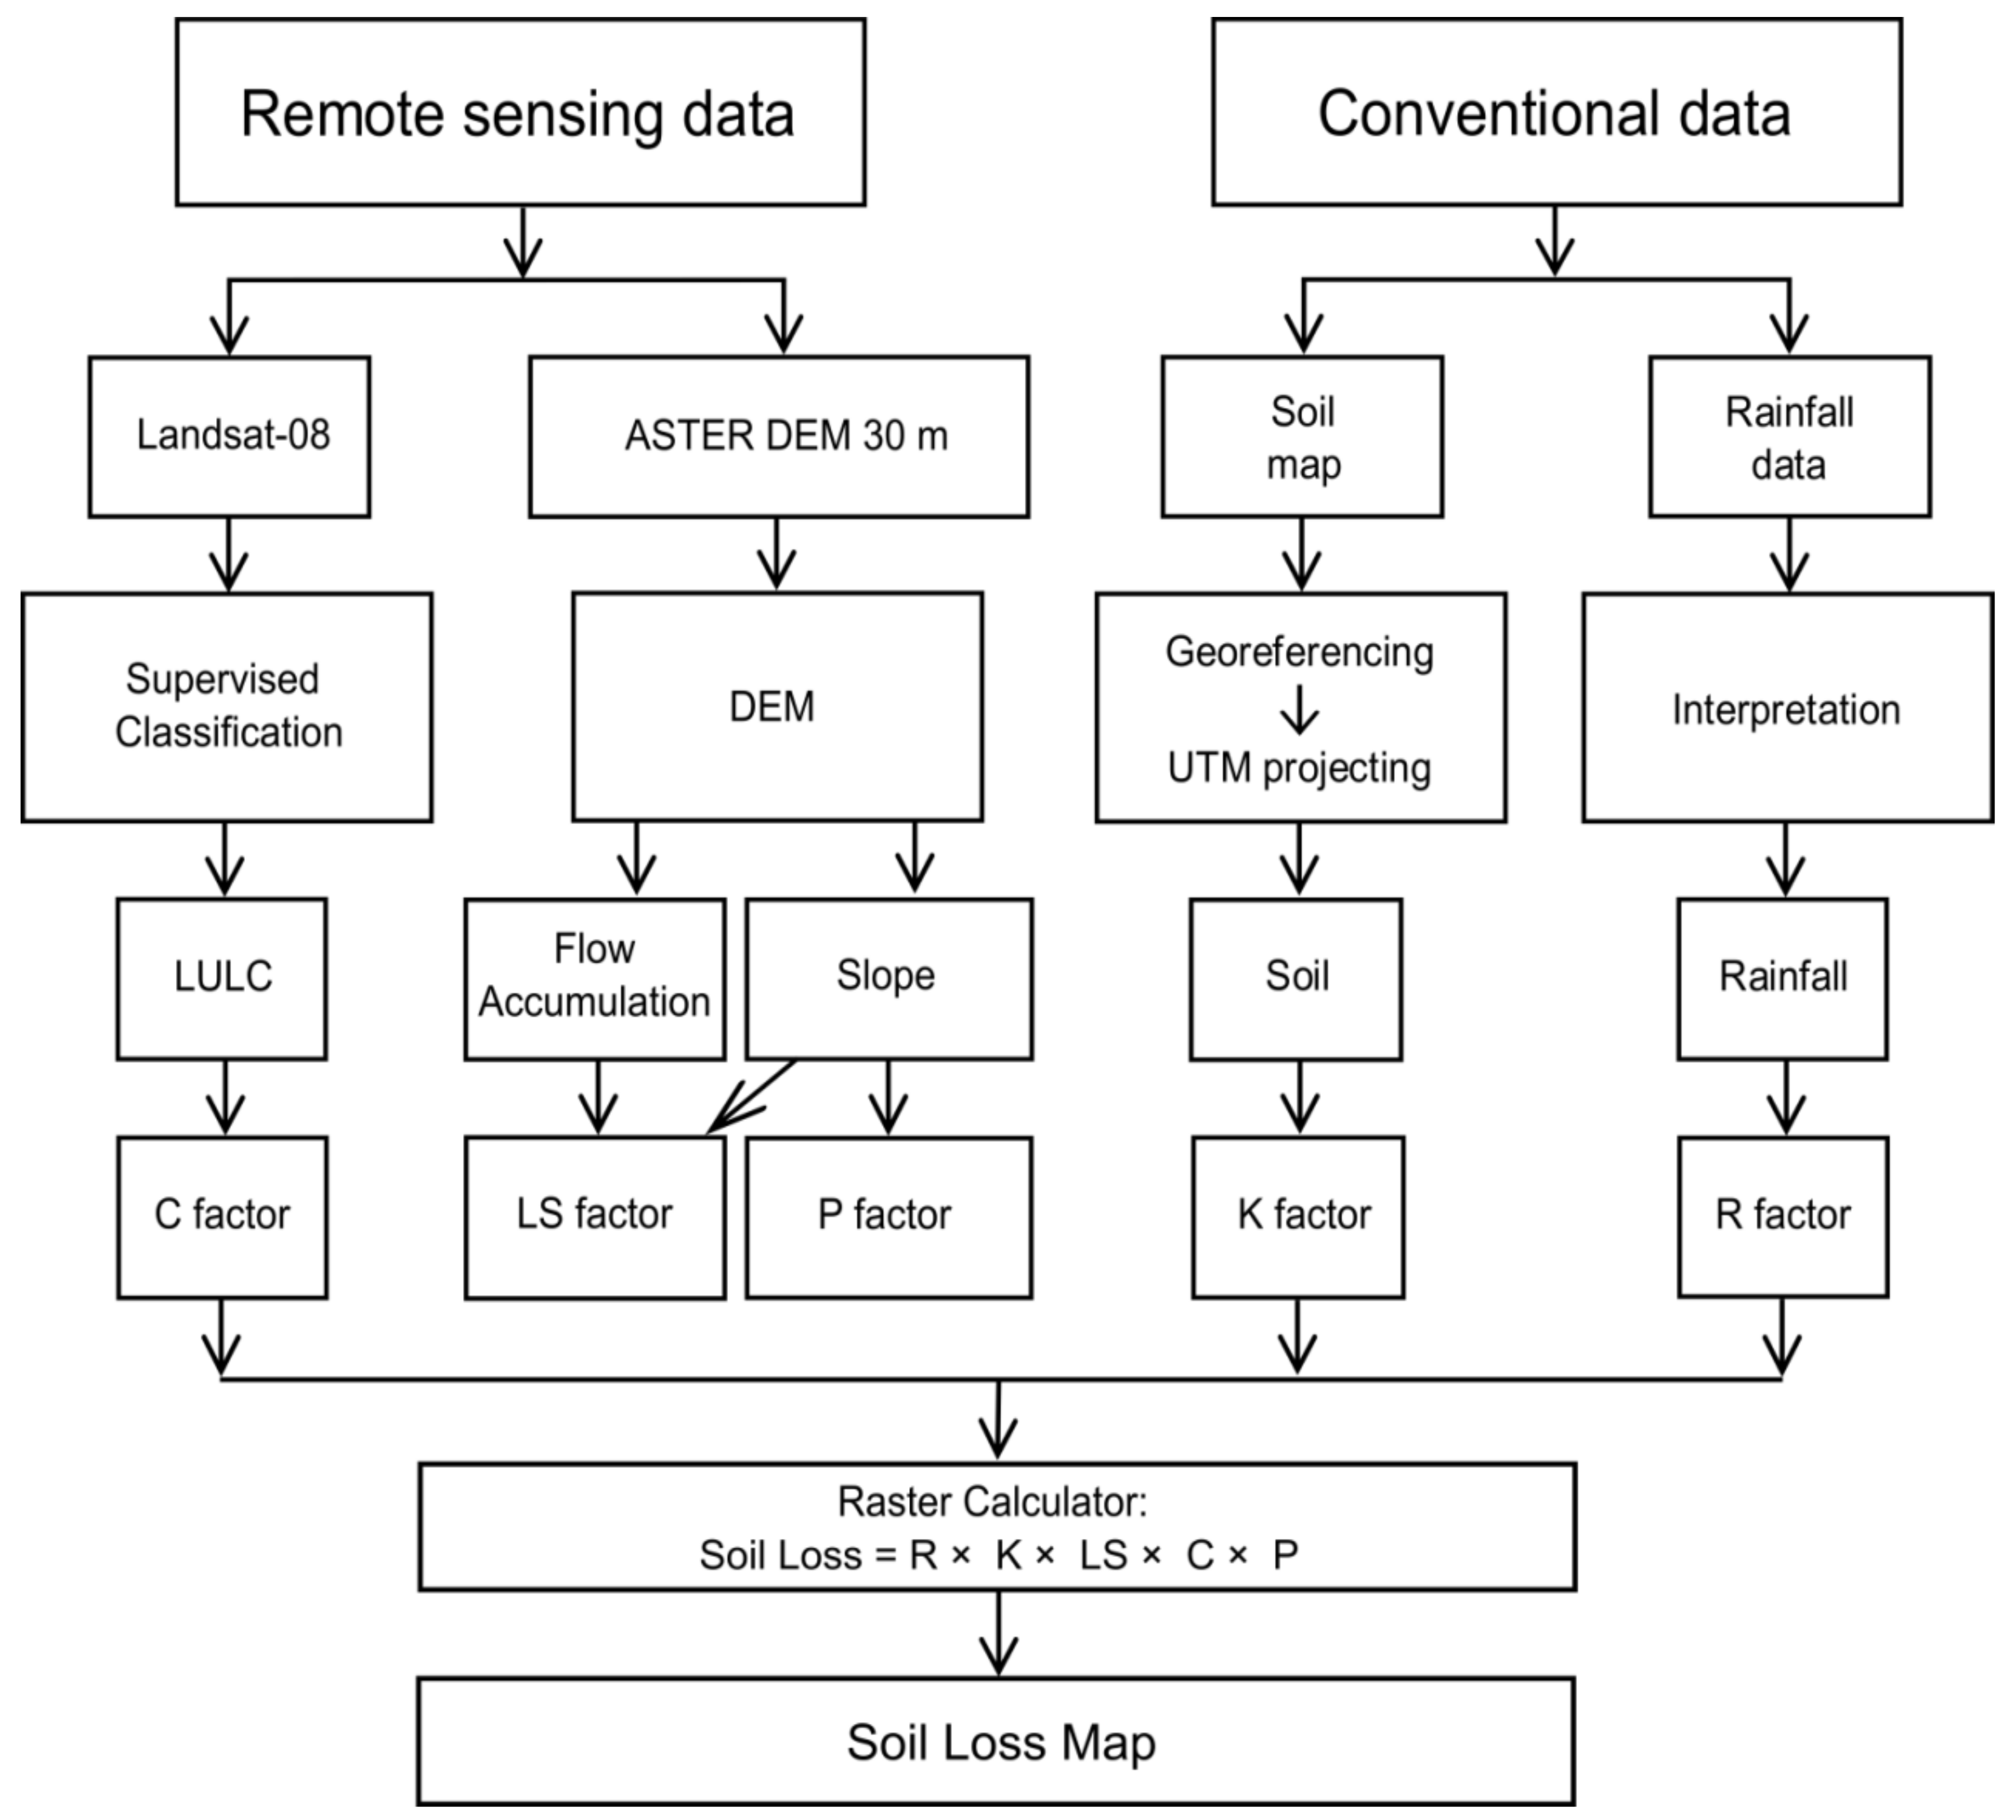
3. Methodology
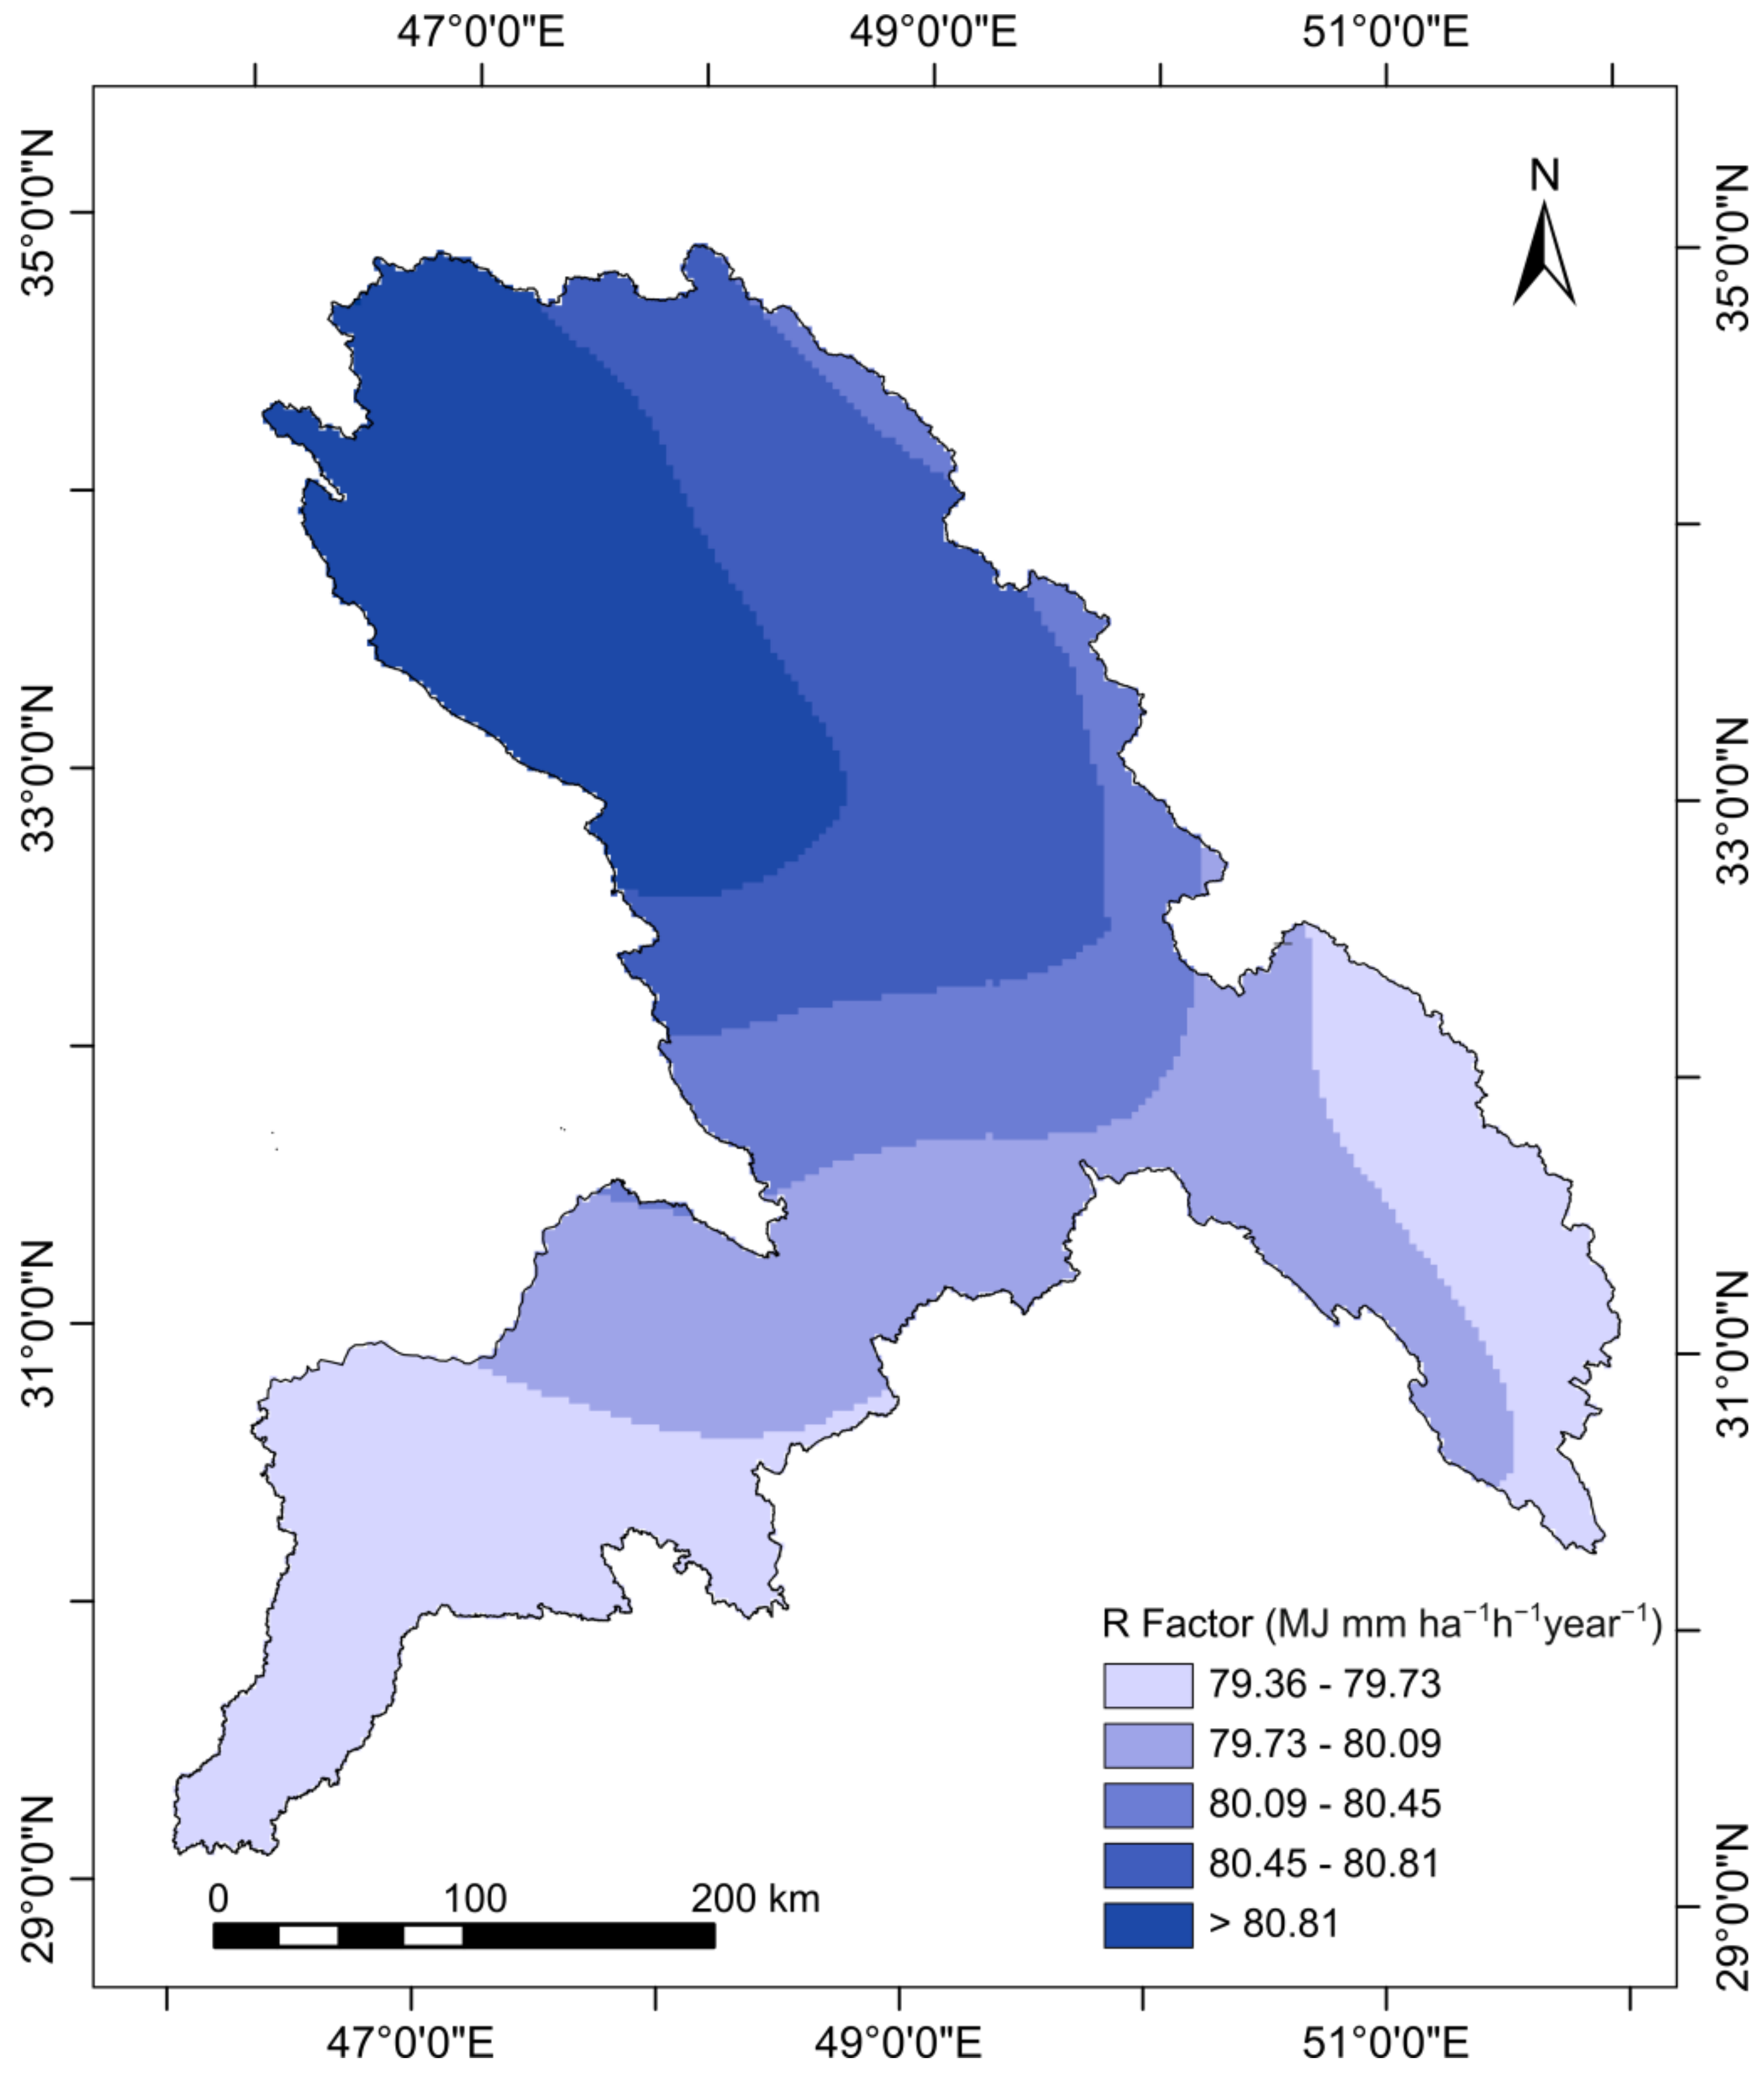
3.1. Rainfall Erosivity Factor (R Factor)
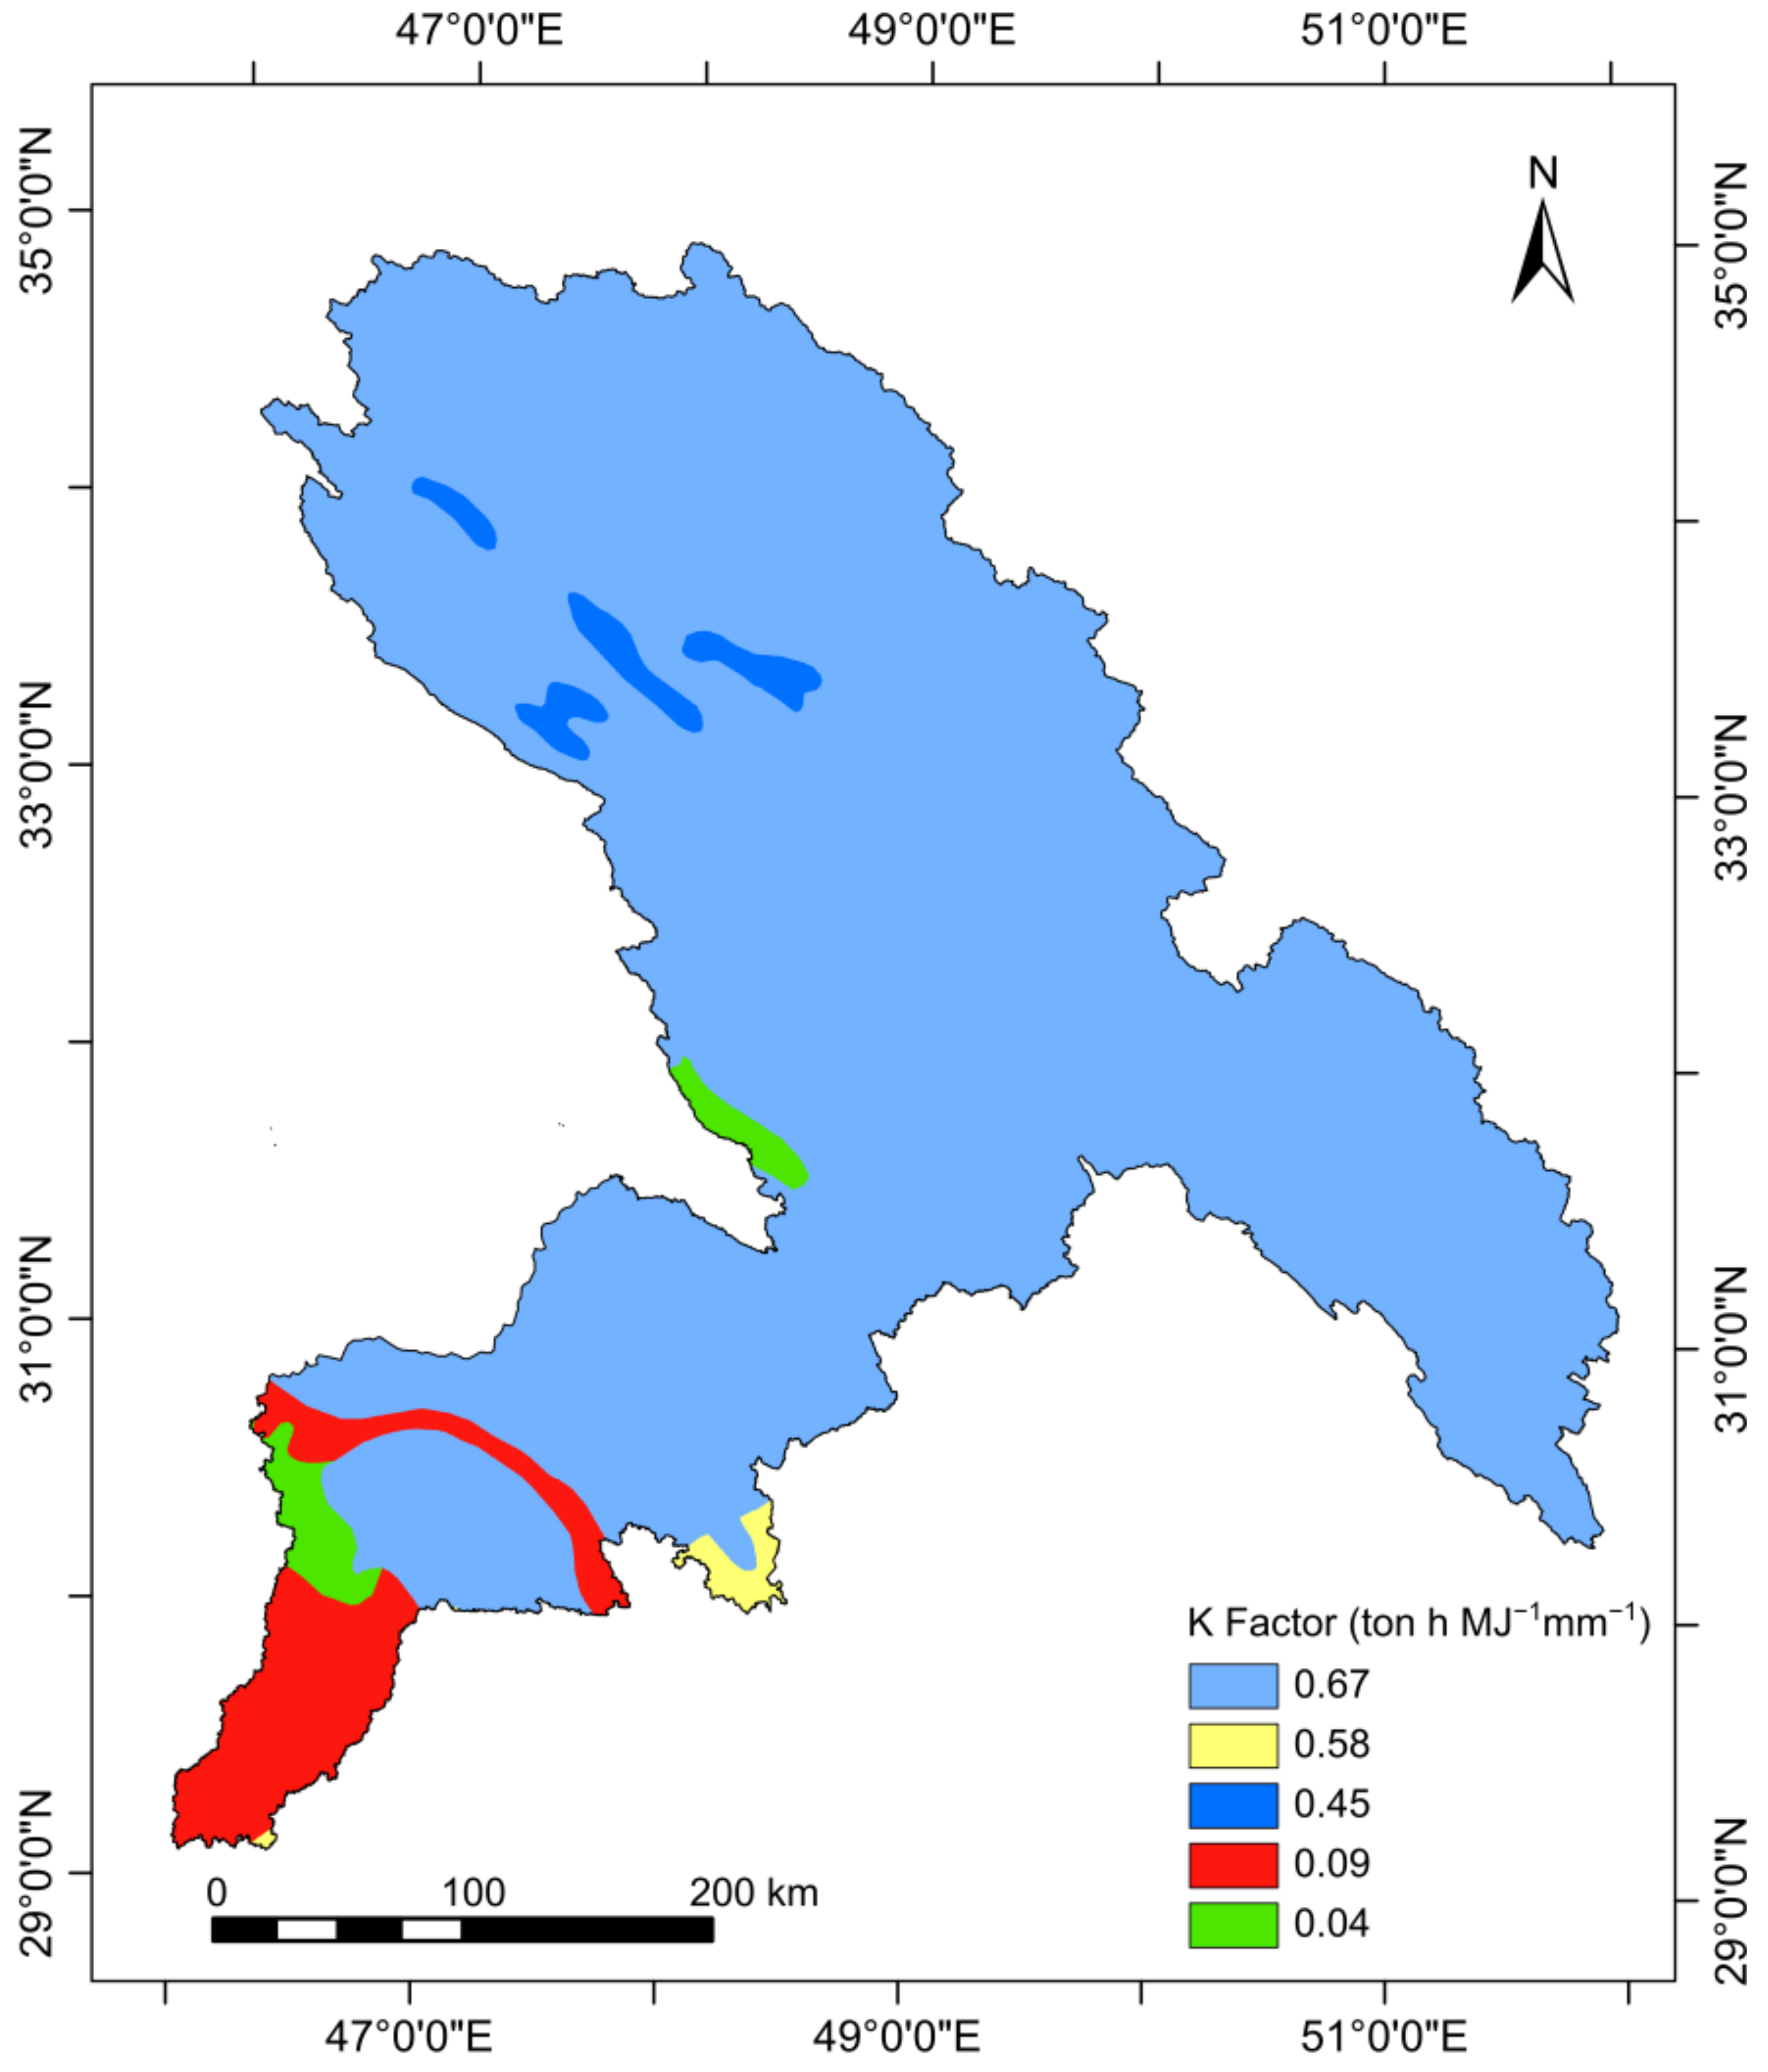
3.2. Soil Erodibility Factor (K Factor)
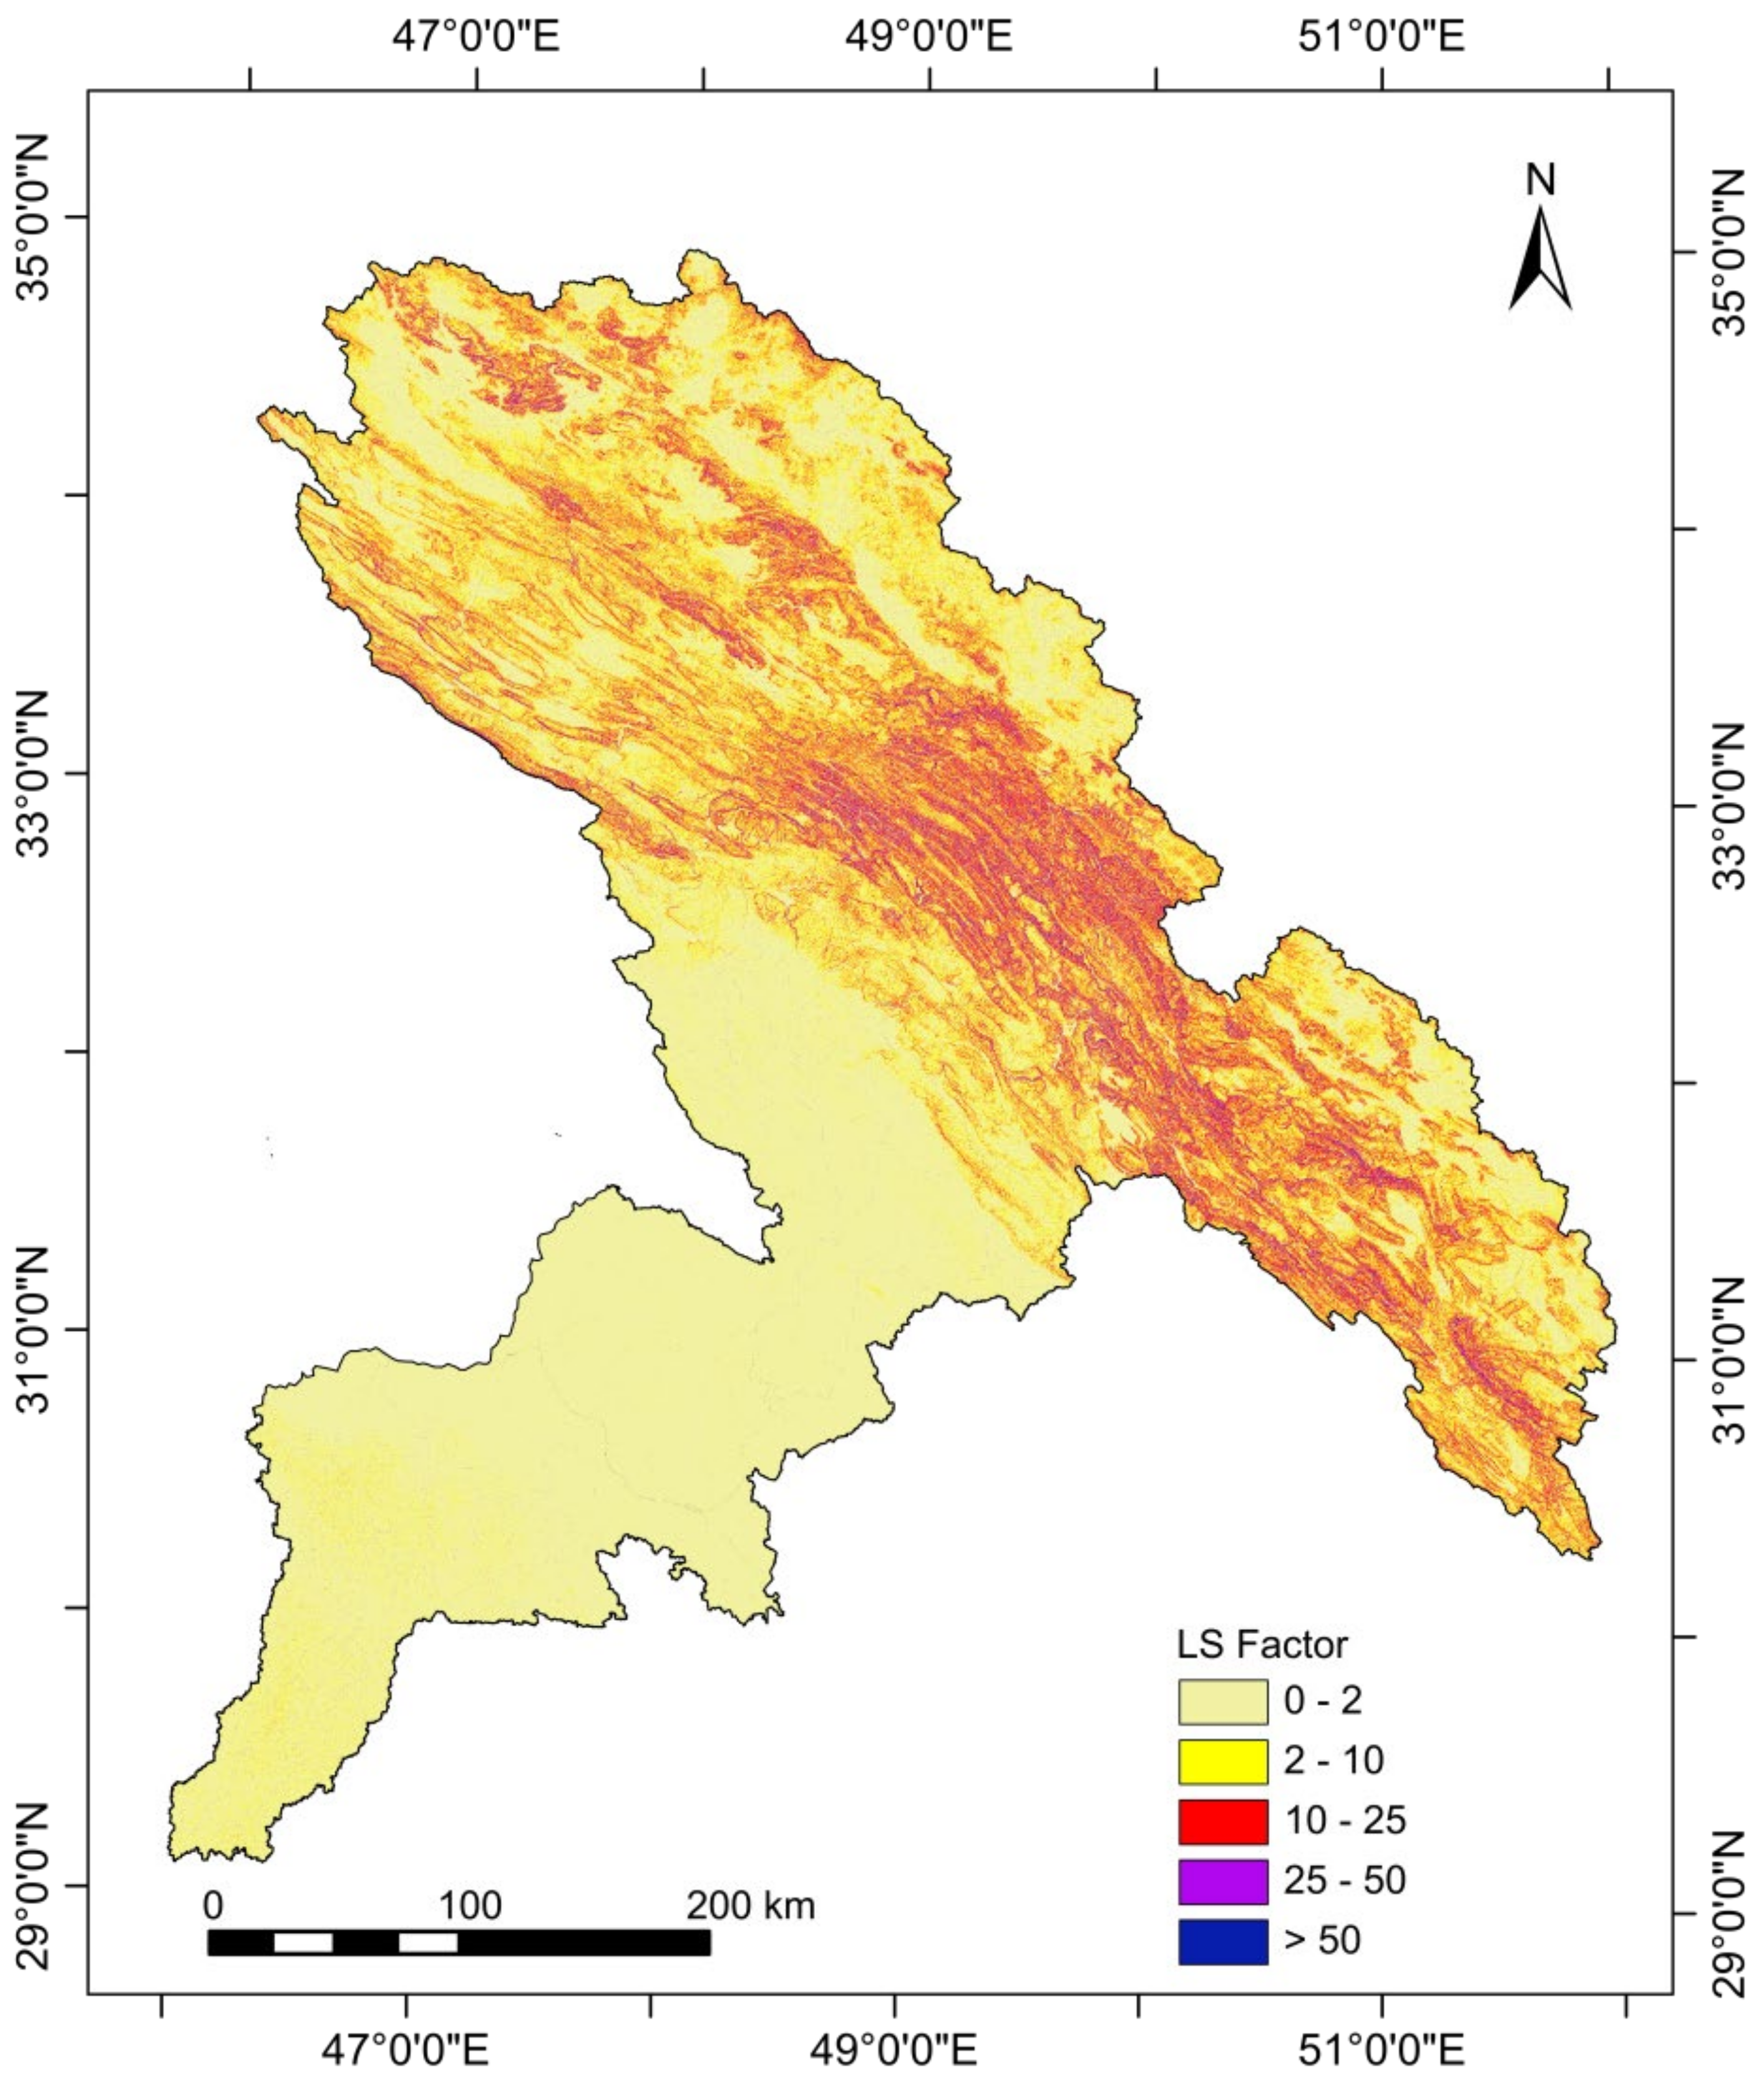
3.3. Slope Length (L) and Slope Steepness (S) Factor (LS Factor)
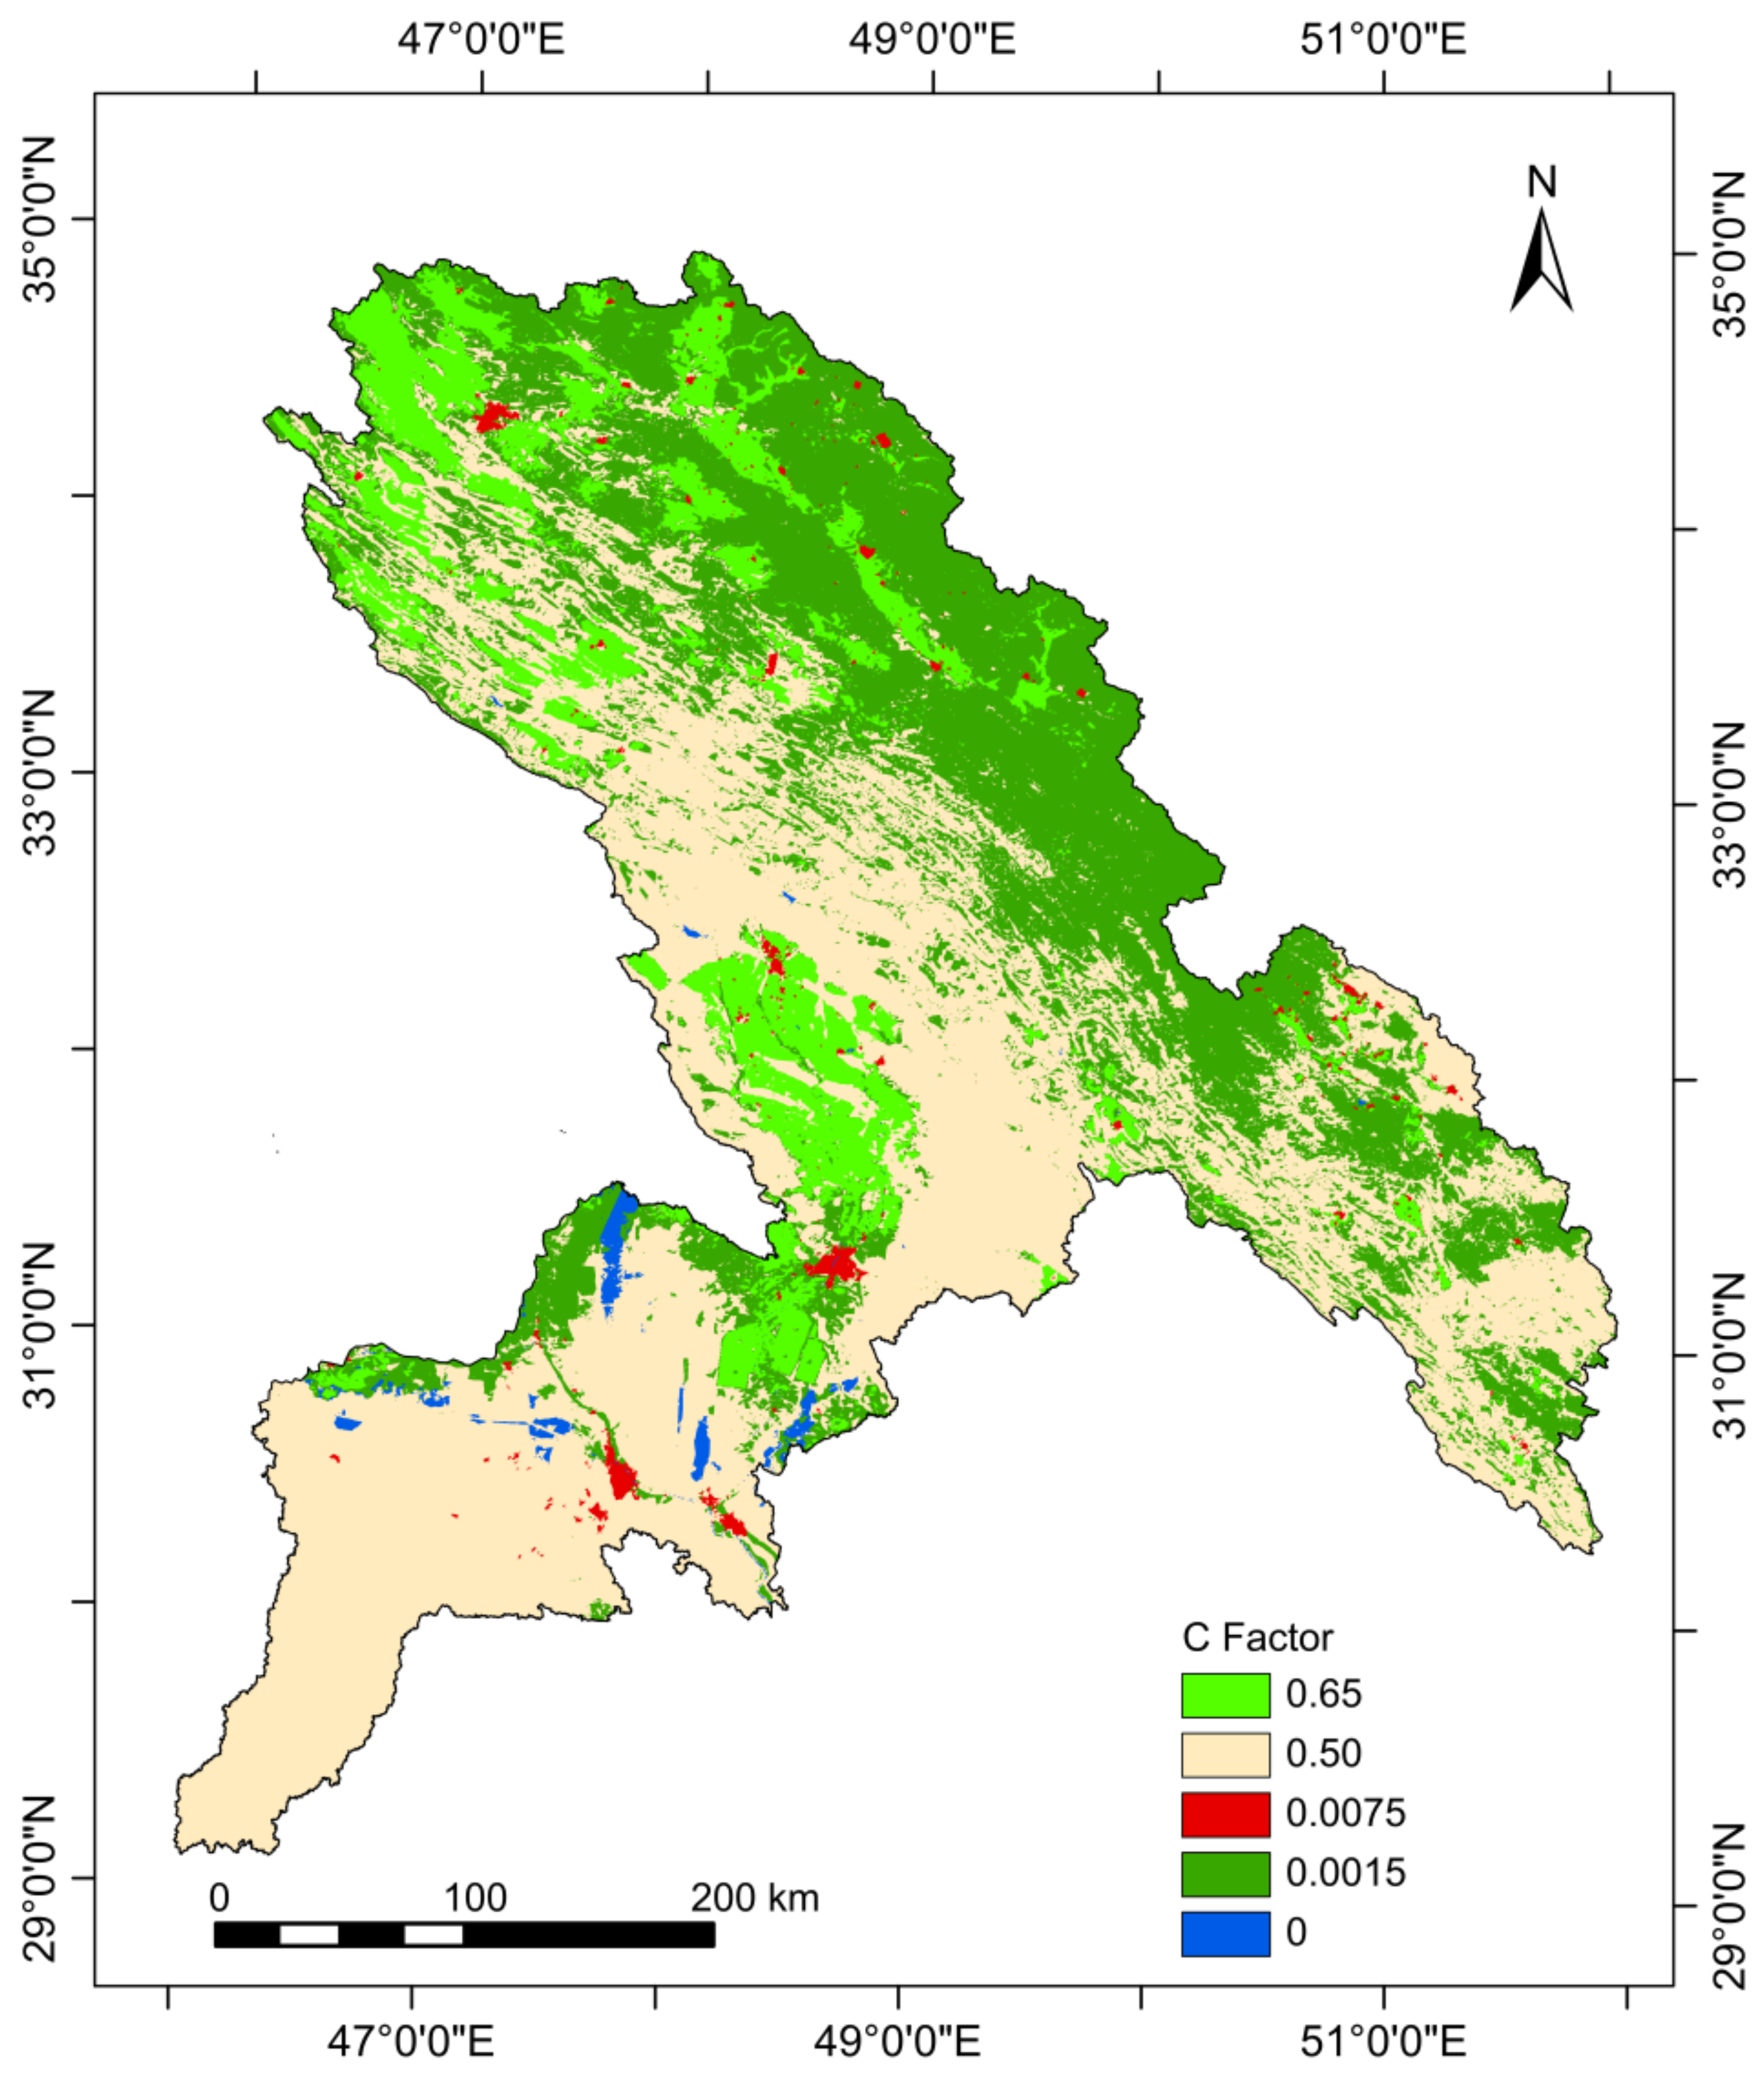
3.4. Cover and Management (C Factor)
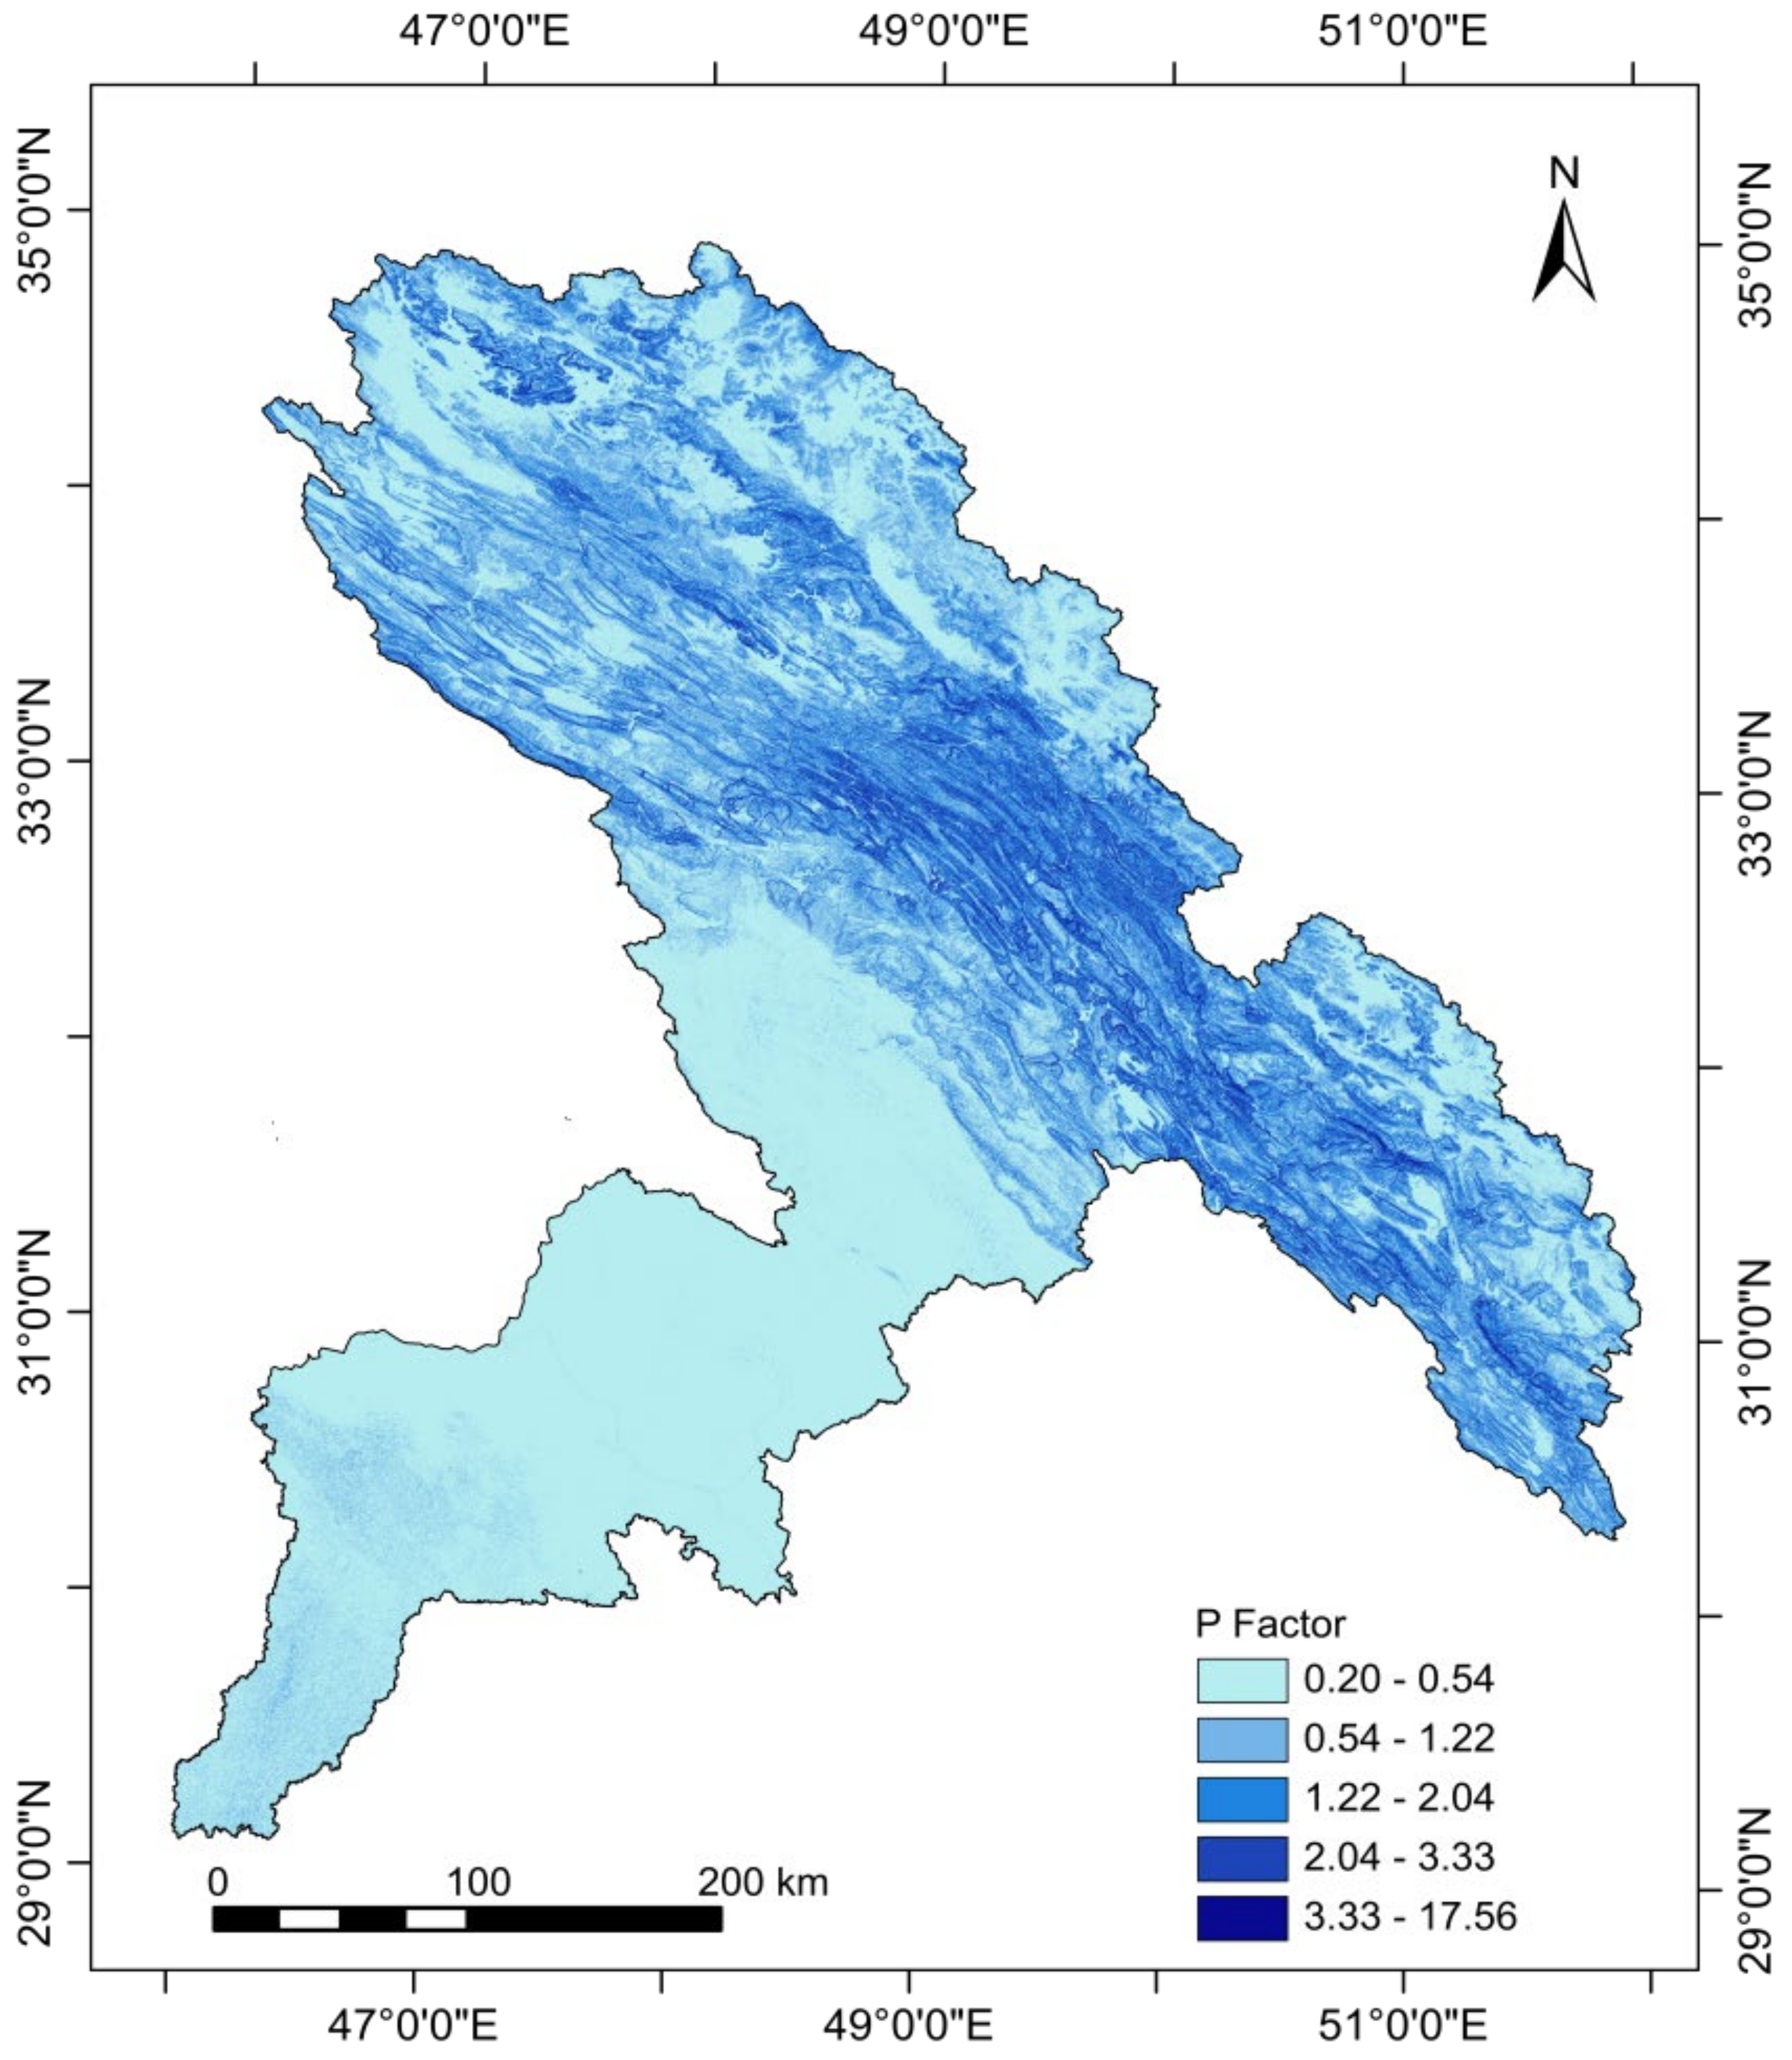
3.5. Conservation Support Practice Factor (P Factor)
4. Results and Discussion
4.1. Rainfall Erosivity Factor (R-Factor)
4.2. Soil Erodibility Factor (K Factor)
4.3. Slope Length (L) and Slope Steepness (S) (LS Factor)
4.4. Cover and Management Factor (C Factor)
4.5. Conservation Support Practice Factor (P Factor)
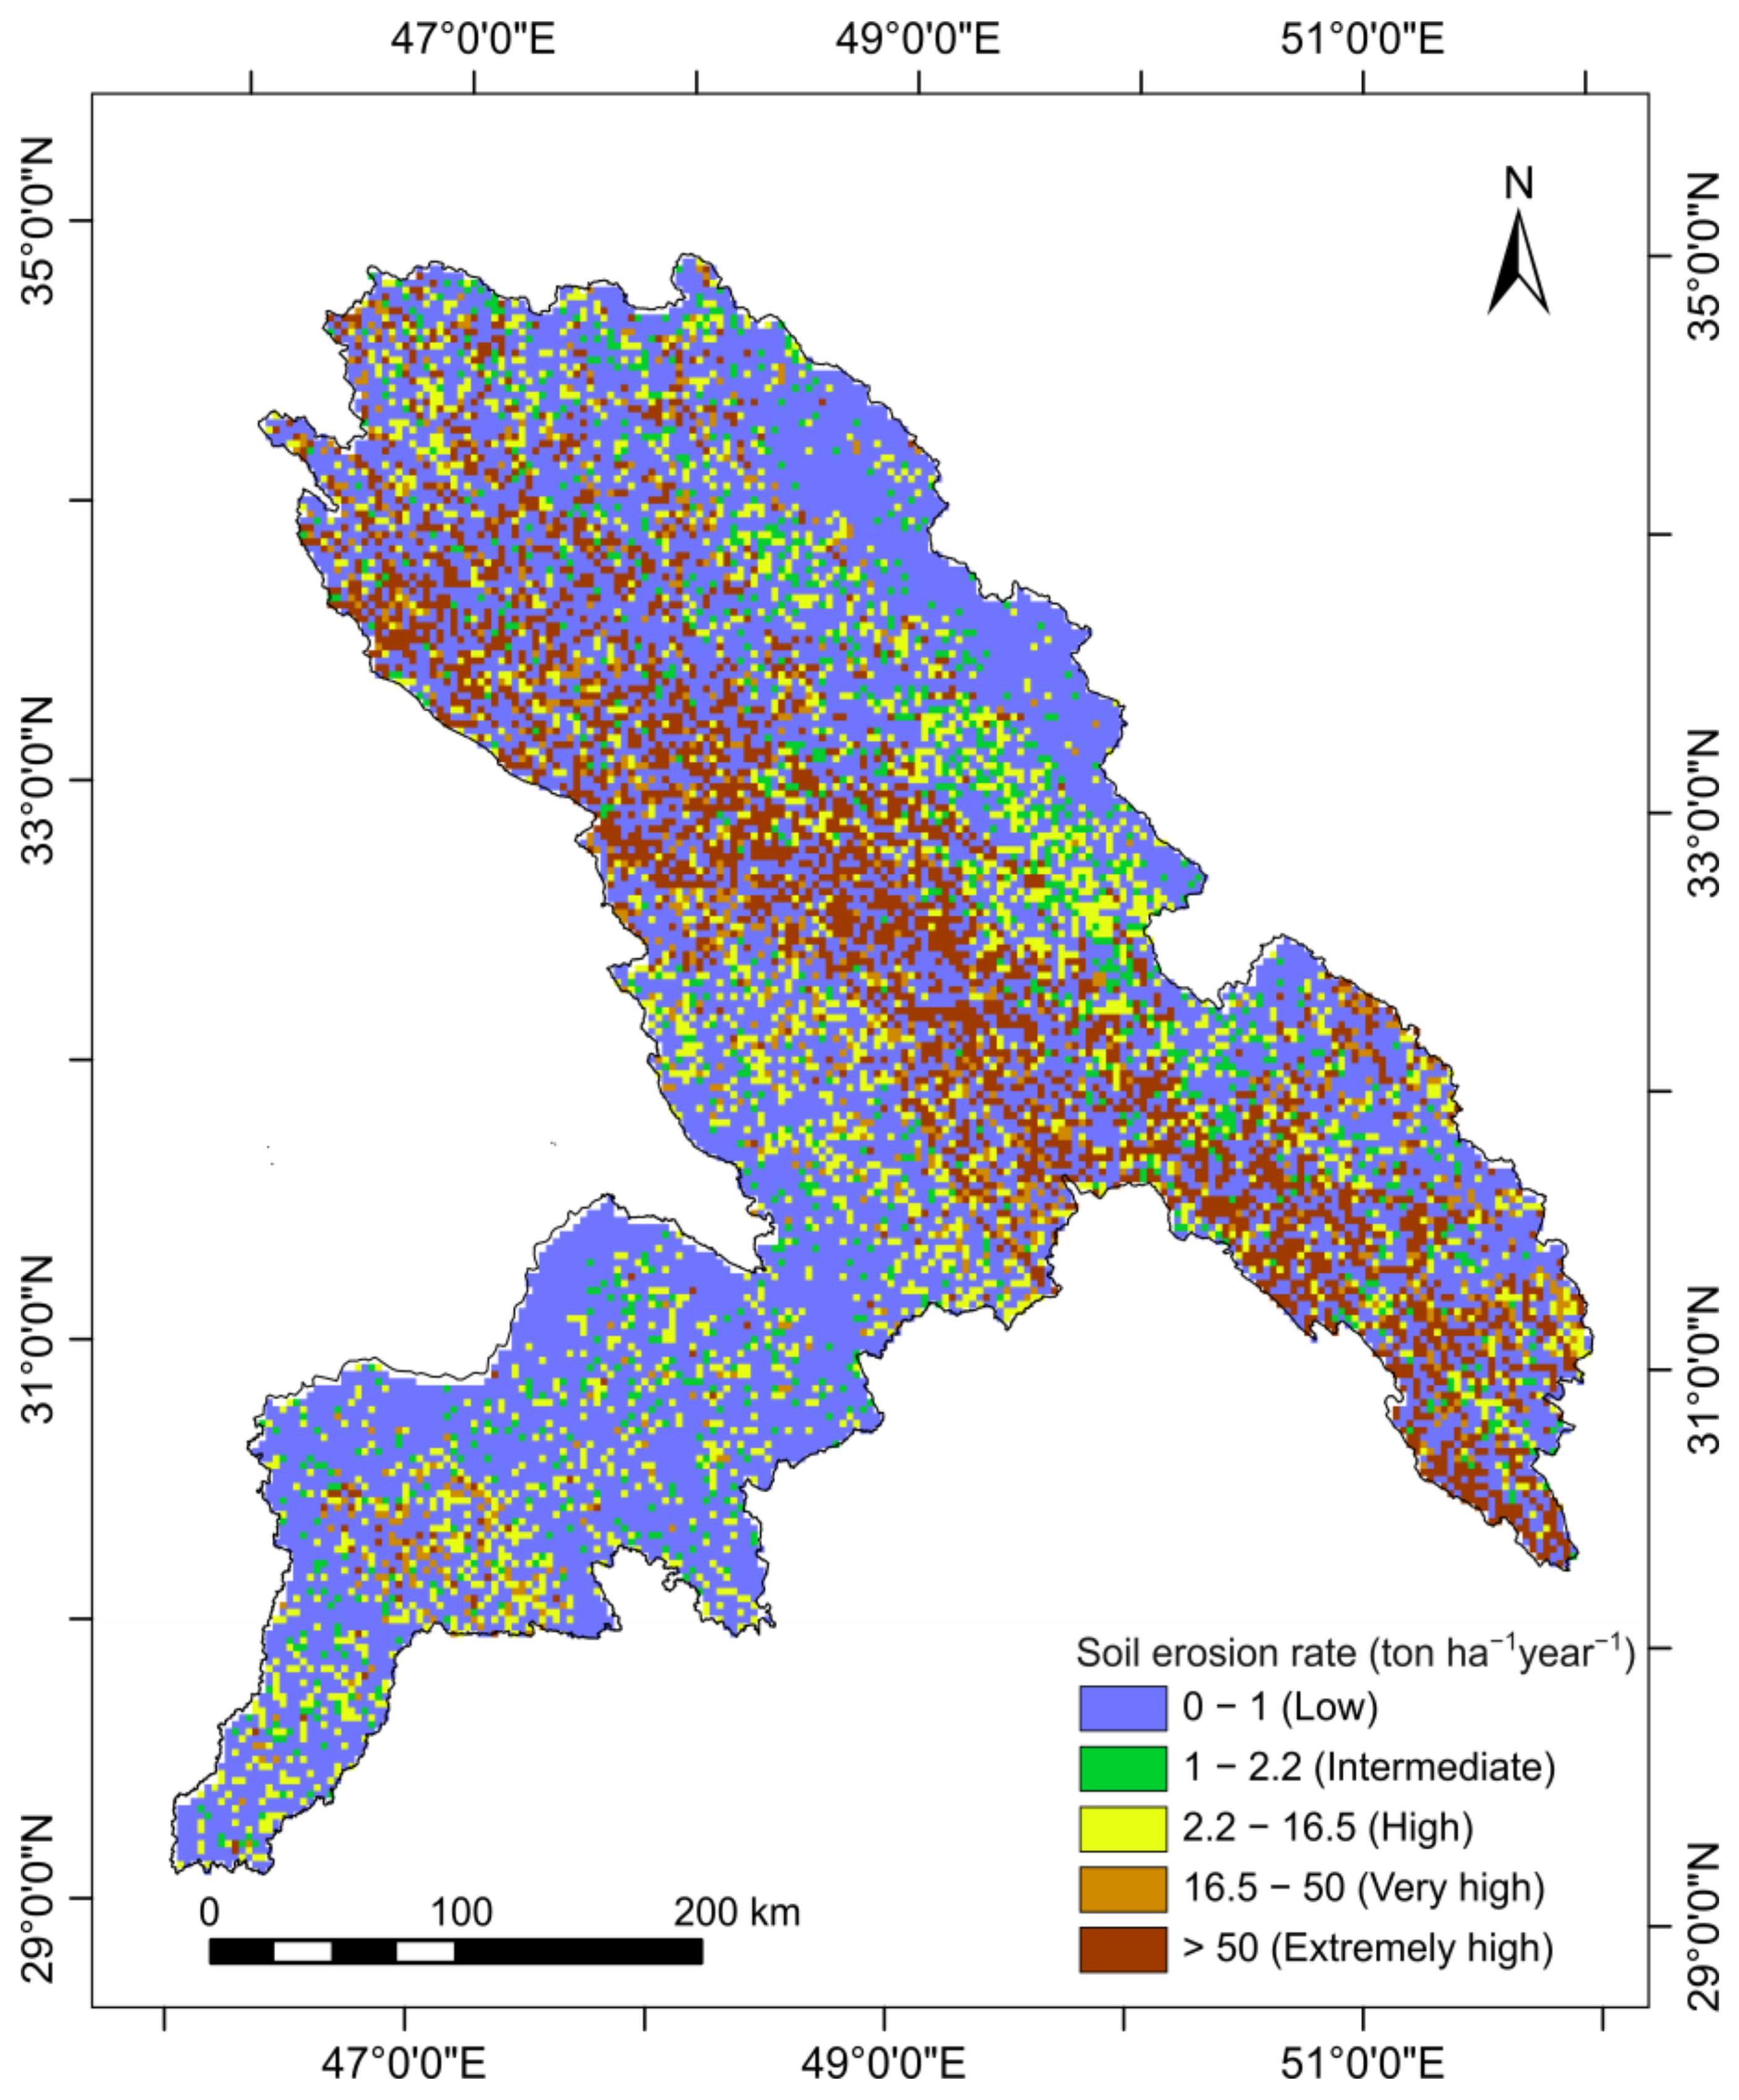
4.6. Estimation of Potential Soil Erosion
5. Conclusions
Author Contributions
Funding
Institutional Review Board Statement
Informed Consent Statement
Data Availability Statement
Conflicts of Interest
References
- Amundson, R.; Berhe, A.A.; Hopmans, J.W.; Olson, C.; Sztein, A.E.; Sparks, D.L. Soil and human security in the 21st century. Science 2015, 348, 1261071-1–1261071-6. [Google Scholar] [CrossRef] [PubMed]
- Robinson, D.A.; Panagos, P.; Borrelli, P.; Jones, A.; Montanarella, L.; Tye, A.; Obst, C.G. Soil natural capital in Europe; a framework for state and change assessment. Sci. Rep. 2017, 7, 6706. [Google Scholar] [CrossRef] [PubMed]
- Keesstra, S.D.; Bouma, J.; Wallinga, J.; Tittonell, P.; Smith, P.; Cerdà, A.; Montanarella, L.; Quinton, J.N.; Pachepsky, Y.; van der Putten, W.H.; et al. The significance of soils and soil science towards realization of the United Nations sustainable development goals. Soil 2016, 2, 111–128. [Google Scholar] [CrossRef]
- Borrelli, P.; Robinson, D.A.; Fleischer, L.R.; Lugato, E.; Ballabio, C.; Alewell, C.; Meusburger, K.; Modugno, S.; Schütt, B.; Ferro, V.; et al. An assessment of the global impact of 21st century land use change on soil erosion. Nat. Commun. 2017, 8, 2013. [Google Scholar] [CrossRef] [PubMed]
- Emadodin, I.; Bork, H. Degradation of soils as a result of long-term human-induced transformation of the environment in Iran: An overview. J. Land Use Sci. 2012, 7, 203–219. [Google Scholar] [CrossRef]
- El Jazouli, A.; Ghafiri, A.; El Moutaki, S.; Ettaqy, A.; Khellouk, R. Soil erosion modeled with USLE, GIS, and remote sensing: A case study of Ikkour watershed in Middle Atlas (Morocco). Geosci. Lett. 2017, 4, 25. [Google Scholar] [CrossRef]
- Gayen, A.; Saha, S. Application of weights-of-evidence (WoE) and evidential belief function (EBF) models for the delineation of soil erosion vulnerable zones: A study on Pathro river basin, Jharkhand, India. Model. Earth Syst. Environ. 2017, 3, 1123–1139. [Google Scholar] [CrossRef]
- Sharda, V.; Mandai, D.; Ojasvi, P.R. Identification of soil erosion risk areas for conservation planning in different states of India. J. Environ. Biol. 2013, 34, 219–226. [Google Scholar]
- World Wildlife Fund. Available online: https://www.worldwildlife.org/threats/soil-erosion-and-degradation#:~:text=The%20effects%20of%20soil%20erosion,water%2C%20which%20can%20worsen%20flooding (accessed on 1 July 2022).
- Maina, C.W.; Sang, J.K.; Raude, J.M.; Mutua, B.M.; Moriasi, D.N. Sediment Distribution and Accumulation in Lake Naivasha, Kenya over the Past 50 Years. Lakes Reserv. Res. Manag. 2019, 24, 162–172. [Google Scholar] [CrossRef]
- World Resources Institute. Available online: https://www.wri.org/insights/causes-and-effects-soil-erosion-and-how-prevent-it (accessed on 1 July 2022).
- Gayen, A.; Saha, S.; Pourghasemi, H.R. Soil erosion Assessment using RUSLE model and its Validation by FR probability model. Geocarto Int. 2019, 35, 1750–1768. [Google Scholar] [CrossRef]
- Comino, J.R.; Keesstra, S.D.; Cerdà, A. Connectivity assessment in Mediterranean vineyards using improved stock unearthing method, LiDAR and soil erosion field surveys. Earth Surf. Process. Landf. 2018, 43, 2193–2206. [Google Scholar] [CrossRef]
- Ministry of Municipalities and Public Works, Iraq. Report on Data Collection Survey on Water Sector in Southern Iraq; Japan International Cooperation Agency NJS Consultants Co., Ltd.: Tokyo, Japan, 2015.
- Financial Tribune. Available online: https://financialtribune.com/articles/environment/33787/soil-erosion-in-iran-costs-more-than-oil-revenue (accessed on 1 July 2022).
- Earthobservatory.nasa.gov. Floods Ravage Iran and Iraq. Available online: https://earthobservatory.nasa.gov/images/144785/floods-ravage-iran-and-iraq (accessed on 1 July 2022).
- Reliefweb, Iran: Floods Appeal n° MDRIR002 Operation Update #04. Available online: https://reliefweb.int/report/iran-islamic-republic/iran-floods-appeal-n-mdrir002-operation-update-04 (accessed on 1 July 2022).
- Reliefweb, Iraq: Flood-Affected Areas in Missan and Basra Governorates as of 18 April 2019. Available online: https://reliefweb.int/map/iraq/iraq-flood-affected-areas-missan-and-basra-governorates-18-april-2019 (accessed on 1 July 2022).
- Savari, M.; Gharechaee, H. Application of the extended theory of planned behavior to predict Iranian farmers’ intention for safe use of chemical fertilizers. J. Clean. Prod. 2020, 263, 1. [Google Scholar] [CrossRef]
- Koohizadeh, M.; AkhondAli, A.; Arsham, A. The Effect of Soil Moisture Levels on the Threshold Velocity of Wind Erosion in Dust Centers of South and Southeast of Khuzestan Province-Ahwaz. Iran. J. Soil Water Res. 2021, 52, 869–885. [Google Scholar] [CrossRef]
- Savari, M.; Yazdanpanah, M.; Rouzaneh, D. Factors affecting the implementation of soil conservation practices among Iranian farmers. Sci. Rep. 2022, 12, 8396. [Google Scholar] [CrossRef] [PubMed]
- Foroushani, M.A.; Opp, C.; Groll, M. Investigation of Aeolian dust deposition rates in different climate zones of Southwestern Iran. Atmosphere 2021, 12, 229. [Google Scholar] [CrossRef]
- Foroushani, M.A.; Opp, C.; Groll, M. Spatial and temporal gradients in the rate of dust deposition and aerosol optical thickness in southwestern Iran. J. Arid. Land 2021, 13, 1–22. [Google Scholar] [CrossRef]
- Bybordi, M. Soil Physics; University of Tehran Press: Tehran, Iran, 2003. (In Persian) [Google Scholar]
- Emadodin, I.; Narita, D.; Bork, H.R. Soil degradation and agricultural sustainability: An overview from Iran. Environ. Dev. Sustain. 2012, 14, 611–625. [Google Scholar] [CrossRef]
- Arekhi, S.; Darvishi, A.B.; Shabani, A.; Fathizad, H.; Ahamdyasbchin, S. Mapping Soil Erosion and Sediment Yield Susceptibility using RUSLE, Remote Sensing and GIS (Case study: Cham Gardalan Watershed, Iran). Adv. Environ. Biol. 2012, 6, 109–124. [Google Scholar]
- Fathizad, H.; Karimi, H.; Alibakhshi, S.M. The estimation of erosion and sediment by using the RUSLE model and RS and GIS techniques (Case study: Arid and semi-arid regions of Doviraj, Ilam province, Iran). Int. J. Agric. Crop Sci. 2014, 7, 304–314. [Google Scholar]
- Mesfln, A. The Nile-source of regional cooperation or conflict. In Proceedings of the Eighth Iwra World Congress on Water Resources “Satisfying Future National And Global Water Demand”, Cairo, Egypt, 21–25 November 1994. [Google Scholar]
- Renard, K.; Foster, G.R.; Wessies, G.A.; Porter, J.P. RUSLE-Revised universal soil loss equation. J. Soil Water Conserv. 1994, 46, 30–33. [Google Scholar]
- Dutta, D.; Das, S.; Kundu, A.; Taj, A. Soil erosion risk assessment in Sanjal watershed, Jharkhand (India) using geo-informatics, RUSLE model and TRMM data. Modeling Earth Syst. Environ. 2015, 1, 37. [Google Scholar] [CrossRef]
- Terranova, O.; Antronico, L.; Coscarelli, R.; Iaquinta, P. Soil erosion risk scenarios in the Mediterranean environment using RUSLE and GIS: An application model for Calabria (southern Italy). Geomorphology 2009, 112, 228–245. [Google Scholar] [CrossRef]
- Jarašiūnas, G.; Świtoniak, M.; Kinderienė, I. Dynamics of slope processes under changing land use conditions in young morainic landscapes, Western Lithuania. Int. Agrophys. 2020, 34, 43–55. [Google Scholar] [CrossRef]
- Auerswald, K. Predicted and measured sediment loads of large watersheds in Bavaria. In Proceedings of the Fifth International Symposium on River Sedimentation, Karlsruhe, Germany, 6–10 April 1992; pp. 1031–1036. [Google Scholar]
- Auerswald, K. Water erosion. In The Encyclopedia of Soil Science; Chesworth, W., Ed.; Springer: Dordrecht, The Netherlands, 2008; pp. 817–822. [Google Scholar]
- Poesen, J.; Nachtergaele, J.; Verstraeten, G.; Valentin, C. Gully erosion and environmental change: Importance and research needs. Catena 2003, 50, 91–133. [Google Scholar] [CrossRef]
- Pan, J.; Wen, Y. Estimation of soil erosion using RUSLE in Caijiamiao watershed. China Nat. Hazards 2014, 71, 2187–2205. [Google Scholar] [CrossRef]
- Prasannakumar, V.; Shiny, R.; Geetha, N.; Vijith, H. Spatial prediction of soil erosion risk by remote sensing, GIS and RUSLE approach: A case study of Siruvani river watershed in Attapady valley, Kerala, India. Environ. Earth Sci. 2011, 64, 965–972. [Google Scholar] [CrossRef]
- Boggs, G.; Devonport, C.; Evans, K.; Puig, P. GIS-based rapid assessment of erosion risk in a small catchment in the wet/dry tropics of Australia. Land Degrad. Dev. 2001, 12, 417–434. [Google Scholar] [CrossRef]
- Lee, S. Soil erosion assessment and its verification using the Universal Soil Loss Equation and Geographic Information System: A case study at Boun, Korea. Environ. Geol. 2004, 45, 457–465. [Google Scholar] [CrossRef]
- Lu, D.; Li, G.; Valladares, G.S.; Batistella, M. Mapping soil erosion risk in Rondonia, Brazilian Amazonia: Using RUSLE, remote sensing and GIS. Land Degrad. Dev. 2004, 15, 499–512. [Google Scholar] [CrossRef]
- Lim, K.J.; Sagong, M.; Engel, B.A.; Tang, Z.; Choi, J.; Kim, K.M. GIS-based sediment assessment tool. Catena 2005, 64, 61–80. [Google Scholar] [CrossRef]
- Bhattarai, R.; Dutta, D. Estimation of soil erosion and sediment yield using GIS at catchment scale. Water Resour. Manag. 2007, 21, 1635–1647. [Google Scholar] [CrossRef]
- Dabral, P.P.; Baithuri, N.; Pandey, A. Soil erosion assessment in a hilly catchment of North Eastern India using USLE, GIS and remote sensing. Water Resour. Manag. 2008, 22, 1783–1798. [Google Scholar] [CrossRef]
- Ismail, J.; Ravichandran, S. RUSLE2 model application for soil erosion assessment using remote sensing and GIS. Water Resour. Manag. 2008, 22, 83–102. [Google Scholar] [CrossRef]
- Tian, Y.C.; Zhou, Y.M.; Wu, B.F.; Zhou, W.F. Risk assessment of water soil erosion in upper basin of Miyun Reservoir, Beijing, China. Environ. Geol. 2009, 57, 937–942. [Google Scholar] [CrossRef]
- Abdo, H.; Salloum, J. Mapping the soil loss in Marqya basin: Syria using RUSLE model in GIS and RS techniques. Environ. Earth Sci. 2017, 76, 114. [Google Scholar] [CrossRef]
- Wischmeier, W.H.; Smith, D.D. Prediction Rainfall Erosion Losses from Cropland East of the Rocky Mountains: A Guide for Selection of Practices for Soil and Water Conservation. In Agricultural Handbook; U.S. Department of Agriculture: Washington, DC, USA, 1965; No. 282; 47p. [Google Scholar]
- Renard, K.G.; Foster, G.R.; Weesies, G.A.; McCool, D.K.; Yoder, D.C. Predicting soil erosion by water: A guide to conservation planning with the revised universal soil loss equation (RUSLE). In USDA Agricultural Handbook; U.S. Department of Agriculture: Washington, DC, USA, 1997; No. 703. [Google Scholar]
- Millward, A.A.; Mersey, J.E. Adapting the RUSLE to model soil erosion potential in a mountainous tropical watershed. Catena 1999, 38, 109–129. [Google Scholar] [CrossRef]
- Lin, C.Y.; Lin, W.T.; Chou, W.C. Soil erosion prediction and sediment yield estimation: The Taiwan experience. Soil Tillage Res. 2002, 68, 143–152. [Google Scholar] [CrossRef]
- Wang, G.; Gertner, G.; Fang, S.; Anderson, A.B. Mapping multiple variables for predicting soil loss by geostatistical methods with TM images and a slope map. Photogramm. Eng. Remote Sens. 2003, 69, 889–898. [Google Scholar] [CrossRef]
- Jasrotia, A.S.; Singh, R. Modeling runoff and soil erosion in a catchment area, using the GIS, in the Himalayan region, India. Environ. Geol. 2006, 51, 29–37. [Google Scholar] [CrossRef]
- Bahadur, K. Mapping soil erosion susceptibility using remote sensing and GIS: A case of the Upper Nam Wa Watershed, Nan Province, Thailand. Environ. Geol. 2009, 57, 695–705. [Google Scholar] [CrossRef]
- Chou, W.C. Modelling watershed scale soil loss prediction and sediment yield estimation. Water Resour. Manag. 2010, 24, 2075–2090. [Google Scholar] [CrossRef]
- Perovic, V.; Zivotic, L.; Kadovic, R.; Dordevic, A.; Jaramaz, D.; Mrvic, V.; Todorovic, M. Spatial modelling of soil erosion potential in a mountainous watershed of South–eastern Serbia. Environ. Earth Sci. 2013, 68, 115–128. [Google Scholar] [CrossRef]
- Abedi, M.; Shafizadeh-Moghadam, H.; Morid, S.; Booij, M.J.; Delavar, M. Evaluation of ECMWF mid-range ensemble forecasts of precipitation for the Karun River basin. Theor. Appl. Climatol. 2020, 141, 61–70. [Google Scholar] [CrossRef]
- Semiromi, F.; Hassani, A.; Torabian, A.; Karbassi, A.R.; Lotfi, F. Evolution of a new surface water quality index for Karoon catchment in Iran. Water Sci. Technol. 2011, 64, 2483–2491. [Google Scholar] [CrossRef] [PubMed]
- Marjanizadeh, S. Developing a “Best Case Scenario” for Karkheh River Basin management (2025 horizon); A Case Study from Karkheh River Basin, Iran. Ph.D. Thesis, University of Natural Resources and Applied Life Sciences, Vienna, Austria, 2008. [Google Scholar]
- Muthuwatta, L.P.; Ahmad, M.D.; Bos, M.G.; Rientjes, T.H.M. Assessment of Water Availability and Consumption in the Karkheh River Basin, Iran—Using Remote Sensing and Geo-statistics. Water Resour. Manag. 2010, 24, 459–484. [Google Scholar] [CrossRef]
- Rahimi, N.; Arian, M.; Ghorashi, M. Active Tectonics of the Saymareh-Karkheh River Basin (Northwest of Persian Gulf, Iran). Open J. Mar. Sci. 2017, 7, 238–257. [Google Scholar] [CrossRef][Green Version]
- TAVO. Tübinger Atlas des Vorderen Orients; Part A IV; Luwig Reichert: Wiesbaden, Germany, 1985. [Google Scholar]
- Allafta, H.; Opp, C. GIS-based multi-criteria analysis for flood prone areas mapping in the trans-boundary Shatt Al-Arab basin, Iraq-Iran. Geomat. Nat. Hazards Risk 2021, 12, 2087–2116. [Google Scholar] [CrossRef]
- Wischmeier, W.H.; Smith, D.D. Predicting rainfall erosion losses. A guide to conservation planning. In Agriculture Handbook; US Department of Agriculture: Washington, DC, USA, 1978; Volume 537, p. 85. [Google Scholar]
- Prasannakumar, V.; Vijith, H.; Geetha, N.; Shiny, R. Regional Scale Erosion Assessment of a Sub-tropical Highland Segment in the Western Ghats of Kerala, South India. Water Resour. Manag. 2011, 25, 3715–3727. [Google Scholar] [CrossRef]
- Ganasri, B.P.; Ramesh, H. Assessment of soil erosion by RUSLE model using remote sensing and GIS—A case study of Nethravathi Basin. Geosci. Front. 2016, 7, 953–961. [Google Scholar] [CrossRef]
- Farhan, Y.; Nawaiseh, S. Spatial assessment of soil erosion risk using RUSLE and GIS techniques. Environ. Earth Sci. 2015, 74, 4649–4669. [Google Scholar] [CrossRef]
- Amellah, O.; el Morabiti, K. Assessment of soil erosion risk severity using GIS, remote sensing and RUSLE model in Oued Laou Basin (north Morocco). Soil Sci. Annu. 2021, 72, 142530. [Google Scholar] [CrossRef]
- Thomas, J.; Joseph, S.; Thrivikramji, K.P. Assessment of soil erosion in a tropical mountain river basin of the southern Western Ghats, India using RUSLE and GIS. Geosci. Front. 2018, 9, 893–906. [Google Scholar] [CrossRef]
- Mohammadi, S.; Karimzadeh, H.; Alizadeh, M. Spatial estimation of soil erosion in Iran using RUSLE model. EcoHydrology 2018, 5, 551–569. (In Persian) [Google Scholar]
- Choudhury, M.K.; Nayak, T. Estimation of soil erosion in Sagar lake catchment of central India. In Proceedings of the International Conference on Water and Environment, Bhopal, India, 15–18 December 2003; pp. 387–392. [Google Scholar]
- Parysow, P.; Wang, G.X.; Gertner, G.; Anderson, A.B. Spatial uncertainty analysis for mapping soil erodibility based on joint sequential simulation. Catena 2003, 53, 65–78. [Google Scholar] [CrossRef]
- FAO Map Catalog. Available online: http://www.fao.org/geonetwork/srv/en/metadata.showpercent3Fid=14116 (accessed on 1 July 2022).
- Indian Remote Sensing and GIS: SWAT Soil Data Download. SWAT Soil Data Download. Available online: http://www.indiaremotesensing.com/p/s.html (accessed on 9 June 2022).
- Stone, R.P.; Hilborn, D. Fact Sheet, Universal Soil Loss Equation; Ministry of Agriculture, Food and Rural Affairs: Guelph, ON, Canada, 2000; p. 12.
- Liu, B.Y.; Nearing, M.A.; Shi, P.J.; Jia, Z.W. Slope length effects on soil loss for steep slopes. Soil Sci. Soc. Am. J. 2000, 64, 1759–1763. [Google Scholar] [CrossRef]
- Lastoria, B.; Miserocchi, F.; Lanciani, A.; Monacelli, G. An estimated erosion map for the Aterno-Pescara river Basin. Eur. Water 2008, 21/22, 29–39. [Google Scholar]
- Moore, I.D.; Burch, G.J. Physical basis of the length-slope factor in the universal soil loss equation. Soil Sci. Soc. Am. J. 1986, 50, 1294–1298. [Google Scholar] [CrossRef]
- Moore, I.D.; Burch, G.J. Modeling Erosion and Deposition. Topographic Effects. Trans. Am. Soc. Agric. Eng. 1986, 29, 1624–1630. [Google Scholar] [CrossRef]
- Earthdata Search. Available online: https://search.earthdata.nasa.gov/search (accessed on 9 June 2022).
- Fayas, C.M.; Abeysingha, N.S.; Nirmanee, S.K.G.; Samaratunga, D.; Mallawatantri, A. Soil loss estimation using Rusle model to prioritize erosion control in KELANI River Basin in Sir Lanka. Int. Soil Water Conserv. Res. 2019, 7, 130–137. [Google Scholar] [CrossRef]
- Olika, G.; Iticha, B. Assessment of soil erosion using RUSLE and GIS techniques: A case of Fincha’a Watershed, Western Ethiopia. Am.-Eurasian J. Agric. Environ. Sci. 2019, 19, 31–36. [Google Scholar]
- Yesuph, A.Y.; Dagnew, A.B. Soil erosion mapping and severity analysis based on Rusle model and local perception in the Beshillo Catchment of the Blue Nile Basin, Ethiopia. Environ. Syst. Res. 2019, 8, 17. [Google Scholar] [CrossRef]
- Swarnkar, S.; Malini, A.; Tripathi, S.; Sinha, R. Assessment of uncertainties in soil erosion and sediment yield estimates at ungauged basins: An application to the Garra River basin, India. Hydrol. Earth Syst. Sci. 2018, 22, 2471–2485. [Google Scholar] [CrossRef]
- United States Geological Survey. EarthExplorer. 2022. Available online: https://earthexplorer.usgs.gov/ (accessed on 9 June 2022).
- Enderle, D.; Weih, R. Integrating supervised and unsupervised classification methods to develop a more accurate land cover classification. J. Ark. Acad. Sci. 2005, 59, 65–73. [Google Scholar]
- McPhee, P.J.; Smithen, A.A. Application of the USLE in the Republic of South Africa. Agric. Eng. S. Afr. 1984, 18, 5–13. [Google Scholar]
- Morgan, R.P.C. Soil Erosion and Conservation, 2nd ed.; Longman: Essex, UK, 1995; 198p. [Google Scholar]
- Shin, G.J. The Analysis of Soil Erosion Analysis in Watershed Using GIS. Ph.D. Thesis, Department of Civil Engineering, Gang-won National University, Gangwon-do, Korea, 1999. [Google Scholar]
- Foster, G.R.; Toy, T.J.; Renard, K.G. Comparison of the USLE, RUSLE1.06c, and RUSLE2 for application to highly disturbed lands. In Proceedings of the First Interagency Conference on Research in the Watersheds, Benson, AZ, USA, 27–30 October 2003; pp. 154–160. [Google Scholar]
- Lufafa, A.; Tenywa, M.M.; Isabirye, M.; Majaliwa, M.J.G.; Woomer, P.L. Prediction of soil erosion in a Lake Victoria basin catchment using GIS based Universal Soil Loss mode. Agric. Syst. 2003, 76, 883–894. [Google Scholar] [CrossRef]
- Fu, B.J.; Zhao, W.W.; Chen, L.D.; Zhang, Q.J.; Lü, Y.H.; Gulinck, H.; Poesen, J. Assessment of soil erosion at largewatershed scale using rusle and GIS: A case study in the Loess Plateau of China. Land Degrad. Dev. 2005, 16, 73–85. [Google Scholar] [CrossRef]
- Institute of Water Research, Michigan State University. Available online: http://www.iwr.msu.edu/rusle/kfactor.htm#:~:text=RUSLE%20%2D%20an%20online%20soil%20erosion%20assessment%20tool&text=K%20factor%20is%20soil%20erodibility,because%20they%20resistant%20to%20detachment (accessed on 9 June 2022).
- Financial Tribune. Available online: https://financialtribune.com/articles/energy/113053/iran-soil-erosion-7-times-global-average (accessed on 1 July 2022).


| Textural Class | K Factor (ton/Hectare) |
|---|---|
| Clay | 0.49 |
| Clay loam | 0.60 |
| Loam | 0.67 |
| Loamy sand | 0.09 |
| Sand | 0.04 |
| Sandy clay | 0.45 |
| Silty clay | 0.58 |
| LULC | C Factor Range | Mean |
|---|---|---|
| Shrubland | 0.01–0.02 | 0.015 |
| Urban | 0.05–0.1 | 0.075 |
| Crops | 0.3–1 | 0.65 |
| Barren | 0.4–0.6 | 0.5 |
| Water/Wetland | 0 | 0 |
Publisher’s Note: MDPI stays neutral with regard to jurisdictional claims in published maps and institutional affiliations. |
© 2022 by the authors. Licensee MDPI, Basel, Switzerland. This article is an open access article distributed under the terms and conditions of the Creative Commons Attribution (CC BY) license (https://creativecommons.org/licenses/by/4.0/).
Share and Cite
Allafta, H.; Opp, C. Soil Erosion Assessment Using the RUSLE Model, Remote Sensing, and GIS in the Shatt Al-Arab Basin (Iraq-Iran). Appl. Sci. 2022, 12, 7776. https://doi.org/10.3390/app12157776
Allafta H, Opp C. Soil Erosion Assessment Using the RUSLE Model, Remote Sensing, and GIS in the Shatt Al-Arab Basin (Iraq-Iran). Applied Sciences. 2022; 12(15):7776. https://doi.org/10.3390/app12157776
Chicago/Turabian StyleAllafta, Hadi, and Christian Opp. 2022. "Soil Erosion Assessment Using the RUSLE Model, Remote Sensing, and GIS in the Shatt Al-Arab Basin (Iraq-Iran)" Applied Sciences 12, no. 15: 7776. https://doi.org/10.3390/app12157776
APA StyleAllafta, H., & Opp, C. (2022). Soil Erosion Assessment Using the RUSLE Model, Remote Sensing, and GIS in the Shatt Al-Arab Basin (Iraq-Iran). Applied Sciences, 12(15), 7776. https://doi.org/10.3390/app12157776