Article

An Explainable Classification Method of SPECT Myocardial Perfusion Images in Nuclear Cardiology Using Deep Learning and Grad-CAM

by
Nikolaos I. Papandrianos
1,
Anna Feleki
1,
Serafeim Moustakidis
1,2,
Elpiniki I. Papageorgiou
1,*,
Ioannis D. Apostolopoulos
3 and
Dimitris J. Apostolopoulos
4
1
Department of Energy Systems, University of Thessaly, Gaiopolis Campus, 41500 Larisa, Greece
2
AIDEAS OÜ, 10117 Tallinn, Estonia
3
Department of Medical Physics, School of Medicine, University of Patras, 26504 Patras, Greece
4
Department of Nuclear Medicine, University Hospital of Patras, 26504 Rio, Greece
*
Author to whom correspondence should be addressed.
Appl. Sci. 2022, 12(15), 7592; https://doi.org/10.3390/app12157592
Submission received: 24 June 2022 / Revised: 22 July 2022 / Accepted: 24 July 2022 / Published: 28 July 2022
(This article belongs to the Special Issue Information Processing in Medical Imaging)

Abstract

:
Background: This study targets the development of an explainable deep learning methodology for the automatic classification of coronary artery disease, utilizing SPECT MPI images. Deep learning is currently judged as non-transparent due to the model’s complex non-linear structure, and thus, it is considered a «black box», making it hard to gain a comprehensive understanding of its internal processes and explain its behavior. Existing explainable artificial intelligence tools can provide insights into the internal functionality of deep learning and especially of convolutional neural networks, allowing transparency and interpretation. Methods: This study seeks to address the identification of patients’ CAD status (infarction, ischemia or normal) by developing an explainable deep learning pipeline in the form of a handcrafted convolutional neural network. The proposed RGB-CNN model utilizes various pre- and post-processing tools and deploys a state-of-the-art explainability tool to produce more interpretable predictions in decision making. The dataset includes cases from 625 patients as stress and rest representations, comprising 127 infarction, 241 ischemic, and 257 normal cases previously classified by a doctor. The imaging dataset was split into 20% for testing and 80% for training, of which 15% was further used for validation purposes. Data augmentation was employed to increase generalization. The efficacy of the well-known Grad-CAM-based color visualization approach was also evaluated in this research to provide predictions with interpretability in the detection of infarction and ischemia in SPECT MPI images, counterbalancing any lack of rationale in the results extracted by the CNNs. Results: The proposed model achieved 93.3% accuracy and 94.58% AUC, demonstrating efficient performance and stability. Grad-CAM has shown to be a valuable tool for explaining CNN-based judgments in SPECT MPI images, allowing nuclear physicians to make fast and confident judgments by using the visual explanations offered. Conclusions: Prediction results indicate a robust and efficient model based on the deep learning methodology which is proposed for CAD diagnosis in nuclear medicine.

1. Introduction

Coronary artery disease (CAD) is the most frequent pathological condition and is the primary reason for mortality worldwide. CAD is an atherosclerotic disease commonly resulting from genetic and environmental circumstances [1,2]. CAD occurs when the blood vessel leading to the heart muscle narrows, resulting in the potential detriment of a part of—or the entire—heart muscle. Early detection can be lifesaving and offers the opportunity for a better quality of life while preventing total heart failure [3,4]. In this direction, updated medical equipment and new experienced staff are both needed in hospitals, demanding a great amount from the healthcare budget, which is not entirely feasible nowadays due to the unfavorable prevailing economic conditions. Therefore, a stable and cost-effective method is being sought. Non-invasive imaging methods are highly favored for diagnosing CAD since they reduce overall costs [5].
Single-photon emission computed tomography (SPECT) myocardial perfusion imaging (MPI) is a preferred technique for the diagnosis of known or presumed CAD [6]. Various procedures have been implemented. However, SPECT MPI has the advantages of presenting the heart in a three-dimensional form, reducing procedure costs, and minimizing radiation exposures while providing an accurate demonstration [7,8]. Visual image interpretation is time consuming and depends on the doctor’s expertise. The number of daily tasks exponentially increases for the doctors, who lack an autonomous computer-aided system that could support them and which would certainly reduce healthcare costs [5,9,10].
Given these considerations, deep learning (DL) [11,12] constitutes an advanced methodology that can provide an integral tool for the detection of various diseases, such as CAD and Parkinson’s, while ensuring efficiency [8,13]. Diagnosis based on computer-aided systems has been well established through the development of DL algorithms, which exhibit a remarkable ability in medical image analysis [14]. Reviewing past studies concerning the application of DL methodologies in image classification, researchers have urged to explore the capabilities of convolutional neural networks (CNNs) to accurately diagnose CAD, also assisting nuclear physicians in their clinical practices [5]. Mainly, CNNs are commonly applied in medical imaging [15], since they are considered an effective and reliable methodology for extracting patterns while achieving tremendous results. They have developed their structures based on the visual perception system. Before the development of CNNs, classification was implemented by utilizing inadequate machine learning (ML) models or by manually extracting features. In contrast, CNNs automatically extract information from image data [4]. It should be noted that there are several research articles [13,14,15,16,17] focusing on the implementation of robust architectures for improving accuracy using SPECT and polar maps as data. The suggested techniques in these studies are based on hand-crafted CNN architectures, ANNs, and transfer learning development using the pre-trained network VGG-16.
Regardless of their remarkable advantages, CNNs are structured by default as black boxes [16] since they do not offer transparency in their internal functionalities. This lack of transparency is a serious limitation of CNNs, especially in medical image analysis, wherein a medical expert must verify each decision made by the algorithm. Recently, special techniques have been developed based on explainable artificial intelligence (XAI [17], which are intended to interpret and explain CNN decisions to the doctor [13]. Grad-CAM (gradient-weighted class activation mapping) is an up-to-date methodology highlighting the crucial regions in which the corresponding prediction focuses in the dataset. This method allows nuclear experts to ensure that the model outputs are clinically verified [18]. Furthermore, in [19], an explainable DL model was built in order to provide nuclear professionals with an autonomous tool for interpreting DL data. More specifically, three doctors analyzed the clinical history, stress, and quantitative perfusion data, then all the data plus DL findings. The diagnosis accuracy of the proposed CAD-DL (AUC 0.779) was substantially greater than without CAD-DL (AUC 0.747, p = 0.003) and the stress total perfusion deficit (AUC 0.718, p = 0.001).
The main aim of this research is to explore the capabilities of a well-known explainability method, Grad-CAM, which can perform the task of explaining the classification outcomes of any RGB-CNN approach proposed in CAD diagnosis. To achieve this, the proposed explainable CNN pipeline makes use of powerful state-of-the-art DL and explainability tools. To the best of our knowledge, this is the first ever application of such an explainable pipeline in the problem of CAD diagnosis using SPECT MPI images. In particular, we implemented an explainable DL model, which can help significantly with the automatic classification of SPECT MPI images. The classification task is a three-class problem that labels images as infarction, ischemia, or healthy images. After thoroughly exploring the CNN architecture and the configuration of certain hyper-parameters, the authors proposed a robust CNN model followed by Grad-CAM, which can predict infarction and ischemia while providing explanations for these decisions. For further evaluation of the model, we applied k-fold cross-validation to estimate its robustness and reliability.

2. Literature

An adequate number of studies have been reported regarding the automatic analysis of SPECT MPI images in CAD diagnosis utilizing DL. In particular, Betancur et al., in [19], developed a CNN to estimate obstructive CAD. The dataset included 1160 SPECT MPI polar map cases without known CAD, in semi-upright and supine positions, and stress demonstrations without predefined coronary territories. Furthermore, sex was added as information between the fully connected layers. The classification was validated by utilizing a novel leave-one-center-out cross-validation procedure with four centers, which is equivalent to external validation. The proposed model was compared against the standard quantitative method cTPD (total perfusion deficit), and it emerged that deep CNN outperformed cTPD. More specifically, DL and cTPD achieved AUCs of 0.81% and 0.78% per patient, and 0.77% and 0.73% per vessel, accordingly. In addition, Betancur et al., in [20], explored the capabilities of CNN and TPD to successfully predict obstructive CAD. A total of 1638 patients without known CAD were included in stress SPECT MPI polar map representations. Moreover, the information about sex was added as an extra reference to the CAD’s characteristics. The results demonstrated that the CNN achieved higher sensitivity than TPD, which was 82.3% and 79.8% per patient and 69.8% and 64.4% per vessel for CNN and TPD, respectively. The proposed model underwent a stratified 10-fold cross-validation procedure to evaluate the prediction. Zahiri et al., in [21], investigated the prediction of abnormalities regarding CAD with the development of CNN. A total of 3318 images of stress polar maps were included, with patients in a supine position. A stratified five-fold cross-validation procedure, including additional rest scans, was used to evaluate the model. An expert reader labeled the images for classification purposes. Furthermore, data augmentation was used to reduce over-fitting and achieve generalizability. The results demonstrated that by adding rest perfusion maps, AUC improved, achieving 0.845 against 0.827, which was only observed in the case of the stress images.
Papandrianos et al., in [22], explored the capabilities of CNNs to diagnose CAD automatically in a two-class classification problem. A total of 513 patients were included in the stress and rest representation, and the possible outputs were normal and abnormal. The data augmentation technique was utilized to increase the number of patients. Regardless of the small size of the dataset, the authors managed to extract magnificent values for AUC, such as 93.77%, with an accuracy of 90.2075%. In [5], Papandrianos et al. targeted the implementation of a CNN to automatically diagnose early signs of CAD (infarction or ischemia) utilizing SPECT MPI data. A total of 224 patients were included in the stress and rest representation. Data augmentation was also used to increase the size of the dataset. The authors implemented an RGB-CNN model and compared the results against a robust technique, which was transfer learning, employing VGG16, DenseNet, MobileNet, and InceptionV3 as pre-trained networks for the classification of images as normal or abnormal. The extracted results demonstrated the model’s great future potential, with an accuracy of 93.47% ± 2.81% and an AUC score of 0.936. Apostolopoulos et al., in [23], focused on using CNNs to categorize polar maps into normal and abnormal. This research consisted of 216 patient cases in a stress and rest demonstration, wherein both attenuation-corrected (AC) and non-corrected (NAC) polar maps were included. Concerning the small dataset, the authors followed two methodologies. The first one was transfer learning and, more specifically, VGG-16, which is widely utilized in image classification tasks. The second methodology applied data augmentation to increase the number of training images. The evaluation of VGG-16 was accomplished through 10-fold cross-validation. The extracted results were also compared against standard semi-quantitative methodologies and experts’ analyses. The pre-trained VGG-16 network outperformed with an accuracy of 74.53%, sensitivity of 75%, and specificity of 73.43%, whereas the accuracy of the semi-quantitative analysis was 66.20%. Apostolopoulos et al., in [24], developed a hybrid method to automatically classify MPI polar maps, concerning the early diagnosis of CAD, in contrast to medical experts’ diagnostic analyses. A total of 566 patients in a stress and rest representation were involved in this research, while the following clinical data were also added: gender, age symptoms, pre-disposing factors, and recurrent diseases. Data augmentation was used to apply variation to the images providing the model with generalizability. The authors developed a hybrid combination of InceptionV3 and random forest (RF) algorithms with the utilization of images and clinical data. The hybrid model with the InceptionV3–Random Forest approach extracted 79.15% accuracy and was similar to the expert’s analysis, achieving a sensitivity of 77.36% and specificity of 79.25%. The results were evaluated with the 10-fold cross-validation technique.
Liu et al., in [6], aimed to investigate a DL approach to improve the diagnostic accuracy of CAD. A total of 37,243 patients in a stress mode were selected in this study, wherein count profile maps were extracted from SPECT MPI images. In addition, clinical data were included, such as gender, BMI, length, stress type, and radiotracer, along with the options of adding or not adding attenuation correction. A DL methodology with transfer learning was developed. More specifically, ResNet-34 was utilized and compared against a conventional quantitative perfusion defect size (DS). The DL prediction was evaluated utilizing five-fold cross-validation. The AUC results for the DL and DS methods were 0.872 ± 0.002 and 0.838 ± 0.003, respectively, the DL method accordingly showing better performance.
Berkaya et al., in [8], proposed two classification models, DL-based and knowledge-based, to identify perfusion abnormalities (infarction and/or ischemia). Concerning the first type, the authors developed transfer learning and a support vector machine (SVM) classifier. In regards to the second model, they focused on the expert readers’ analysis to apply image processing techniques such as segmentation, color thresholding, and feature extraction. The dataset consisted of 192 patients in a stress and rest demonstration. The proposed models extracted results similar to the experts’ analysis, providing an accuracy of 94% and 93%, sensitivity of 88% and 100%, and specificity of 100% and 86% for the DL-based and the knowledge-based models, respectively. Filho et al. in [25] developed an ML algorithm to detect perfusion abnormalities on CAD images. A total of 1007 polar maps were included in the stress and rest representation, wherein each image was split into five vertical and five horizontal slices, and ten attributes were acquired. Moreover, data augmentation was used to increase the normal images of the dataset. The authors employed random forest as a classification algorithm and compared the extracted results with adaptive boosting (AB), gradient boosting (GB), and eXtreme gradient boosting (GB). The RF algorithm outperformed all, attaining an AUC of 0.853, accuracy of 0.938, precision of 0.968, and sensitivity of 0.963.
Nakajima et al., in [26], proposed an artificial neural network (ANN) to diagnose CAD, in contrast to a conventional quantitative approach concerning several metrics. The dataset included 1001 images in a stress and rest demonstration. Furthermore, patient data concerning CAD characteristics were included as additional information in the ANN algorithm. The clinical data were sex, age, weight, height, risk factors, coronary angiography results, and history of percutaneous coronary intervention (PCI) or coronary artery bypass grafting (CABG). For evaluating the model, data from 364 patients were included and utilized as an external validation dataset. The ANN generated a better AUC value (0.9), demonstrating high capabilities for future studies. Ciecholewski et al., in [27], presented three methodologies for diagnosing ischemic heart disease: SVM, principal component algorithm (PCA), and NN. The results from the three methodologies’ implementation were compared against the CLIP3 algorithm, which is a combination of the decision tree algorithm and the rule induction algorithm. A total of 267 SPECT MPI heart images were included, having previously undergone a stress and rest examination. As a result of the complete experiment, the SVM outperformed all and obtained higher accuracy and specificity. Nevertheless, PCA achieved better sensitivity, and the sensitivity of NN was surprisingly low. Otaki et al., in [18], presented an explainable DL model for the extraction of the probability of CAD, with SPECT MPI stress and rest polar maps. A total of 3578 patients were included and clinical data such as age, sex, and cardiac volumes were added. Furthermore, attenuation maps were generated with Grad-CAM, which constitutes an explainable tool that ensures the fact that model predictions are accurate and related to the problem. The CNN model demonstrated higher AUC value (0.83), in contrast to an expert’s visual analysis (0.71) and a quantitative approach (0.78). The results were evaluated with both 10-fold testing and external testing on unseen data.
Chen et al., in [4], examined the utilization of CZT SPECT myocardial perfusion images for the classification of CAD. The authors developed a three-dimensional CNN to classify abnormal and normal patients. In addition, they followed a five-fold cross-validation approach for the hyper-parameter adjustment and experimentation of the model’s ability. The process of visualizing the model’s decision was applied after using Grad-CAM, which produces heatmaps, highlighting the regions that correspond to the predicted class. The CNN model achieved magnificent results in accuracy, sensitivity, and specificity, such as 87.64%, 81.58%, and 92.16%, respectively. Otaki et al. [28] developed a DL model and compared its performance against TPD. A total of 1160 patients, in four different centers, without known CAD were included in raw polar maps in an upright and supine stress MPI demonstration. Besides the images, the following clinical data were added: sex and body mass index (BMI). Grad-CAM was applied to evaluate the CNN. The sensitivity extracted by the DL methodology was higher, in contrast to those of SSS (summed stress score), U-TPD (upright-TPD), and S-TPD (supine-TPD), with values of 82%, 75%, 77%, and 73% in men, and 71%, 71%, 70%, and 65% in women, respectively. Spier et al., in [29], proposed a CNN for automatic CAD analysis. The authors developed a graph CNN for automatically classifying 946 MPI polar maps into normal and abnormal in a stress and rest representation. They further compared the results against three other neural network methodologies. The proposed model extracted similar results to human analysis, which were 89.3% for rest polar maps and 91.1% for stress polar maps. The results were evaluated with the utilization of a four-fold cross-validation procedure. It must be mentioned that heatmaps were generated to visualize the model’s decisions behind the classification. Nazari et al., in [13], developed an explainable technique, namely layer-wise relevance propagation (LPR), which produces an individual relevance map for each patient to explain the 3D-CNN model concerning the classification of DAT-SPECT data in regards Parkinson’s disease. A total of 1296 SPECT MPI images were included and classified by experienced readers into normal and abnormal. The extracted results were magnificent in terms of accuracy, sensitivity, and specificity values, which were 95.8%, 92.8%, and 98.7%, respectively. However, CNN performed similarly to conventional semi-quantitative analysis, as well as to classification and regression tree analysis.
Magesh et al., in [30], focused on the early diagnosis of Parkinson’s disease through the application of XAI and, more specifically, LIME (local interpretable model-agnostic explainer), which is a widely used XAI method for interpreting a model’s decisions. A total of 642 DaTscan SPECT images were included in the corresponding research dataset. The authors employed transfer learning by utilizing the VGG-16 pre-trained network. Moreover, data augmentation was applied to increase the number of training images. The pre-trained model achieved an accuracy of 95.2%, sensitivity of 97.5%, and specificity of 90.9%.
In conclusion, in the above-mentioned related works, there has been a decent number of studies concerning medical imaging cases and the development of a computer-aided system for automatic classification. Nevertheless, XAI has been recently applied in nuclear imaging in a small number of research papers, particularly on CAD, to eliminate the model’s bias; therefore, there is a need for further research and experimentation in this area.

3. Materials and Methods
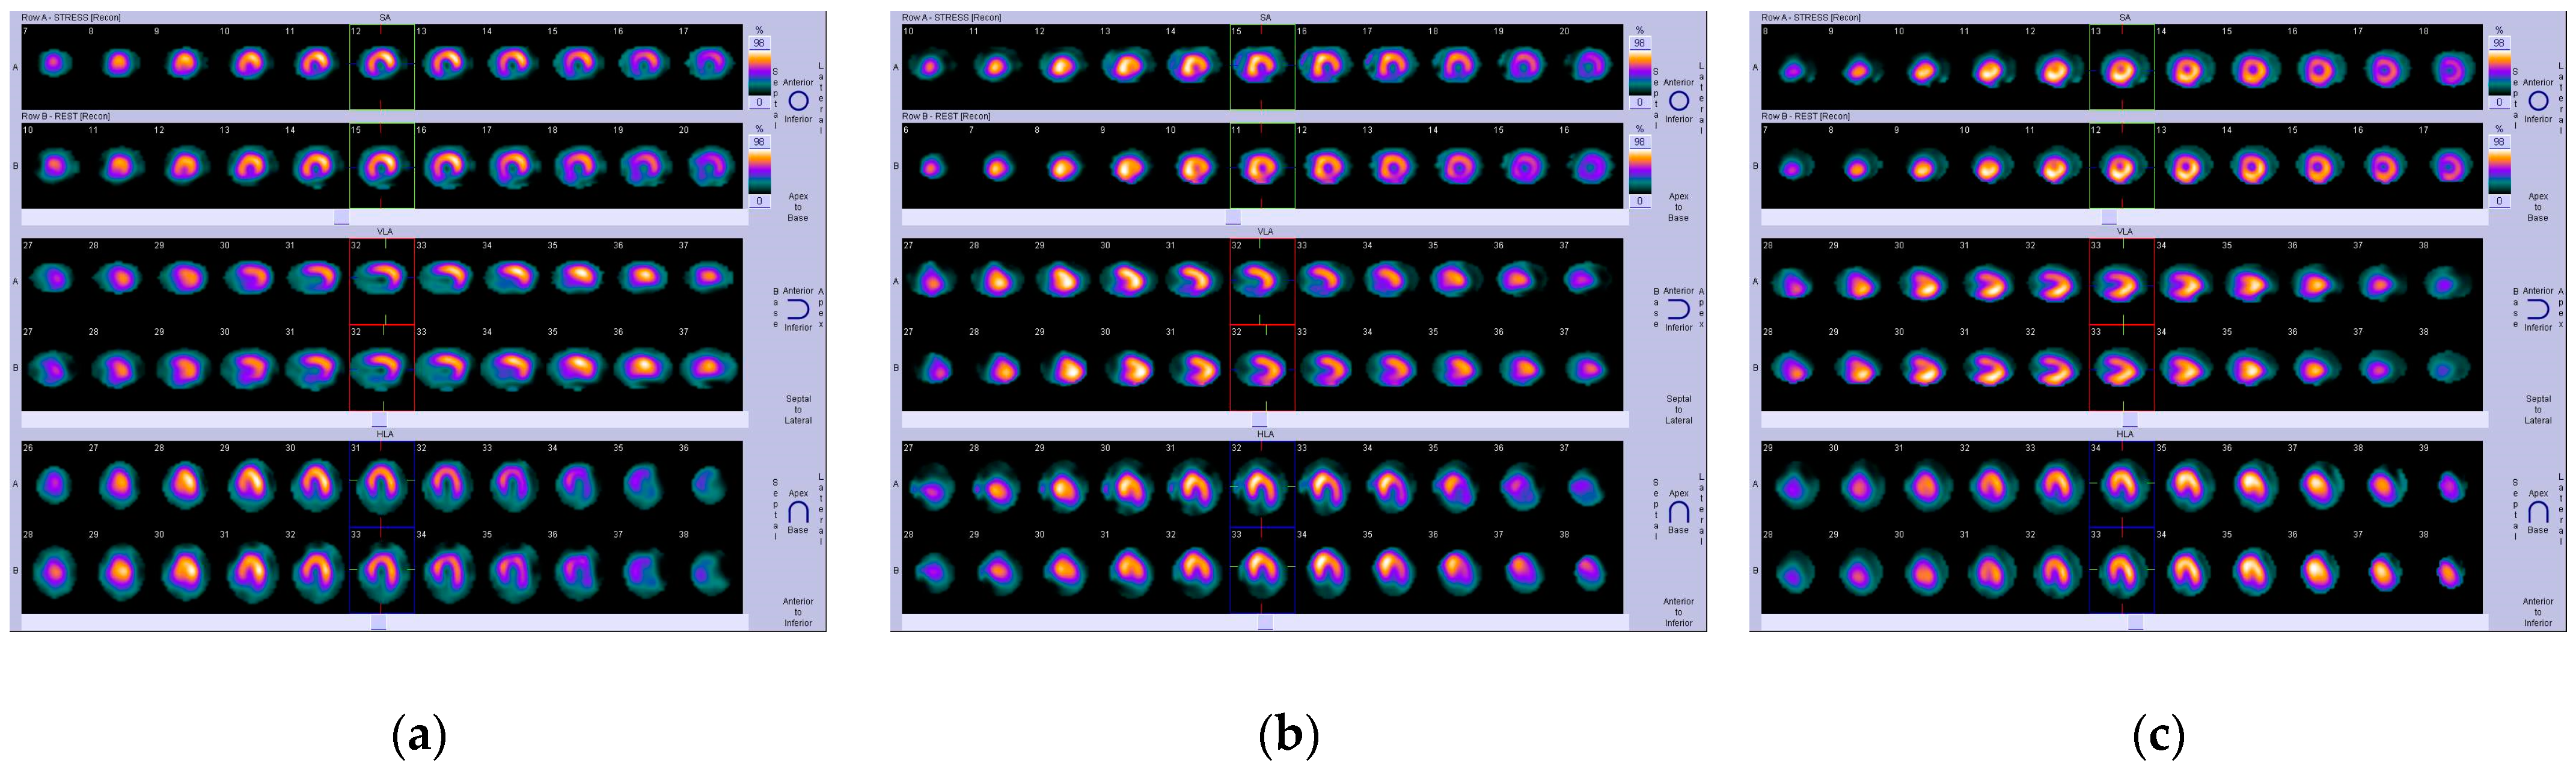
3.1. CAD Dataset

Patient data have been acquired from the Diagnostic Medical Center “Diagnostiko-Iatriki A.E.” in Larisa, Greece, by the Nuclear Department and have been retrospectively examined. The study covers a period from 30 March 2012 to 28 February 2017. Over this period, 842 consecutive patients underwent gated-SPECT MPI with 99mTc-tetrofosmin. A hybrid SPECT/CT gamma-camera system (Infinia, Hawkey-4, GE Healthcare (Chicago, USA)) was used for MPI imaging. Fifty-six (56) patients were excluded from the dataset due to inconclusive MPI results. Our dataset includes a total of 625 patients, of which 127 correspond to infarction, 241 to ischemic, and 257 to normal. The images have been extracted with the SPECT method and illustrate a visual representation of the heart in rest and stress modes.
Two nuclear medicine experts (N. Papandrianos and D. Apostolopoulos) were asked to label each instance of the dataset according to their expertise and experience. The nuclear medicine experts count several years of experience (approximately 15 and 25 years, respectively). The experts completed the labeling using solely the MPI scans from each patient. This way, the model could be directly compared with the human experts. Hence, this study uses the experts’ diagnostic yield as the ground truth and aims to furnish a DL model capable of competing with the human eye and expertise. The ethical committee for our institution approved the study. The nature of the survey waives the requirement to obtain patients’ informed consent. In Figure 1, we provide a representation of all cases.
The clinical characteristics of the dataset are presented in Table 1.
The followed protocol included a 1 day stress–rest injection of Tc-99m tetrofosmin for SPECT imaging. Symptom-limited Bruce protocol treadmill exercise testing (n = 154 [69%]) or pharmacologic stress (n = 69 [31%]) were applied to the patients, while radiotracer was injected at peak exercise or during maximal hyperemia, respectively.
Stress SPECT images were collected in the first 20 min after injecting 7 to 9 mCi 99mTc-tetrofosmin in both medical processes (effort test or pharmacological stress with dipyridamole). Concerning the effort test, patients underwent a treadmill test based on the Bruce protocol and were injected 99mTc-tetrofosmin when the age-predicted maximum heart rate achieved at least 85%, allowing 1 min before the end of the test. During the rest process, a dose of 21–27 mCi 99mTc-tetrofosmin was injected into patients, allowing 40 min for rest imaging to be performed. In particular, 32 projections of SPECT MPI were carried out in a period of 30 s for the stress and 30 s for the rest, before the SPECT system delivered the data. A 140 keV photopeak, a 180 degree arc, and a 64 × 64 matrix were among the configurations that were additionally set up.
This study was approved by the board committee director of the diagnostic medical center “Diagnostiko-Iatriki A.E.”, Dr. Vasilios Parafestas. The director of the diagnostic center waived the requirement to obtain informed consent due to its retrospective nature. All procedures in this study were in accordance with the Declaration of Helsinki.

3.2. Research Methodology

3.2.1. Convolutional Neural Networks: Main Aspects

CNN refers to a computational method that mimics the functionality of the brain’s neurons. CNNs include input, hidden, and output layers, where each layer consists of nodes connected by edges. The term deep neural network applies to a CNN with at least two hidden layers. CNNs have demonstrated great accuracy and efficiency and are trustworthy for use in image recognition tasks. One of their main advantages is that they can operate effectively with only images as input and do not need visual extraction of features [31]. CNNs have established their position in medical image analysis based on their fascinating results [32]. Each layer is described in detail below.
The first layer is the convolutional layer, for which the name denotes the type of neural network. The primary block is a convolutional layer comprising filters that use the convolution operation to build activation maps. Activation maps are made up of extracted patterns based on the input images and are in charge of classifying unseen data.
After that is the pooling layer, inserted after each convolutional layer and down-samples the picture while discarding pixel values categorized as noise. As a result, the computational time decreases, and the pixel values that are relevant to the structure of the CNN are forwarded according to the dataset.
Following that, a dropout layer is added to avoid overfitting. Dropout sets random pixel values to zero so that they are not included in the training method, reducing computing time.
Following that, we have the flatten layer, which turns multi-dimensional data into vectors.
Finally, fully connected layers are applied, connecting each node to the preceding one and calculating the prediction using activation functions. RELU (rectified linear unit) was used for the convolutional layers and softmax was used for the output activation functions [5].

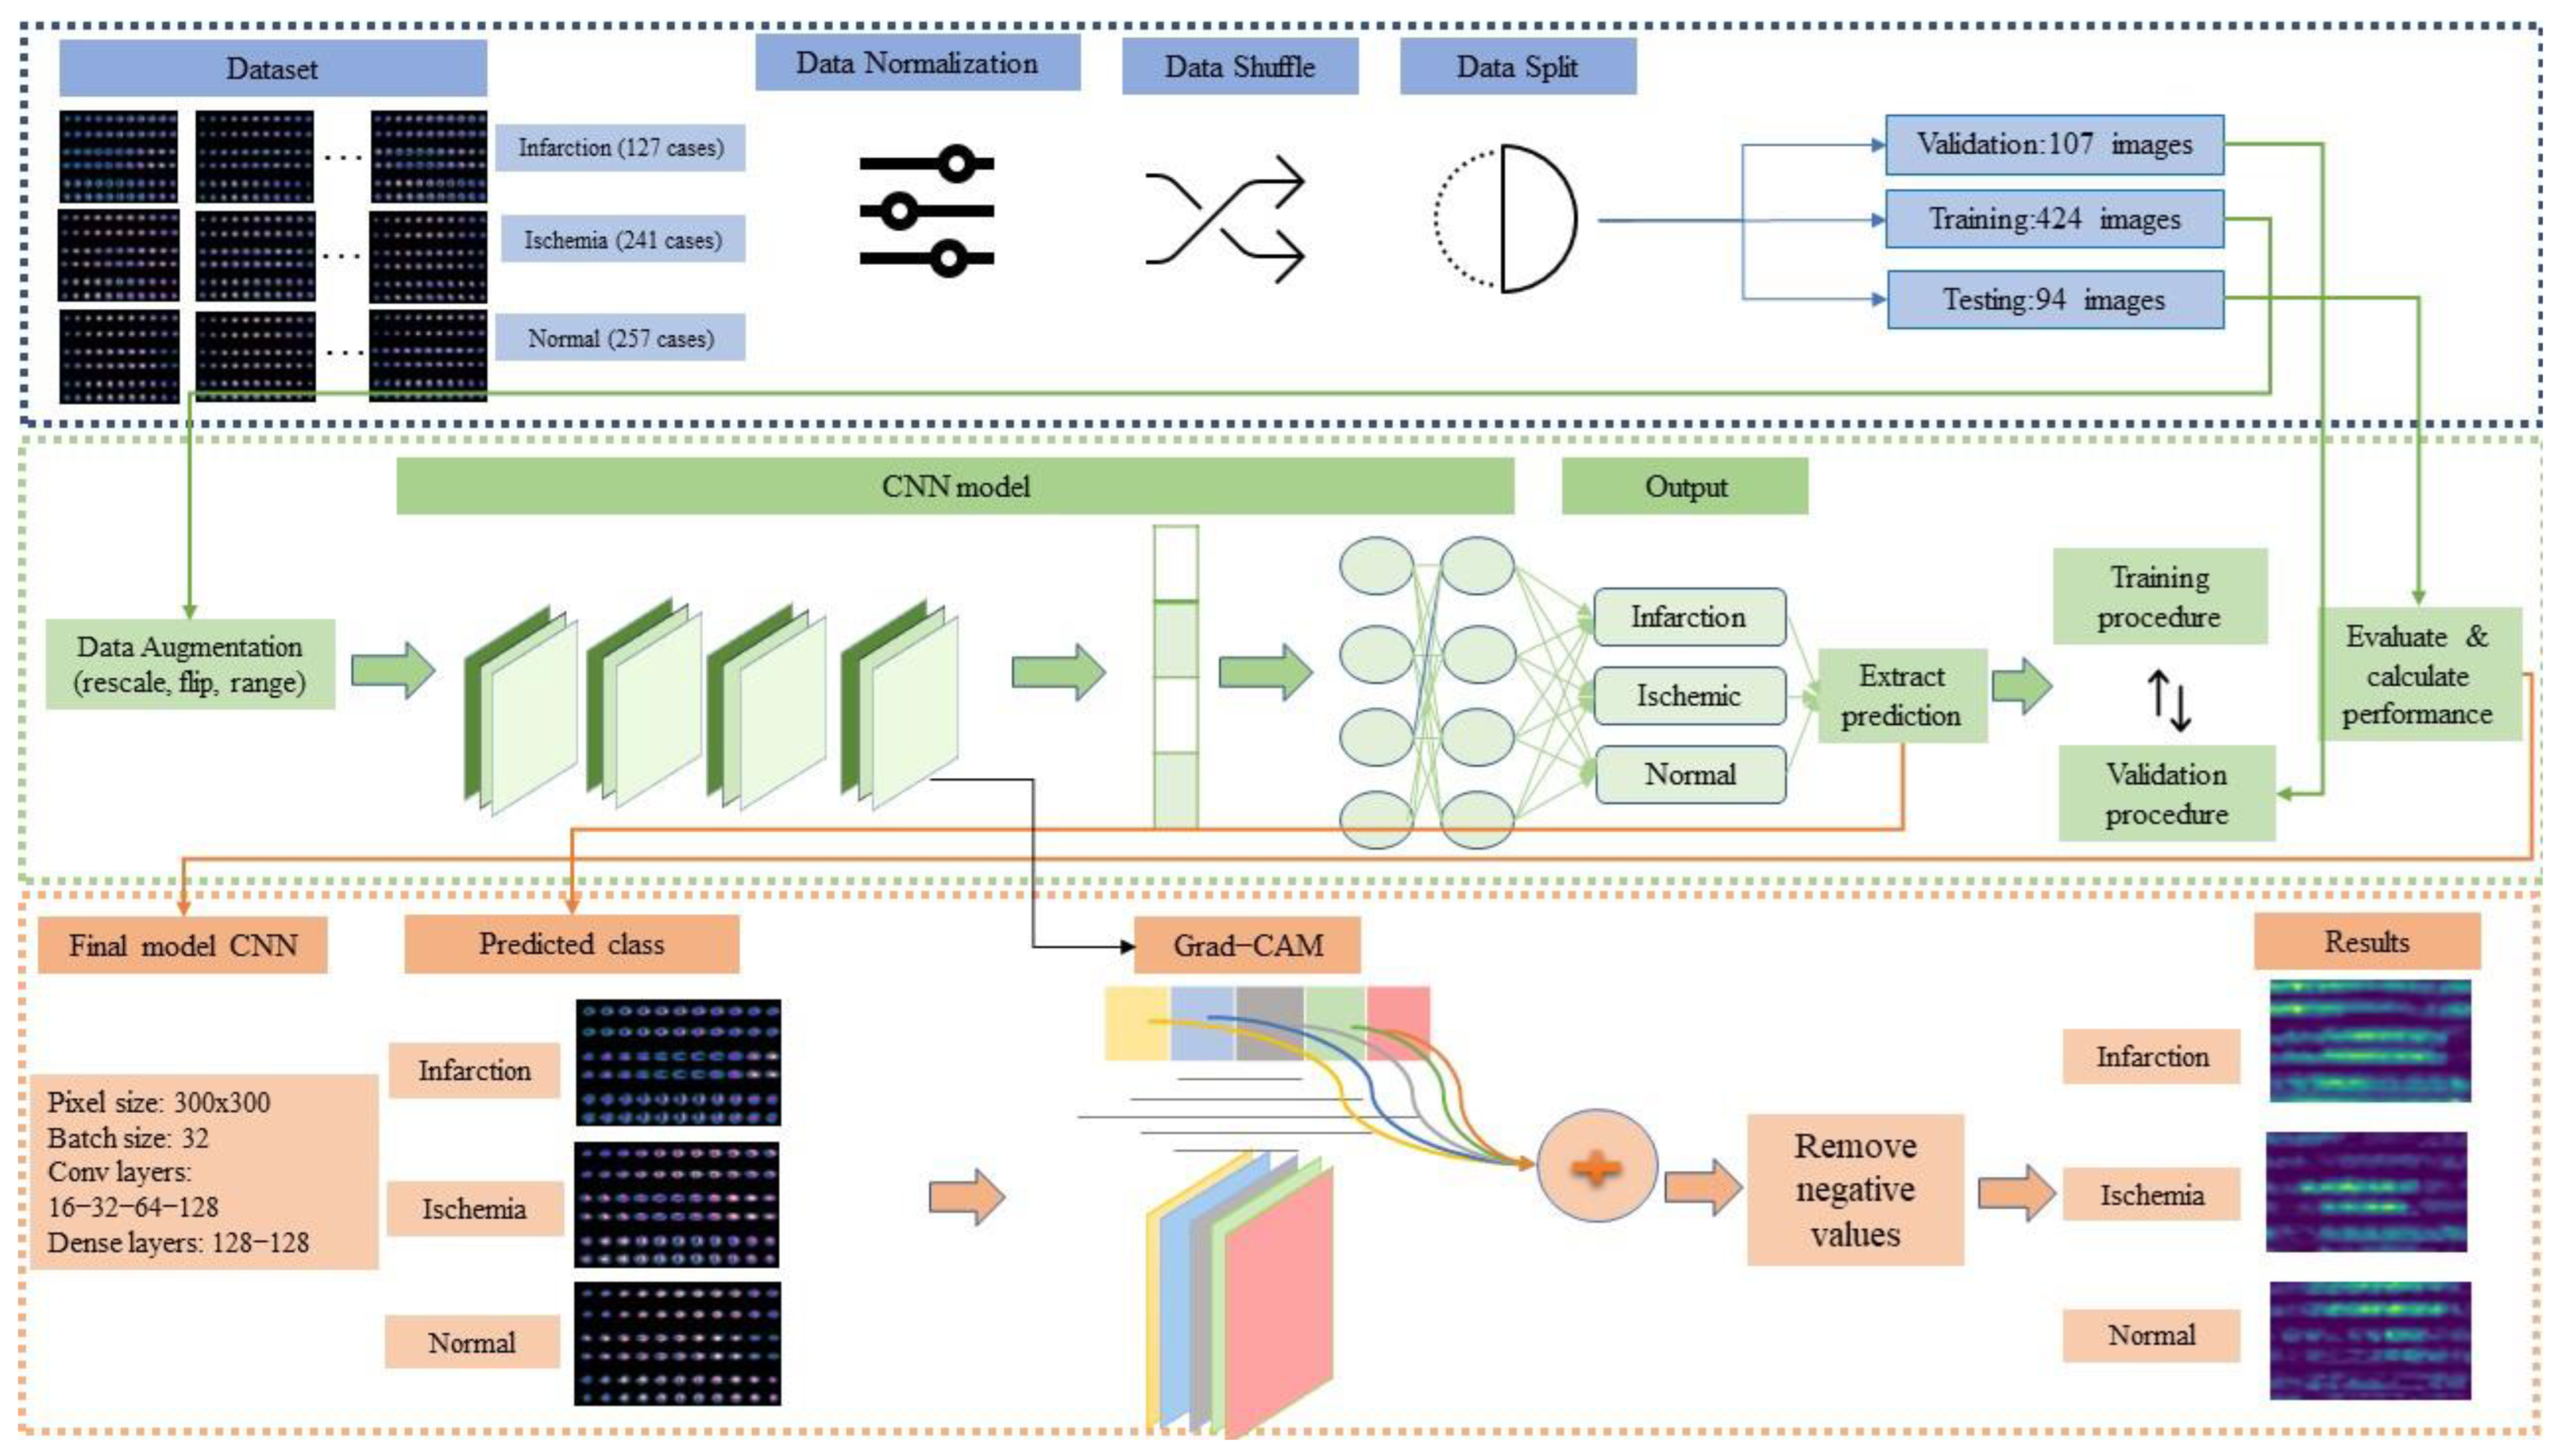
3.2.2. Methodological Framework

This research aims to implement an RGB-CNN model as a promising method in nuclear medical image analysis to classify CAD images into infarction, ischemia and normal, and to provide an autonomous computer-aided system to nuclear medicine experts through the application of Grad-CAM. To explore the development of an explainable AI model in nuclear cardiology for CAD diagnosis utilizing SPECT MPI images, we applied Grad-CAM to an efficient and robust, fully trained CNN model. Grad-CAM has shown critical capabilities concerning the interpretability of neural networks since they are constantly characterized as black box models because of their complex internal functionality. An overview of the experiment can be found in Figure 2.
The methodological flow includes the following parts: (i) loading the dataset; (ii) data pre-processing; (iii) CNN model design and evaluation; and (iv) Grad-CAM application. The steps are as follows:
  • Step 1: Loading dataset
The SPECT MPI images given by the nuclear expert (N.P.) were in RGB (red, green, and blue) format, and the corresponding patients underwent a stress and rest examination. Each instance was classified as infarction, ischemia, or normal, being assigned with 0, 1, and 2, respectively. The final dataset was stored locally in a PC memory. The employed SPECT image acquisition technology produced 22–27 64 × 64 images that illustrated axial views of the myocardial region (slices). All the available slices per patient have been combined, generating a single image of 300 × 300 size.
  • Step 2: Data preparation
  • Data normalization: Data normalization is a common technique in ML classification tasks. This method rescales pixel values by transforming them to the range [0, 1]. This process contributes to the discard of outliers and the effective reduction of computation time.
  • Data shuffle: Before inserting into the algorithm, data has to be shuffled so that the extraction of patterns is as unbiased as possible. Therefore, the data shuffle technique was deployed to provide a random order of data insertion.
  • Data split: We split the dataset into three parts: validation, training, and testing. More specifically, 15% of the entire dataset was given to testing and the remaining 85% was split into 20% for validation and 80% for training.
  • Step 3: Training
  • Data augmentation: Data augmentation is usually employed to increase the small number of datasets. It artificially generates various versions of the existing dataset, utilizing specific data augmentation techniques. In our case, we selected flipping and scaling strategies to achieve generalization and avoid overfitting [33].
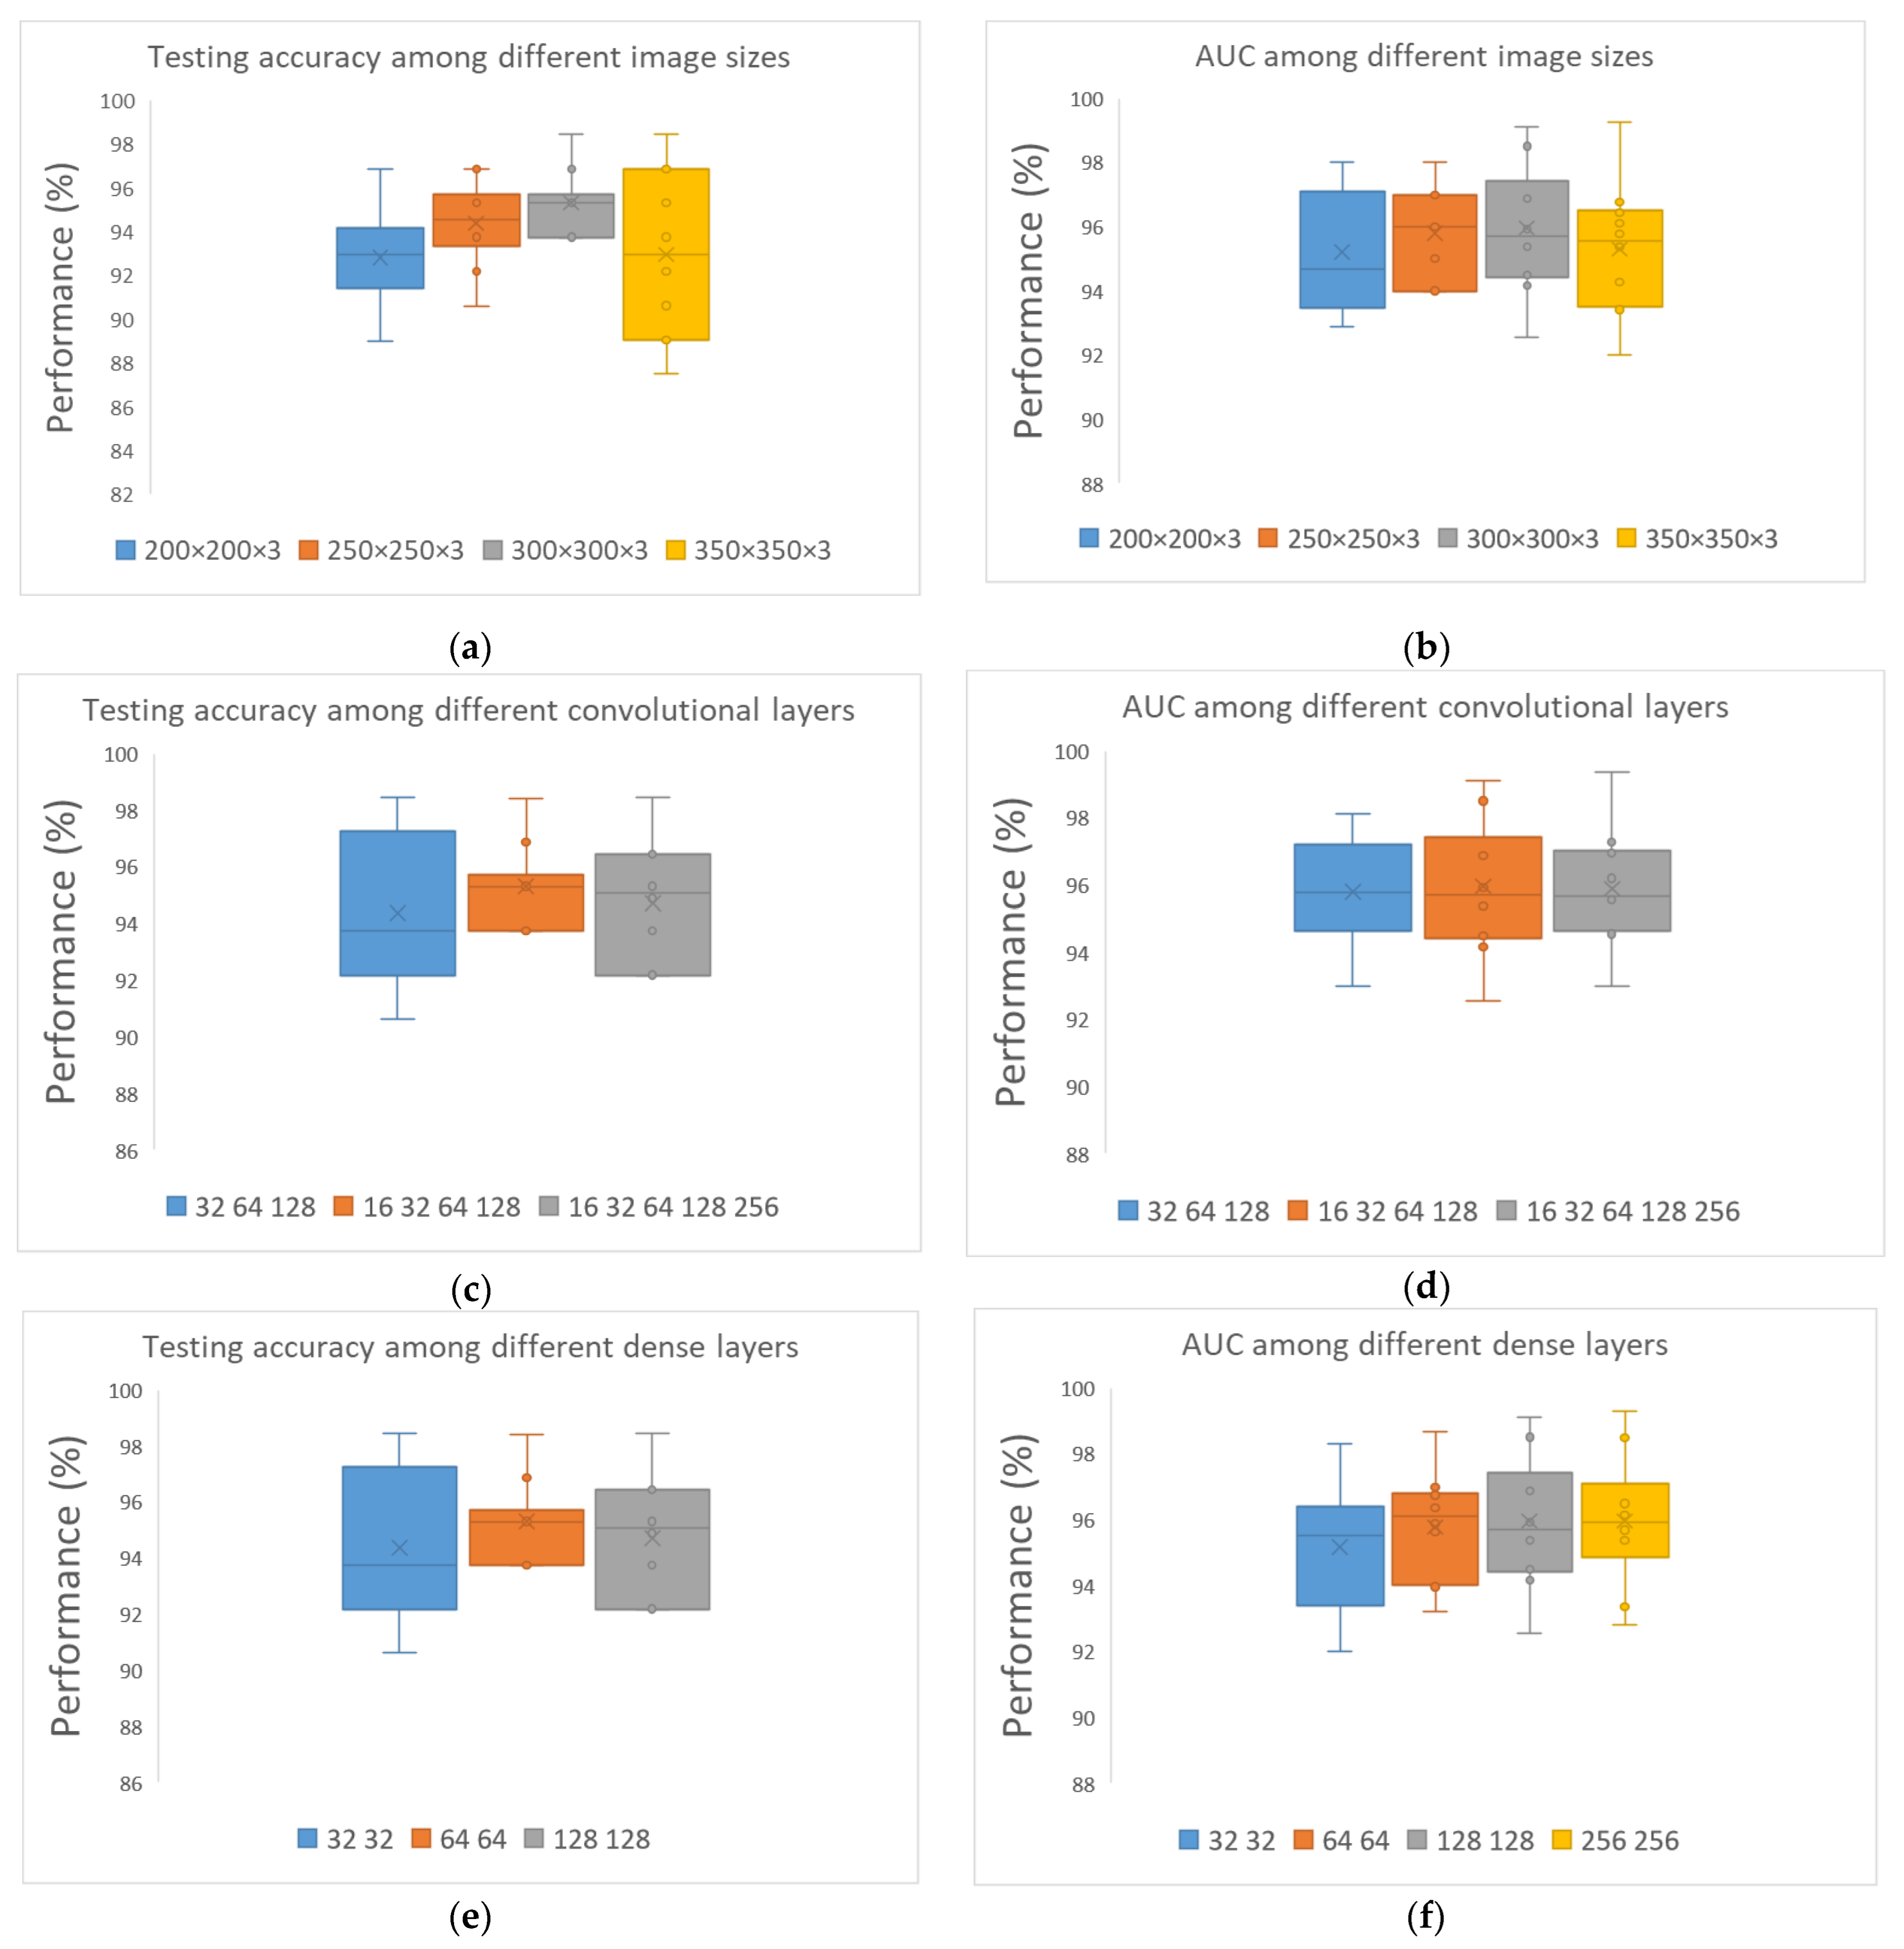
  • Define CNN architecture and activation functions: A detailed analysis was conducted to determine the best CNN architecture. During the experimentation, various values were applied for image size (pixels), batch size, number of nodes and layers for convolutional layers, and number of nodes for fully connected layers. The selection of the activation function is highly crucial since it corresponds to the type of classification problem. For example, the sigmoid function is proposed in binary classification problems, extracting values between 0 and 1 based on a default threshold that categorizes images. On the other hand, softmax is applied in multi-class classification problems, providing probabilities for each possible output, the sum of which is equal to 1 [33,34]
  • Train CNN: In the training process, the gradient backward propagation technique was utilized to find the minimized error by adjusting the weights. In this process, CNN also extracted patterns from input images, which will be used in future classification tasks with unknown data. Furthermore, the loss function and the optimizer must be selected for training the CNN.
  • Step 4: Validation
In the validation step, the validation dataset evaluates CNN in known data. CNN’s hyper-parameters are properly fine-tuned, and the final model is defined.
  • Step 5: Testing
After its training and validation, the best CNN model was developed and tested on unknown data using the testing dataset. CNN’s performance was computed through robust evaluation metrics such as accuracy, loss, AUC, and ROC curve.
  • Step 6: Explainability through Grad-CAM
Since CNNs are not inherently explainable and transparent, post-hoc explainability methods have been employed to inspect the outputs of their layers and visualize them to increase comprehensiveness [35,36]. Towards explainability in our approach, we selected Grad-CAM (gradient-weighted class activation mapping) [37] to interpret the predictions of our CNN model through the production of heatmaps. More specifically, heatmaps highlight regions that indicate a positive impact on the corresponding predicted output of the fully-trained model. To acquire these critical regions, we utilize the extracted gradients/weights of the last convolutional layer of the defined model, which is expected to extract the most important, deep, and abstract features that endorse the final decision [38]. Grad-CAM uses the convolutional layers as they include the spatial information of high-level features of the generated patterns produced during the training process. This is because this spatial information is lost after the flatten layer and the fully connected layers. Therefore, the last convolutional layer’s gradients could help locate the regions that indicate the predicted output [39].
  • Step 7: Inference phase
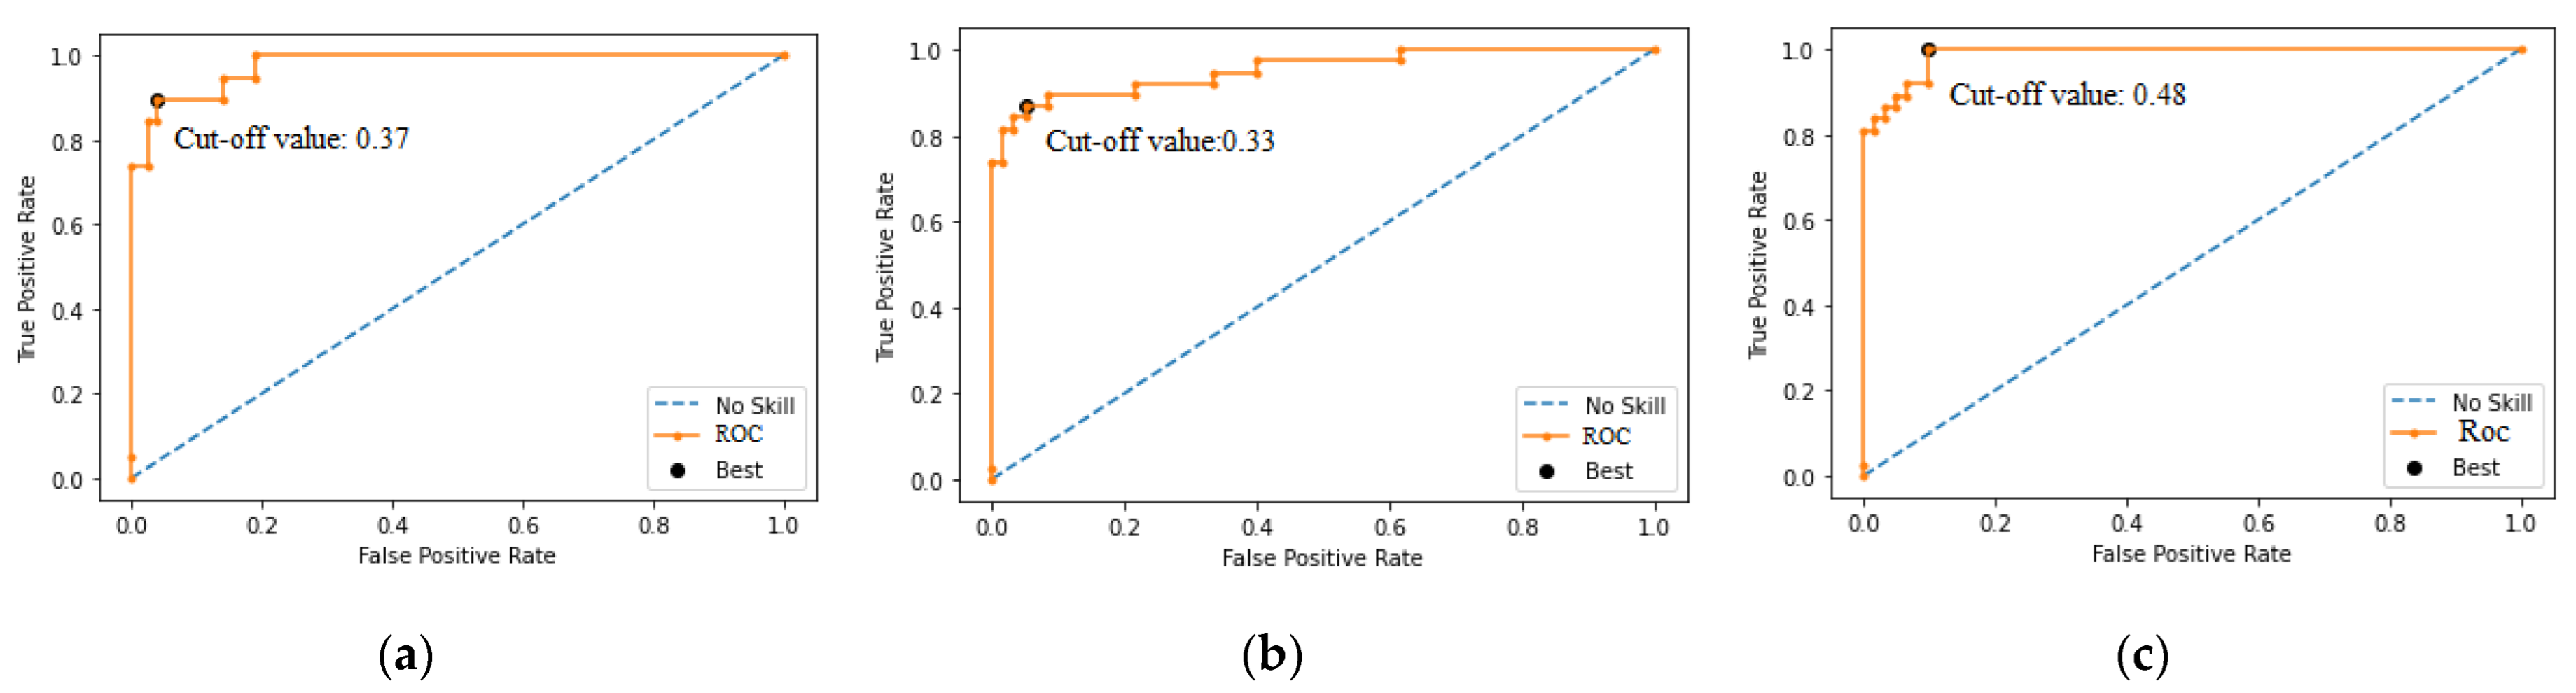
First, our pre-trained classification model is fed with a testing image, preferably an unknown instance of the training dataset, thus producing the extracted output, which the model for the respective image will predict. Next, we calculate the weights of the feature maps produced by the last convolutional layer of the model. Then, we apply GAP (global average pooling) to obtain the alpha values of the weights. Afterward, a heatmap is generated by computing the weighted sum of the acquired feature maps. The heatmap highlights the critical regions that correspond to the predicted output. The produced heatmap is resized to match the dimension of the testing image. It is worth mentioning that the negative values are discarded so that only the pixel values that positively impact the produced heatmap are kept. Moreover, for the overlay functionality, the heatmap is placed on top of the testing image to ensure interpretability with respect to the results [40]. Grad-CAM constitutes a trustworthy explainability algorithm that achieves excellent results, and thus, it can be applied in a wide variety of CNN architectures and pre-trained networks [37].

4. Results

Initially, a thorough exploration of the CNN model architecture was conducted to determine the best model for image classification after various combinations of hyper-parameters such as image size, batch size, convolutional layers, and nodes, as well as the number of dense nodes, were tested. All of the experiments were executed 10 times to compute the average value. The hardware specifications on which the experiments were conducted are processor: Intel(R) Core (TM) i7-8750H CPU @ 2.20 GHz 2.21 GHz; RAM: 8 GB; and system type: 64-bit operating system, x64-based processor. The frameworks Keras 2.8.0 and Sklearn 1.0.2 were used, as well as python language 3.9.7.
To address the three-fold classification problem, various architectures of RGB-CNN algorithm were explored, which involve several batch sizes (8, 16, 32, and 64), image sizes (200 × 200 × 3, 250 × 250 × 3, 300 × 300 × 3, and 350 × 350 × 3), number of layers and nodes for convolutional layers (16–32–64, 16–32–64–128, 16–32–64–128–256, and 32–64–128), and number of nodes for dense layers (32–32, 64–64, 128–128, and 256–256).
We used well-known performance metrics such as accuracy, loss, AUC with confidence interval, ROC curve, sensitivity, and specificity to evaluate the examined CNN architectures. AUC represents the model’s ability to distinguish between the given classes, ranging between 0 and 1, and the higher the performance of the model, the better the differentiation. ROC (receiver operating characteristic) is the visual demonstration of AUC [8].
The experiment started with the default values for batch size, image size, convolutional layers and nodes, and dense nodes, which were 16, 200 × 200, 16–32–64–128, and 128–128, respectively. It must be noted that all runs were conducted for 400 epochs with a drop rate of 0.2 to acquire satisfactory results. Table 2 collects the findings for the various batch sizes while leaving the remaining parameters at their default values. It emerges that the model performs better regarding the relevant metrics for a batch size of 32.
Afterward, we examined different image sizes while keeping fixed values for convolutional and dense layers, considering that 32 is the best batch size. In Figure 3a, we can clearly distinguish the remarkable results extracted for 300 × 300 in contrast to the rest of the structures. Thus, 300 × 300 is the best combination for the corresponding dataset. In Figure 3b, the computed outcomes concerning the utilization of various combinations of convolutional layers are presented. The formation of 16–32–64–128 convolutional layers seems to have performed better in all metrics. Next, various numbers of nodes were examined, producing the results that are visually depicted in Figure 3. It is concluded that the best sequence is 128–128, wherein all metrics are considered.
At this point, deep neural networks (such as CNNs) have made advances in large sample size applications. However, they are susceptible to overfitting and high-variance gradients when dealing with high-dimensional and low-sample size data. In our study, we explored a relatively small dataset; therefore, increasing the number of the image size (feature dimensionality) means that we increase the number of CNN network’s parameters (its complexity), making it more prone to overfitting. In our experiments, we are attempting to determine the image size that provides the ideal balance between accuracy and complexity. Various architectures for our RGB model and each combination were executed for at least 10 runs so that a robust and reliable model was finally built. The ultimate architecture for RGB is 300 × 300 for image size, 32 for batch size, 16–32–64–128 for convolutional layers, and 128–128 for dense layers.
Table 3 gathers all the robust metrics values produced by the exploration process. Our concluded structure achieved promising results and outperformed the rest of the structures.
Following the exploration and the definition of the best CNN model, a robust technique was applied to evaluate the CNN’s capabilities further. This technique is k-fold cross-validation, where k is the number of parts into which the dataset is divided. In our case, we distributed our dataset into 10 parts, of which 9 were utilized as training and 1 as testing. This method was iterated several times until each part was used for testing [41]. Table 4 presents the outcomes demonstrating that the RGB-CNN model delivers excellent robustness and efficiency.
It is observed that the results produced from the 10-fold cross-validation are similar to the results produced by the data split method, indicating that the proposed model provided sufficiency and robustness (see Table 5).
To cope with explainability, Grad-CAM was utilized in this research work to provide predictions with interpretability. To verify the feasibility of the Grad-CAM, we conducted experiments on the proposed medical image classification model producing improved visualization results. In addition, the results were assessed by a nuclear medicine physician to support the decisions in this domain.
Figure 4 shows the visualization results produced by the Grad-CAM for each CAD category. Among them, we can distinguish the original images for each category, the heatmaps generated by the Grad-CAM method, and the visualization result generated by superimposing the original image on the heatmap. Different colors indicate the importance of pixels in the classification results, representing the sensitivity of the CNN-based classification model to each pixel. The colormap Viridis, which was obtained from the OpenCV library, was used.
For implementing the process of acquiring the correct results, Grad-CAM was initially fed with the extracted gradients of the images produced from the last convolutional layer of the model, generating the expected heatmaps. The heatmaps are two-dimensional and indicate the impact on the predicted output for each pixel value. In our study, Viridis colormap was selected. The high-impact value is displayed in yellow, whereas the low-level value is displayed in dark blue. Next, the overlay technique was applied, placing the produced heatmaps above the original image. This comparison can offer a better understanding to the nuclear experts. Based on the results, the generated heatmaps provide interpretation and compatibility to nuclear diagnoses concerning infarction and ischemic cases. It should be mentioned that Grad-CAM was applied in new images that were excluded from the training procedure to emulate a case with unseen data.
In what follows, we provide some indicative visualization results of the Grad-CAM employment in several cases concerning infarction, ischemia, and normal. In particular, three cases were selected from each one of the three categories. RGB-CNN correctly classified these cases, while Grad-Cam was employed to visualize regions contributing to disease prediction on SPECT MPI images.
In Figure 5a, according to the physicians’ diagnosis (N.P.), a large, fixed defect was present on all three slice orientations (SA–short axis, VLA–vertical long axis, and HLA– horizontal long axis images). In particular, this SPECT MPI scan showed a case of myocardial infarction with a fixed reduction in perfusion in the apex (see slice 9 in SA and slices 31–32 (row A) in VLA), extending to several apical segments to the mid-anterior and the mid-lateral wall—see slices 12–15 (row A) and slices 13–16 (row B) in SA, post-stress and at rest, respectively; slices 29–34 (row A and row B in VLA), slices 27–36 (row A), and 29–37 (row B) in HLA, at stress and rest, respectively. Before the classification process, the initial image was processed following the steps defined in Section 3.2.2 (see Figure 5b).
By applying the proposed algorithm, Grad-CAM identifies the above regions of interest and colors them in bright yellow, providing a heatmap as illustrated in Figure 5c. Figure 5d represents the visualization result of SPECT MPI after placing the produced heatmaps above the processed image. A similar distribution of the yellow color on the heatmaps is observed in all examined infarction cases. In Appendix A, two more indicative infarction cases (cases B and C) are provided (see Figure A3), illustrating the yellow color distribution in the visualization regions representing the perfusion defects.
In Figure 6a, according to the nuclear medicine physician’s expertise (N.P), a medium-size reversible perfusion abnormality was diagnosed in the apex and the anteroseptal myocardium—see slices 10–14 (row A in SA), slices 30–33 (row A in VLA), and slices 31–35 (row A in HLA). By applying the algorithm, Grad-CAM identifies the segments with stress-induced hypo-perfusion in row A on all three axes in stress mode, which are marked in bright yellow (see Figure 6c). More specifically, after a thorough look at the visualized regions (Figure 6d) and comparing them to those of the initial image, it emerges that the algorithm sufficiently recognizes the post-stress defects.
Moreover, in Figure 7 (ischemia–case B), the nuclear expert (N.P.) diagnosed hypo-perfusion, which was observed in the septum, in the inferior myocardial wall, as well as in a part of the apex—see slices 10–18 (row A), 29–35 (row A), and 30–36 (row A). As soon as the algorithm was applied, we observed that the above myocardial walls were marked with more intense yellow at post-stress in row A on all three axes regarding the same slices as prescribed by the expert in Figure 7a.
The proposed trained model, which accurately predicted infarction, also performs well when color visualization is used with the Grad-CAM method and depicts the areas of interest in the event of infarction in MPI scans. The results produced by the visualization assessment concurred with the expert’s diagnosis and assessment.
The proposed RGB-CNN classification model (best) implemented with the Grad-CAM technique has achieved remarkable accuracy, exhibiting at the same time explainable capabilities concerning the predictions of defects/abnormalities in CAD diagnosis. This is attributed to the fact that Grad-CAM can discover complicated underlying relationships and non-linearities; thus, it demonstrates a solid performance identifying regions of interest that represent possible abnormalities (ischemia and infarction) in SPECT MPI scans.

5. Discussion

In this research study, we developed a fully automatic CNN-based method to detect any signs of infarction or ischemia in patients. The dataset included heterogeneous data of 625 patients. Among these data, 127 corresponded to infarction, 241 to ischemic, and 257 to normal, which nuclear experts had previously labeled for the current classification task. Given the small size of the population, we employed data augmentation to produce new images by applying different transformations to the current dataset, such as flipping and rescaling. In addition, we divided our dataset into three parts: validation, training, and testing. The validation dataset was used for fine-tuning the hyper-parameters, the training dataset for training the model, and the testing dataset for estimating its reliability.
To determine the specifications of the proposed model, the authors performed an in-depth exploration analysis by examining various values for batch size, image size, number of nodes and layers for convolutional layer, and number of nodes for fully connected layers. Using the SPECT MPI images as our only input, we proposed a deep CNN with convolutional layers and two fully connected layers to enhance the accuracy of our corresponding three-class classification task. For the definition of the best model in terms of its performance, reliable metrics such as accuracy, loss, AUC with confidence internal, ROC curve, sensitivity, and specificity were utilized. The results demonstrated high efficiency and stability, achieving 93.33% accuracy and 94.58% AUC. Additionally, the authors conducted 10-fold cross-validation to further evaluate the model’s stability and robustness. On the identical three-class data problem, the suggested model exceeded the performance of sophisticated deep learning networks (VGG-16 and ResNet-121), which only managed to attain lower levels of accuracy (88.54% and 86.11%, respectively), as demonstrated in [42].
In contrast to other traditional approaches, our RGB-CNN demonstrated superior performance for several reasons. First, it could extract optimum results despite the small dataset and without needing to employ other pre-trained networks that rely on existing datasets (e.g., ImageNet, which was trained in 1000 classes). Additionally, having performed an in-depth analysis of its parameters, the CNN model could avoid overfitting and achieve generalization. Finally, the proposed methodology includes simple architecture involving a small number of nodes, which provides minimized training time.
Nevertheless, our research presents certain limitations. The proposed approach exclusively accepts images as input, despite physicians also considering additional clinical data such as age and sex to conclude an exact opinion about a patient’s status. In our future considerations, we will seek to develop a hybrid method, which will use both images and clinical data as input to simulate the visual diagnosis of CAD fully.
Concerning the clinical implications that unfold from applying the proposed DL-based approach, these entail the beneficial automatic clinical diagnosis of SPECT MPI images, which could prevent unwanted heart conditions such as ischemia and infarction. The CNN-based method can serve as a vital tool to assist medical experts in providing a precise diagnosis of SPECT MPI images and explicit treatment suggestions to patients suffering from CAD.
On the other side, CNNs do not offer transparency and interpretability in their decisions, which is a critical throwback for their full integration into medical image analysis. Thus, doctors cannot rely on the provided predictions. CNNs are characterized by nature as black boxes since they do not supply details regarding their internal prediction process, leaving researchers to depend exclusively on the values of reliable metrics. Explaining artificial intelligence was implemented to offer details about CNNs’ internal functionality. In our proposed research, we implemented the Grad-CAM technique, which generates heatmaps for interpretability.
To sum up, the proposed three-class classification model can identify any signs of infarction or ischemia in SPECT MPI images while ensuring reliability. Even though we dealt with a small dataset, our model performed great. The proposed RGB-CNN can be a fundamental tool that can assist nuclear experts in automatically diagnosing CAD. Overall, the current research constitutes an innovation in nuclear medicine, especially in CAD diagnosis utilizing SPECT images, mostly due to the observed lack of relevant published articles in this domain. In addition, this approach investigates and applies XAI methodologies with promising results.

6. Conclusions

The proposed paper presents the first known attempt of developing an explainable pipeline to CAD diagnosis utilizing SPECT MPI pictures and sophisticated state-of-the-art DL and explainability techniques. Apart from implementing an effective CNN algorithm for accurately classifying infarction and ischemia in CAD, it is essential to address image interpretability through visualization. For the purposes of this study, the efficacy of the well-known Grad-CAM explainability tool was investigated, providing promising results for automated and accurate diagnosis in nuclear cardiology. The proposed model achieved 93.33% testing accuracy, 0.21 testing loss, and 0.94 AUC, demonstrating great applicability to the corresponding dataset and sufficient stability. As illustrated in the results section, the nuclear physician can use the Grad-CAM visualization technique to make efficient and confident decisions, taking advantage of the visual explanations provided. Thus, the Grad-CAM methodology was proven to be an effective tool in providing explanations for CNN-based decisions in SPECT MPI images. The next steps are devoted to the integration of clinical, stress, and imaging variables in DL methods to further improve disease diagnosis. To sum up, this study contributes to the effective diagnosis of ischemia and infarction in CAD, hence fostering trust in the use of explainable artificial intelligence models for diagnosis in nuclear medicine.

Author Contributions

Conceptualization, N.I.P. and S.M.; methodology, N.I.P. and A.F.; software, A.F.; validation, N.I.P., D.J.A. and E.I.P.; formal analysis, N.I.P. and A.F.; investigation, N.I.P. and A.F.; resources, N.I.P.; data curation, A.F., and N.I.P.; writing—original draft preparation, N.I.P.; writing—review and editing, A.F., E.I.P., I.D.A. and S.M.; visualization, A.F.; supervision, N.I.P. and S.M.; project administration, E.I.P. All authors have read and agreed to the published version of the manuscript.

Funding

The research project was supported by the Hellenic Foundation for Research and Innovation (H.F.R.I.) under the “2nd Call for H.F.R.I. Research Projects to sup-port Faculty Members & Researchers” (Project Number: 3656).

Institutional Review Board Statement

This research does not report human experimentation; it does not involve human participants following experimentation. All procedures in this study were in accordance with the Declaration of Helsinki.

Informed Consent Statement

This study was approved by the board committee director of the diagnostic medical center “Diagnostiko-Iatriki A.E.”, Vasilios Parafestas. The requirement to obtain informed consent was waived by the director of the diagnostic center due to its retrospective nature.

Data Availability Statement

The datasets analyzed during the current study are available from the nuclear medicine physician on reasonable request.

Acknowledgments

The research project was supported by the Hellenic Foundation for Research and Innovation (H.F.R.I.) under the “2nd Call for H.F.R.I. Research Projects to support Faculty Members & Researchers” (Project Number: 3656).

Conflicts of Interest

The authors declare no conflict of interest.

Appendix A

Figure A1 and Figure A2 visually represent the precision curves concerning the accuracies and loss and ROC curves for the best RGB-CNN model. Overall, the produced model achieved the highest classification accuracy, providing generalizability and robustness to CAD diagnosis, at the same time in contrast to the rest architectures.
Figure A1. Plots demonstrating the best RGB-CNN for the CAD classification problem: (a) Accuracy and (b) loss.
Applsci 12 07592 g0a1
Figure A2. Performance of ROC curve for RGB-CNN: (a) Infarction; (b) ischemia; and (c) normal.
Applsci 12 07592 g0a2
Figure A3. (a,b) Initial SPECT MPI image; (c,d) processed image; (e,f) heatmap; and (g,h) visualized results generated by Grad-CAM for infarction cases.
Applsci 12 07592 g0a3aApplsci 12 07592 g0a3b

References

  1. Naghavi, M.; Abajobir, A.A.; Abbafati, C.; Abbas, K.M.; Abd-Allah, F.; Abera, S.F.; Aboyans, V.; Adetokunboh, O.; Afshin, A.; Agrawal, A.; et al. Global, Regional, and National Age-Sex Specific Mortality for 264 Causes of Death, 1980–2016: A Systematic Analysis for the Global Burden of Disease Study 2016. Lancet 2017, 390, 1151–1210. [Google Scholar] [CrossRef] [Green Version]
  2. Mendis, S.; Puska, P.; Norrving, B.; World Health Organization; World Heart Federation. World Stroke Organization Global Atlas on Cardiovascular Disease Prevention and Control/Edited by: Shanthi Mendis; World Heart Federation: Geneva, Switzerland, 2011. [Google Scholar]
  3. Hammad, M.; Alkinani, M.H.; Gupta, B.B.; Abd El-Latif, A.A. Myocardial Infarction Detection Based on Deep Neural Network on Imbalanced Data. Multimed. Syst. 2021, 1–13. [Google Scholar] [CrossRef]
  4. Chen, J.-J.; Su, T.-Y.; Chen, W.-S.; Chang, Y.-H.; Lu, H.H.-S. Convolutional Neural Network in the Evaluation of Myocardial Ischemia from CZT SPECT Myocardial Perfusion Imaging: Comparison to Automated Quantification. Appl. Sci. 2021, 11, 514. [Google Scholar] [CrossRef]
  5. Papandrianos, N.; Papageorgiou, E. Automatic Diagnosis of Coronary Artery Disease in SPECT Myocardial Perfusion Imaging Employing Deep Learning. Appl. Sci. 2021, 11, 6362. [Google Scholar] [CrossRef]
  6. Liu, H.; Wu, J.; Miller, E.J.; Liu, C.; Yaqiang, N.; Liu, N.; Liu, Y.-H. Diagnostic Accuracy of Stress-Only Myocardial Perfusion SPECT Improved by Deep Learning. Eur. J. Nucl. Med. Mol. Imaging 2021, 48, 2793–2800. [Google Scholar] [CrossRef]
  7. Mostafapour, S.; Gholamiankhah, F.; Maroofpour, S.; Momennezhad, M.; Asadinezhad, M.; Zakavi, S.R.; Arabi, H. Deep Learning-Based Attenuation Correction in the Image Domain for Myocardial Perfusion SPECT Imaging. arXiv 2021, arXiv:2102.04915. [Google Scholar]
  8. Kaplan Berkaya, S.; Ak Sivrikoz, I.; Gunal, S. Classification Models for SPECT Myocardial Perfusion Imaging. Comput. Biol. Med. 2020, 123, 103893. [Google Scholar] [CrossRef] [PubMed]
  9. Ntakolia, C.; Diamantis, D.E.; Papandrianos, N.; Moustakidis, S.; Papageorgiou, E.I. A Lightweight Convolutional Neural Network Architecture Applied for Bone Metastasis Classification in Nuclear Medicine: A Case Study on Prostate Cancer Patients. Healthcare 2020, 8, 493. [Google Scholar] [CrossRef]
  10. Papandrianos, N.; Papageorgiou, E.I.; Anagnostis, A. Development of Convolutional Neural Networks to Identify Bone Metastasis for Prostate Cancer Patients in Bone Scintigraphy. Ann. Nucl. Med. 2020, 34, 824–832. [Google Scholar] [CrossRef]
  11. LeCun, Y.; Bengio, Y.; Hinton, G. Deep Learning. Nature 2015, 521, 436–444. [Google Scholar] [CrossRef]
  12. Arabi, H.; AkhavanAllaf, A.; Sanaat, A.; Shiri, I.; Zaidi, H. The Promise of Artificial Intelligence and Deep Learning in PET and SPECT Imaging. Phys. Medica PM Int. J. Devoted Appl. Phys. Med. Biol. Off. J. Ital. Assoc. Biomed. Phys. AIFB 2021, 83, 122–137. [Google Scholar] [CrossRef]
  13. Nazari, M.; Kluge, A.; Apostolova, I.; Klutmann, S.; Kimiaei, S.; Schroeder, M.; Buchert, R. Explainable AI to Improve Acceptance of Convolutional Neural Networks for Automatic Classification of Dopamine Transporter SPECT in the Diagnosis of Clinically Uncertain Parkinsonian Syndromes. Eur. J. Nucl. Med. Mol. Imaging 2022, 49, 1176–1186. [Google Scholar] [CrossRef]
  14. Savvopoulos, C.A.; Spyridonidis, T.; Papandrianos, N.; Vassilakos, P.J.; Alexopoulos, D.; Apostolopoulos, D.J. CT-Based Attenuation Correction in Tl-201 Myocardial Perfusion Scintigraphy Is Less Effective than Non-Corrected SPECT for Risk Stratification. J. Nucl. Cardiol. 2014, 21, 519–531. [Google Scholar] [CrossRef] [PubMed]
  15. Anaya-Isaza, A.; Mera-Jiménez, L.; Zequera-Diaz, M. An Overview of Deep Learning in Medical Imaging. Inform. Med. Unlocked 2021, 26, 100723. [Google Scholar] [CrossRef]
  16. Singh, A.; Sengupta, S.; Lakshminarayanan, V. Explainable Deep Learning Models in Medical Image Analysis. J. Imaging 2020, 6, 52. [Google Scholar] [CrossRef] [PubMed]
  17. Gunning, D.; Stefik, M.; Choi, J.; Miller, T.; Stumpf, S.; Yang, G.-Z. XAI-Explainable Artificial Intelligence. Sci. Robot. 2019, 4, eaay7120. [Google Scholar] [CrossRef] [Green Version]
  18. Otaki, Y.; Singh, A.; Kavanagh, P.; Miller, R.J.H.; Parekh, T.; Tamarappoo, B.K.; Sharir, T.; Einstein, A.J.; Fish, M.B.; Ruddy, T.D.; et al. Clinical Deployment of Explainable Artificial Intelligence of SPECT for Diagnosis of Coronary Artery Disease. JACC Cardiovasc. Imaging 2021, 4, 30. [Google Scholar] [CrossRef]
  19. Betancur, J.; Hu, L.-H.; Commandeur, F.; Sharir, T.; Einstein, A.J.; Fish, M.B.; Ruddy, T.D.; Kaufmann, P.A.; Sinusas, A.J.; Miller, E.J.; et al. Deep Learning Analysis of Upright-Supine High-Efficiency SPECT Myocardial Perfusion Imaging for Prediction of Obstructive Coronary Artery Disease: A Multicenter Study. J. Nucl. Med. 2019, 60, 664–670. [Google Scholar] [CrossRef] [PubMed]
  20. Betancur, J.; Commandeur, F.; Motlagh, M.; Sharir, T.; Einstein, A.J.; Bokhari, S.; Fish, M.B.; Ruddy, T.D.; Kaufmann, P.; Sinusas, A.J.; et al. Deep Learning for Prediction of Obstructive Disease From Fast Myocardial Perfusion SPECT. JACC Cardiovasc. Imaging 2018, 11, 1654–1663. [Google Scholar] [CrossRef]
  21. Zahiri, N.; Asgari, R.; Razavi-Ratki, S.-K.; Parach, A.-A. Deep Learning Analysis of Polar Maps from SPECT Myocardial Perfusion Imaging for Prediction of Coronary Artery Disease. Res. Sq. 2021. [Google Scholar] [CrossRef]
  22. Papandrianos, N.; Feleki, A.; Papageorgiou, E. Exploring Classification of SPECT MPI Images Applying Convolutional Neural Networks. In Proceedings of the 25th Pan-Hellenic Conference on Informatics, Association for Computing Machinery, New York, NY, USA, 26 August 2021; pp. 483–489. [Google Scholar] [CrossRef]
  23. Apostolopoulos, I.D.; Papathanasiou, N.D.; Spyridonidis, T.; Apostolopoulos, D.J. Automatic Characterization of Myocardial Perfusion Imaging Polar Maps Employing Deep Learning and Data Augmentation. Hell. J. Nucl. Med. 2020, 23, 125–132. [Google Scholar] [CrossRef] [PubMed]
  24. Apostolopoulos, I.D.; Apostolopoulos, D.I.; Spyridonidis, T.I.; Papathanasiou, N.D.; Panayiotakis, G.S. Multi-Input Deep Learning Approach for Cardiovascular Disease Diagnosis Using Myocardial Perfusion Imaging and Clinical Data. Phys. Med. PM Int. J. Devoted Appl. Phys. Med. Biol. Off. J. Ital. Assoc. Biomed. Phys. AIFB 2021, 84, 168–177. [Google Scholar] [CrossRef] [PubMed]
  25. de Souza Filho, E.M.; Fernandes, F.d.A.; Wiefels, C.; de Carvalho, L.N.D.; Dos Santos, T.F.; Dos Santos, A.A.S.M.D.; Mesquita, E.T.; Seixas, F.L.; Chow, B.J.W.; Mesquita, C.T.; et al. Machine Learning Algorithms to Distinguish Myocardial Perfusion SPECT Polar Maps. Front. Cardiovasc. Med. 2021, 8, 741667. [Google Scholar] [CrossRef]
  26. Nakajima, K.; Kudo, T.; Nakata, T.; Kiso, K.; Kasai, T.; Taniguchi, Y.; Matsuo, S.; Momose, M.; Nakagawa, M.; Sarai, M.; et al. Diagnostic Accuracy of an Artificial Neural Network Compared with Statistical Quantitation of Myocardial Perfusion Images: A Japanese Multicenter Study. Eur. J. Nucl. Med. Mol. Imaging 2017, 44, 2280–2289. [Google Scholar] [CrossRef] [Green Version]
  27. Ciecholewski, M. Ischemic Heart Disease Detection Using Selected Machine Learning Methods. Int. J. Comput. Math. 2012, 90, 8. [Google Scholar] [CrossRef]
  28. Otaki, Y.; Tamarappoo, B.; Singh, A.; Sharir, T.; Hu, L.-H.; Gransar, H.; Einstein, A.; Fish, M.; Ruddy, T.; Kaufmann, P.; et al. Diagnostic Accuracy of Deep Learning for Myocardial Perfusion Imaging in Men and Women with a High-Efficiency Parallel-Hole-Collimated Cadmium-Zinc-Telluride Camera: Multicenter Study. J. Nucl. Med. 2020, 61, 92. [Google Scholar]
  29. Spier, N.; Nekolla, S.; Rupprecht, C.; Mustafa, M.; Navab, N.; Baust, M. Classification of Polar Maps from Cardiac Perfusion Imaging with Graph-Convolutional Neural Networks. Sci. Rep. 2019, 9, 7569. [Google Scholar] [CrossRef] [Green Version]
  30. Magesh, P.R.; Myloth, R.D.; Tom, R.J. An Explainable Machine Learning Model for Early Detection of Parkinson’s Disease Using LIME on DaTscan Imagery. arXiv 2020, arXiv:200800238. [Google Scholar] [CrossRef] [PubMed]
  31. Kawauchi, K.; Hirata, K.; Katoh, C.; Ichikawa, S.; Manabe, O.; Kobayashi, K.; Watanabe, S.; Furuya, S.; Shiga, T. A Convolutional Neural Network-Based System to Prevent Patient Misidentification in FDG-PET Examinations. Sci. Rep. 2019, 9, 7192. [Google Scholar] [CrossRef] [PubMed] [Green Version]
  32. Domingues, I.; Pereira, G.; Martins, P.; Duarte, H.; Santos, J.; Abreu, P.H. Using Deep Learning Techniques in Medical Imaging: A Systematic Review of Applications on CT and PET. Artif. Intell. Rev. 2020, 53, 4093–4160. [Google Scholar] [CrossRef]
  33. Litjens, G.; Kooi, T.; Bejnordi, B.E.; Setio, A.A.A.; Ciompi, F.; Ghafoorian, M.; van der Laak, J.A.W.M.; van Ginneken, B.; Sánchez, C.I. A Survey on Deep Learning in Medical Image Analysis. Med. Image Anal. 2017, 42, 60–88. [Google Scholar] [CrossRef] [PubMed] [Green Version]
  34. Christodoulou, E.; Moustakidis, S.; Papandrianos, N.; Tsaopoulos, D.; Papageorgiou, E. Exploring Deep Learning Capabilities in Knee Osteoarthritis Case Study for Classification. In Proceedings of the IEEE 2019 10th International Conference on Information, Intelligence, Systems and Applications (IISA), Patras, Greece, 15–17 July 2019; pp. 1–6. [Google Scholar]
  35. An, J.; Joe, I. Attention Map-Guided Visual Explanations for Deep Neural Networks. Appl. Sci. 2022, 12, 3846. [Google Scholar] [CrossRef]
  36. Lizzi, F.; Scapicchio, C.; Laruina, F.; Retico, A.; Fantacci, M.E. Convolutional Neural Networks for Breast Density Classification: Performance and Explanation Insights. Appl. Sci. 2022, 12, 148. [Google Scholar] [CrossRef]
  37. Selvaraju, R.R.; Cogswell, M.; Das, A.; Vedantam, R.; Parikh, D.; Batra, D. Grad-CAM: Visual Explanations from Deep Networks via Gradient-Based Localization. Int. J. Comput. Vis. 2020, 128, 336–359. [Google Scholar] [CrossRef] [Green Version]
  38. Selvaraju, R.R.; Das, A.; Vedantam, R.; Cogswell, M.; Parikh, D.; Batra, D. Grad-CAM: Why Did You Say That? arXiv 2017, arXiv:1611.07450. [Google Scholar]
  39. Chen, X.; Zhou, B.; Xie, H.; Shi, L.; Liu, H.; Holler, W.; Lin, M.; Liu, Y.-H.; Miller, E.J.; Sinusas, A.J.; et al. Direct and Indirect Strategies of Deep-Learning-Based Attenuation Correction for General Purpose and Dedicated Cardiac SPECT. Eur. J. Nucl. Med. Mol. Imaging 2022, 49, 3046–3060. [Google Scholar] [CrossRef] [PubMed]
  40. Xiao, M.; Zhang, L.; Shi, W.; Liu, J.; He, W.; Jiang, Z. A Visualization Method Based on the Grad-CAM for Medical Image Segmentation Model. In Proceedings of the IEEE 2021 International Conference on Electronic Information Engineering and Computer Science (EIECS), Changchun, China, 23 September 2021; pp. 242–247. [Google Scholar]
  41. Zhang, Y.C.; Kagen, A.C. Machine Learning Interface for Medical Image Analysis. J. Digit. Imaging 2017, 30, 615–621. [Google Scholar] [CrossRef] [PubMed]
  42. Papandrianos, N.I.; Feleki, A.; Papageorgiou, E.I.; Martini, C. Deep Learning-Based Automated Diagnosis for Coronary Artery Disease Using SPECT-MPI Images. J. Clin. Med. 2022, 11, 3918. [Google Scholar] [CrossRef] [PubMed]
Figure 1. Image samples of coronary artery disease: (a) Infarction; (b) ischemia; (c) normal.
Applsci 12 07592 g001
Figure 2. Detailed explainability approach using Grad-CAM for CAD classification.
Applsci 12 07592 g002
Figure 3. Convolutional neural network architecture for CAD classification problem comparing various values for all parameters: (a) Testing accuracy for different image sizes; (b) AUC for different image sizes; (c) testing accuracy for different convolutional layers; (d) AUC for different convolutional layers; (e) testing accuracy for different dense layers; and (f) AUC for different dense layers.
Applsci 12 07592 g003
Figure 4. Visualized results generated by Grad-CAM.
Applsci 12 07592 g004
Figure 5. Case A. (a) Initial SPECT MPI image; (b) processed image; (c) produced heatmap; and (d) visualized image generated by Grad-CAM for infarction.
Applsci 12 07592 g005
Figure 6. Case A. (a) Initial image; (b) processed image; (c) heatmap; and (d) visualized results generated by Grad-CAM for ischemia.
Applsci 12 07592 g006
Figure 7. Ischemia—Case B. (a) Initial image; (b) processed image; (c) heatmap; and (d) visualized results generated by Grad-CAM.
Applsci 12 07592 g007
Table 1. Clinical characteristics of the corresponding dataset.
Clinical CharacteristicsFrequency
No625
Age (mean ± SD)62.2 ± 7.8 years
Sex (male/female)65.88%/34.22%
History of CAD40.89%
Previous Myocardial Infraction35.48%
Previous Stroke13.46%
Hypertension70.25%
Smoking58.18%
Diabetes40.56%
Table 2. Comparison of various batch sizes.
Batch SizeVal Acc (%)Val LossTest Acc (%)Test LossAUC [CI 95%]
887.70.3284.580.40.86 [0.882–0.958]
1688.540.3990.620,260.92 [0.911–0.977]
3294.580.1893.330.210.94 [0.919–0.981]
6484.760.482.810.540.87 [0.827–0.921]
Table 3. Demonstration of exploration for determining the best RGB-CNN model.
Image SizeConvolutionalDenseVal Acc (%)Val LossTest Acc (%) Test LossAUC [CI 95%]SensSpec
250 × 25016–32–64128–12892.70.2289.450.240.91 [0.891–0.972]0.870.98
250 × 25016–32–64–128128–12890.880.2590.620.240.91 [0.923–0.981]10.97
250 × 25016–32–64–128–256128–12892.310.1492.180.20.92 [0.853–0.94]0.930.93
300 × 30016–32–64128–12889.840.3187.890.350.9 [0.828–0.921]0.930.9
300 × 30016–32–64–128128–12894.580.1893.330.210.9458 [0.938–0.993]0.931
300 × 30016–32–64–128–256128–12892.580.2391.330.210.91 [0.936–0.986]10.91
350 × 35016–32–64128–12892.960.1992.140.220.92 [0.881–0.957]0.90.97
350 × 35016–32–64–128128–12892.030.1792.160.170.93 [0.896–0.976]0.8750.97
350 × 35016–32–64–128–256128–12893.40.1592.70.170.92 [0.952–0.993]1.00.94
Table 4. Runs of 10-fold cross-validation of the proposed RGB-CNN architecture.
RunsAccuracy (%)LossAUCCI (95%)SensSpec
Run 192.30.170.92[0.938–0.986]10.94
Run 292.30.20.93[0.918–0.981]0.980.95
Run 392.30.270.94[0.916–0.98]0.970.97
Run 494.230.20.93[0.935–0.985]10.97
Run 594.230.150.92[0.940–0.987]10.92
Run 698.070.170.93[0.924–0.979]10.91
Run 792.30.180.95[0.922–0.978]10.94
Run 894.230.060.96[0.933–0.987]10.97
Run 994.110.160.95[0.949–0.993]10.97
Run 1090.30.220.91[0.912–0.978]0.871
Average93.4 ± 2.450.170.93[0.929–0.983]0.9820.954
Table 5. Comparison of the evaluation metrics between the proposed data split method and 10-fold cross-validation.
Data Split (80%–20% Testing)10-Fold
Test
Acc
Test
Loss
AUC [CI 95%]SensSpecTest
Acc
Test
Loss
AUC [CI 95%]SensSpec
RGB-CNN93.330.210.94 [0.945–0.99]10.94593.40.170.93 [0.929–0.983]0.9820.954
Publisher’s Note: MDPI stays neutral with regard to jurisdictional claims in published maps and institutional affiliations.

