
Draw-a-Deep Pattern: Drawing Pattern-Based Smartphone User Authentication Based on Temporal Convolutional Neural Network

Abstract
:1. Introduction
2. Related Work
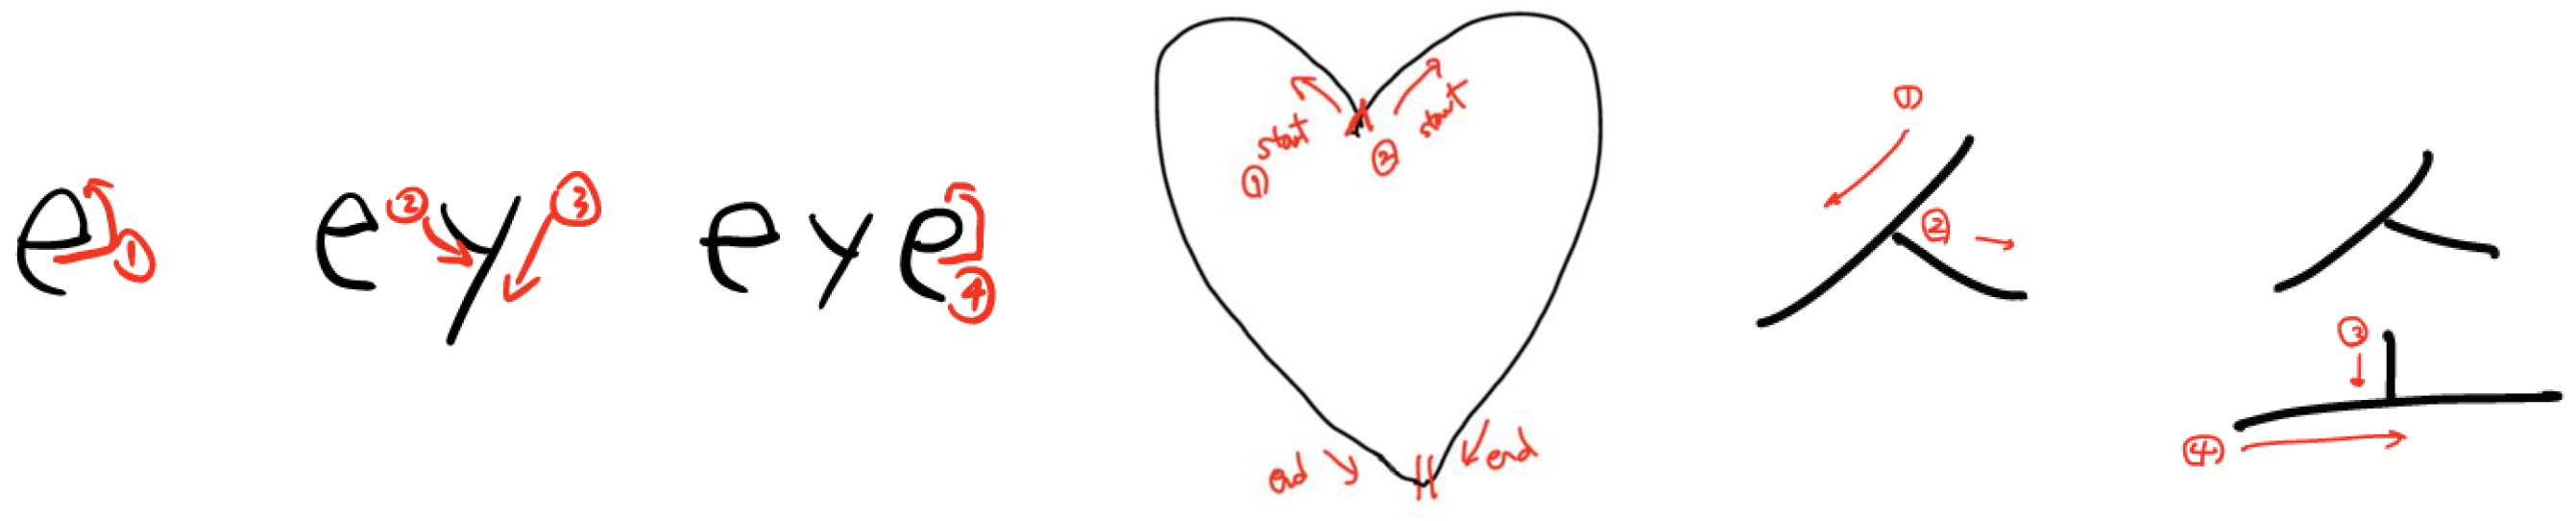
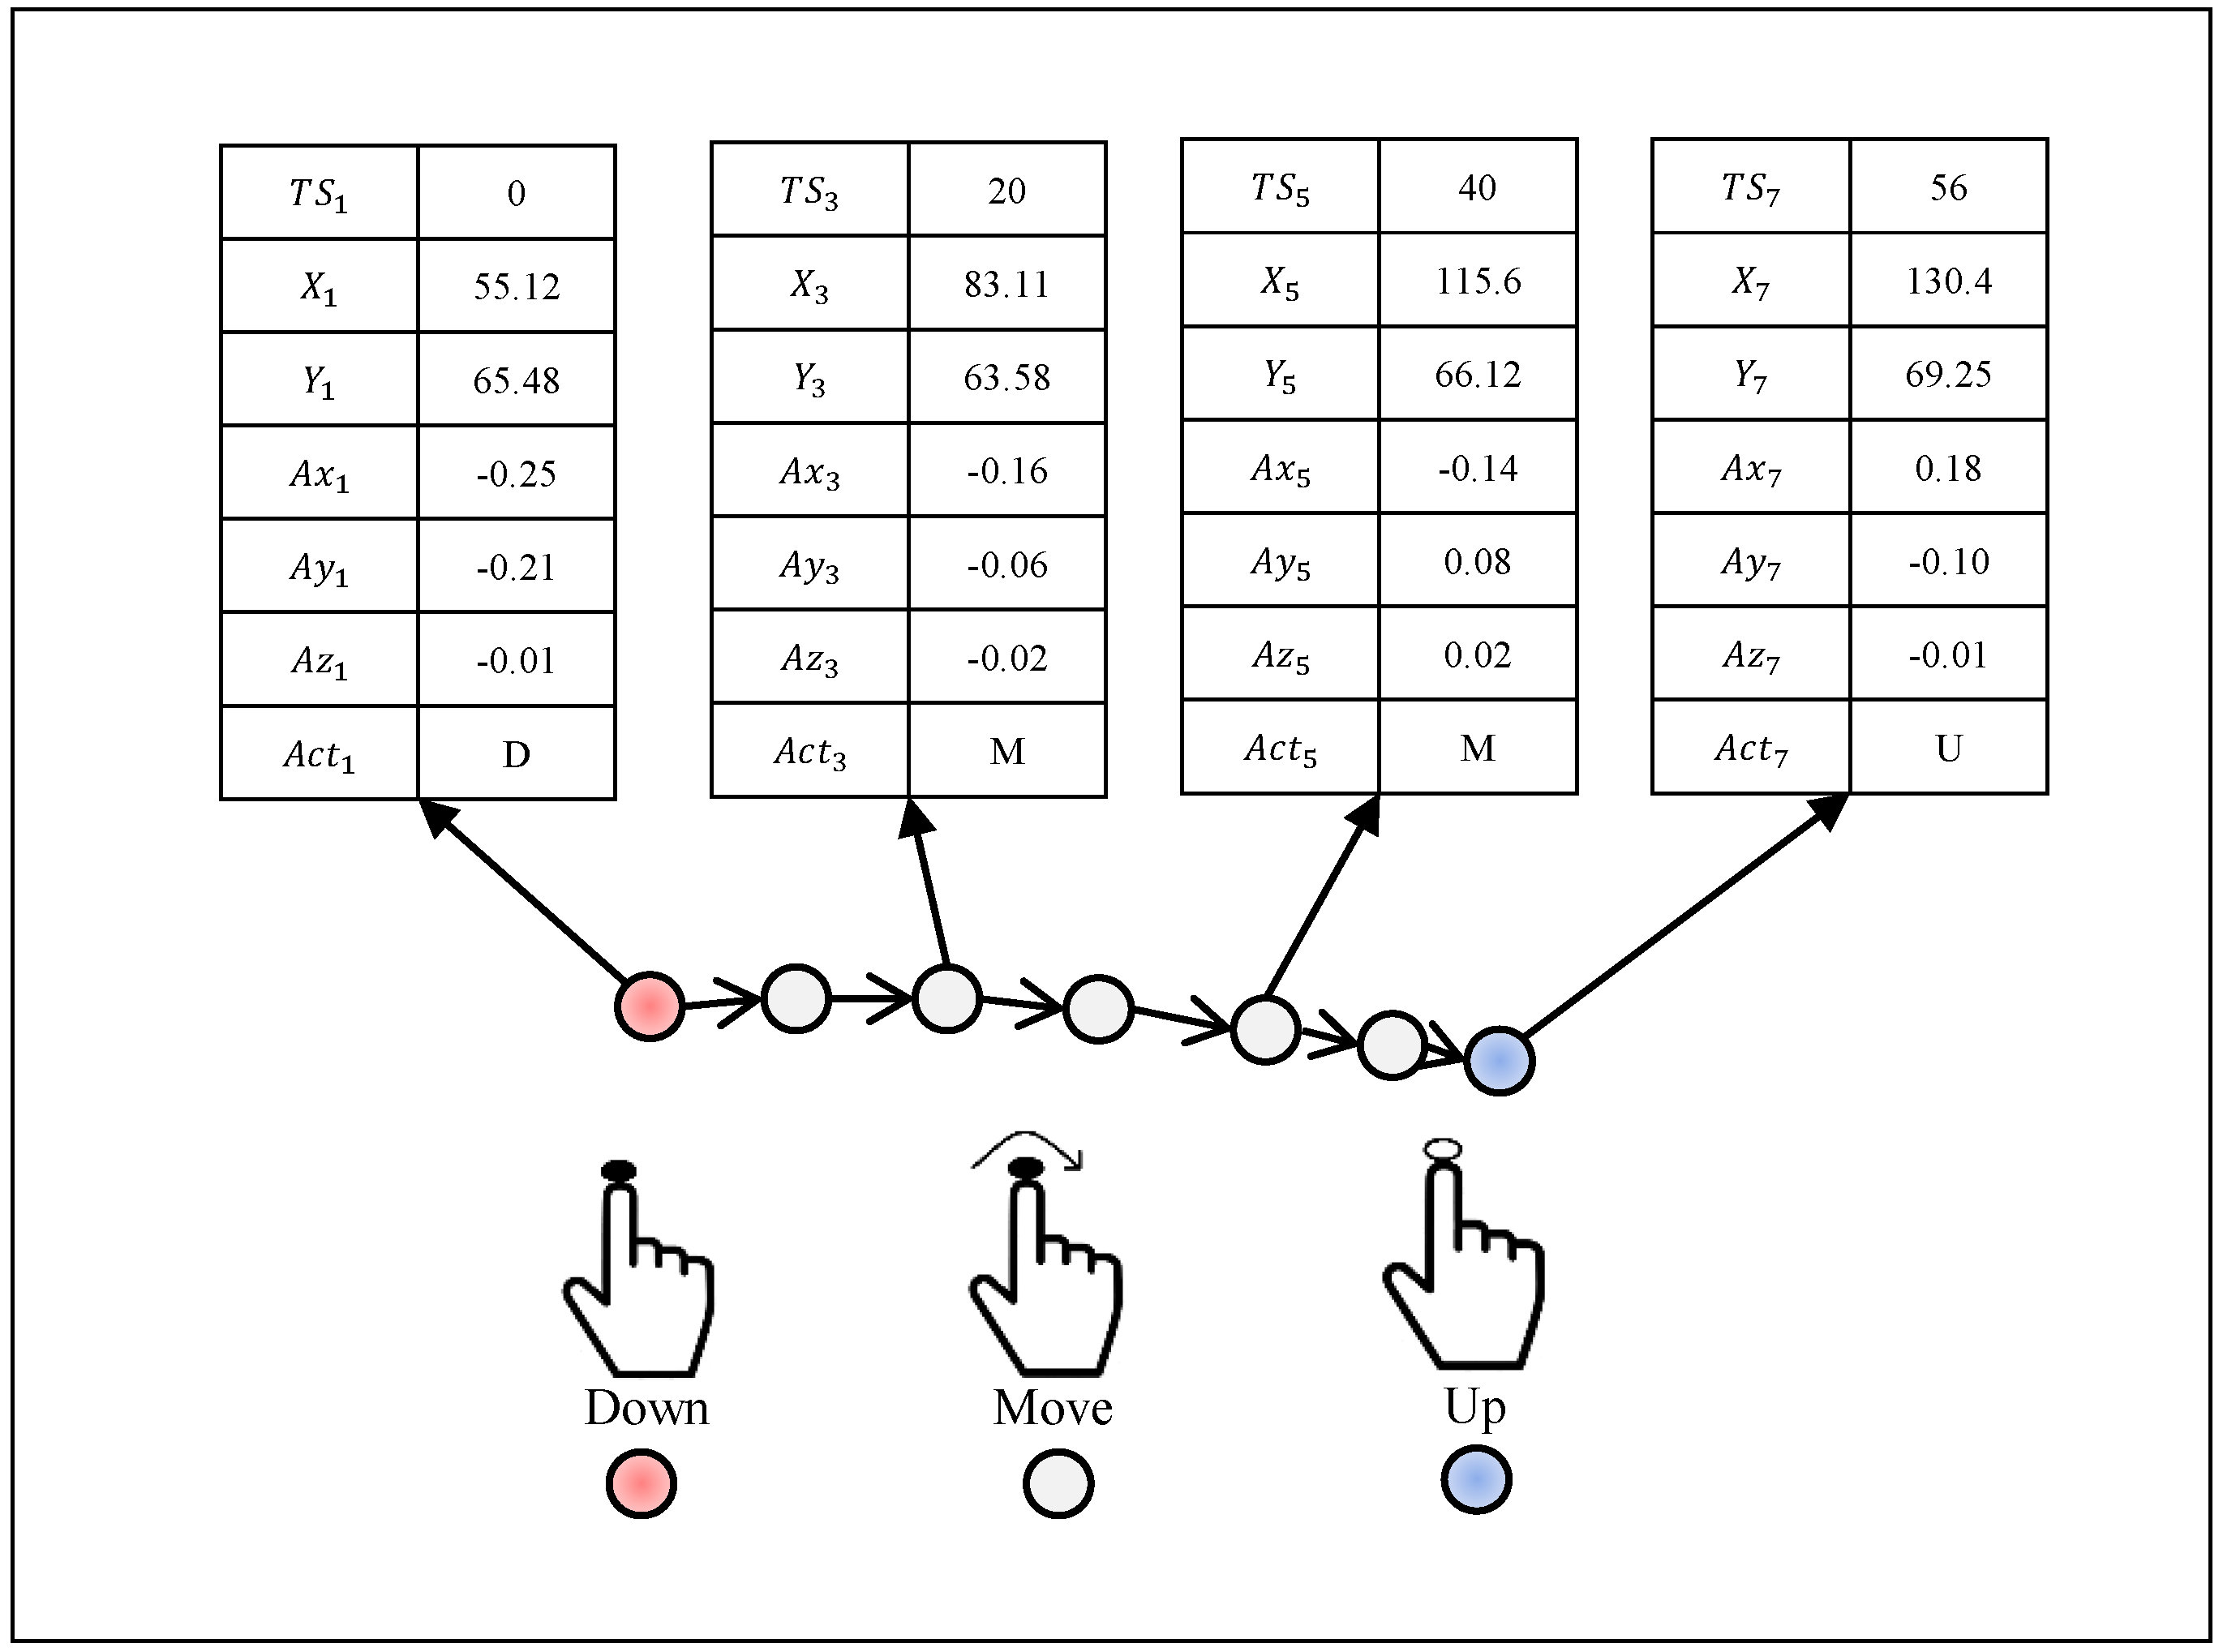
3. Data Collection and Preprocessing
4. Data Partition and Modeling
4.1. Data Partition
4.2. Modeling
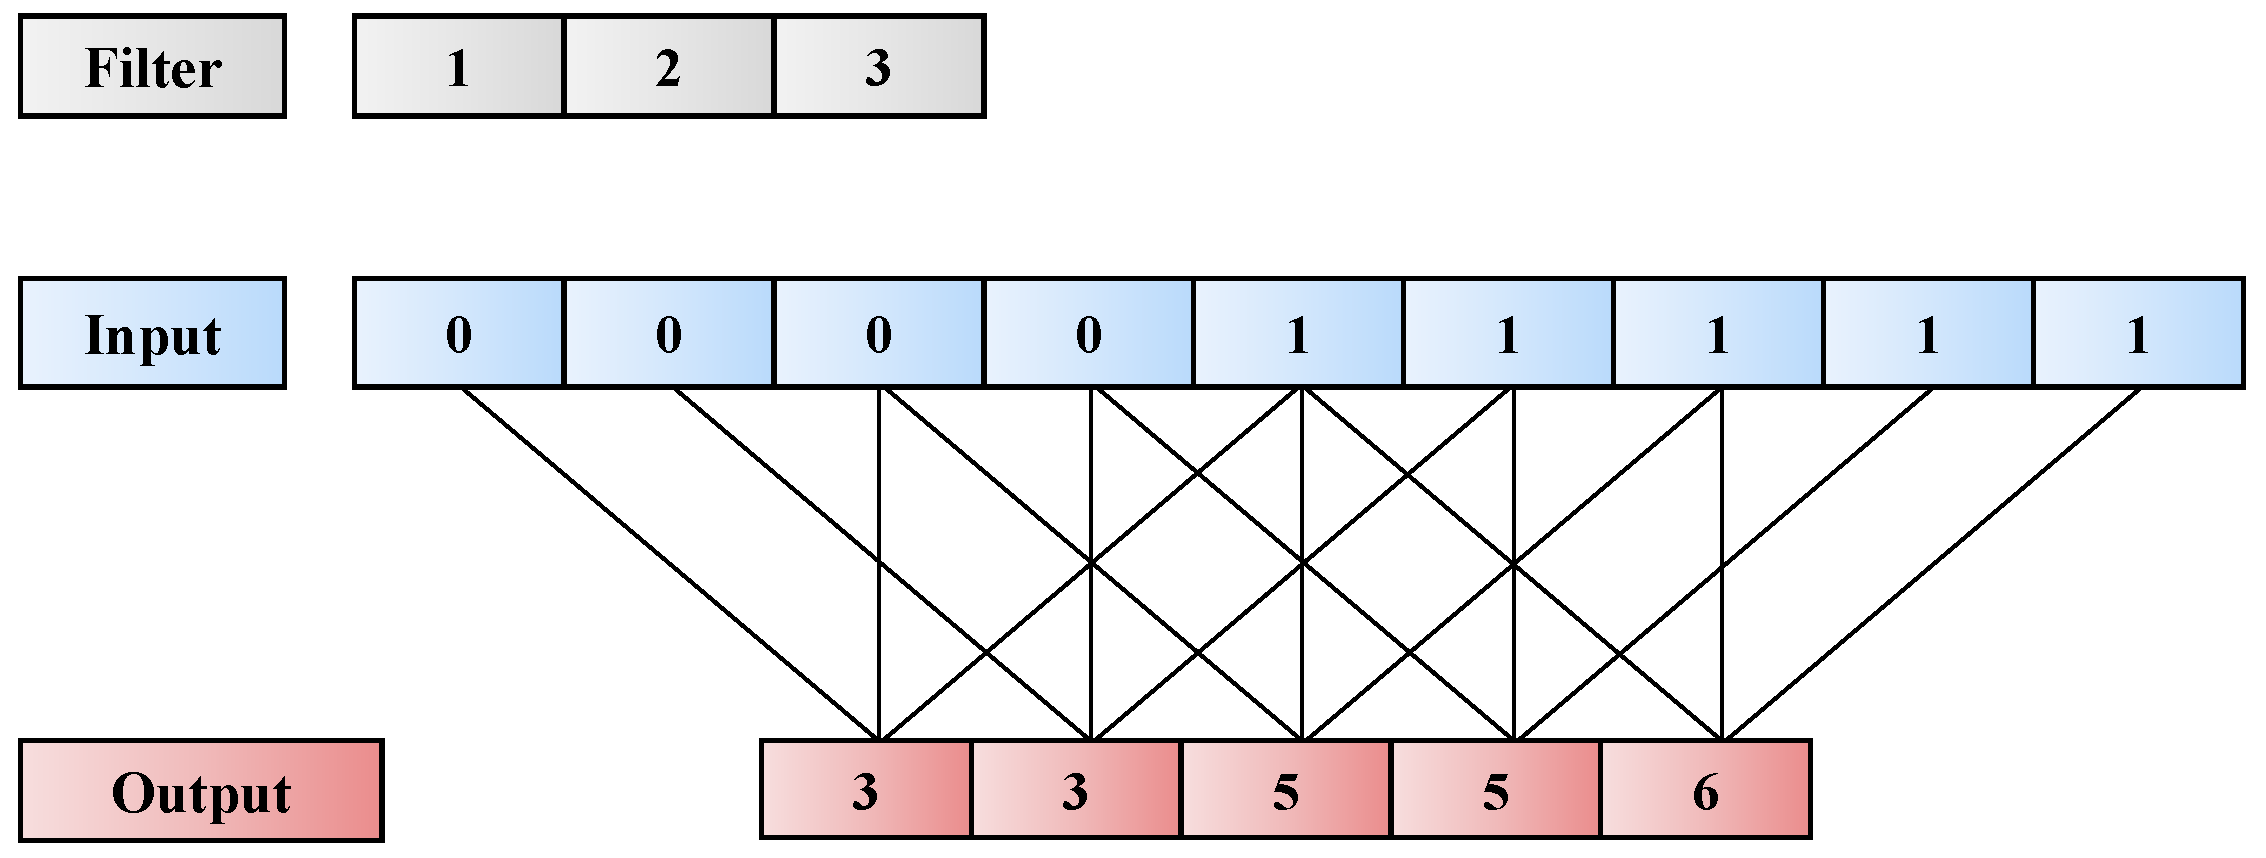
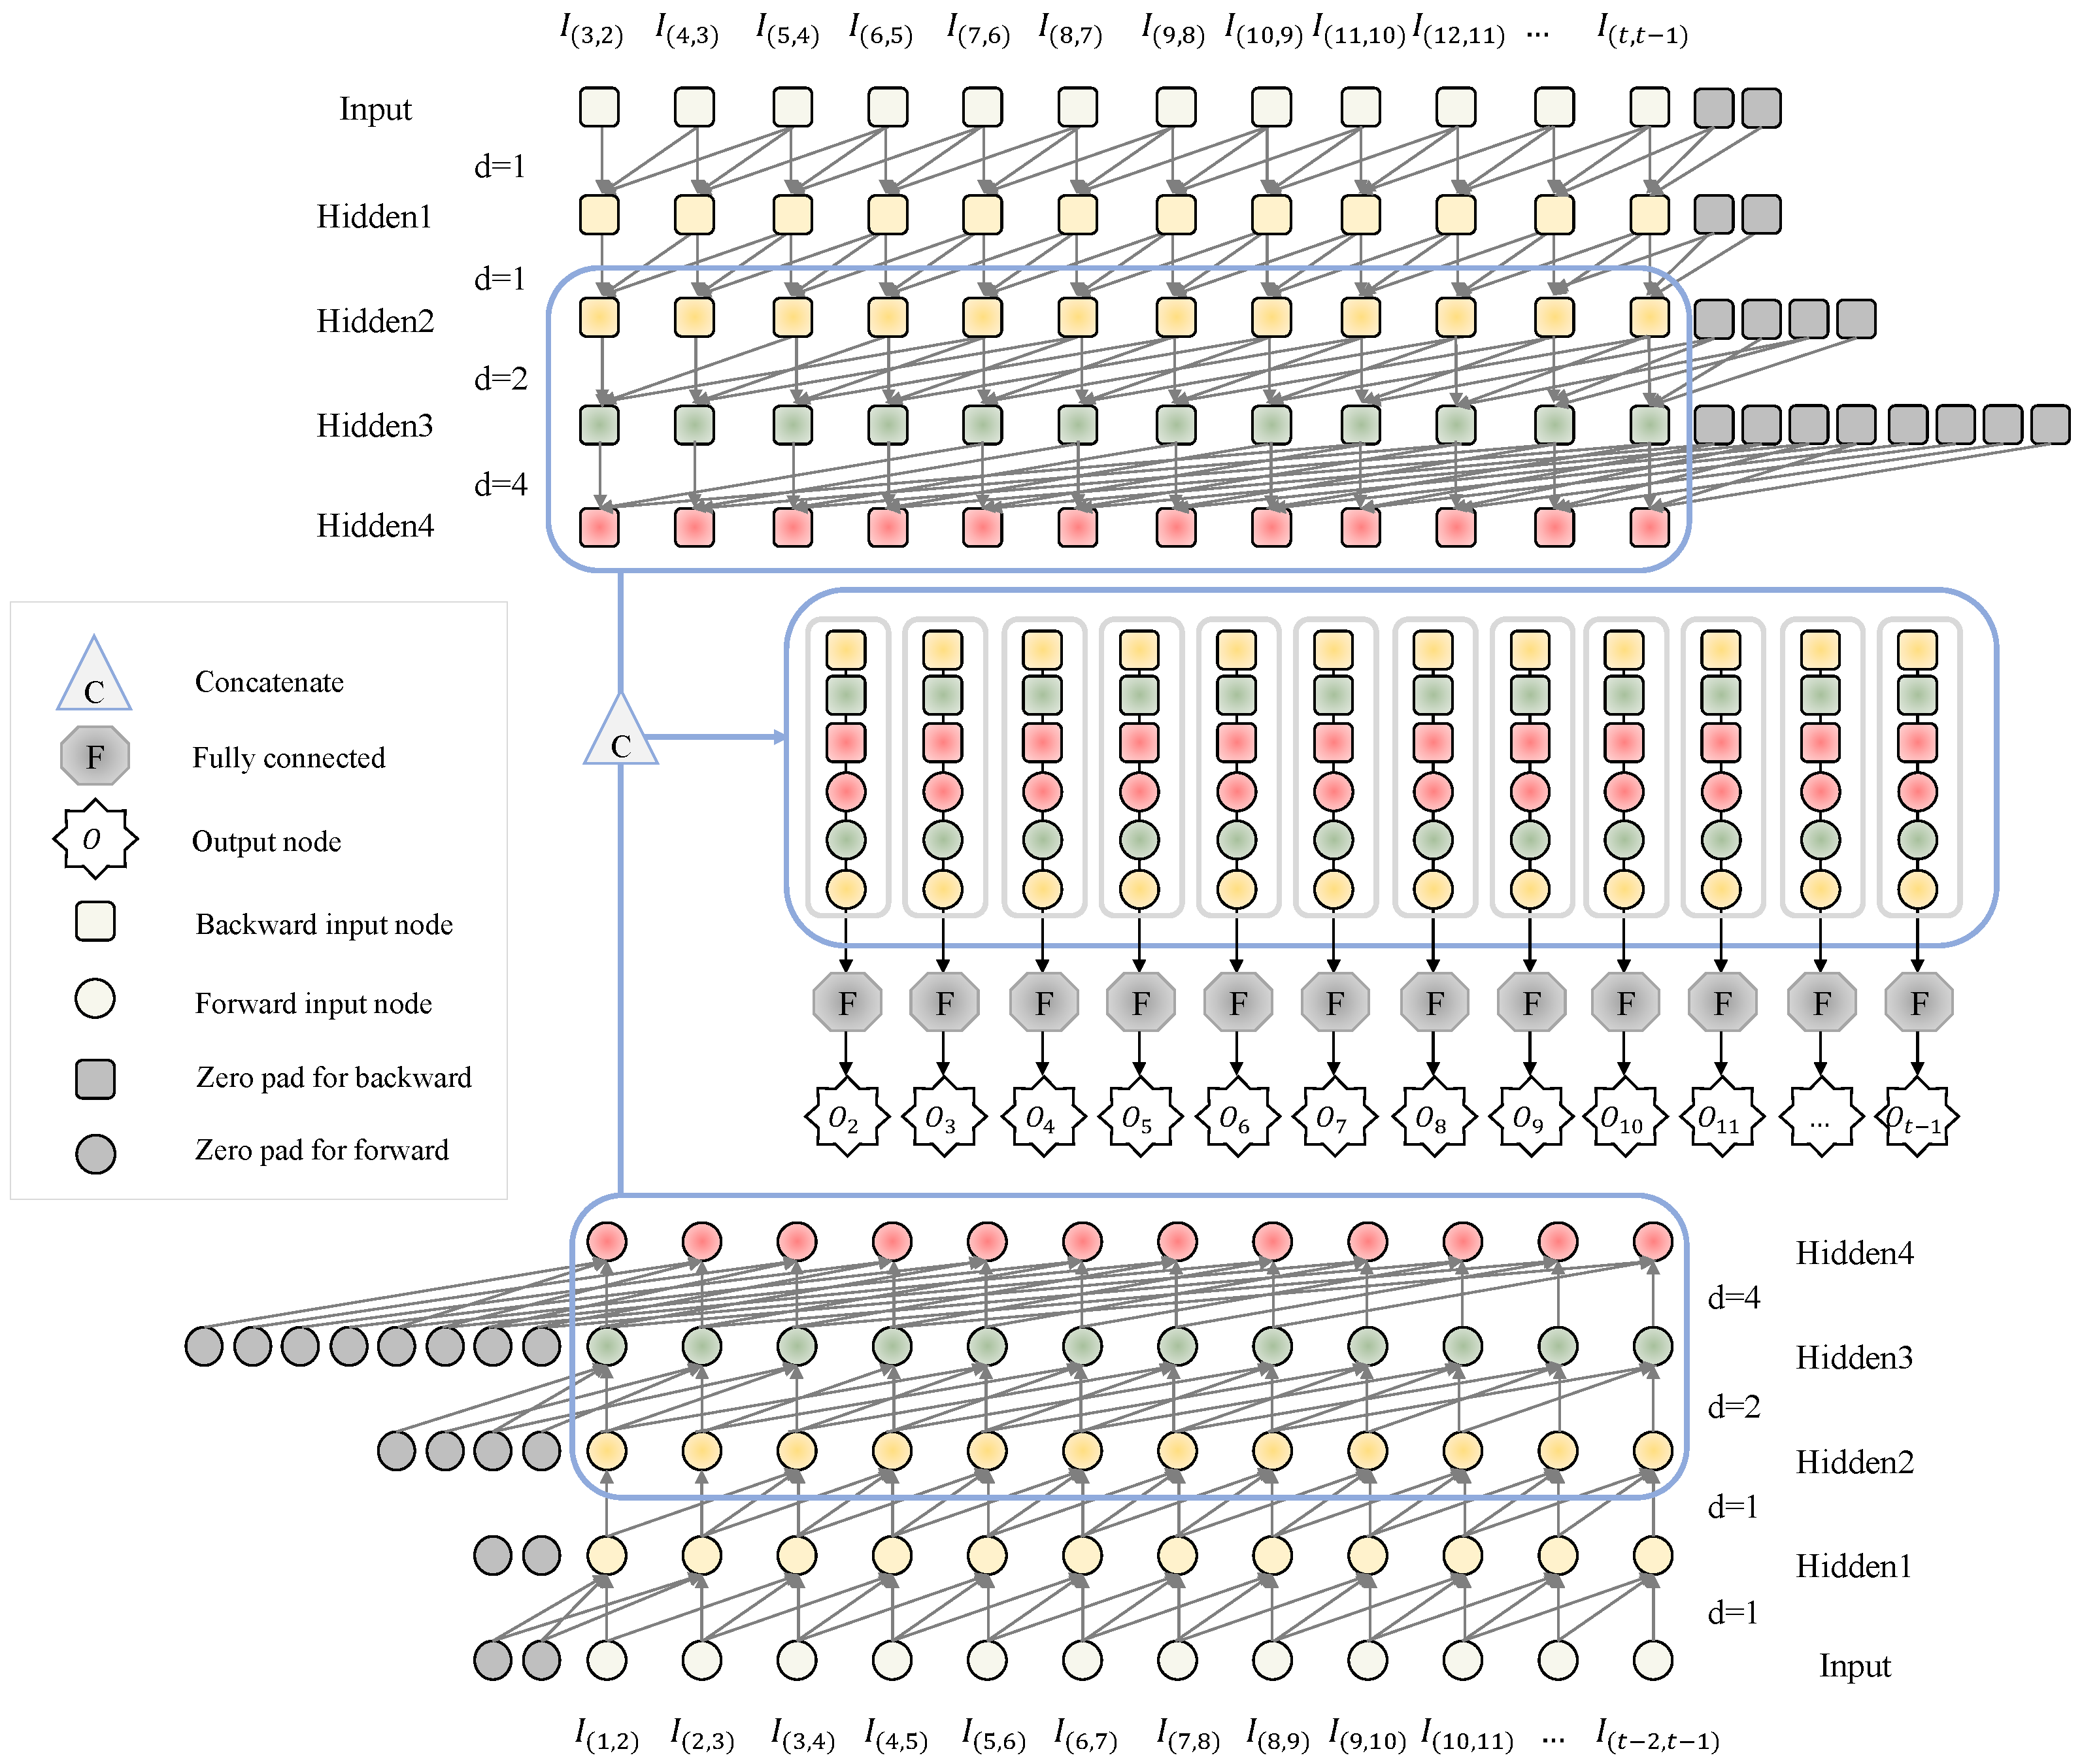
4.2.1. TCN
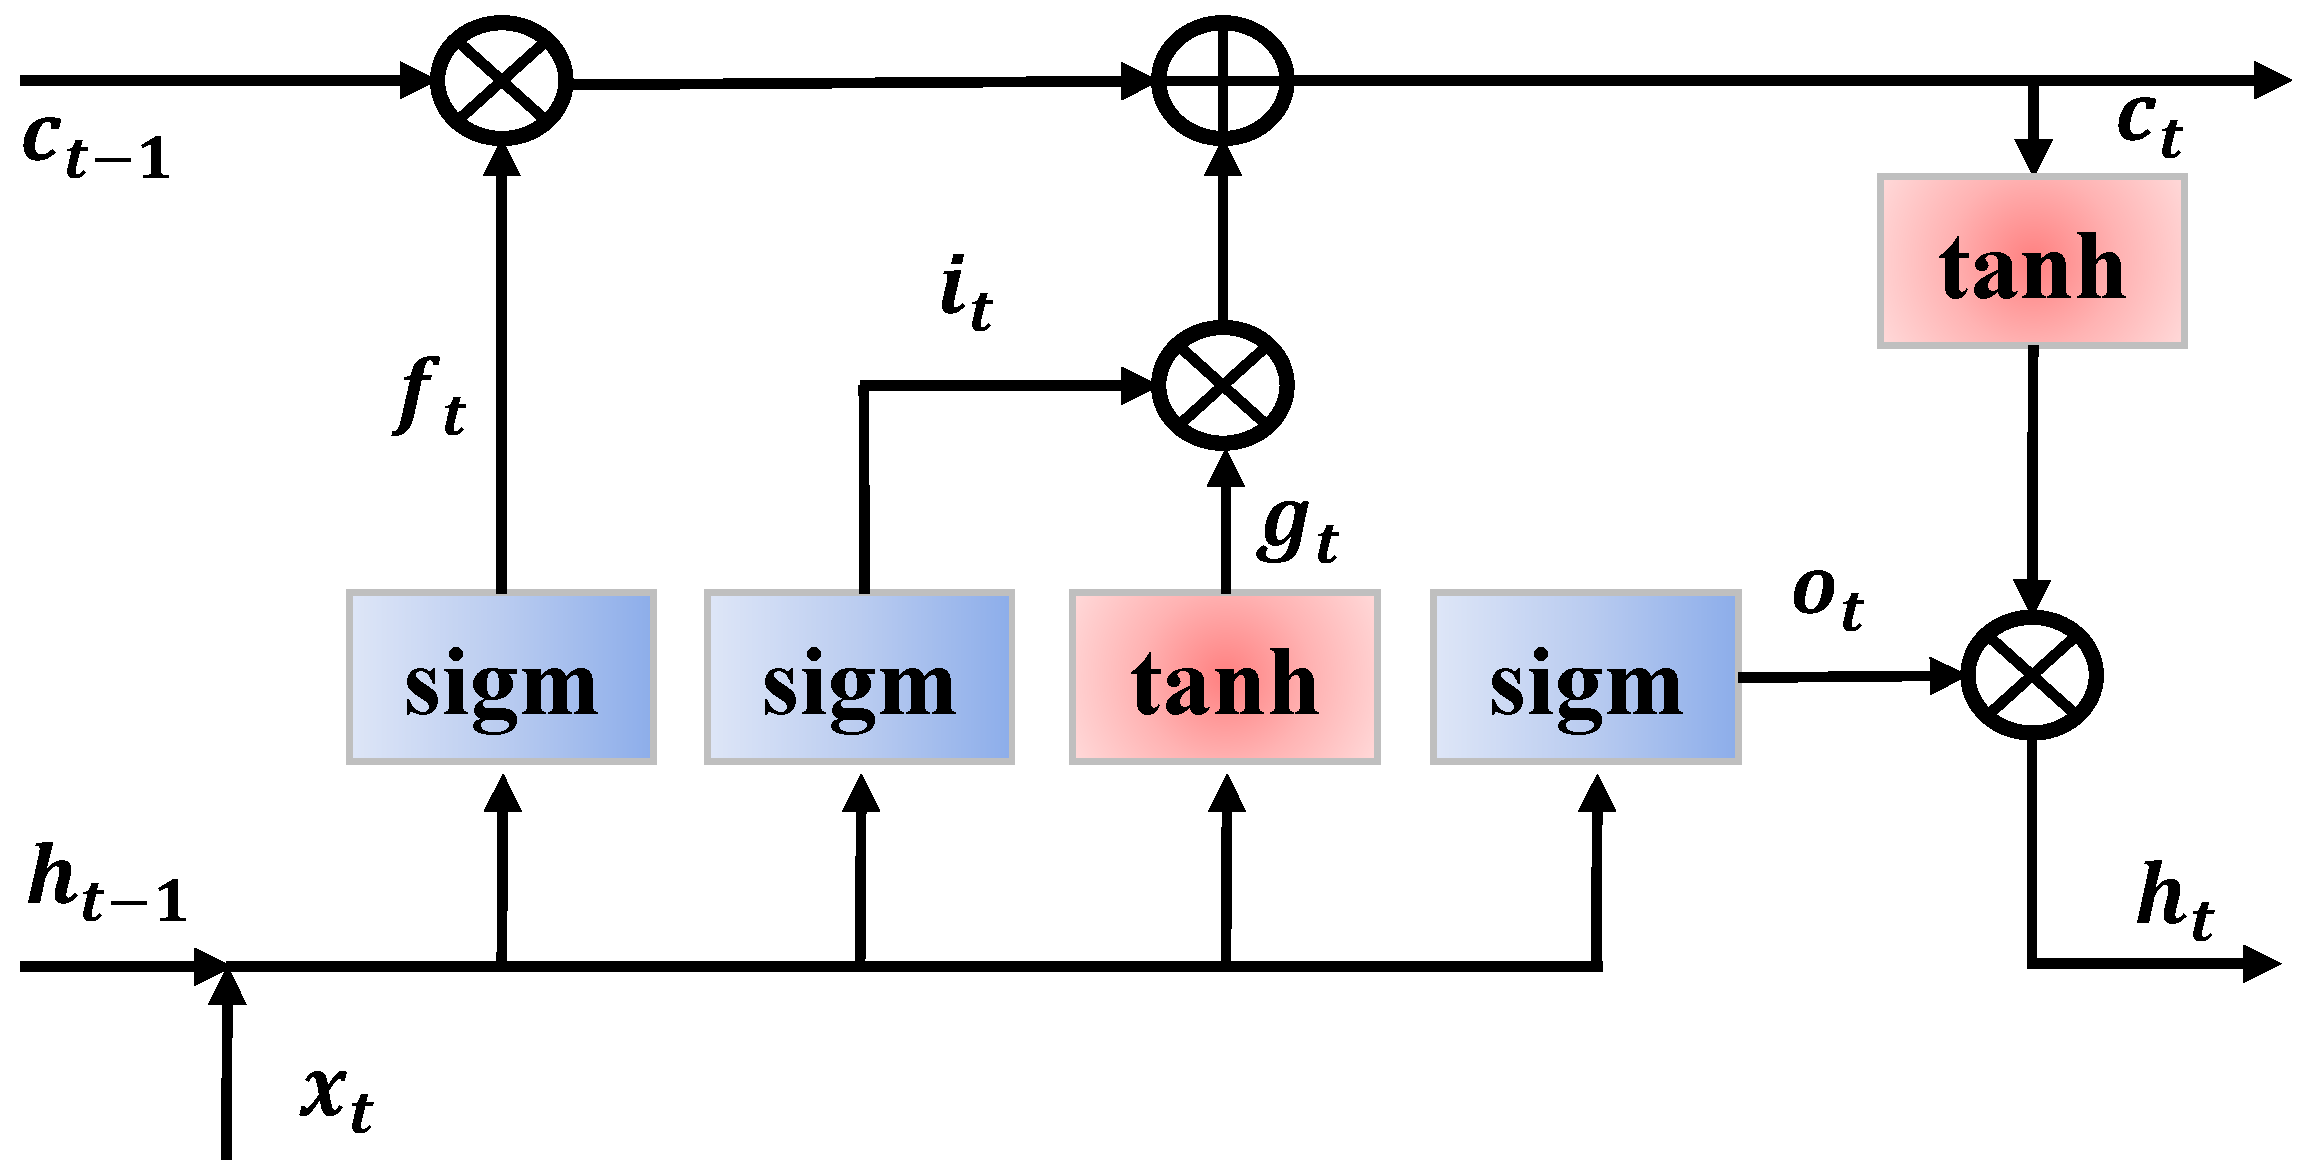
4.2.2. RNN
4.2.3. Training Details
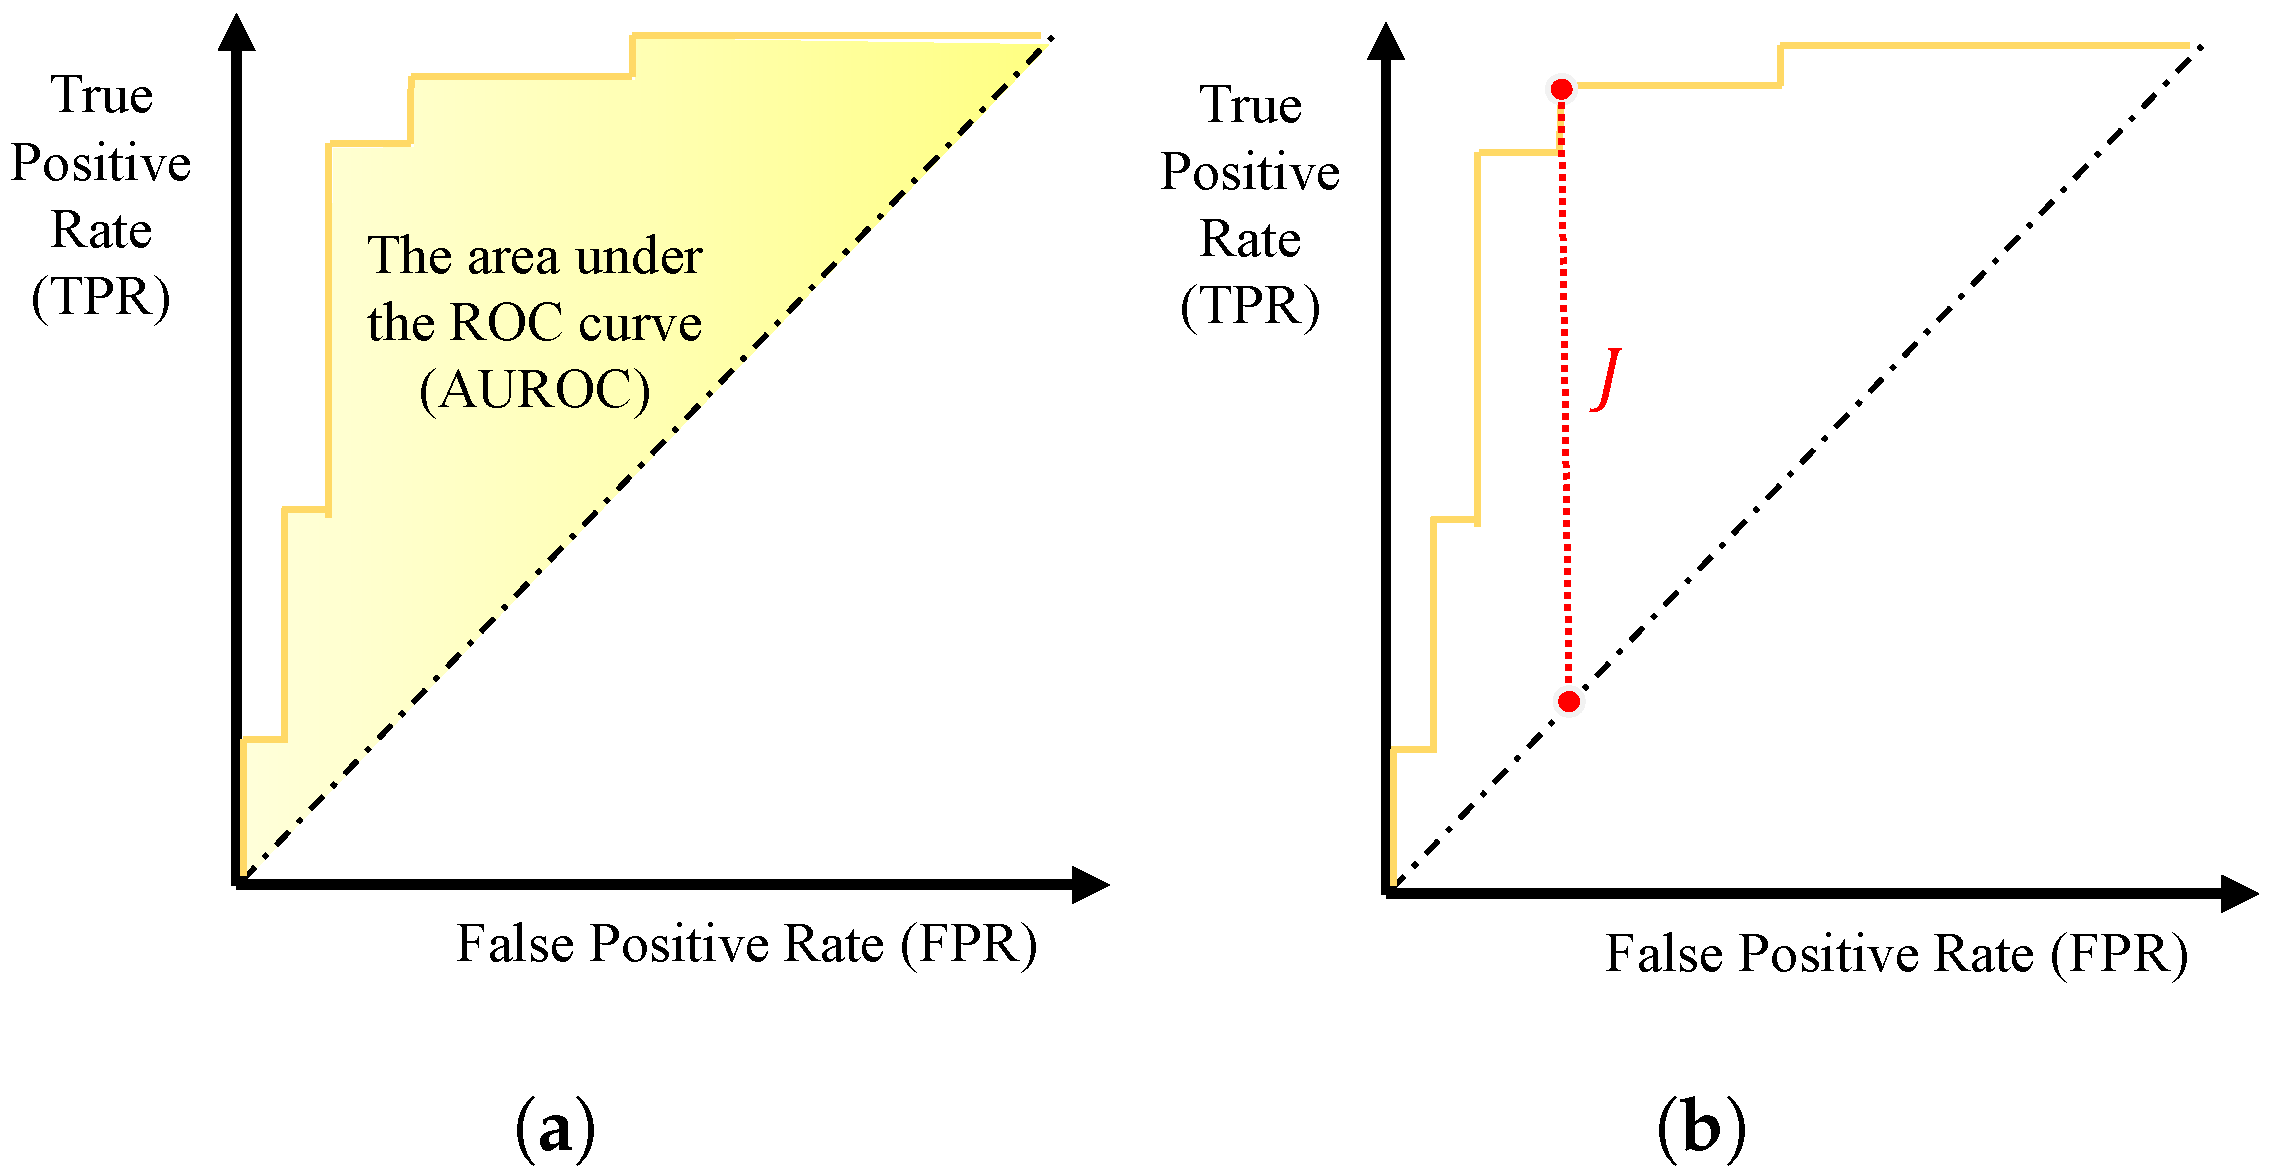
4.2.4. Novelty Score and Performance Measure
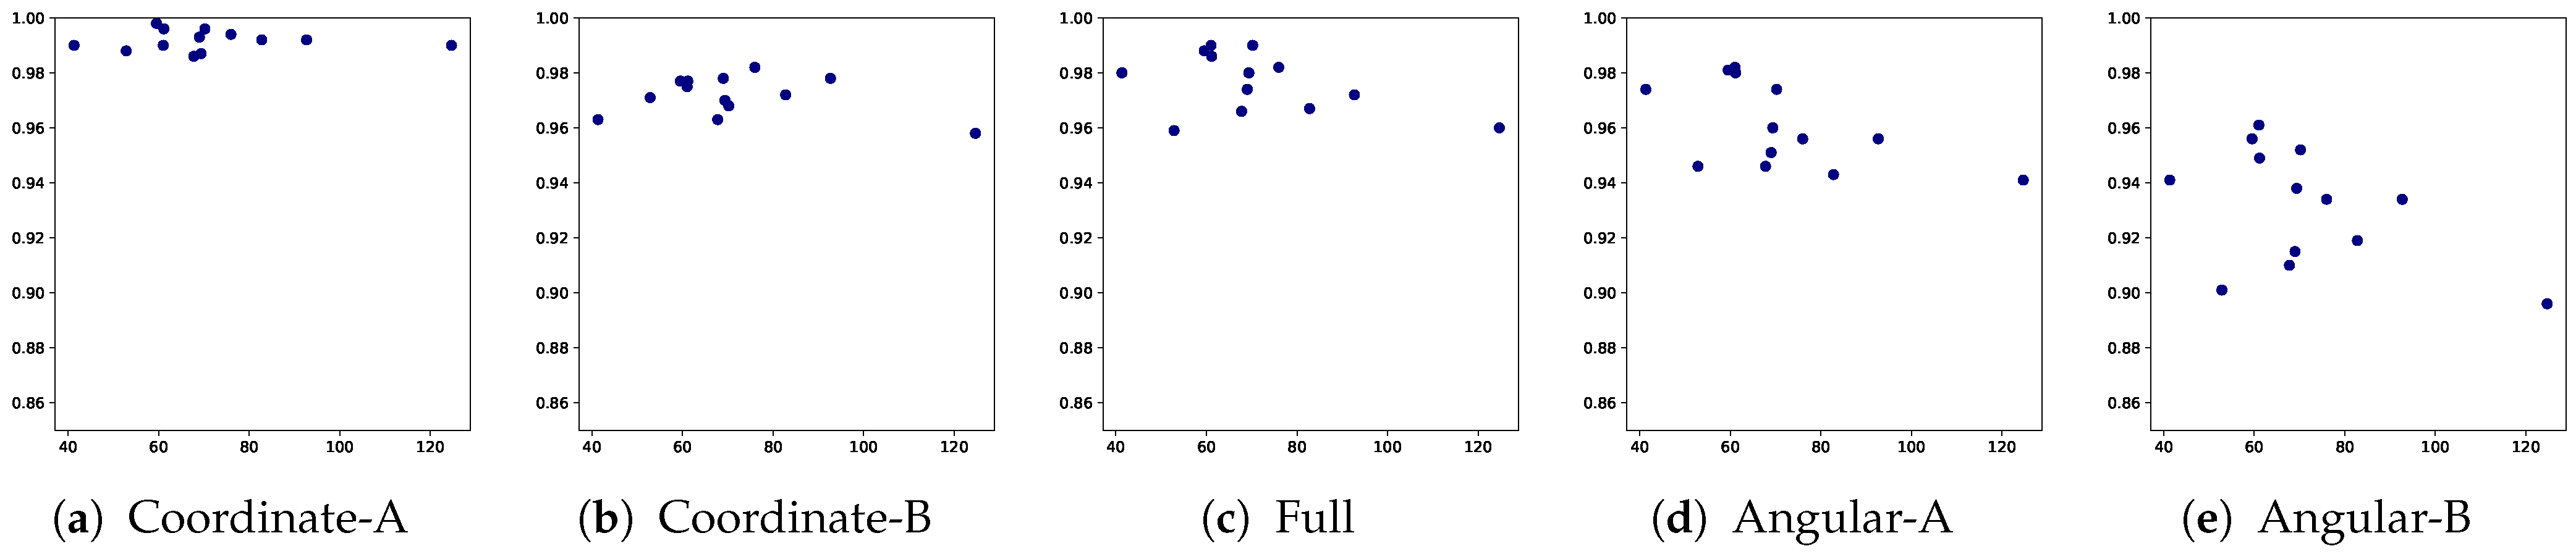
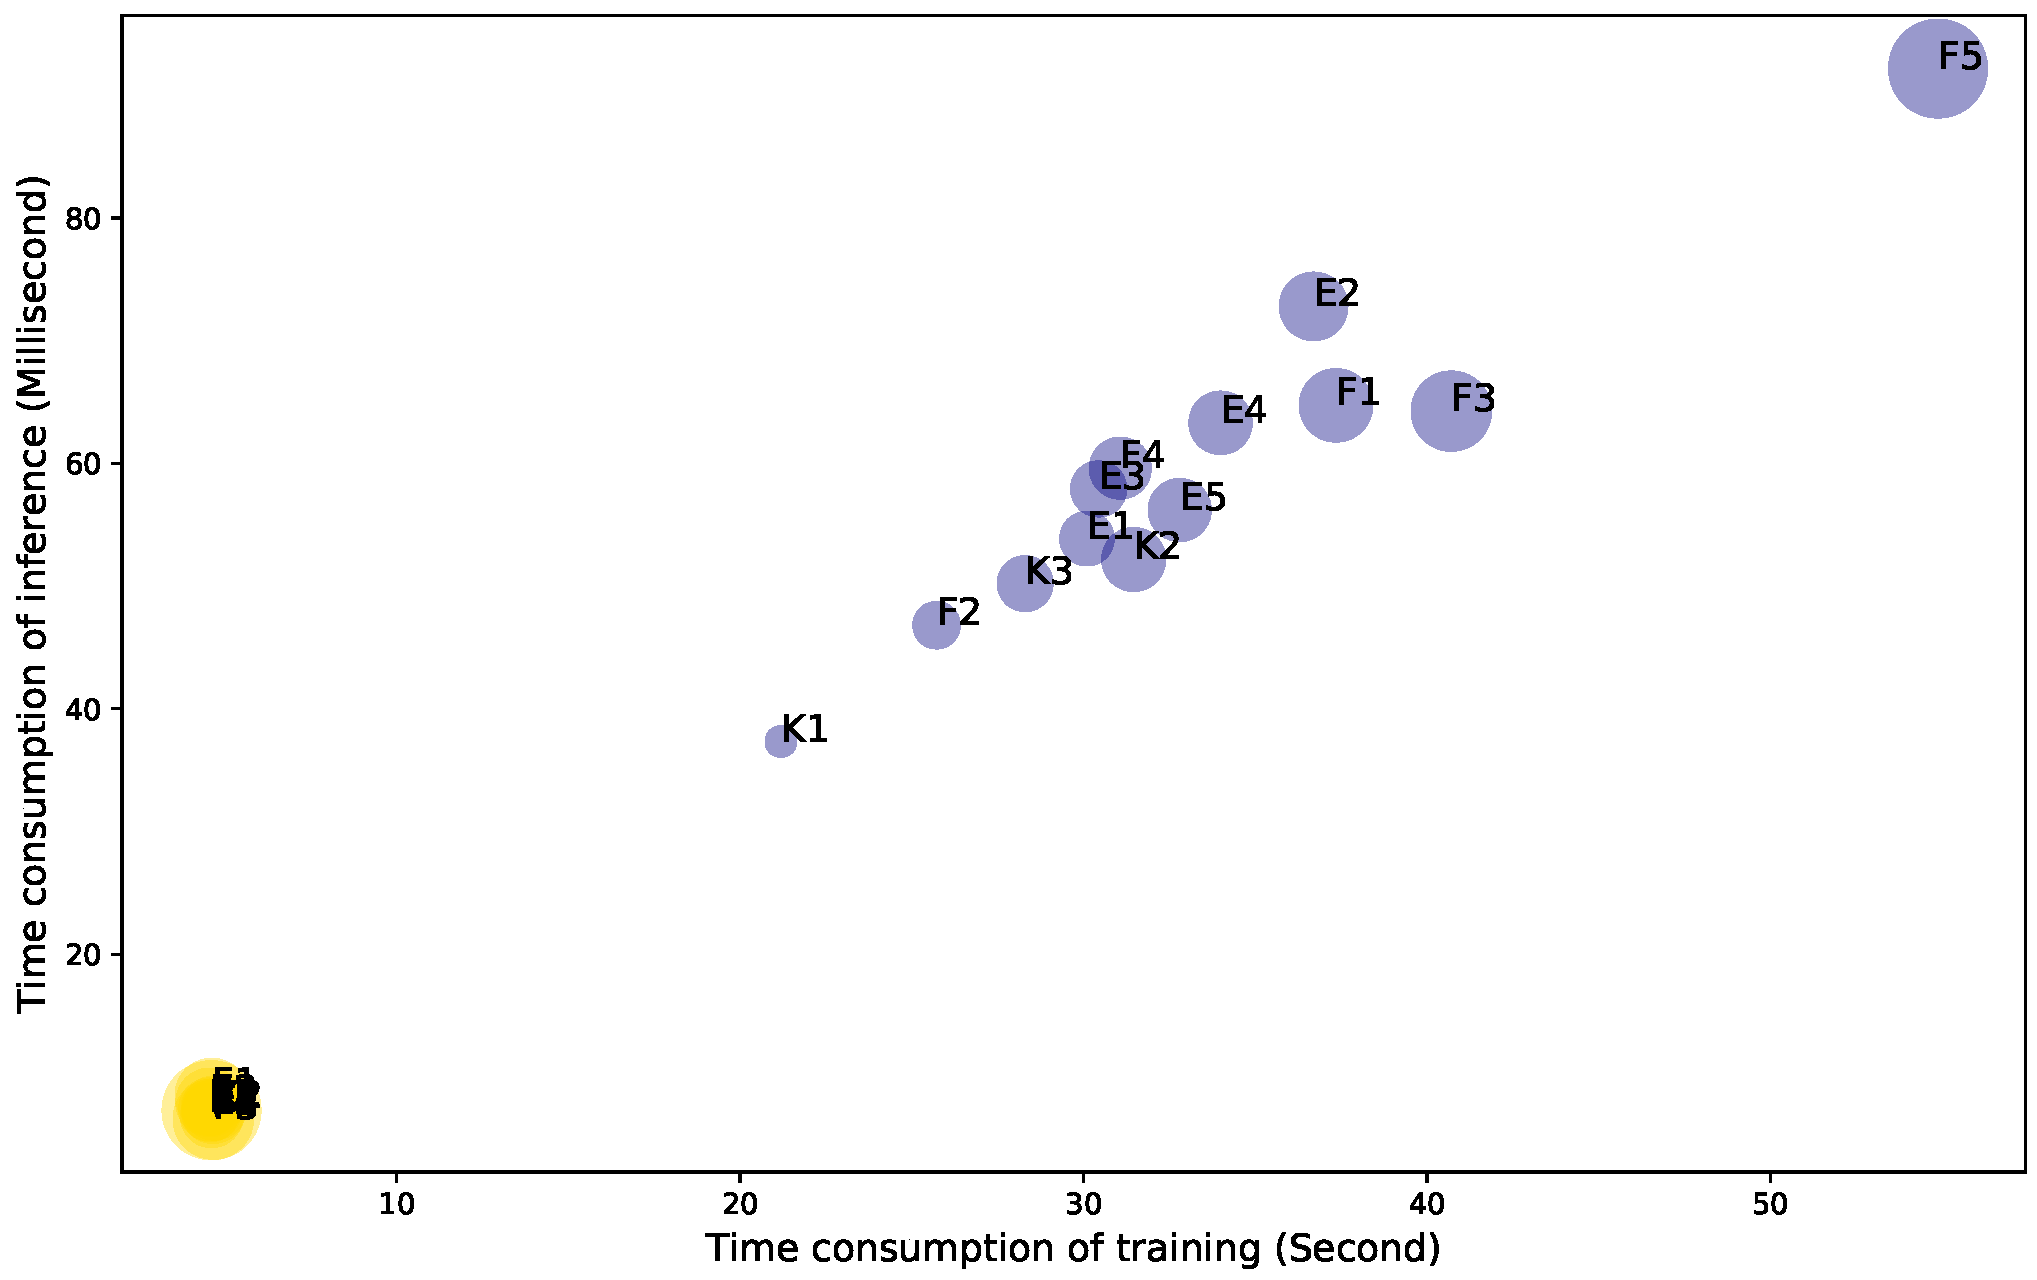
5. Experimental Results
6. Conclusions
Author Contributions
Funding
Institutional Review Board Statement
Informed Consent Statement
Conflicts of Interest
Appendix A


References
- Kim, J.; Kang, P. Analyzing International Collaboration and Identifying Core Topics for the “Internet of Things” Based on Network Analysis and Topic Modeling. Int. J. Ind. Eng. 2018, 25, 349–369. [Google Scholar]
- Ibrahim, T.M.; Abdulhamid, S.M.; Alarood, A.A.; Chiroma, H.; Al-garadi, M.A.; Rana, N.; Muhammad, A.N.; Abubakar, A.; Haruna, K.; Gabralla, L.A. Recent advances in mobile touch screen security authentication methods: A systematic literature review. Comput. Secur. 2019, 85, 1–24. [Google Scholar] [CrossRef]
- Furnell, S.; Clarke, N.; Karatzouni, S. Beyond the pin: Enhancing user authentication for mobile devices. Comput. Fraud. Secur. 2008, 2008, 12–17. [Google Scholar] [CrossRef]
- Sae-Bae, N.; Ahmed, K.; Isbister, K.; Memon, N. Biometric-rich gestures: A novel approach to authentication on multi-touch devices. In Proceedings of the SIGCHI Conference on Human Factors in Computing Systems, Austin, TX, USA, 5–10 May 2012; pp. 977–986. [Google Scholar]
- Orrù, G.; Marcialis, G.L.; Roli, F. A novel classification-selection approach for the self updating of template-based face recognition systems. Pattern Recognit. 2020, 100, 107121. [Google Scholar] [CrossRef] [Green Version]
- Jain, A.K.; Ross, A.; Pankanti, S. Biometrics: A tool for information security. IEEE Trans. Inf. Forensics Secur. 2006, 1, 125–143. [Google Scholar] [CrossRef] [Green Version]
- Ratha, N.K.; Connell, J.H.; Bolle, R.M. Enhancing security and privacy in biometrics-based authentication systems. IBM Syst. J. 2001, 40, 614–634. [Google Scholar] [CrossRef]
- Teh, P.S.; Zhang, N.; Teoh, A.B.J.; Chen, K. TDAS: A touch dynamics based multi-factor authentication solution for mobile devices. Int. J. Pervasive Comput. Commun. 2016, 12, 127–153. [Google Scholar] [CrossRef] [Green Version]
- Shahzad, M.; Liu, A.X.; Samuel, A. Secure unlocking of mobile touch screen devices by simple gestures: You can see it but you can not do it. In Proceedings of the 19th Annual International Conference on Mobile Computing & Networking, Miami, FL, USA, 30 September–4 October 2013; pp. 39–50. [Google Scholar]
- Bai, S.; Kolter, J.Z.; Koltun, V. An empirical evaluation of generic convolutional and recurrent networks for sequence modeling. arXiv 2018, arXiv:1803.01271. [Google Scholar]
- Su, B.; Lu, S. Accurate recognition of words in scenes without character segmentation using recurrent neural network. Pattern Recognit. 2017, 63, 397–405. [Google Scholar] [CrossRef]
- Andriotis, P.; Oikonomou, G.; Mylonas, A.; Tryfonas, T. A study on usability and security features of the android pattern lock screen. Inf. Comput. Secur. 2016, 24, 53–72. [Google Scholar] [CrossRef]
- Van Nguyen, T.; Sae-Bae, N.; Memon, N. DRAW-A-PIN: Authentication using finger-drawn PIN on touch devices. Comput. Secur. 2017, 66, 115–128. [Google Scholar] [CrossRef] [Green Version]
- Shukla, D.; Kumar, R.; Serwadda, A.; Phoha, V.V. Beware, your hands reveal your secrets! In Proceedings of the 2014 ACM SIGSAC Conference on Computer and Communications Security, Scottsdale, AZ, USA, 3–7 November 2014; pp. 904–917. [Google Scholar]
- Aviv, A.J.; Gibson, K.L.; Mossop, E.; Blaze, M.; Smith, J.M. Smudge Attacks on Smartphone Touch Screens. Woot 2010, 10, 1–7. [Google Scholar]
- Lindemann, R. The evolution of authentication. In ISSE 2013 Securing Electronic Business Processes; Springer: Berlin/Heidelberg, Germany, 2013; pp. 11–19. [Google Scholar]
- Jermyn, I.; Mayer, A.; Monrose, F.; Reiter, M.K.; Rubin, A.D. The Design and Analysis of Graphical Passwords; USENIX Association: Berkeley, CA, USA, 1999. [Google Scholar]
- Dunphy, P.; Yan, J. Do background images improve draw a secret graphical passwords? In Proceedings of the 14th ACM Conference on Computer and Communications Security, Alexandria, VA, USA, 28–31 October 2007; pp. 36–47. [Google Scholar]
- Yan, Q.; Han, J.; Li, Y.; Zhou, J.; Deng, R.H. Designing leakage-resilient password entry on touchscreen mobile devices. In Proceedings of the 8th ACM SIGSAC Symposium on Information, Computer and Communications Security, Hangzhou, China, 8–10 May 2013; pp. 37–48. [Google Scholar]
- Staneková, L.; Stanek, M. Analysis of dictionary methods for PIN selection. Comput. Secur. 2013, 39, 289–298. [Google Scholar] [CrossRef]
- Aly, Y.; Munteanu, C.; Raimondo, S.; Wu, A.Y.; Wei, M. Spin-lock gesture authentication for mobile devices. In Proceedings of the 18th International Conference on Human–Computer Interaction with Mobile Devices and Services Adjunct, Florence, Italy, 6–9 September 2016; pp. 775–782. [Google Scholar]
- Lee, M.K.; Nam, H.; Kim, D.K. Secure bimodal PIN-entry method using audio signals. Comput. Secur. 2016, 56, 140–150. [Google Scholar] [CrossRef]
- Yager, N.; Dunstone, T. The biometric menagerie. IEEE Trans. Pattern Anal. Mach. Intell. 2008, 32, 220–230. [Google Scholar] [CrossRef] [PubMed]
- Gupta, P.; Behera, S.; Vatsa, M.; Singh, R. On iris spoofing using print attack. In Proceedings of the 2014 22nd International Conference on Pattern Recognition, Stockholm, Sweden, 24–28 August 2014; pp. 1681–1686. [Google Scholar]
- Prabhakar, S.; Pankanti, S.; Jain, A.K. Biometric recognition: Security and privacy concerns. IEEE Secur. Priv. 2003, 1, 33–42. [Google Scholar] [CrossRef]
- Feng, T.; Liu, Z.; Kwon, K.A.; Shi, W.; Carbunar, B.; Jiang, Y.; Nguyen, N. Continuous mobile authentication using touchscreen gestures. In Proceedings of the 2012 IEEE Conference on Technologies for Homeland Security (HST), Waltham, MA, USA, 13–15 November 2012; pp. 451–456. [Google Scholar]
- De Luca, A.; Hang, A.; Brudy, F.; Lindner, C.; Hussmann, H. Touch me once and i know it’s you!: Implicit authentication based on touch screen patterns. In Proceedings of the SIGCHI Conference on Human Factors in Computing Systems, Austin, TX, USA, 5–10 May 2012; pp. 987–996. [Google Scholar]
- Corpus, K.R.; Gonzales, R.J.D.; Morada, A.S.; Vea, L.A. Mobile user identification through authentication using keystroke dynamics and accelerometer biometrics. In Proceedings of the 2016 IEEE/ACM International Conference on Mobile Software Engineering and Systems (MOBILESoft), Austin, TX, USA, 14–22 May 2016; pp. 11–12. [Google Scholar]
- Geng, Y.; Su, L.; Jia, Y.; Han, C. Seismic Events Prediction Using Deep Temporal Convolution Networks. J. Electr. Comput. Eng. 2019. [Google Scholar] [CrossRef] [Green Version]
- Lea, C.; Flynn, M.D.; Vidal, R.; Reiter, A.; Hager, G.D. Temporal convolutional networks for action segmentation and detection. In Proceedings of the IEEE Conference on Computer Vision and Pattern Recognition, Honolulu, HI, USA, 21–26 July 2017; pp. 156–165. [Google Scholar]
- Ba, J.L.; Kiros, J.R.; Hinton, G.E. Layer normalization. arXiv 2016, arXiv:1607.06450. [Google Scholar]
- Krizhevsky, A.; Sutskever, I.; Hinton, G.E. Imagenet classification with deep convolutional neural networks. Adv. Neural Inf. Process. Syst. 2012, 25, 1097–1105. [Google Scholar] [CrossRef]
- Zhang, X.; LeCun, Y. Which encoding is the best for text classification in chinese, english, japanese and korean? arXiv 2017, arXiv:1708.02657. [Google Scholar]
- Greff, K.; Srivastava, R.K.; Koutník, J.; Steunebrink, B.R.; Schmidhuber, J. LSTM: A search space odyssey. IEEE Trans. Neural Netw. Learn. Syst. 2016, 28, 2222–2232. [Google Scholar] [CrossRef] [PubMed] [Green Version]
- Kim, J.; Kang, P. Recurrent neural network-based user authentication for freely typed keystroke data. arXiv 2018, arXiv:1806.06190. [Google Scholar]
- Niu, J.; Chen, J.; Xu, Y. Twin support vector regression with Huber loss. J. Intell. Fuzzy Syst. 2017, 32, 4247–4258. [Google Scholar] [CrossRef]
- DeLong, E.R.; DeLong, D.M.; Clarke-Pearson, D.L. Comparing the areas under two or more correlated receiver operating characteristic curves: A nonparametric approach. Biometrics 1988, 44, 837–845. [Google Scholar] [CrossRef]
- Hilden, J.; Glasziou, P. Regret graphs, diagnostic uncertainty and Youden’s Index. Stat. Med. 1996, 15, 969–986. [Google Scholar] [CrossRef]


| Experimental Factor | Value |
|---|---|
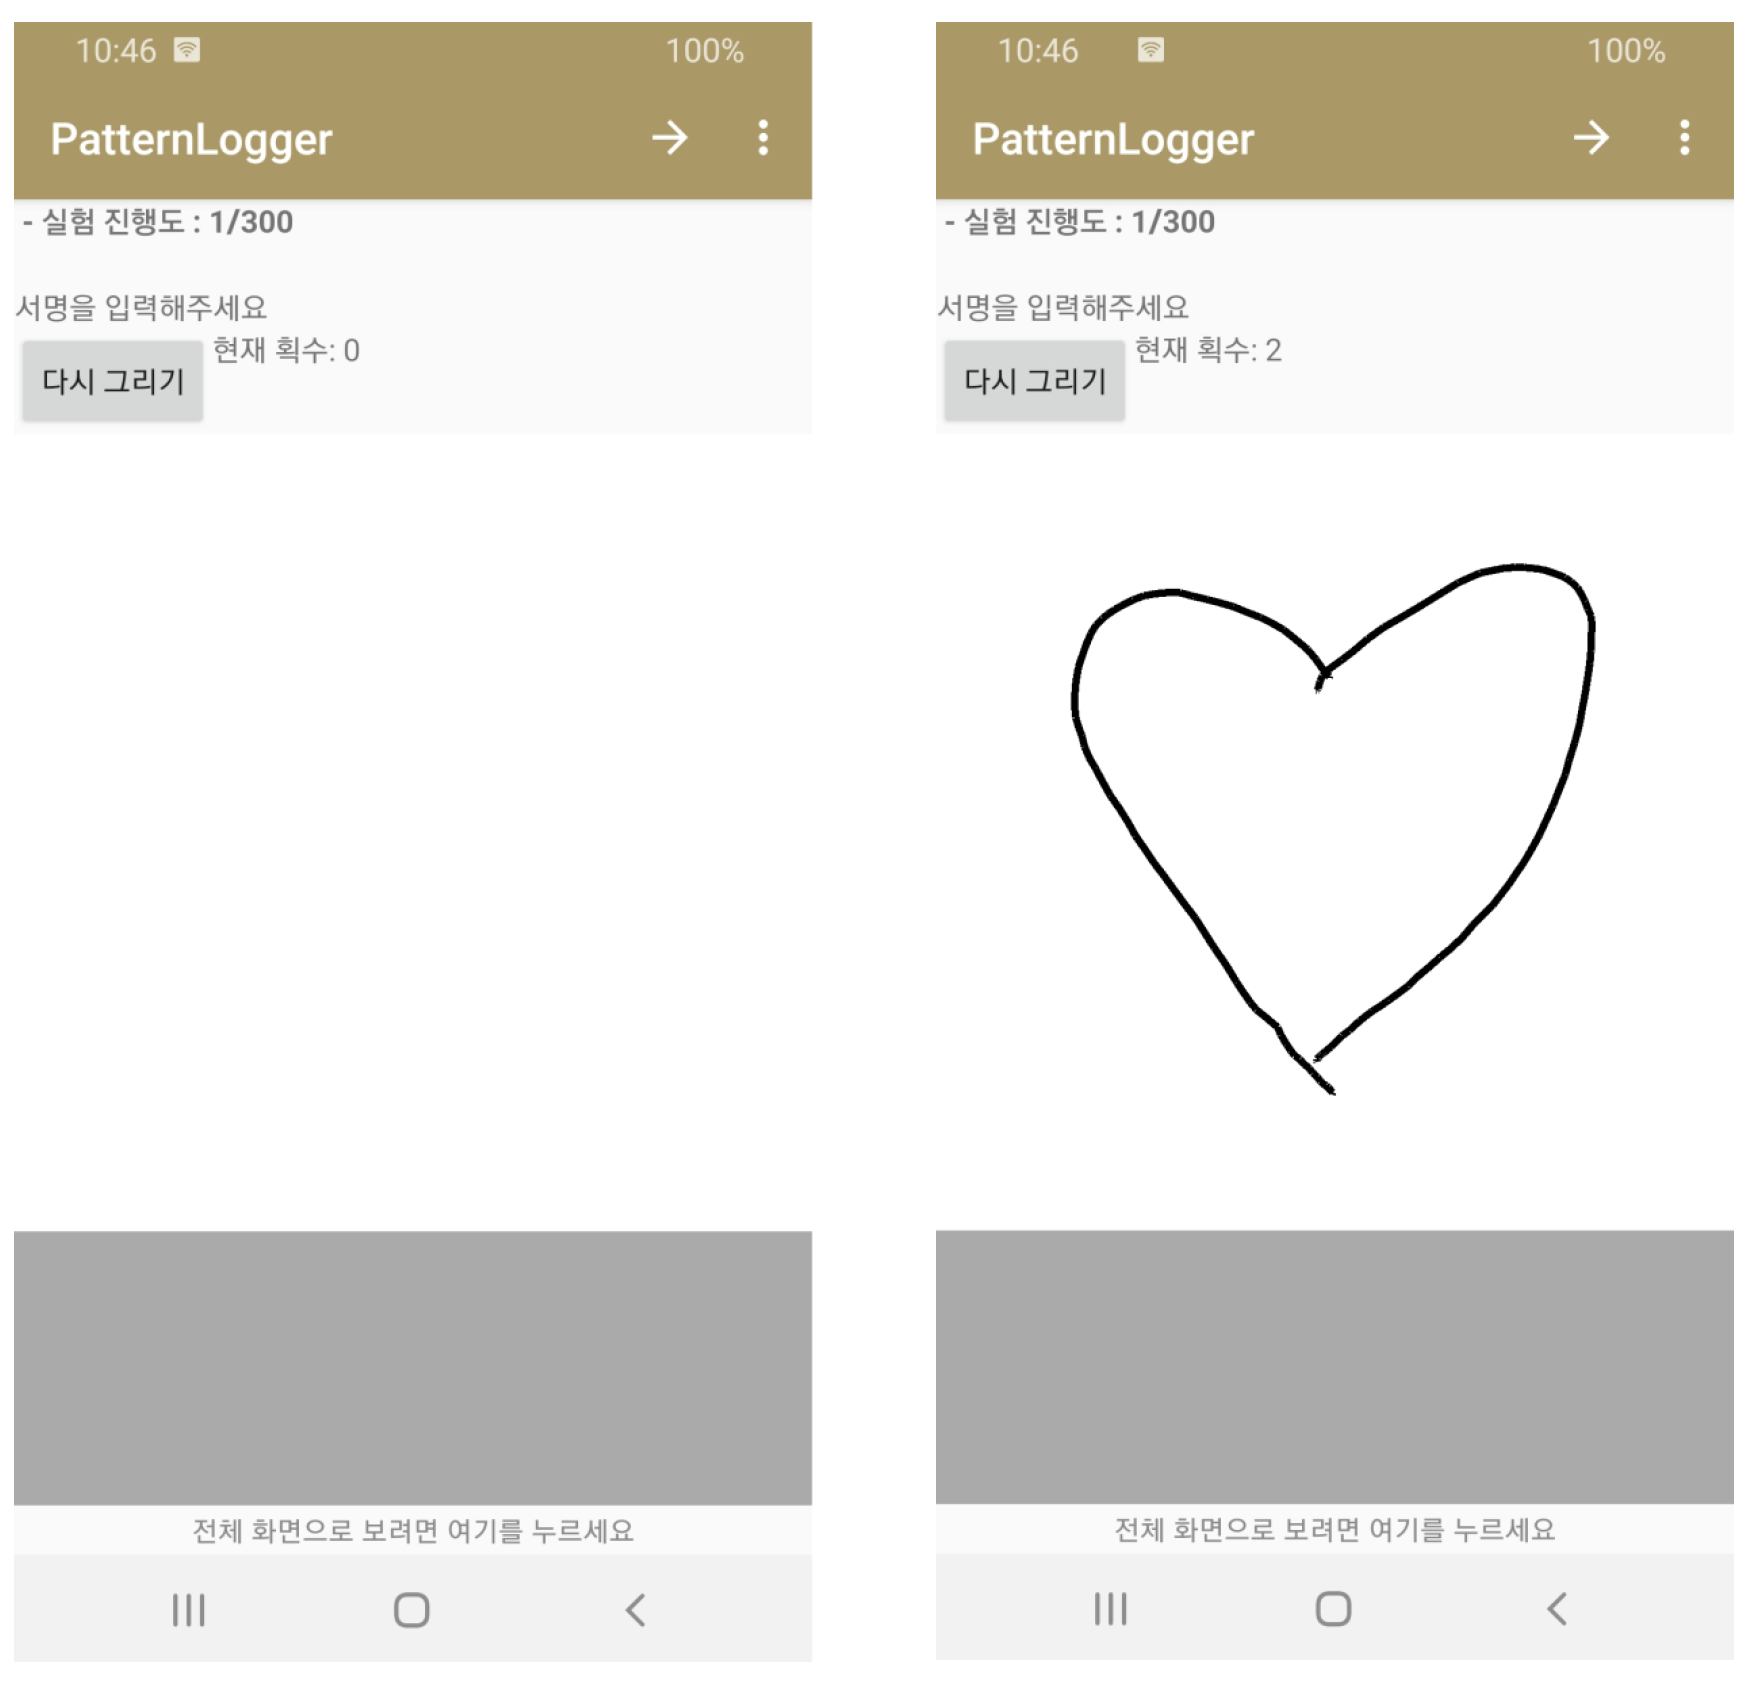
| Total number of participants | 40 |
| Number of drawing patterns | 13 |
| Repetition of each drawing pattern | 20 |
| Smartphone device | Samsung Galaxy S8 |
| Drawing Category | Number of Patterns |
|---|---|
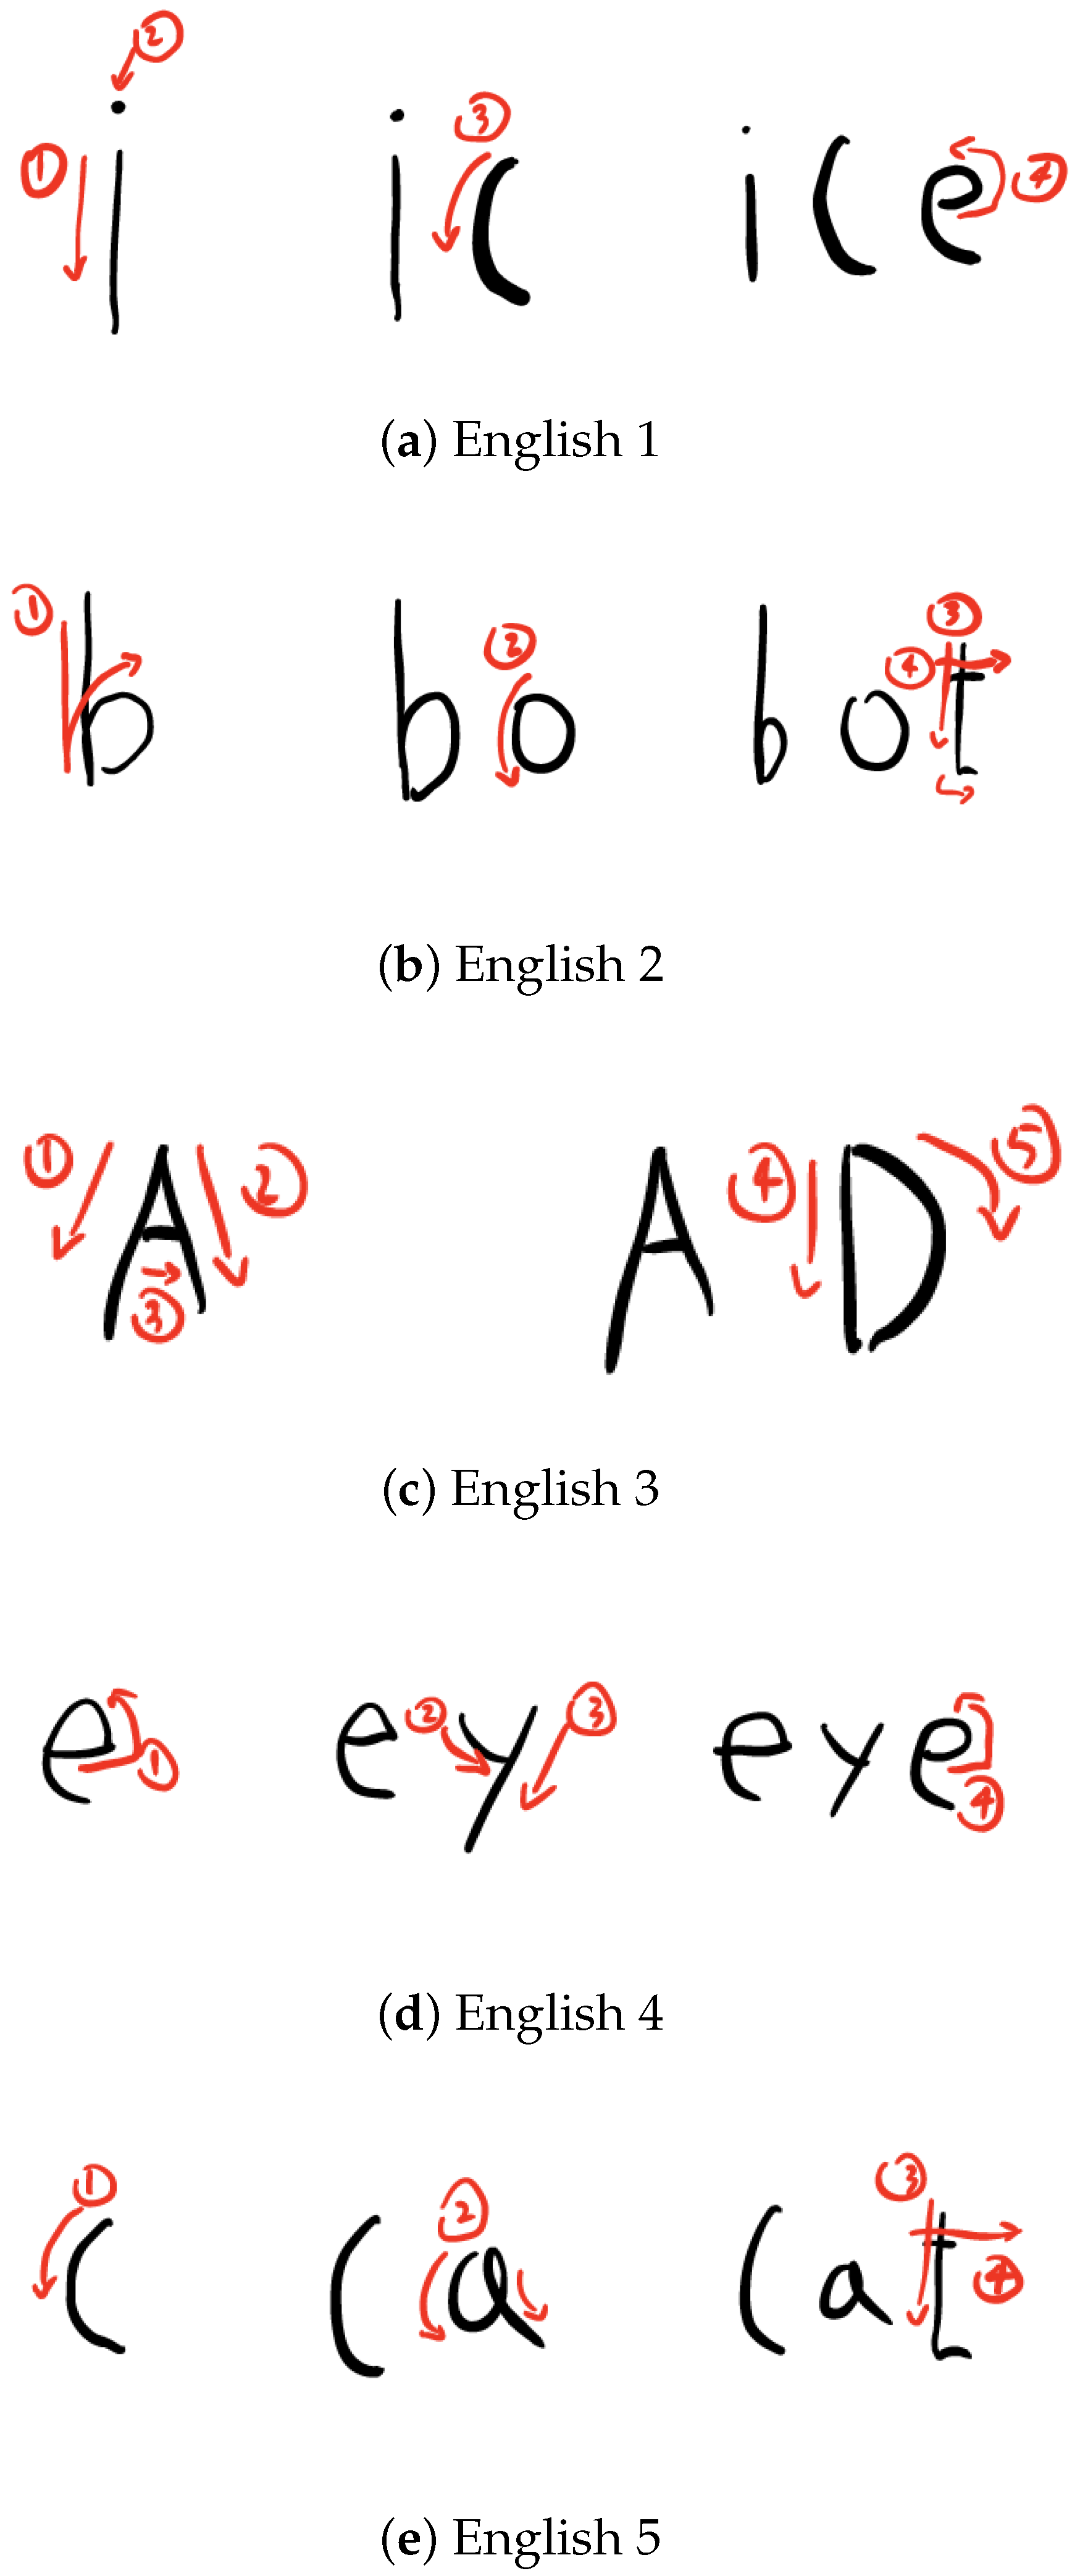
| English | 5 |
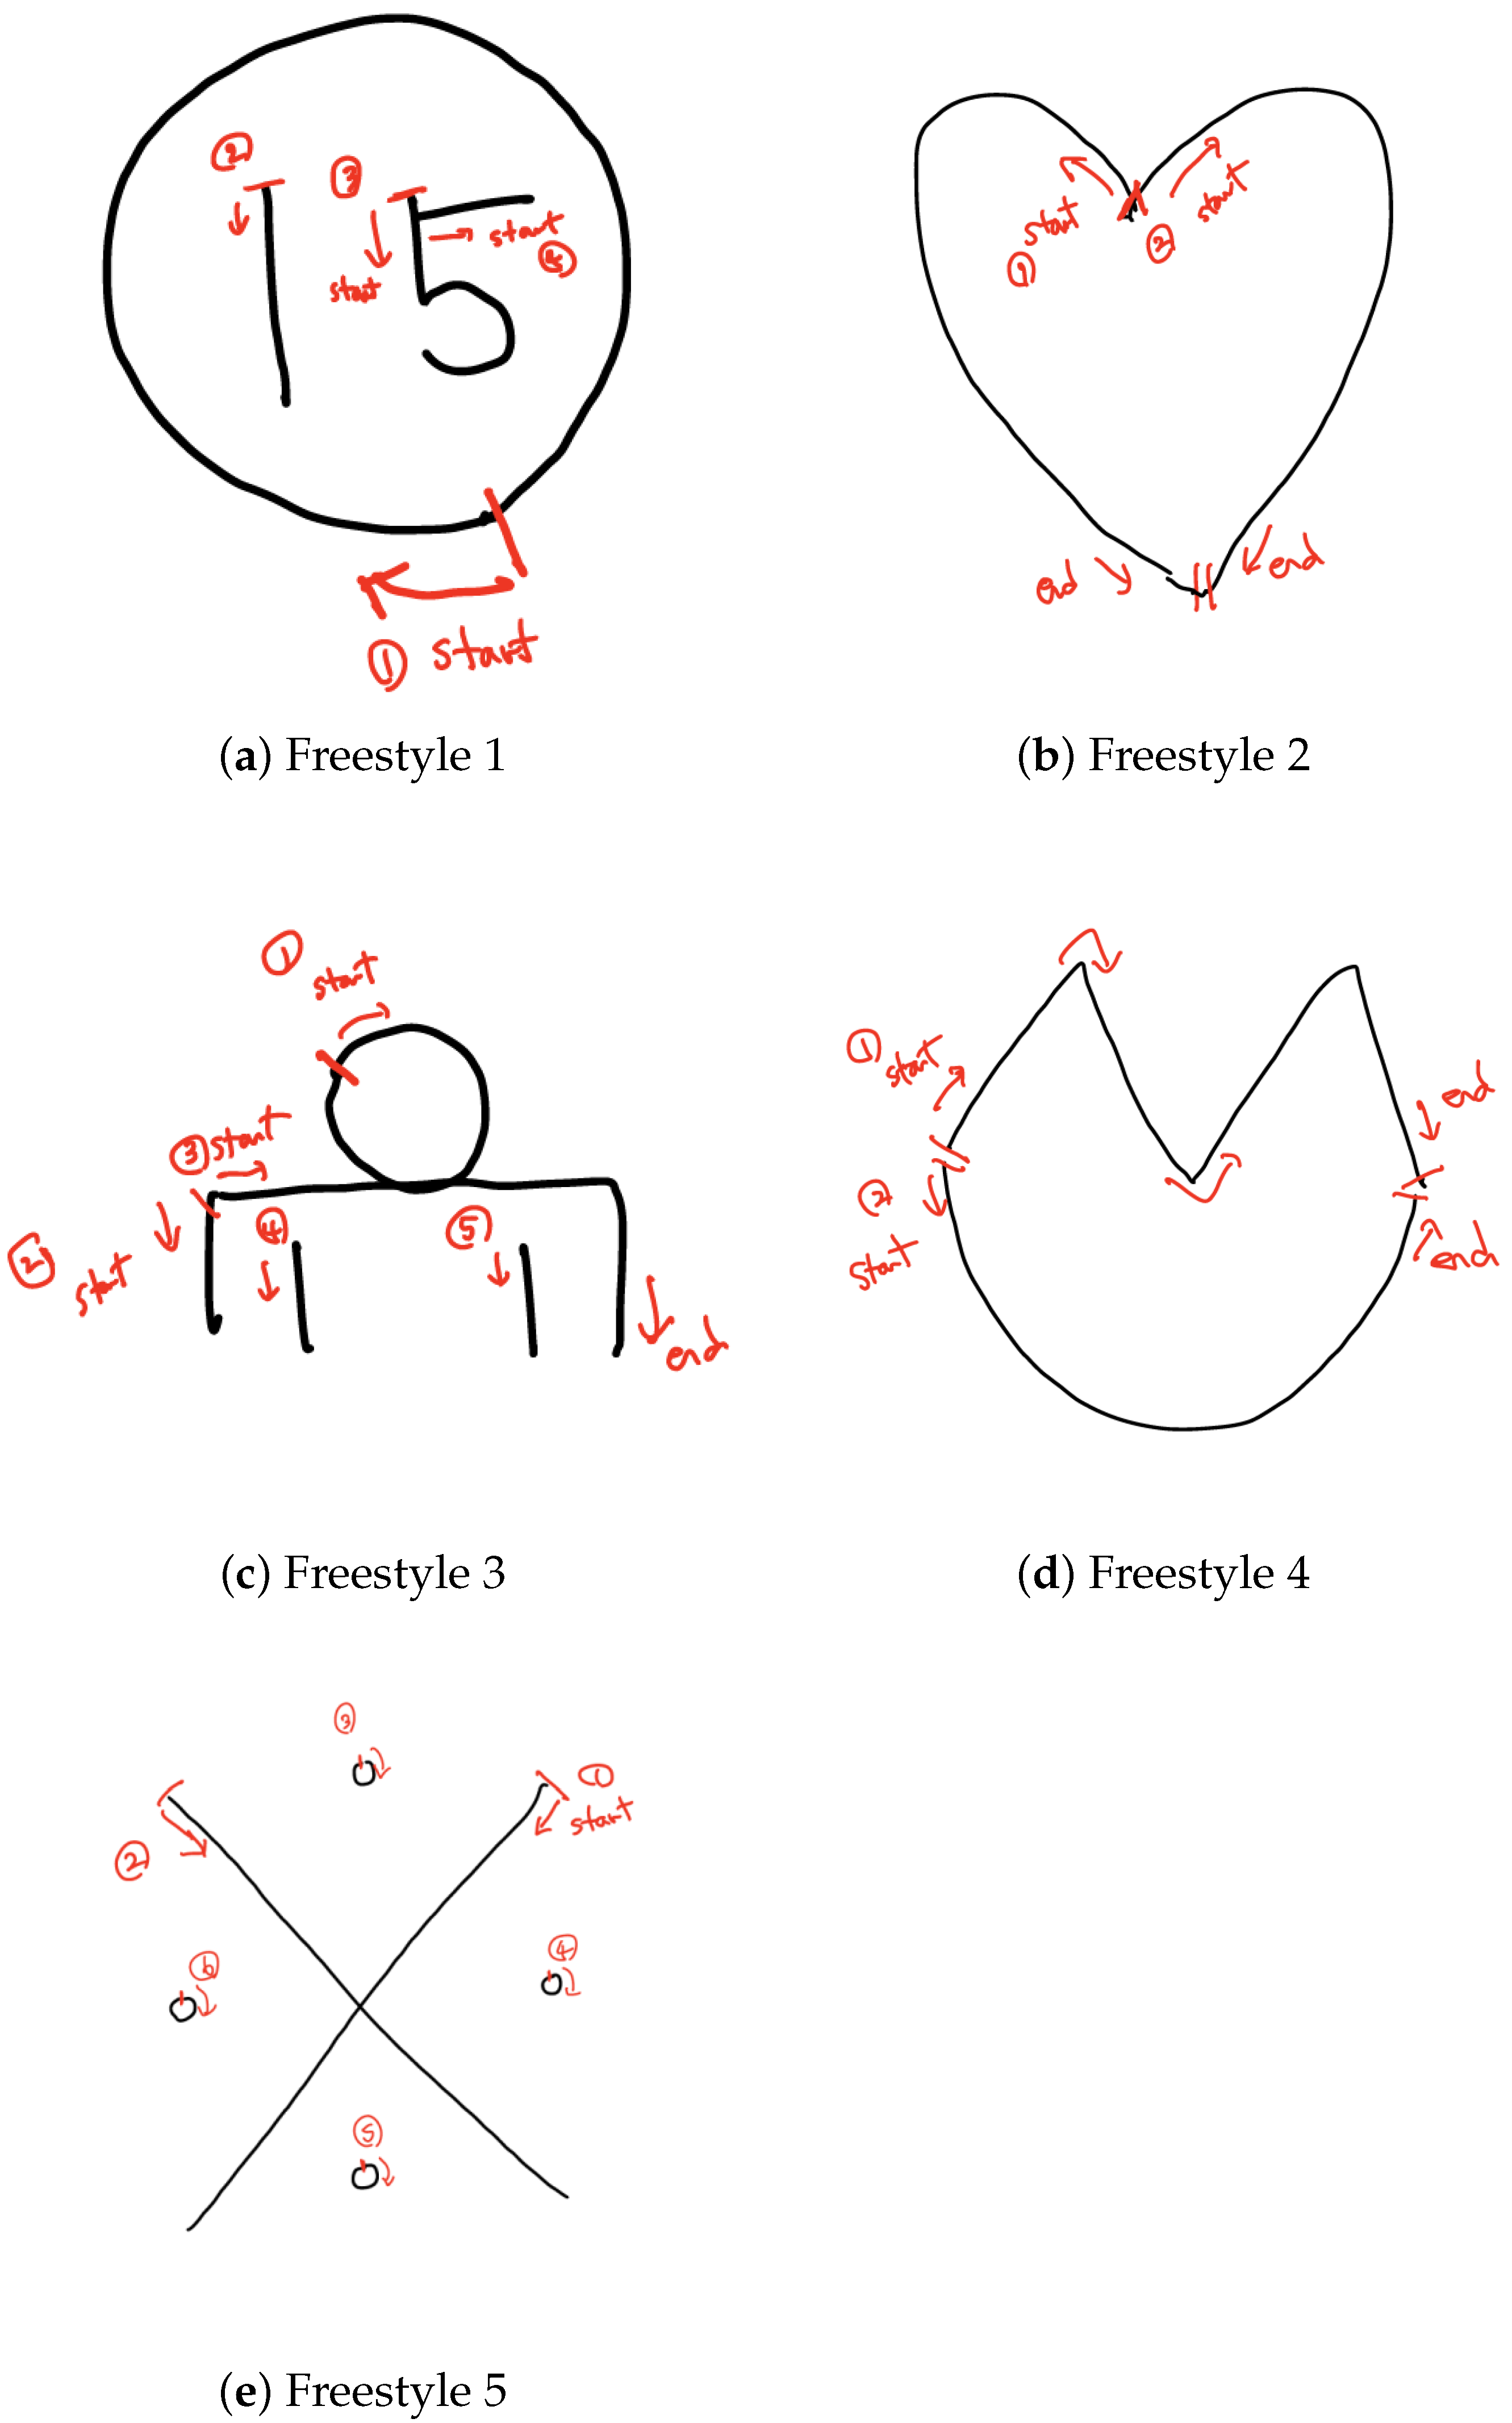
| Freestyle | 5 |
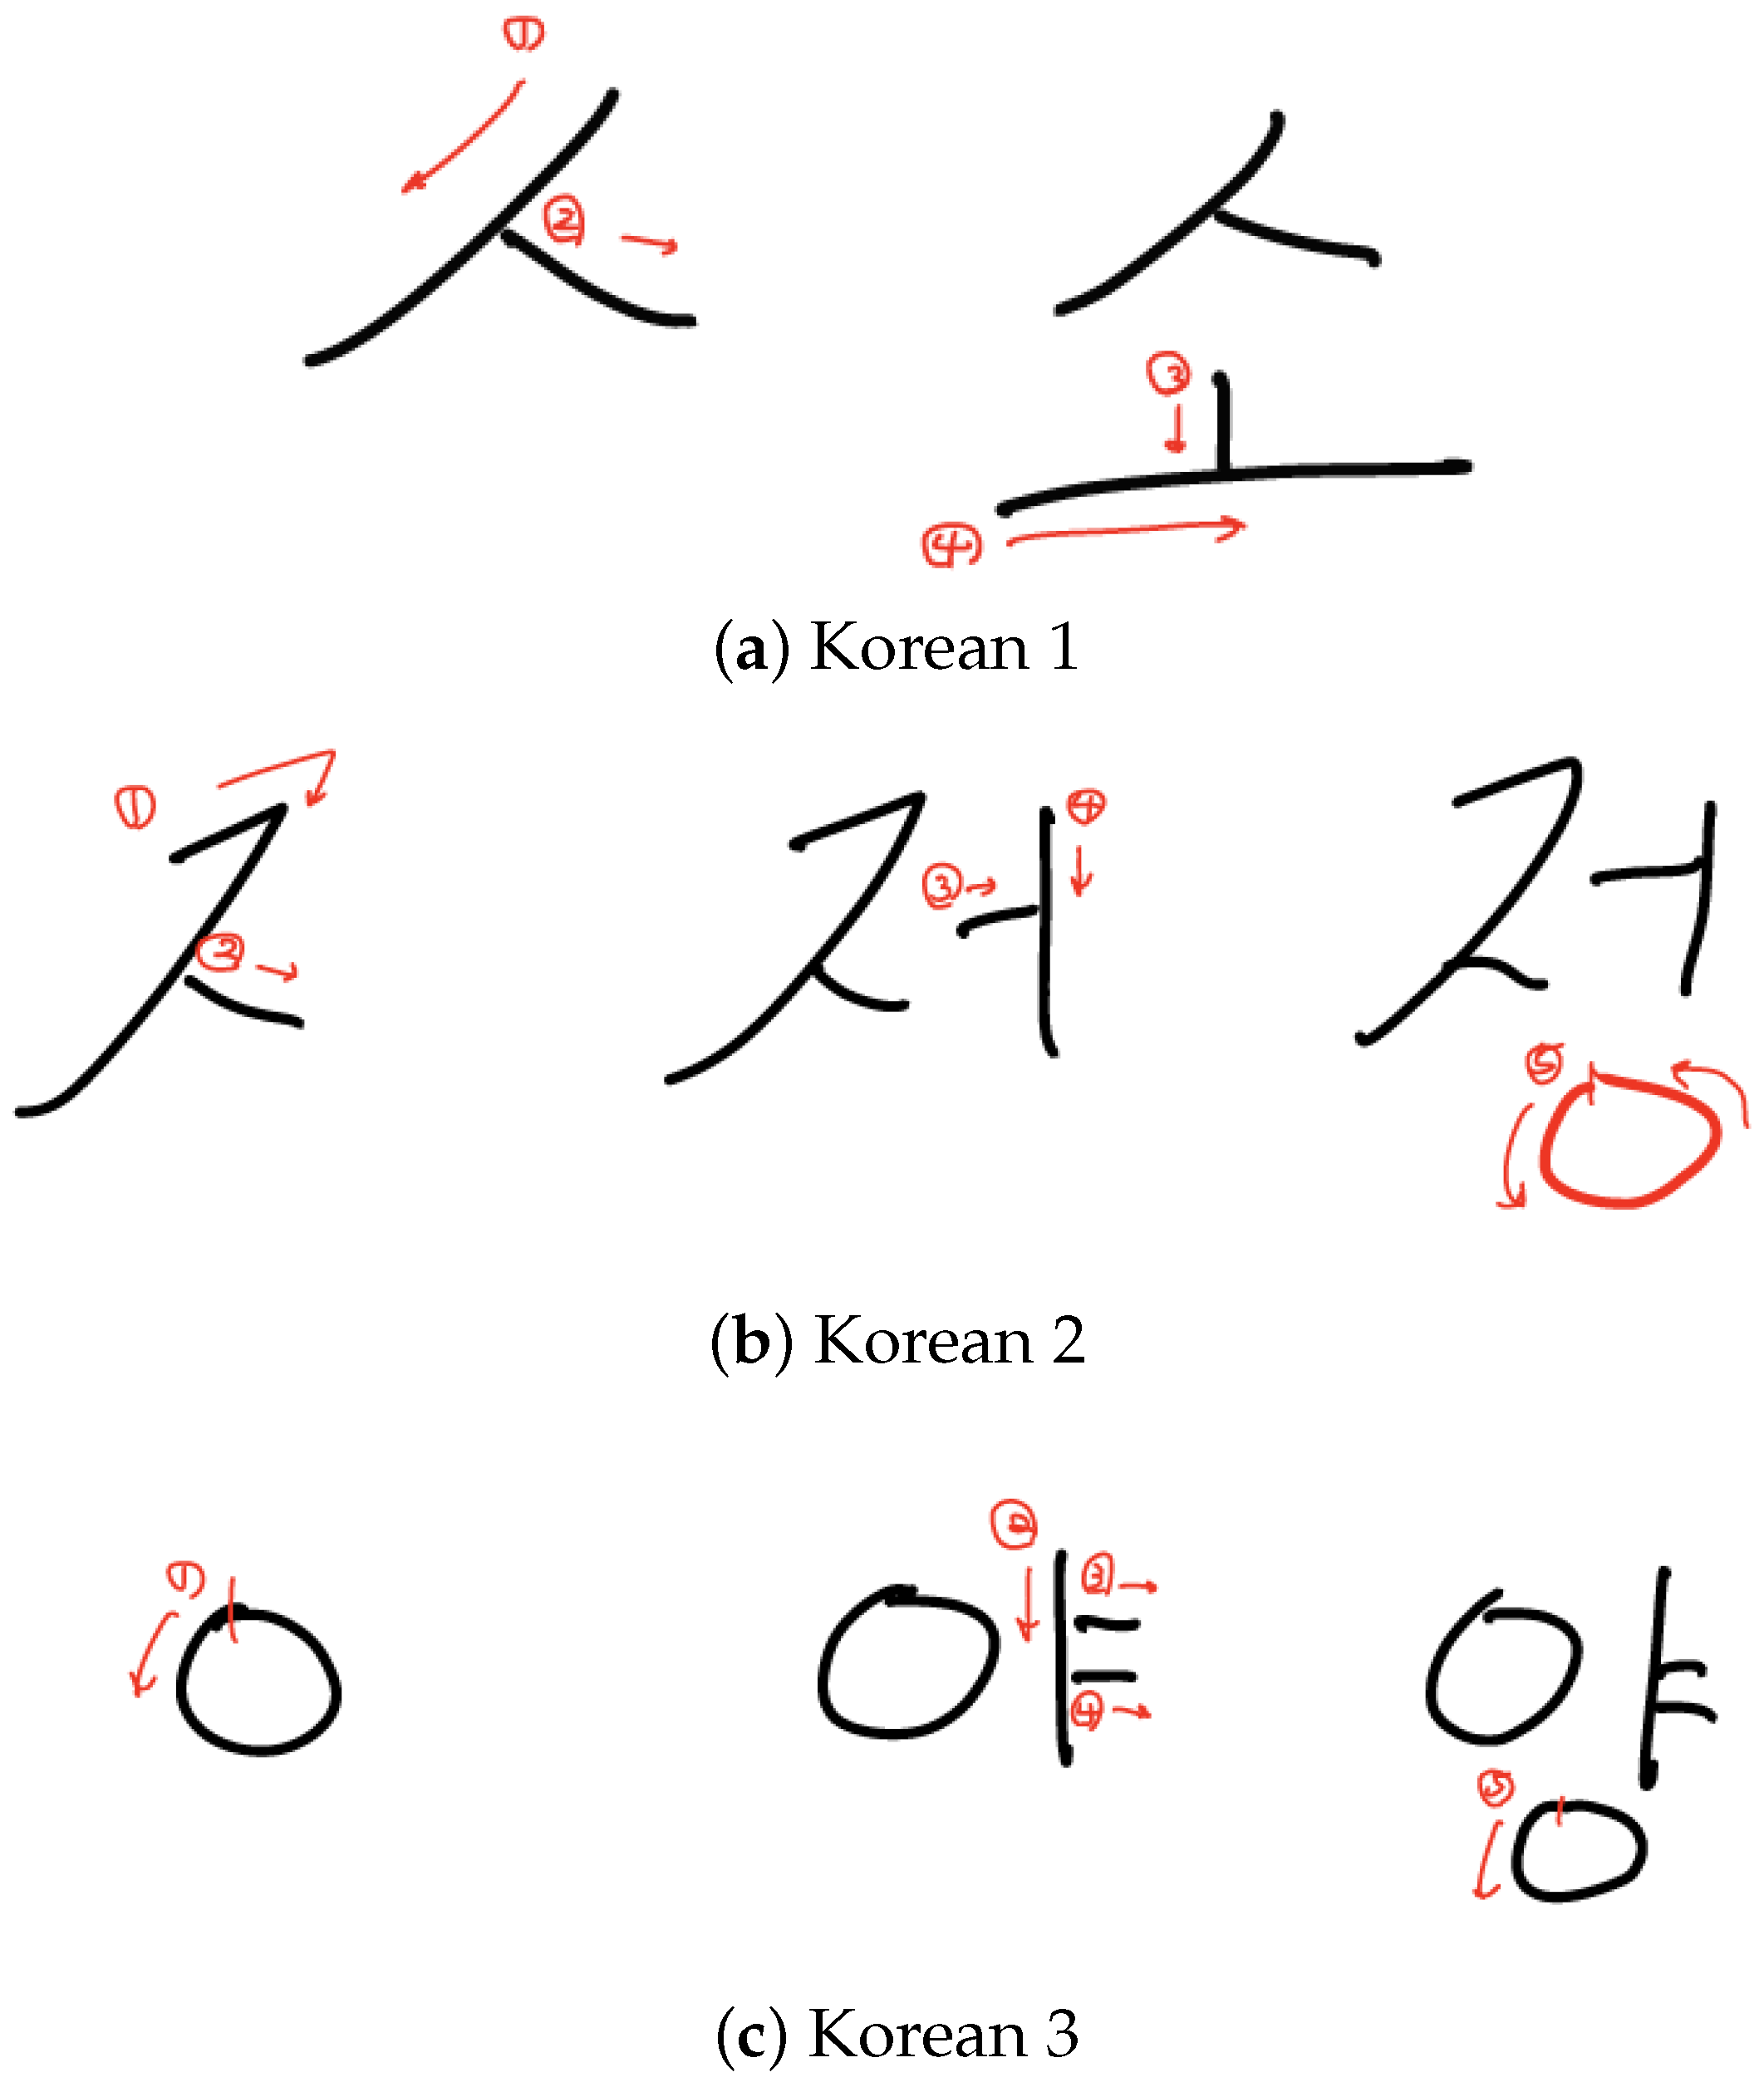
| Korean | 3 |
| Name | Description |
|---|---|
| Absolute time (Unit: ns) at time t | |
| Touch state at time t {D (Down), M (Move), U (Up)} | |
| Coordinate of x-axis at time t | |
| Coordinate of y-axis at time t | |
| Angular velocity of x-axis at time t | |
| Angular velocity of y-axis at time t | |
| Angular velocity of z-axis at time t |
| Timestamp | X | Y | ||||
|---|---|---|---|---|---|---|
| 0 | D | 55.12 | 65.48 | −0.25 | −0.21 | −0.01 |
| 10 | M | 67.15 | 63.58 | −0.63 | 0.06 | 0.02 |
| 20 | M | 83.11 | 63.58 | −0.16 | −0.06 | −0.02 |
| 30 | M | 95.54 | 65.48 | 0.18 | −0.21 | −0.01 |
| 40 | M | 115.6 | 66.12 | −0.14 | 0.08 | 0.02 |
| 50 | M | 128.4 | 67.25 | −0.16 | −0.05 | −0.02 |
| 56 | U | 130.4 | 69.25 | 0.18 | −0.10 | −0.01 |
| 10 | D | 55.12 | 65.48 | −0.25 | −0.21 | −0.01 | M | 67.15 | 63.58 | −0.63 | 0.06 | 0.02 |
| 10 | M | 67.15 | 63.58 | −0.63 | 0.06 | 0.02 | M | 83.11 | 63.58 | −0.16 | −0.06 | −0.02 |
| 10 | M | 83.11 | 63.58 | −0.16 | −0.06 | −0.02 | M | 95.54 | 65.48 | 0.18 | −0.21 | −0.01 |
| 10 | M | 95.54 | 65.48 | 0.18 | −0.21 | −0.01 | M | 115.6 | 66.12 | −0.14 | 0.08 | 0.02 |
| 10 | M | 115.6 | 66.12 | −0.14 | 0.08 | 0.02 | M | 128.4 | 67.25 | −0.16 | −0.05 | −0.02 |
| 6 | M | 128.4 | 67.25 | −0.16 | −0.05 | −0.02 | U | 130.4 | 69.25 | 0.18 | −0.10 | −0.01 |
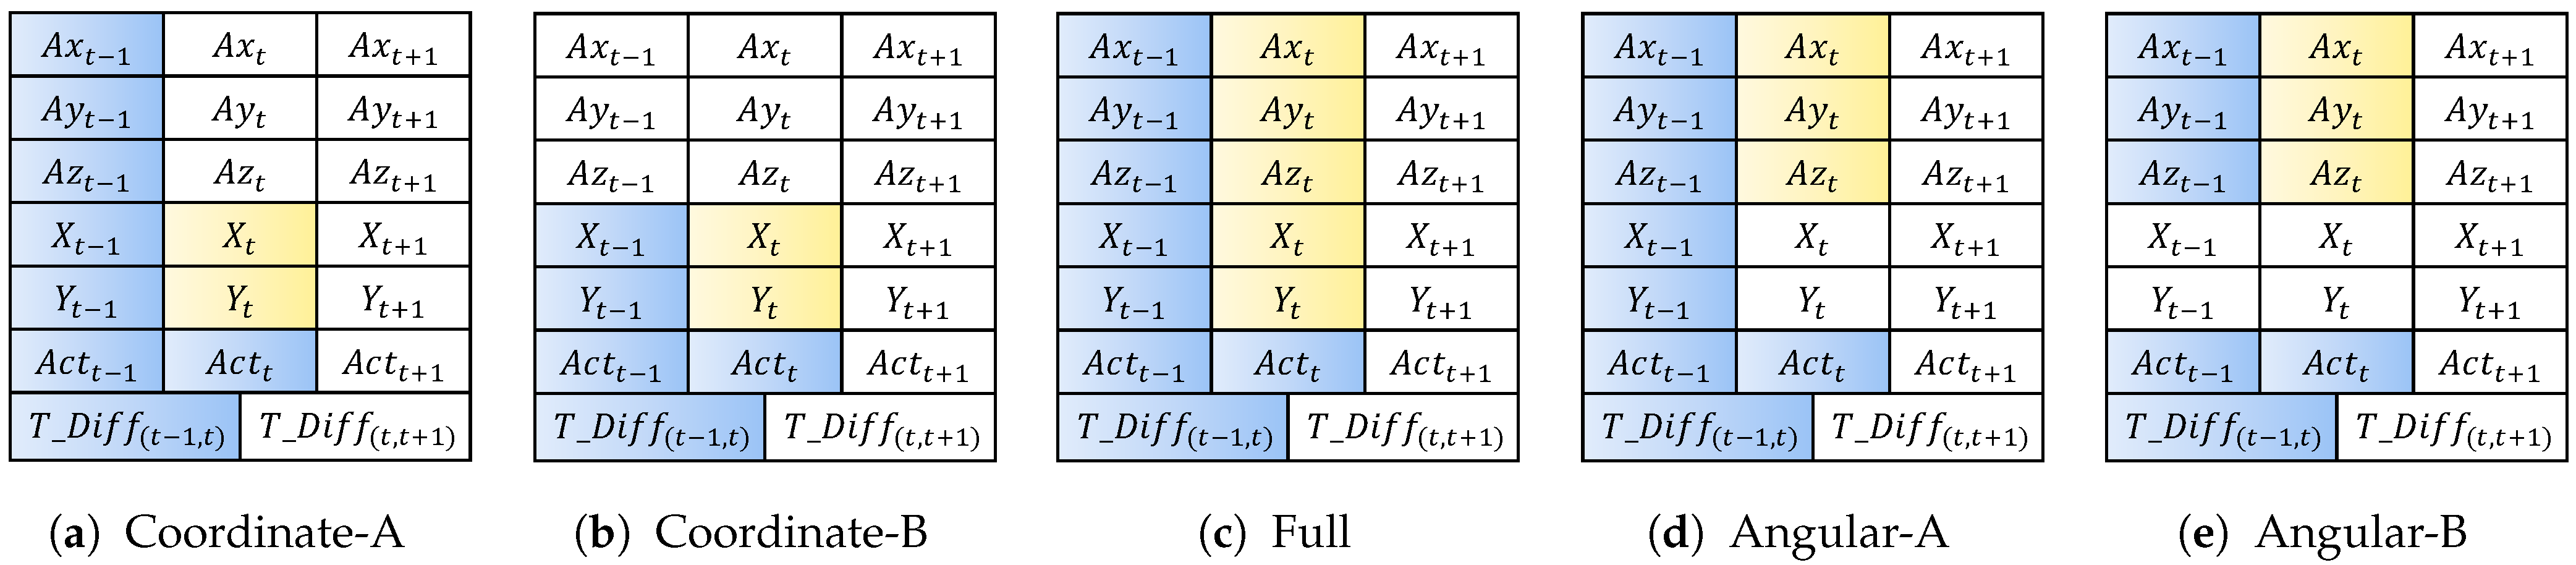
| No | Name | Input | Output |
|---|---|---|---|
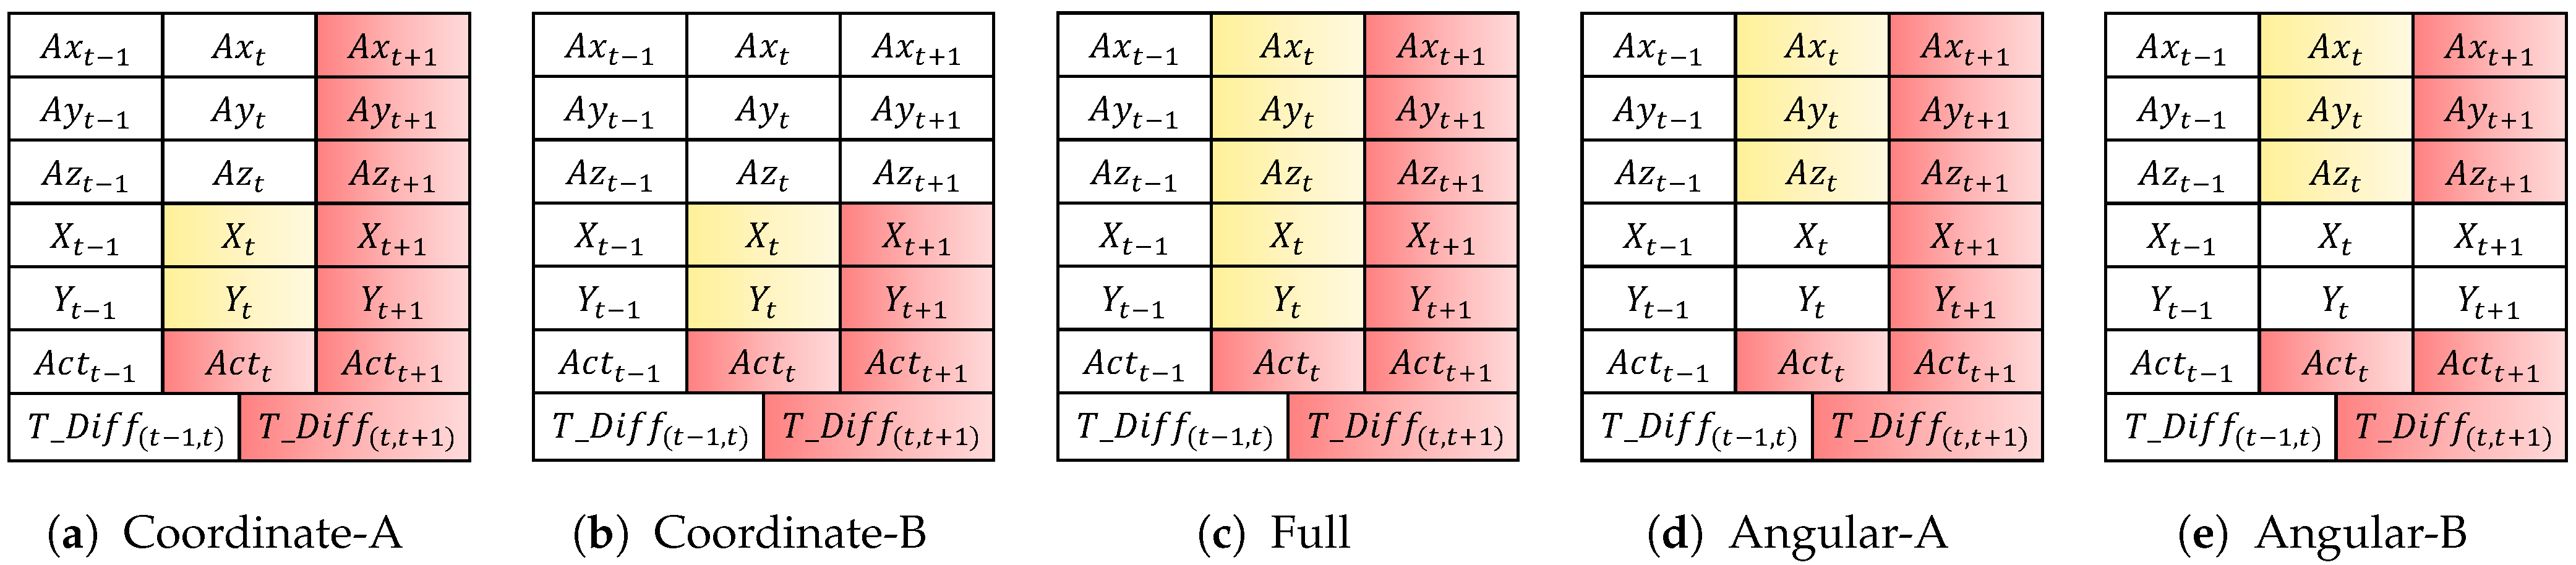
| 1 | Coordinate-A | , X, Y, , , , | X, Y |
| 2 | Coordinate-B | , X, Y, | X, Y |
| 3 | Full | , X, Y, , , , | X, Y, , , |
| 4 | Angular-A | , , , , | , , |
| 5 | Angular-B | , , , , | , , |
| Pattern Name | Stroke Count | Avg. Sequence of Training Set | Std. of Training Set | Avg. Sequence of Test Set | Std. of Test Set | p-Value |
|---|---|---|---|---|---|---|
| English 1 | 4 | 59.63 | 11.37 | 59.52 | 11.88 | 0.88 |
| English 2 | 4 | 75.94 | 13.12 | 75.98 | 13.33 | 0.96 |
| English 3 | 5 | 61.27 | 10.43 | 61.16 | 10.36 | 0.87 |
| English 4 | 4 | 69.65 | 10.51 | 69.38 | 10.29 | 0.68 |
| English 5 | 4 | 69.19 | 11.83 | 69.01 | 12.21 | 0.81 |
| Freestyle 1 | 4 | 82.54 | 16.88 | 82.78 | 17.23 | 0.82 |
| Freestyle 2 | 2 | 52.88 | 13.47 | 52.85 | 13.31 | 0.98 |
| Freestyle 3 | 5 | 92.58 | 21.47 | 92.68 | 21.00 | 0.94 |
| Freestyle 4 | 2 | 67.78 | 14.46 | 67.77 | 14.75 | 0.99 |
| Freestyle 5 | 6 | 124.70 | 25.87 | 124.69 | 26.24 | 1.00 |
| Korean 1 | 4 | 41.47 | 6.99 | 41.34 | 6.97 | 0.78 |
| Korean 2 | 5 | 70.23 | 14.16 | 70.22 | 14.03 | 1.00 |
| Korean 3 | 5 | 60.90 | 10.00 | 61.03 | 10.24 | 0.84 |
| Forward | Backward |
|---|---|
| 1D Conv3 20 (d = 1) | 1D Conv3 20 (d = 1) |
| 1D Conv3 20 (d = 1) | 1D Conv3 20 (d = 1) |
| 1D Conv3 20 (d = 2) | 1D Conv3 20 (d = 2) |
| 1D Conv3 20 (d = 4) | 1D Conv3 20 (d = 4) |
| Concatenate | |
| FC-64 | |
| FC- | |
| Method | Coordinate-A | Coordinate-B | Full | Angular-A | Angular-B |
|---|---|---|---|---|---|
| 12 | 9 | 12 | 12 | 10 | |
| 2 | 2 | 5 | 3 | 3 | |
| Total | 16,674 | 16,314 | 16,869 | 16,739 | 16,499 |
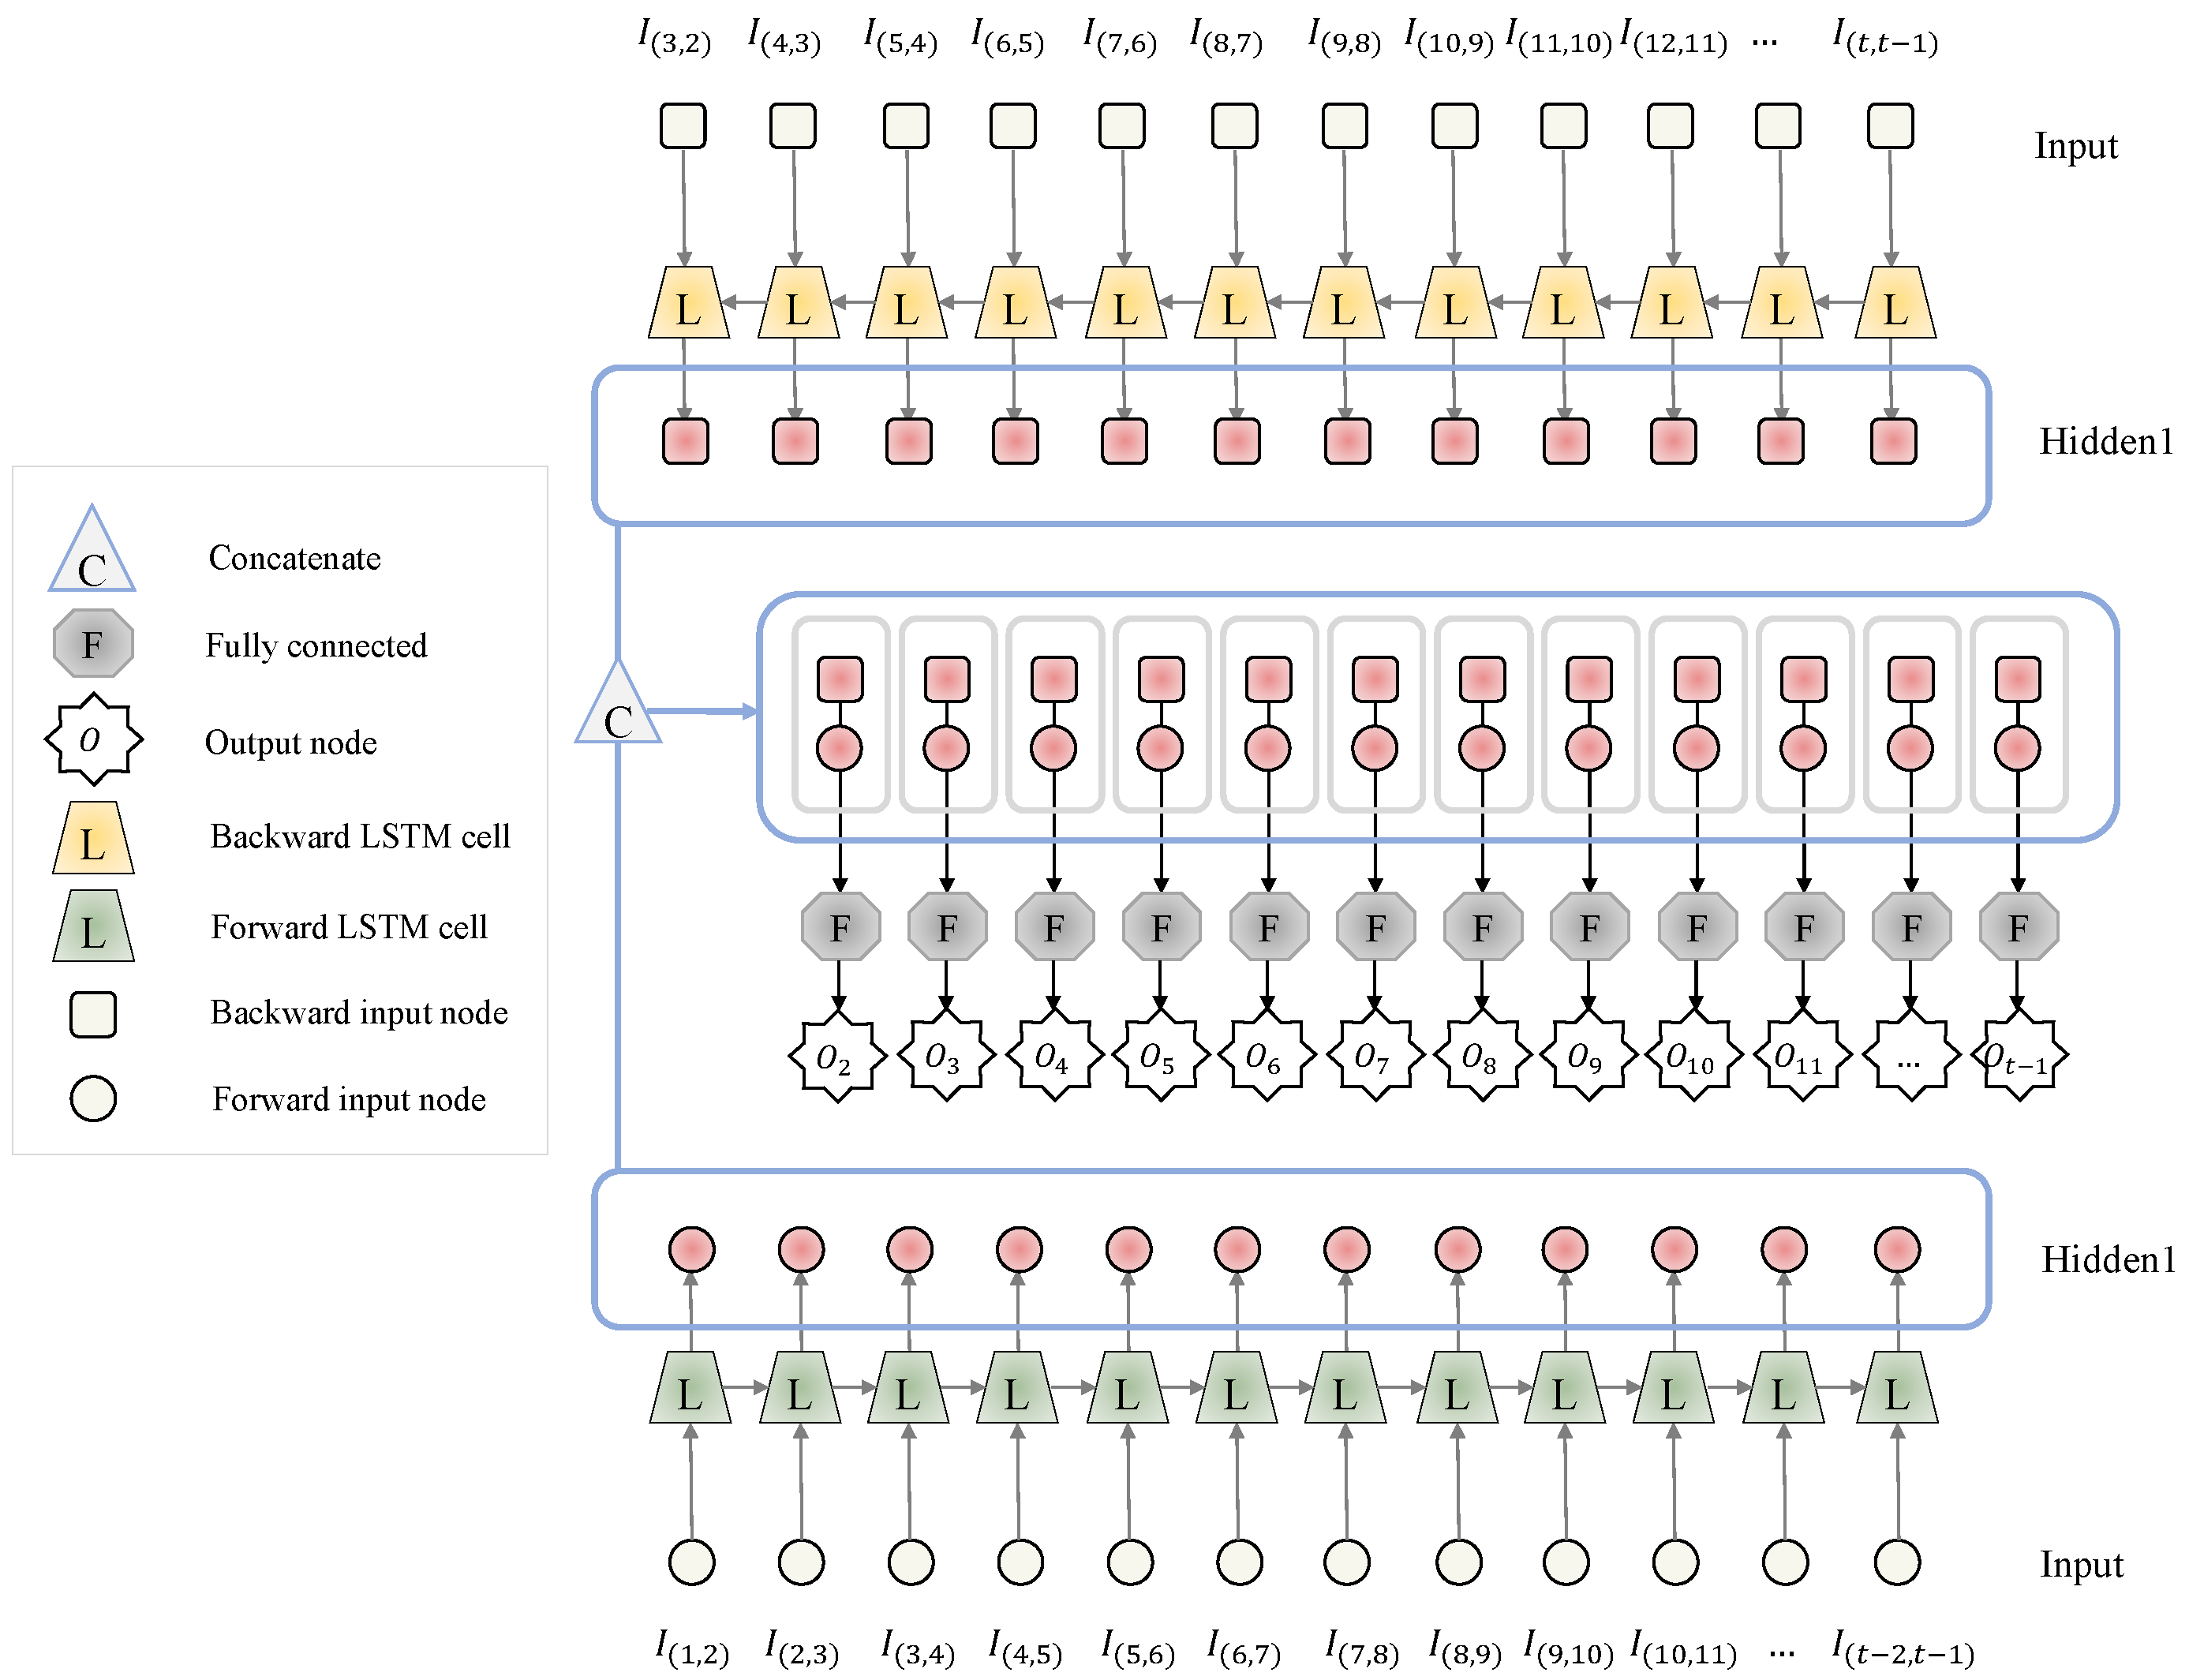
| Forward | Backward |
|---|---|
| LSTM-33 | LSTM-33 |
| Concatenate | |
| FC-64 | |
| FC- | |
| Method | Coordinate-A | Coordinate-B | Full | Angular-A | Angular-B |
|---|---|---|---|---|---|
| 12 | 9 | 12 | 12 | 10 | |
| 2 | 2 | 5 | 3 | 3 | |
| Total | 16,434 | 15,642 | 16,629 | 16,499 | 15,971 |
| Loss | Batch Size | Learning Rate | Optimization Method | Initialization Method | Number of Iterations |
|---|---|---|---|---|---|
| Huber loss | 10 | – | RMSProp | He | 300 |
| Model | Feature | E1 | E2 | E3 | E4 | E5 | F1 | F2 | F3 | F4 | F5 | K1 | K2 | K3 |
|---|---|---|---|---|---|---|---|---|---|---|---|---|---|---|
| TCN | Coordinate-A | 0.997 (0.008) | 0.997 (0.007) | 0.997 (0.006) | 0.990 (0.021) | 0.995 (0.02) | 0.989 (0.025) | 0.989 (0.022) | 0.997 (0.007) | 0.992 (0.015) | 0.992 (0.018) | 0.990 (0.017) | 0.996 (0.011) | 0.993 (0.015) |
| TCN | Coordinate-B | 0.985 (0.028) | 0.990 (0.017) | 0.986 (0.022) | 0.976 (0.036) | 0.988 (0.025) | 0.979 (0.035) | 0.978 (0.030) | 0.989 (0.019) | 0.981 (0.024) | 0.976 (0.040) | 0.978 (0.033) | 0.980 (0.032) | 0.984 (0.028) |
| TCN | Full | 0.995 (0.015) | 0.990 (0.020) | 0.991 (0.022) | 0.988 (0.023) | 0.991 (0.021) | 0.984 (0.025) | 0.983 (0.030) | 0.982 (0.036) | 0.980 (0.039) | 0.972 (0.044) | 0.986 (0.030) | 0.994 (0.015) | 0.994 (0.013) |
| TCN | Angular-A | 0.983 (0.037) | 0.965 (0.082) | 0.981 (0.041) | 0.968 (0.066) | 0.957 (0.094) | 0.961 (0.066) | 0.967 (0.050) | 0.957 (0.083) | 0.964 (0.064) | 0.941 (0.112) | 0.965 (0.103) | 0.981 (0.044) | 0.988 (0.021) |
| TCN | Angular-B | 0.947 (0.111) | 0.938 (0.143) | 0.950 (0.089) | 0.940 (0.103) | 0.929 (0.147) | 0.925 (0.141) | 0.925 (0.143) | 0.934 (0.100) | 0.942 (0.112) | 0.919 (0.144) | 0.951 (0.116) | 0.960 (0.124) | 0.961 (0.114) |
| Model | Feature | E1 | E2 | E3 | E4 | E5 | F1 | F2 | F3 | F4 | F5 | K1 | K2 | K3 |
|---|---|---|---|---|---|---|---|---|---|---|---|---|---|---|
| RNN | Coordinate-A | 0.998 (0.005) | 0.994 (0.013) | 0.996 (0.010) | 0.987 (0.022) | 0.993 (0.019) | 0.992 (0.011) | 0.988 (0.024) | 0.992 (0.012) | 0.986 (0.027) | 0.990 (0.014) | 0.990 (0.022) | 0.996 (0.009) | 0.990 (0.020) |
| RNN | Coordinate-B | 0.977 (0.034) | 0.982 (0.025) | 0.977 (0.029) | 0.970 (0.036) | 0.978 (0.039) | 0.972 (0.027) | 0.971 (0.034) | 0.978 (0.025) | 0.963 (0.039) | 0.958 (0.049) | 0.963 (0.044) | 0.968 (0.035) | 0.975 (0.034) |
| RNN | Full | 0.988 (0.026) | 0.982 (0.030) | 0.986 (0.028) | 0.980 (0.034) | 0.974 (0.054) | 0.967 (0.047) | 0.959 (0.070) | 0.972 (0.040) | 0.966 (0.052) | 0.960 (0.055) | 0.980 (0.040) | 0.990 (0.023) | 0.990 (0.018) |
| RNN | Angular-A | 0.981 (0.041) | 0.956 (0.090) | 0.980 (0.037) | 0.960 (0.065) | 0.951 (0.093) | 0.943 (0.083) | 0.946 (0.091) | 0.956 (0.063) | 0.946 (0.087) | 0.941 (0.076) | 0.974 (0.049) | 0.974 (0.050) | 0.982 (0.036) |
| RNN | Angular-B | 0.956 (0.087) | 0.934 (0.139) | 0.949 (0.083) | 0.938 (0.077) | 0.915 (0.155) | 0.919 (0.111) | 0.901 (0.163) | 0.934 (0.063) | 0.910 (0.133) | 0.896 (0.111) | 0.941 (0.135) | 0.952 (0.130) | 0.961 (0.091) |
| Feature | E1 | E2 | E3 | E4 | E5 | F1 | F2 | F3 | F4 | F5 | K1 | K2 | K3 |
|---|---|---|---|---|---|---|---|---|---|---|---|---|---|
| Coordinate-A | 0.60 | 0.03 | 0.23 | 0.22 | 0.07 | 0.80 | 0.39 | 0.00 | 0.05 | 0.30 | 0.46 | 0.59 | 0.07 |
| Coordinate-B | 0.00 | 0.00 | 0.00 | 0.05 | 0.00 | 0.06 | 0.01 | 0.00 | 0.00 | 0.00 | 0.00 | 0.00 | 0.02 |
| Full | 0.01 | 0.00 | 0.00 | 0.00 | 0.01 | 0.00 | 0.00 | 0.00 | 0.00 | 0.02 | 0.01 | 0.01 | 0.01 |
| Angular-A | 0.20 | 0.01 | 0.44 | 0.04 | 0.14 | 0.00 | 0.01 | 0.47 | 0.02 | 0.49 | 0.77 | 0.09 | 0.07 |
| Angular-B | 0.87 | 0.21 | 0.48 | 0.43 | 0.02 | 0.29 | 0.00 | 0.49 | 0.00 | 0.10 | 0.00 | 0.00 | 0.52 |
| E1 | E2 | E3 | E4 | E5 | F1 | F2 | F3 | F4 | F5 | K1 | K2 | K3 | |
|---|---|---|---|---|---|---|---|---|---|---|---|---|---|
| Sequence length | 59.63 | 75.94 | 61.27 | 69.65 | 69.19 | 82.54 | 52.88 | 92.58 | 67.78 | 124.70 | 41.47 | 70.23 | 60.90 |
| TCN | 4.58 | 4.57 | 4.58 | 4.66 | 4.57 | 4.62 | 4.55 | 4.66 | 4.61 | 4.61 | 4.55 | 4.69 | 4.54 |
| RNN | 30.10 | 36.70 | 30.44 | 33.99 | 32.80 | 37.35 | 25.72 | 40.71 | 31.07 | 54.88 | 21.19 | 31.46 | 28.30 |
| Time ratio RNN over TCN | 6.58 | 8.03 | 6.65 | 7.29 | 7.18 | 8.08 | 5.65 | 8.73 | 6.73 | 11.89 | 4.66 | 6.71 | 6.23 |
| E1 | E2 | E3 | E4 | E5 | F1 | F2 | F3 | F4 | F5 | K1 | K2 | K3 | |
|---|---|---|---|---|---|---|---|---|---|---|---|---|---|
| Sequence length | 59.52 | 75.98 | 61.16 | 69.38 | 69.01 | 82.78 | 52.85 | 92.68 | 67.77 | 124.69 | 41.34 | 70.22 | 61.03 |
| TCN | 7.46 | 7.92 | 7.01 | 7.16 | 7.35 | 8.51 | 7.56 | 6.56 | 6.76 | 7.28 | 7.11 | 7.46 | 7.50 |
| RNN | 53.87 | 72.80 | 57.92 | 63.31 | 56.20 | 64.73 | 46.81 | 64.26 | 59.61 | 92.18 | 37.33 | 52.17 | 50.20 |
| Time ratio RNN over TCN | 7.23 | 9.19 | 8.27 | 8.84 | 7.64 | 7.61 | 6.19 | 9.80 | 8.82 | 12.66 | 5.25 | 7.00 | 6.69 |
| Valid Index | E1 | E2 | E3 | E4 | E5 | F1 | F2 | F3 | F4 | F5 | K1 | K2 | K3 | AVG |
|---|---|---|---|---|---|---|---|---|---|---|---|---|---|---|
| FAR | 0.81 | 0.76 | 2.02 | 0.93 | 1.15 | 1.73 | 1.86 | 1.08 | 2.38 | 1.22 | 2.77 | 0.93 | 0.67 | 1.41 |
| FRR | 0.50 | 0.75 | 0.50 | 2.25 | 0.75 | 1.25 | 2.25 | 0.75 | 1.00 | 1.75 | 1.75 | 0.75 | 1.75 | 1.23 |
| AVG | 0.66 | 0.76 | 1.26 | 1.59 | 0.95 | 1.49 | 2.06 | 0.92 | 1.69 | 1.49 | 2.26 | 0.84 | 1.21 | 1.32 |
Publisher’s Note: MDPI stays neutral with regard to jurisdictional claims in published maps and institutional affiliations. |
© 2022 by the authors. Licensee MDPI, Basel, Switzerland. This article is an open access article distributed under the terms and conditions of the Creative Commons Attribution (CC BY) license (https://creativecommons.org/licenses/by/4.0/).
Share and Cite
Kim, J.; Kang, P. Draw-a-Deep Pattern: Drawing Pattern-Based Smartphone User Authentication Based on Temporal Convolutional Neural Network. Appl. Sci. 2022, 12, 7590. https://doi.org/10.3390/app12157590
Kim J, Kang P. Draw-a-Deep Pattern: Drawing Pattern-Based Smartphone User Authentication Based on Temporal Convolutional Neural Network. Applied Sciences. 2022; 12(15):7590. https://doi.org/10.3390/app12157590
Chicago/Turabian StyleKim, Junhong, and Pilsung Kang. 2022. "Draw-a-Deep Pattern: Drawing Pattern-Based Smartphone User Authentication Based on Temporal Convolutional Neural Network" Applied Sciences 12, no. 15: 7590. https://doi.org/10.3390/app12157590
APA StyleKim, J., & Kang, P. (2022). Draw-a-Deep Pattern: Drawing Pattern-Based Smartphone User Authentication Based on Temporal Convolutional Neural Network. Applied Sciences, 12(15), 7590. https://doi.org/10.3390/app12157590