
A Long-Range Internet of Things-Based Advanced Vehicle Pollution Monitoring System with Node Authentication and Blockchain

 , , ,
, , ,  , ,
, , 
Abstract
:1. Introduction
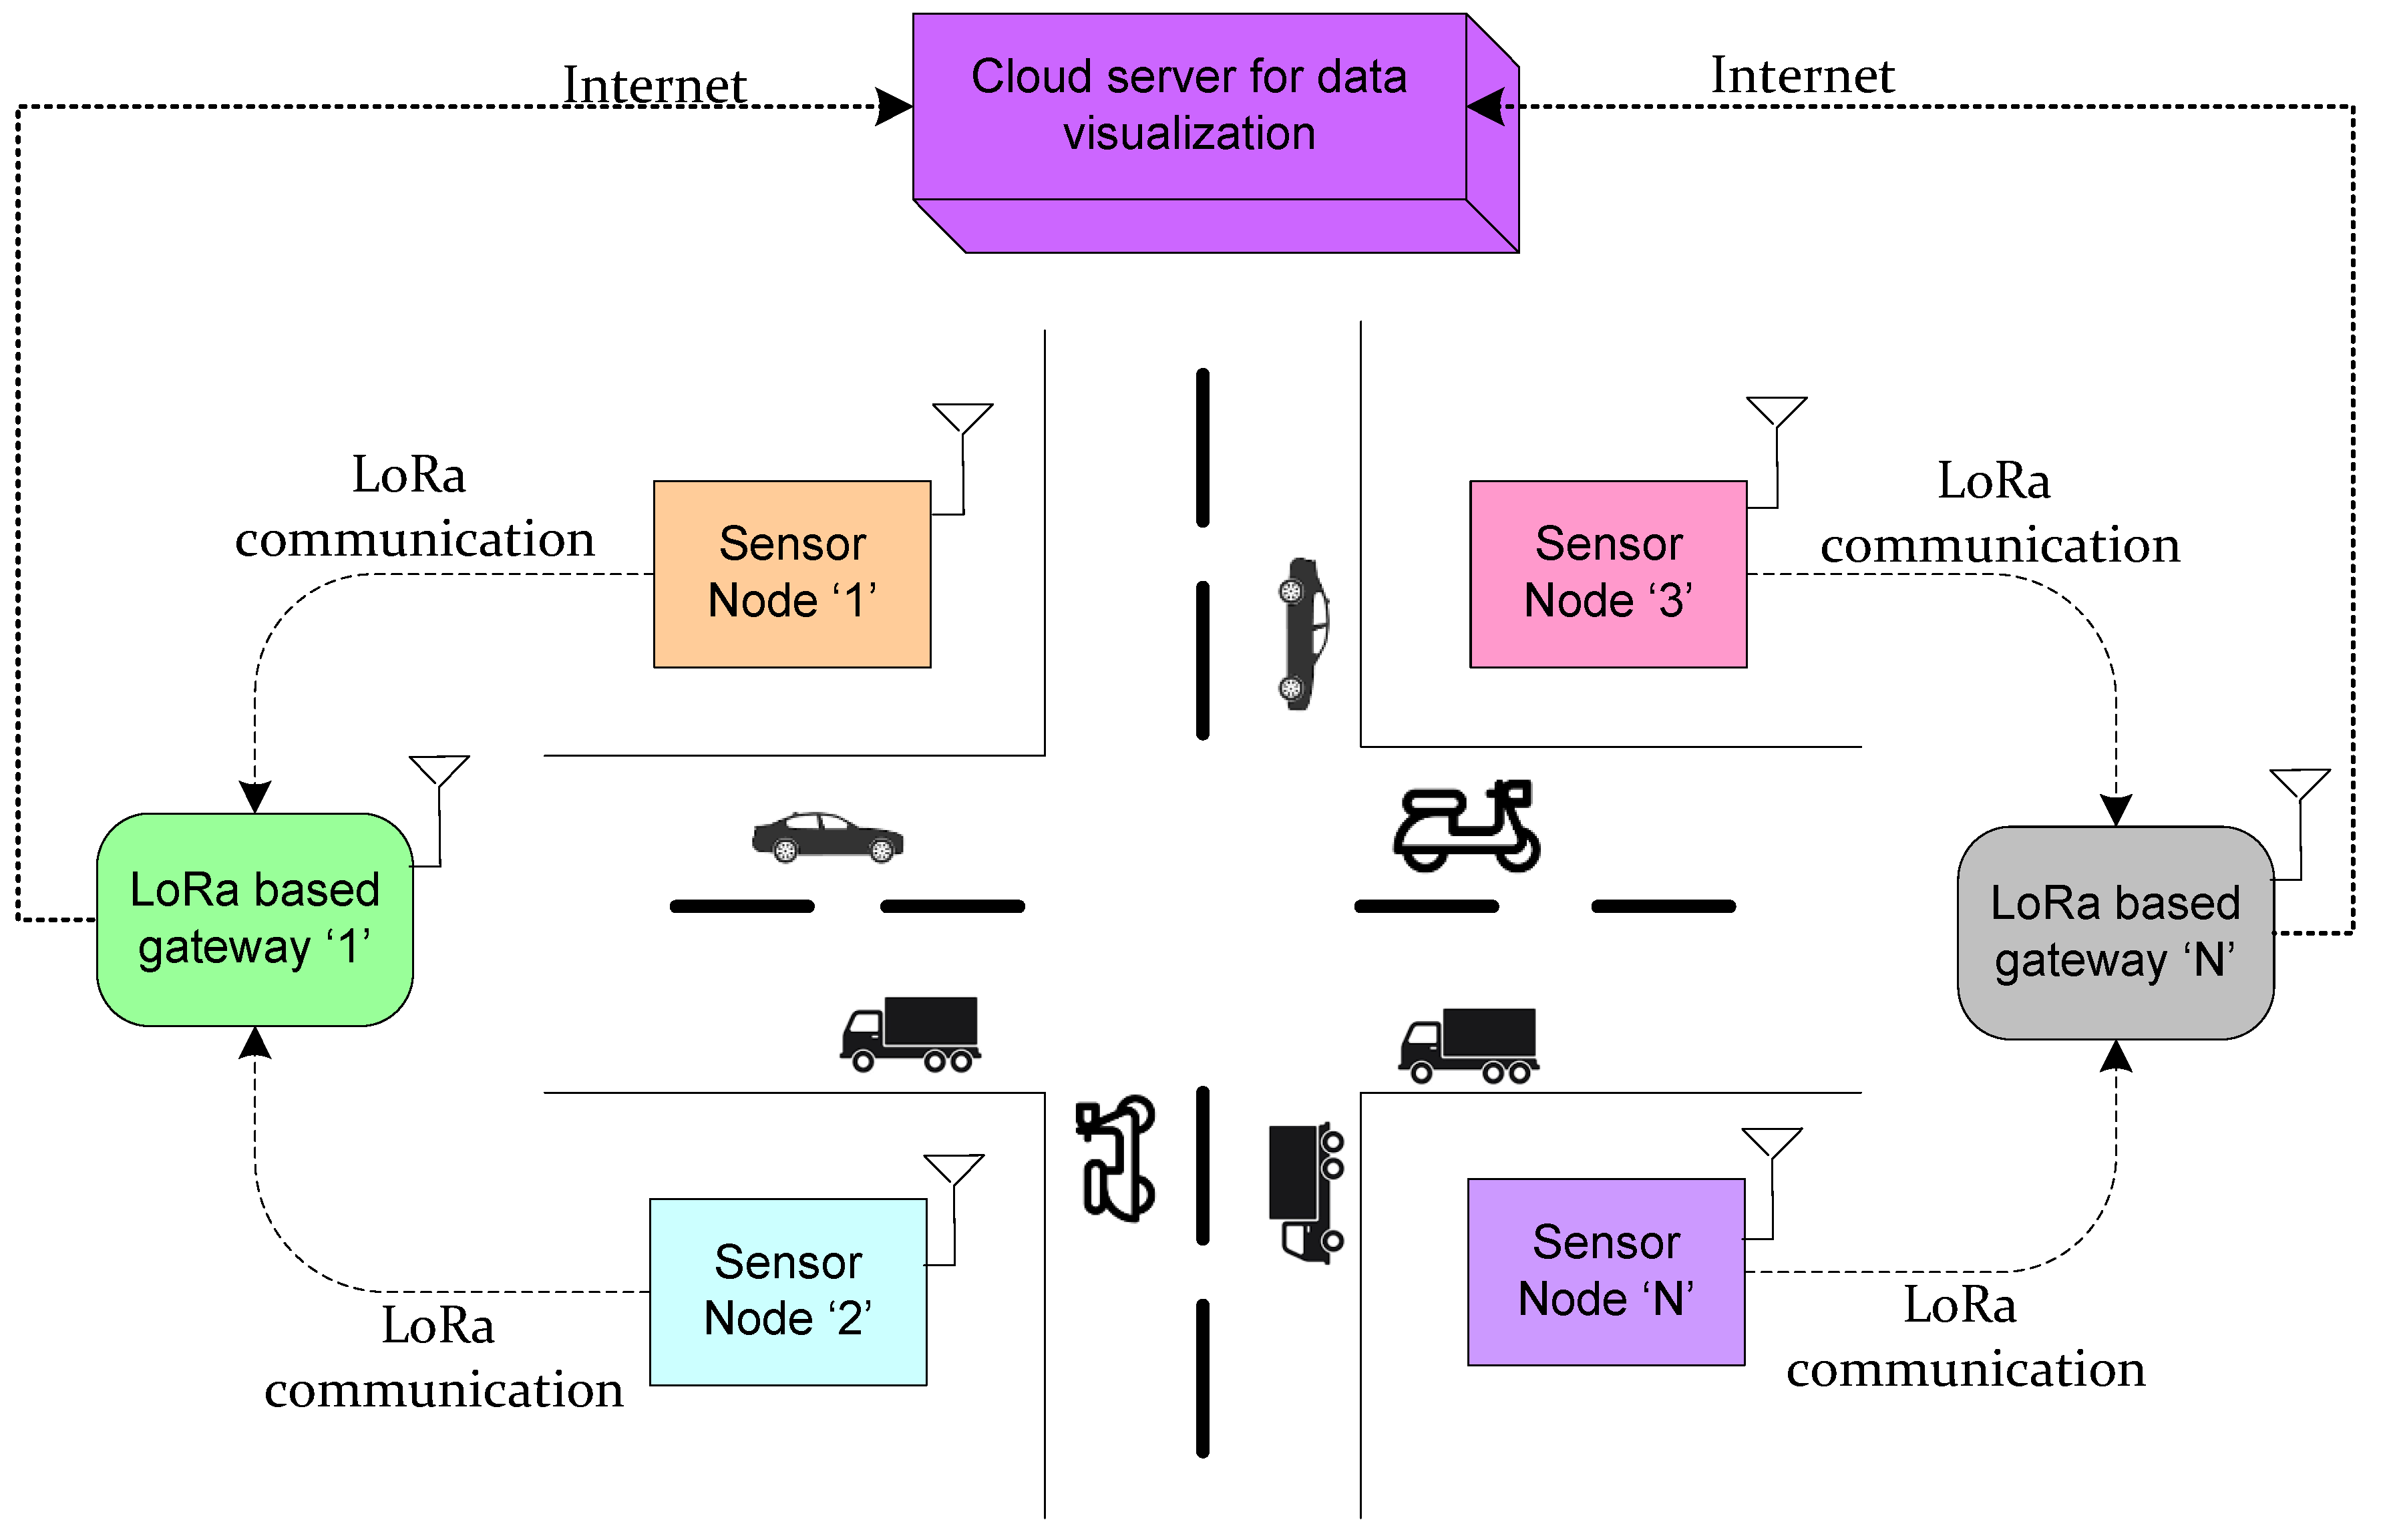
- Long range communication and Internet of Things-based architecture is proposed for real-time monitoring of vehicular pollution.
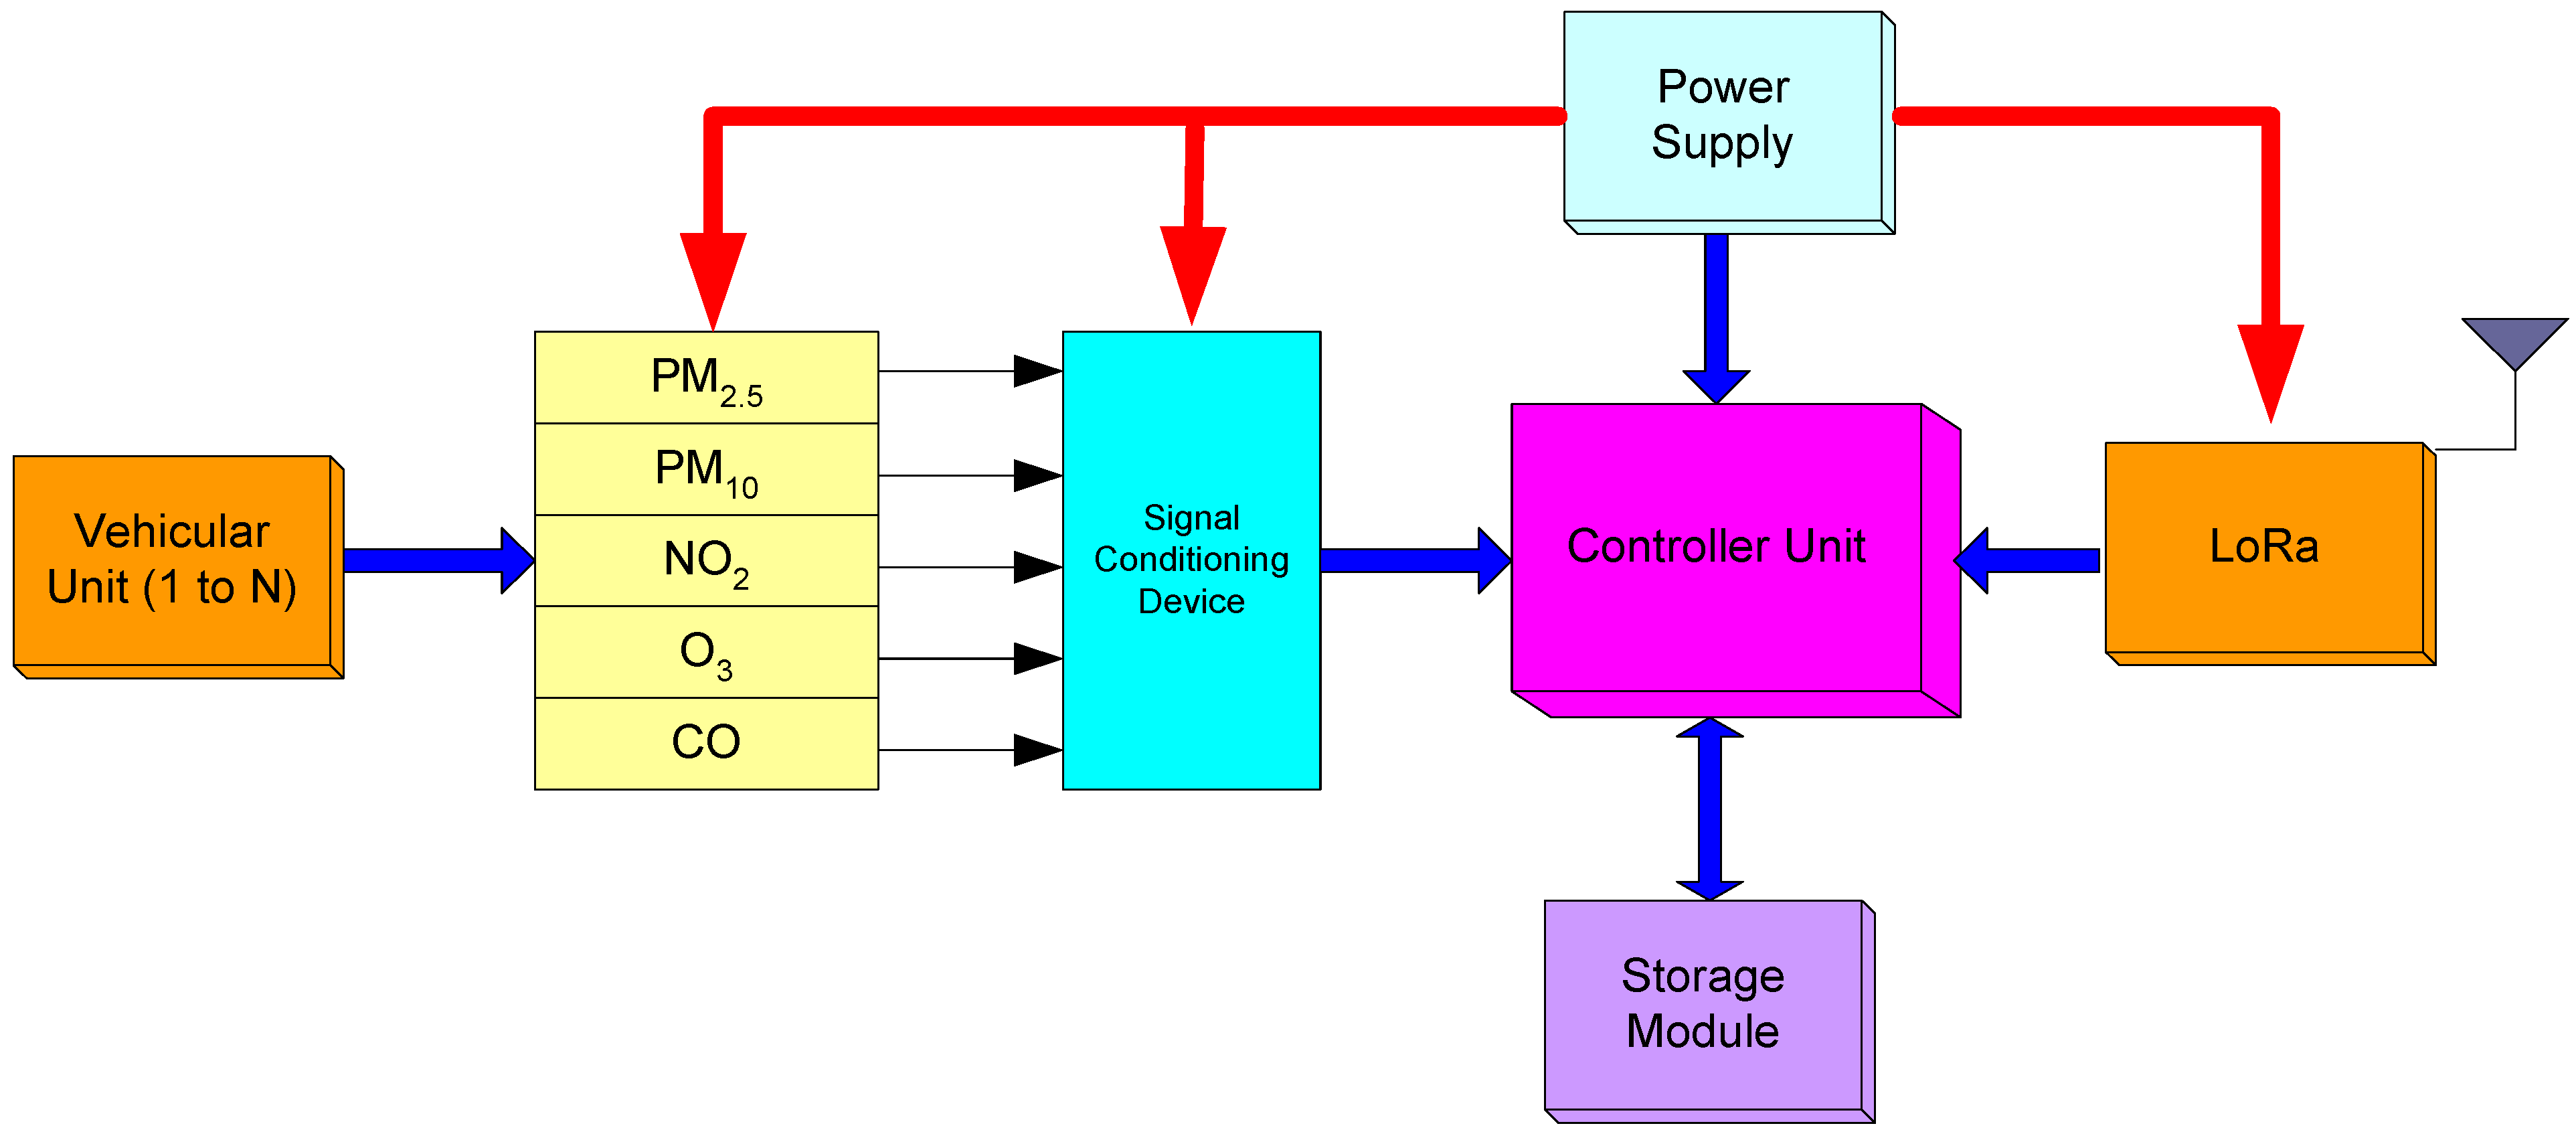
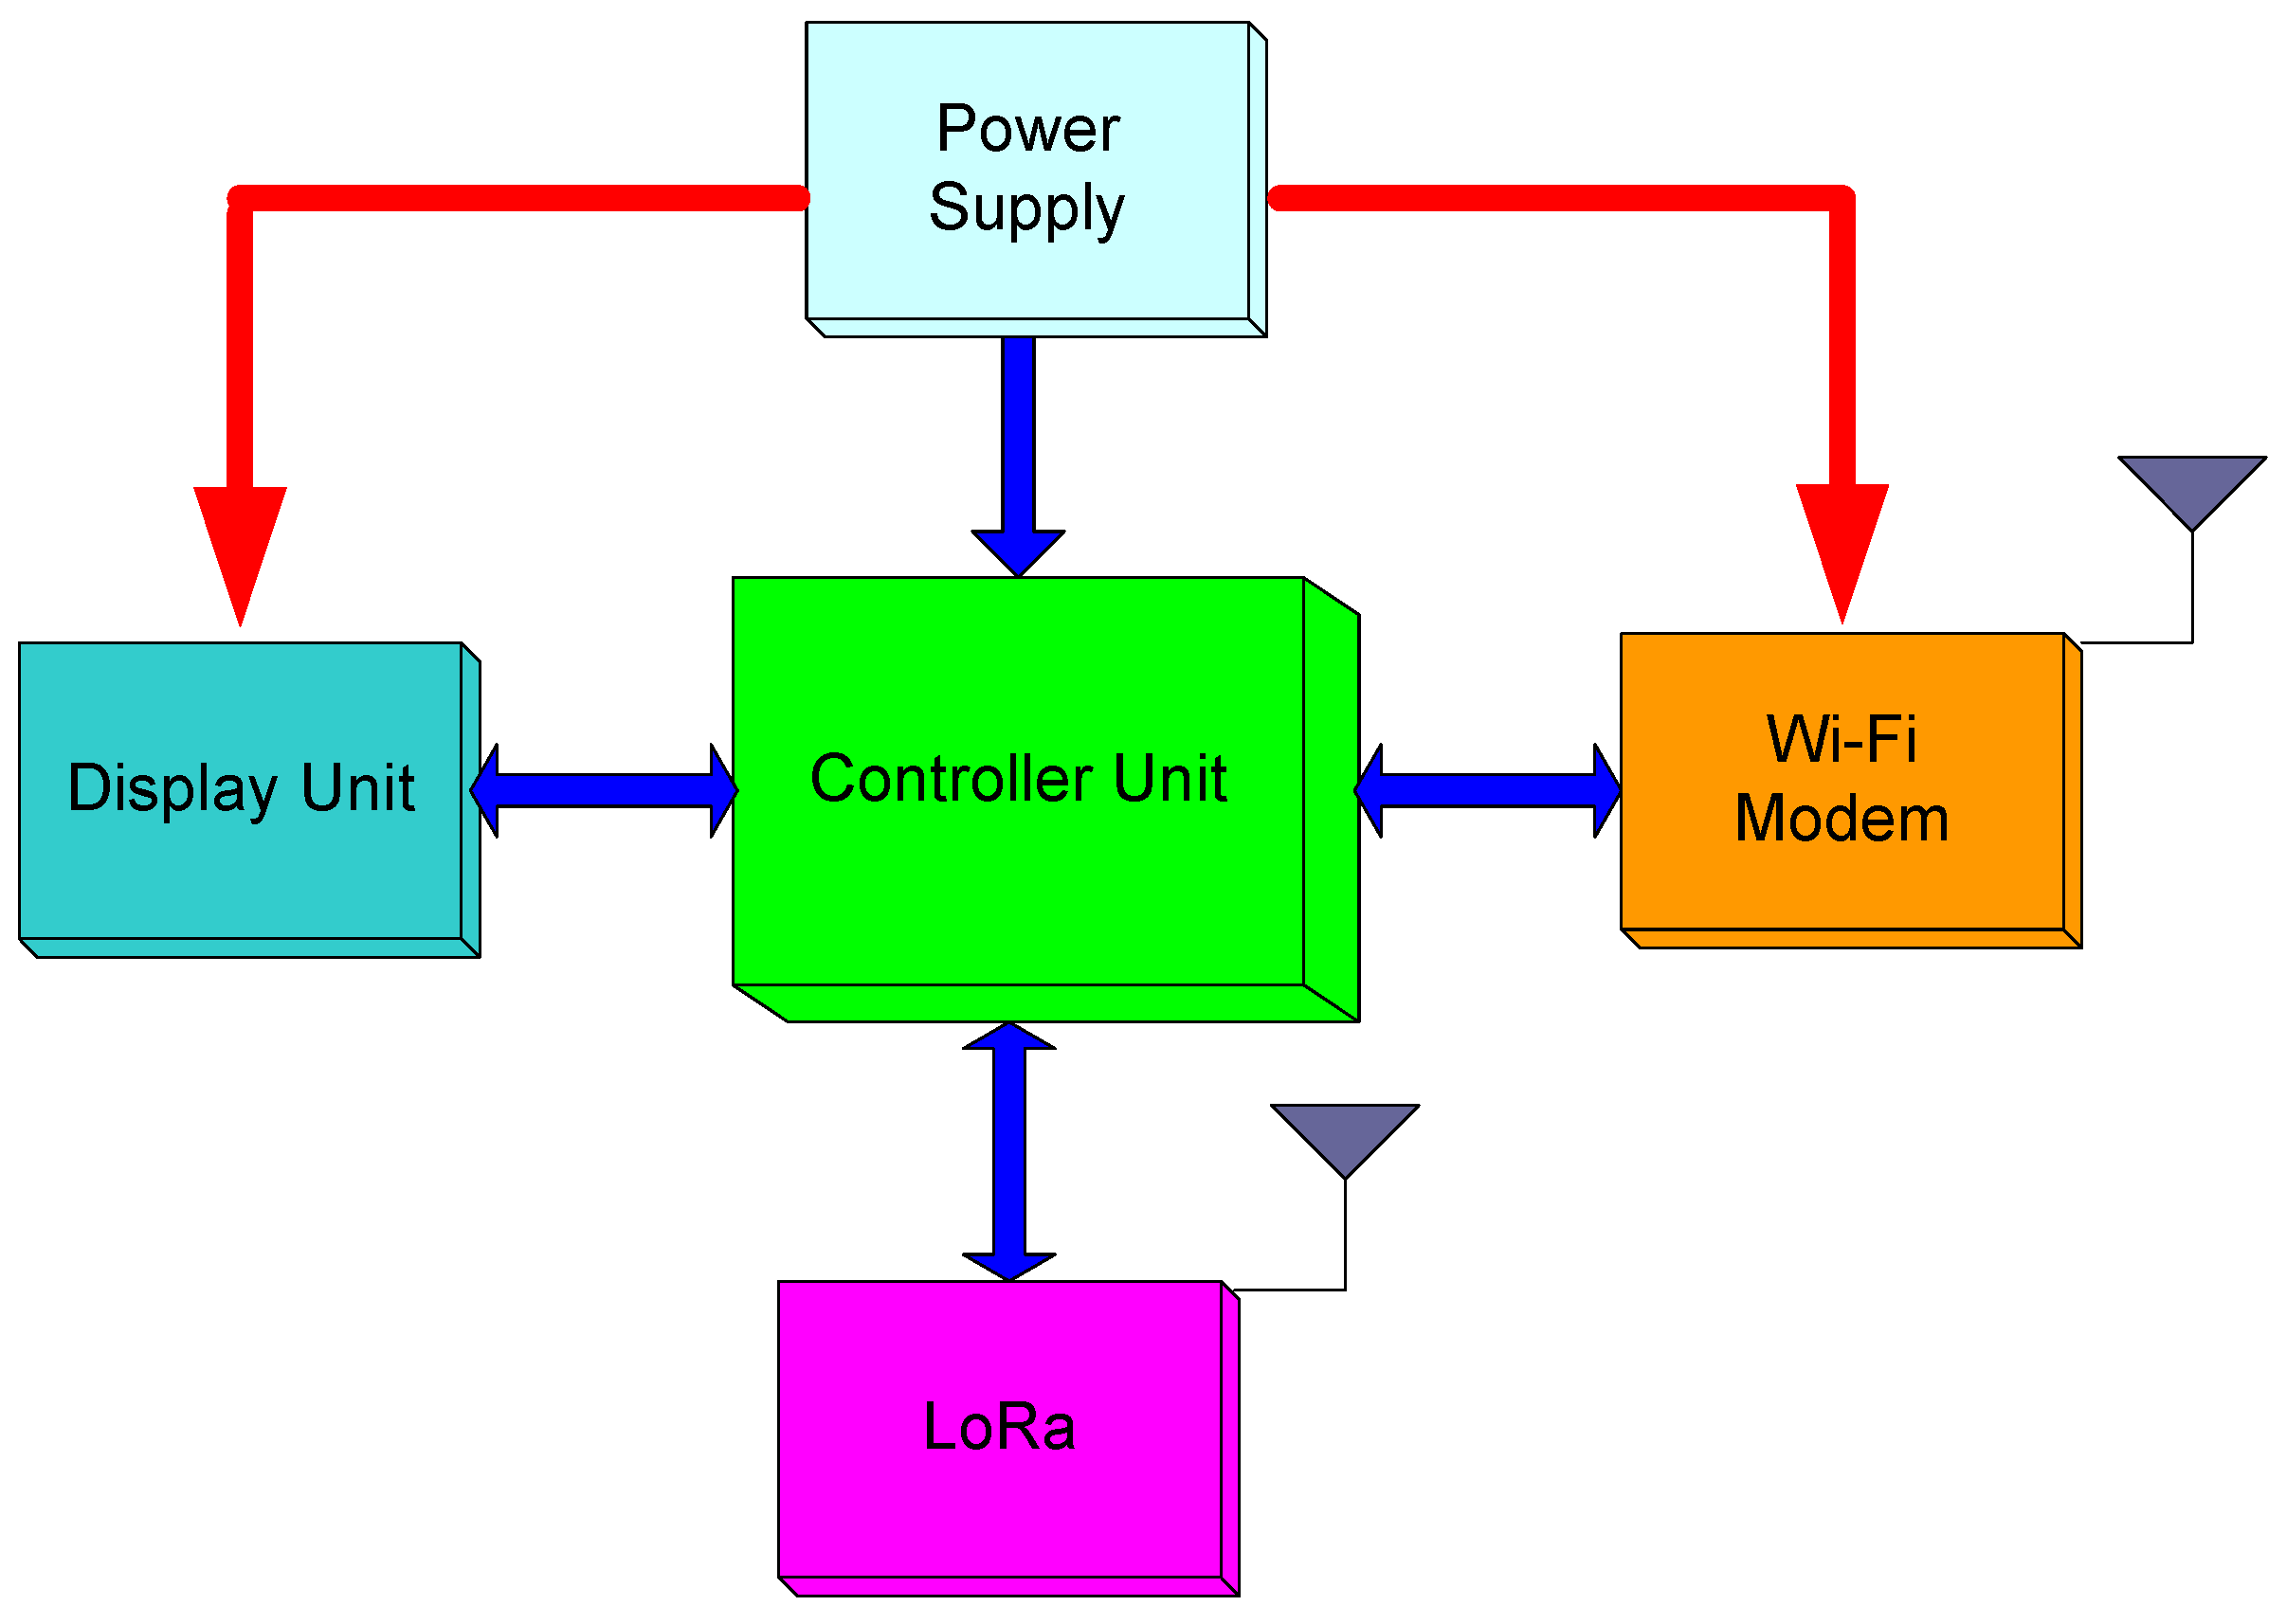
- Customized sensor node and gateway are developed for the real-time implementation.
- The evaluation metrics such as bit rate, receiver sensitivity, and time on air are evaluated by spreading factor (SF), code rate (CR), bandwidth, number of packets, payload size, preamble, and noise figure.
- The sensor node and gateway are deployed in the real-time environment and logged the sensor value on the cloud server.
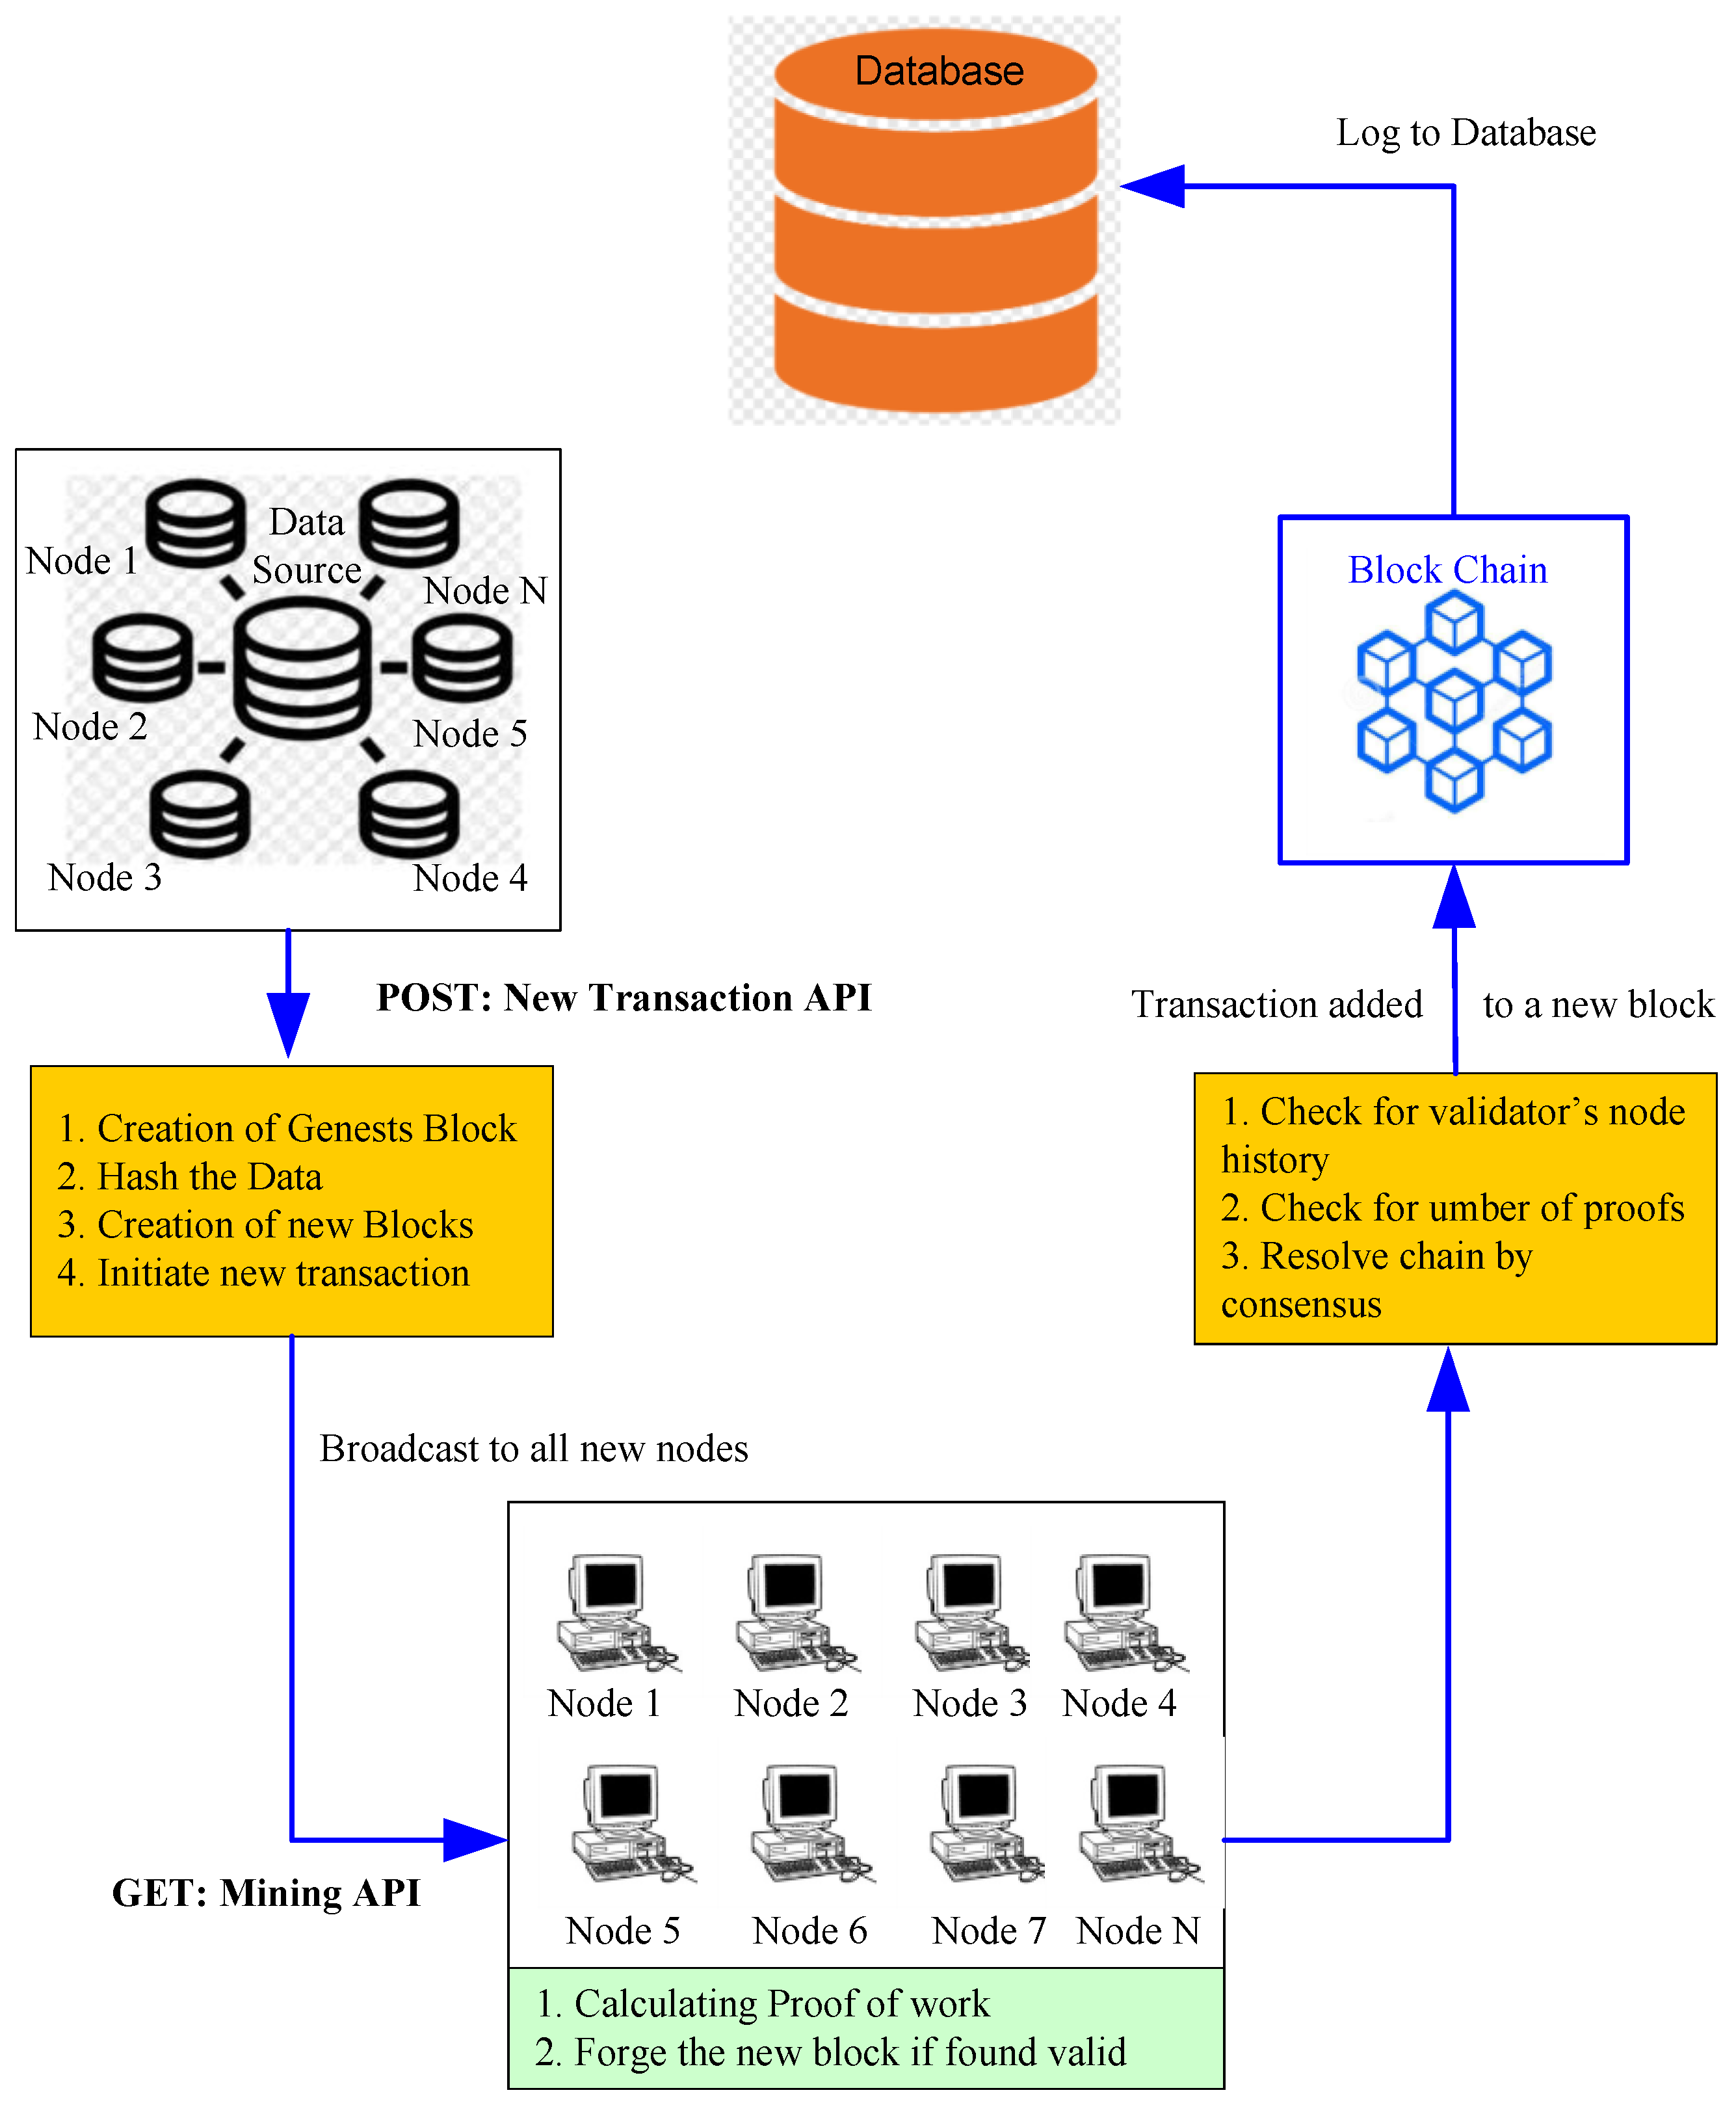
- An architecture is proposed for interfacing the hardware with blockchain network through cloud server and API.
2. Overview of Air Pollution
2.1. Analysis
2.2. Vehicular Pollutants
3. Literature Review
4. Proposed Work
4.1. Internet of Things and Long-Range Based Architecture
4.2. Phases of the Proposed System
4.2.1. Setting up the System in the Vehicle
4.2.2. Setting up the Threshold
4.2.3. Sensing of Data
4.2.4. Monitoring
4.3. Blockchain-Based Architecture for Hardware Interfacing
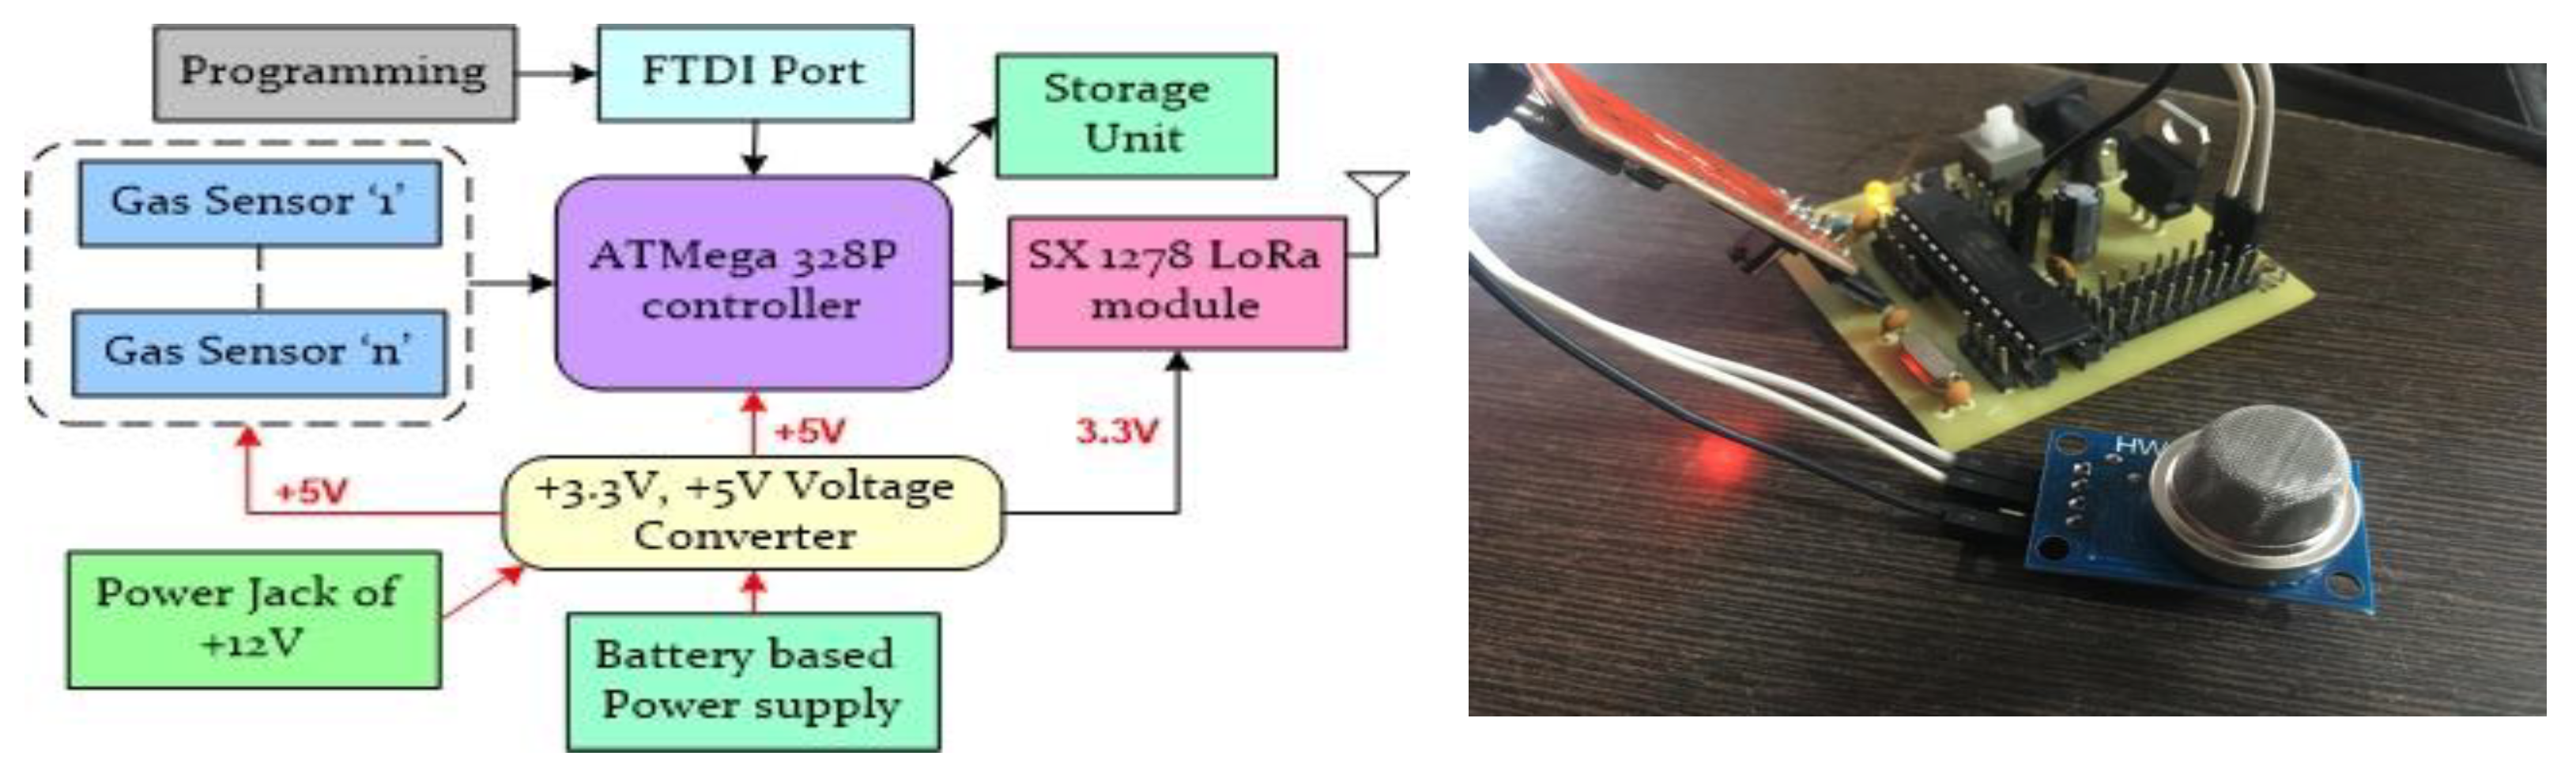
5. Hardware Implementation
- (a)
- Sensor Node:
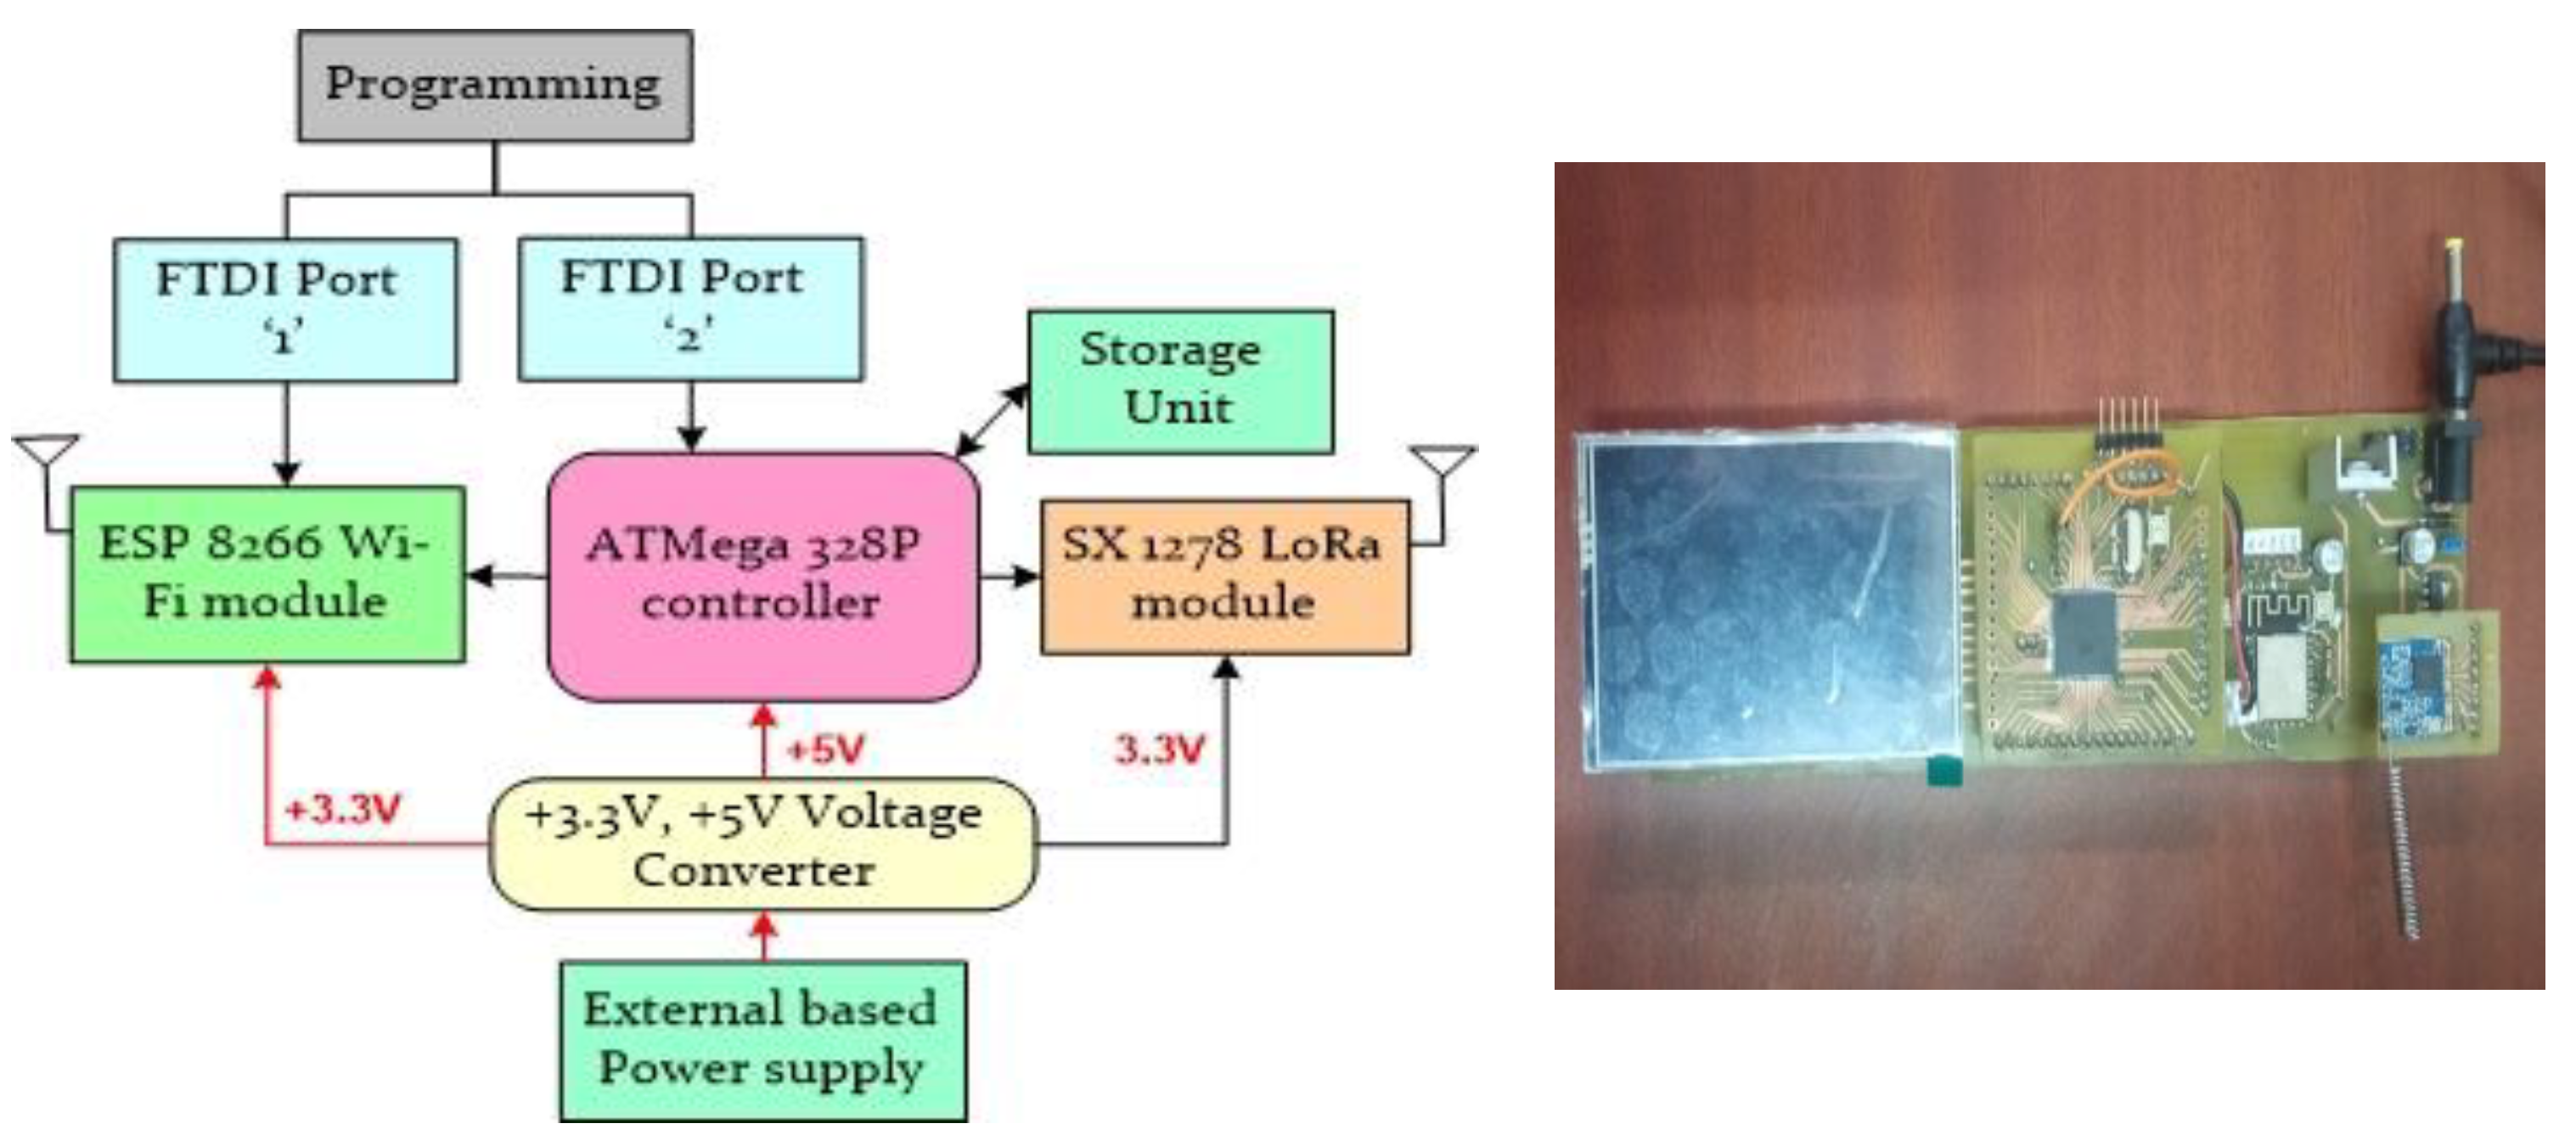
- (b)
- Long-Range-based Gateway:
6. Evaluation Metrics of LoRa Network
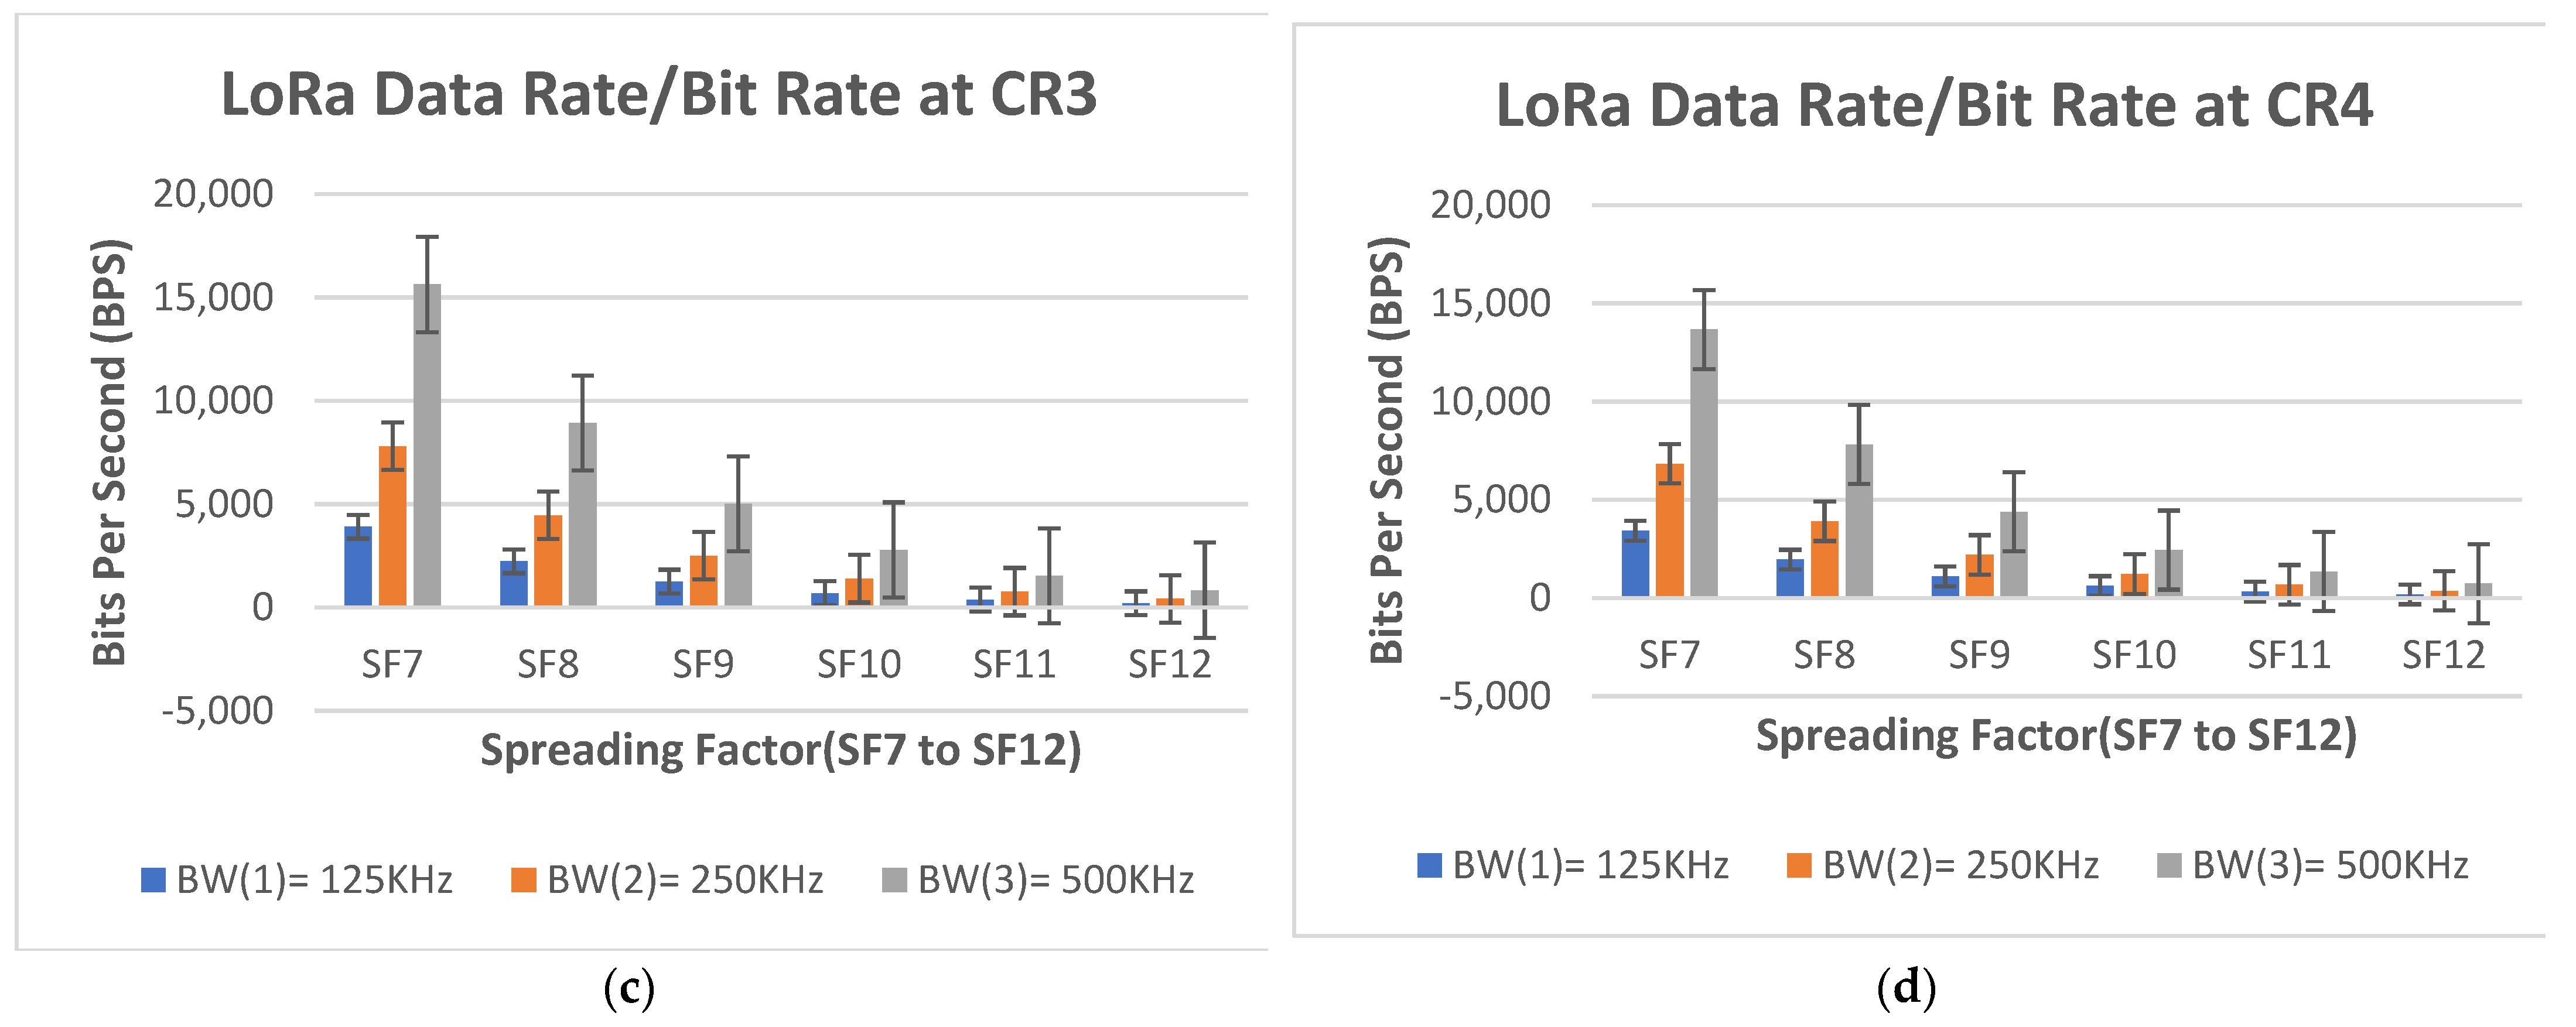
- (a)
- Bit rate:
- (b)
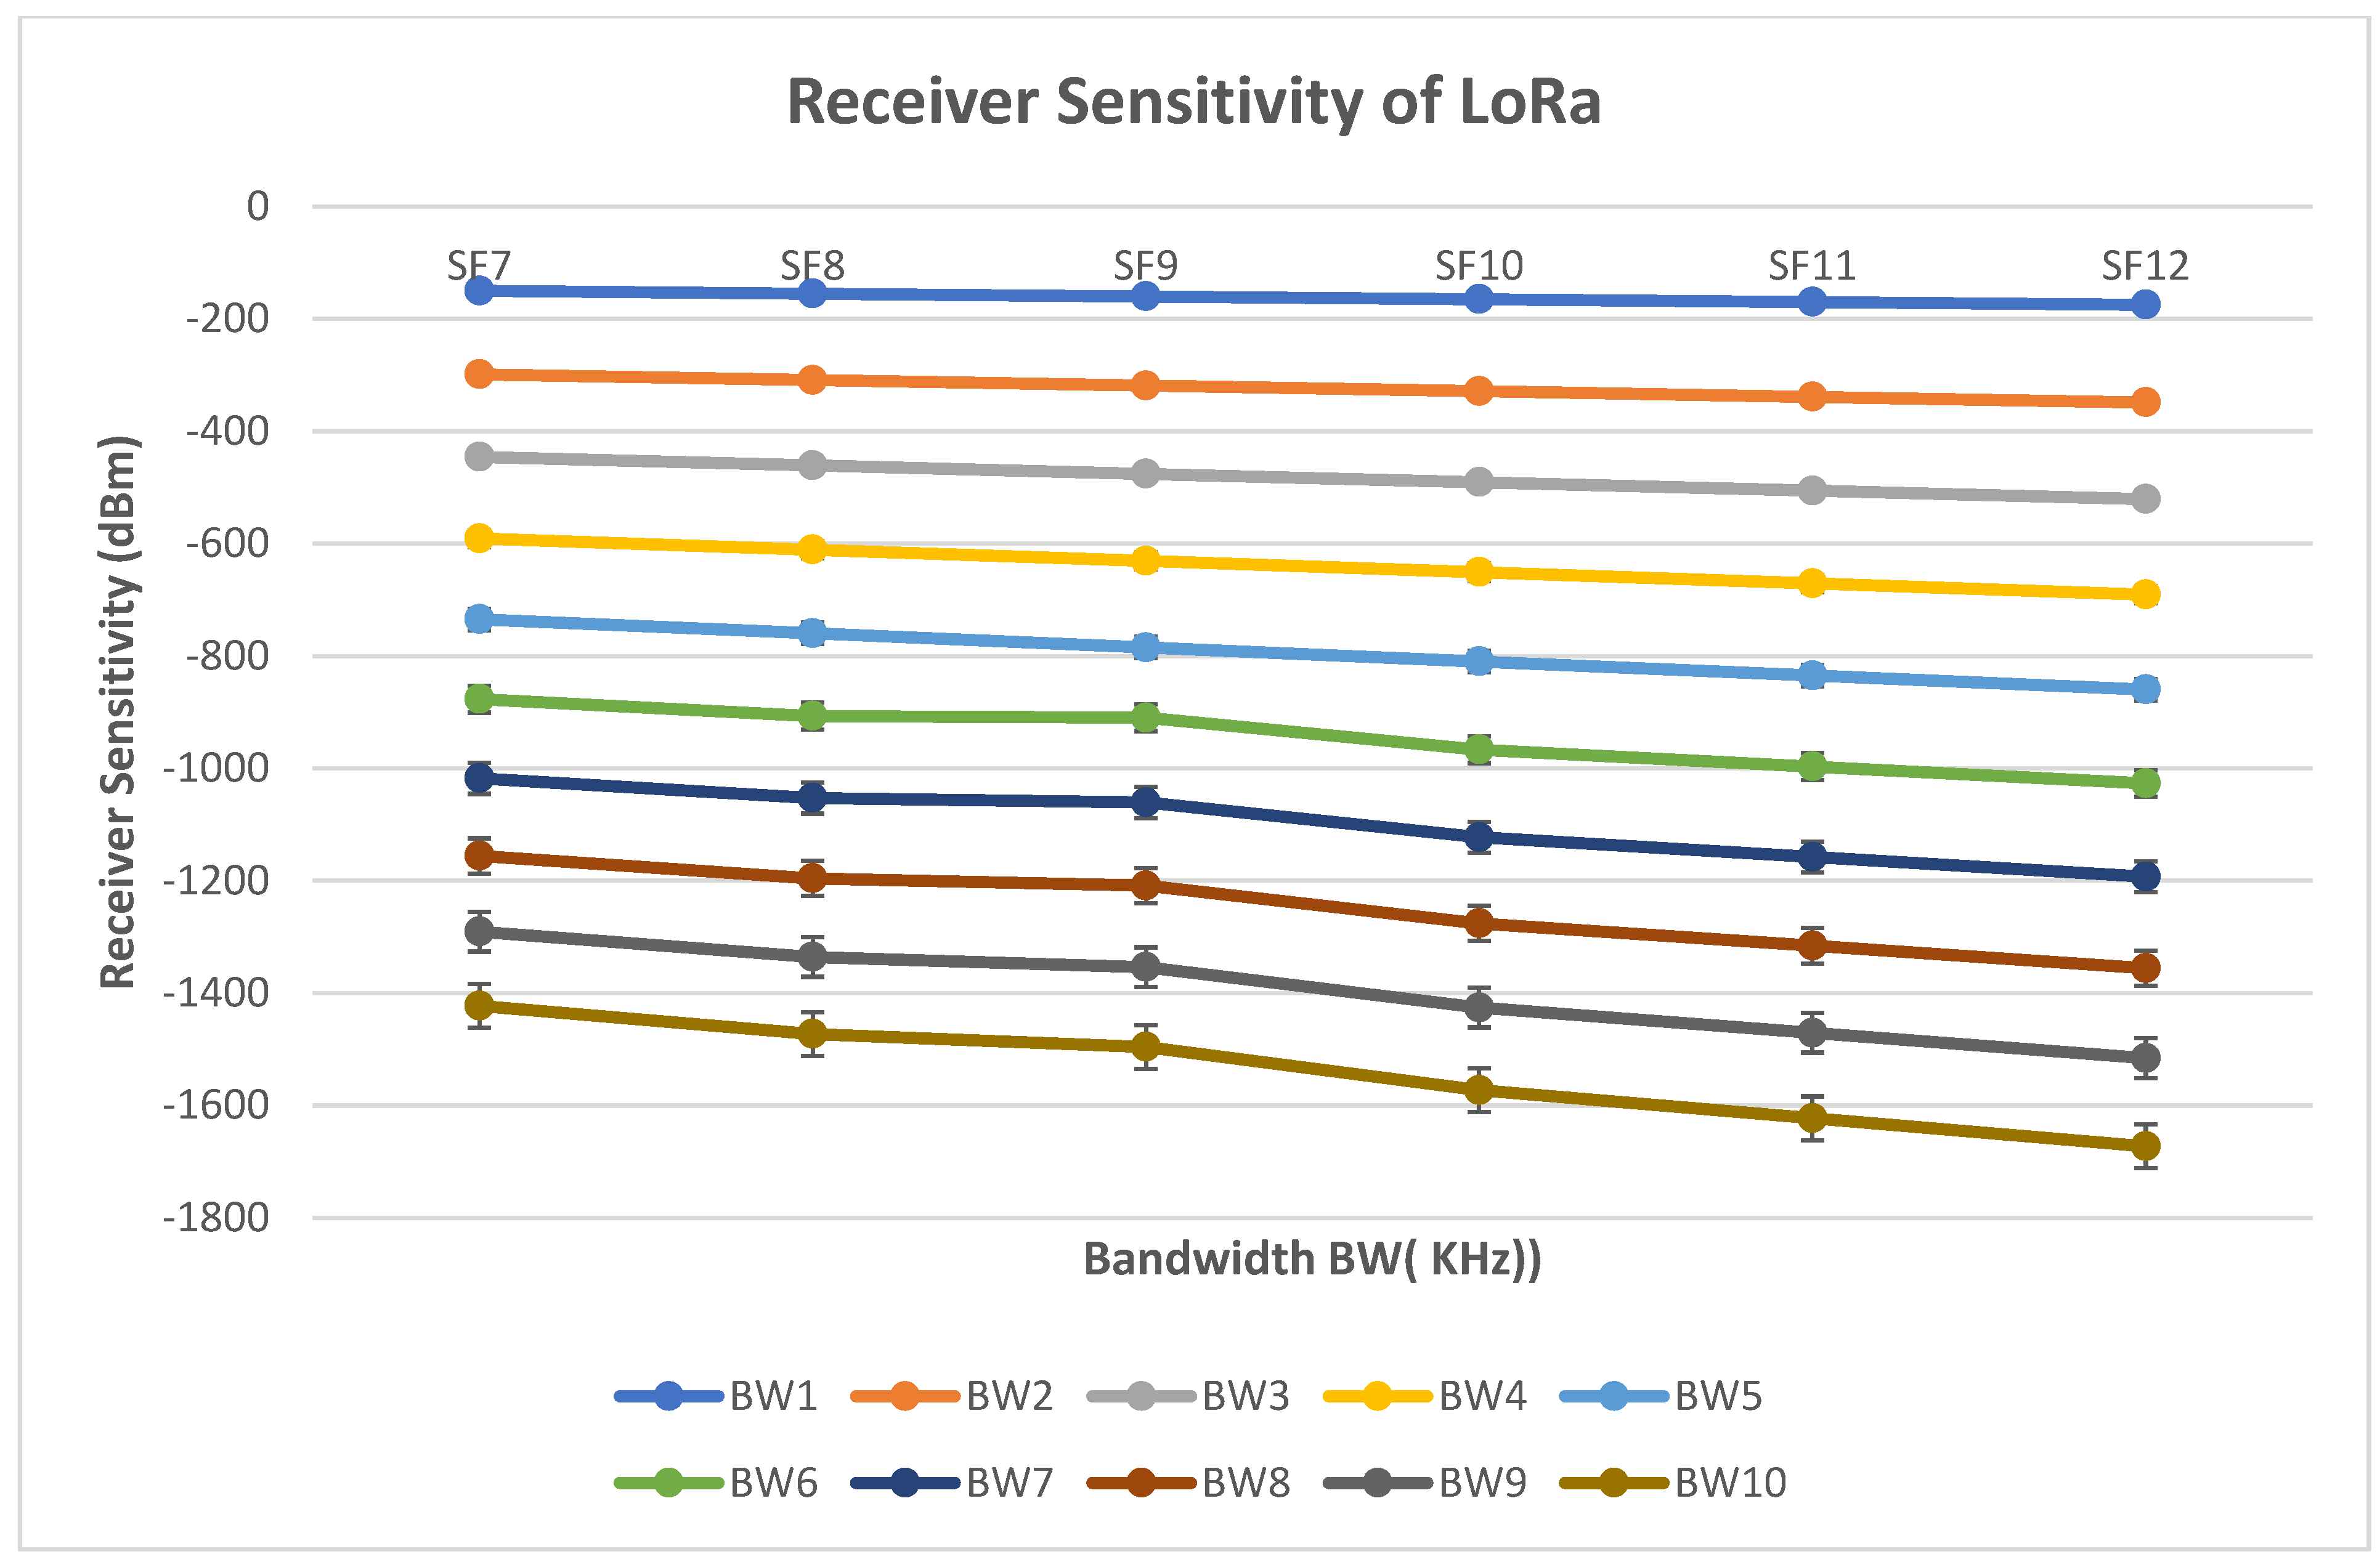
- Receiver sensitivity:
- (c)
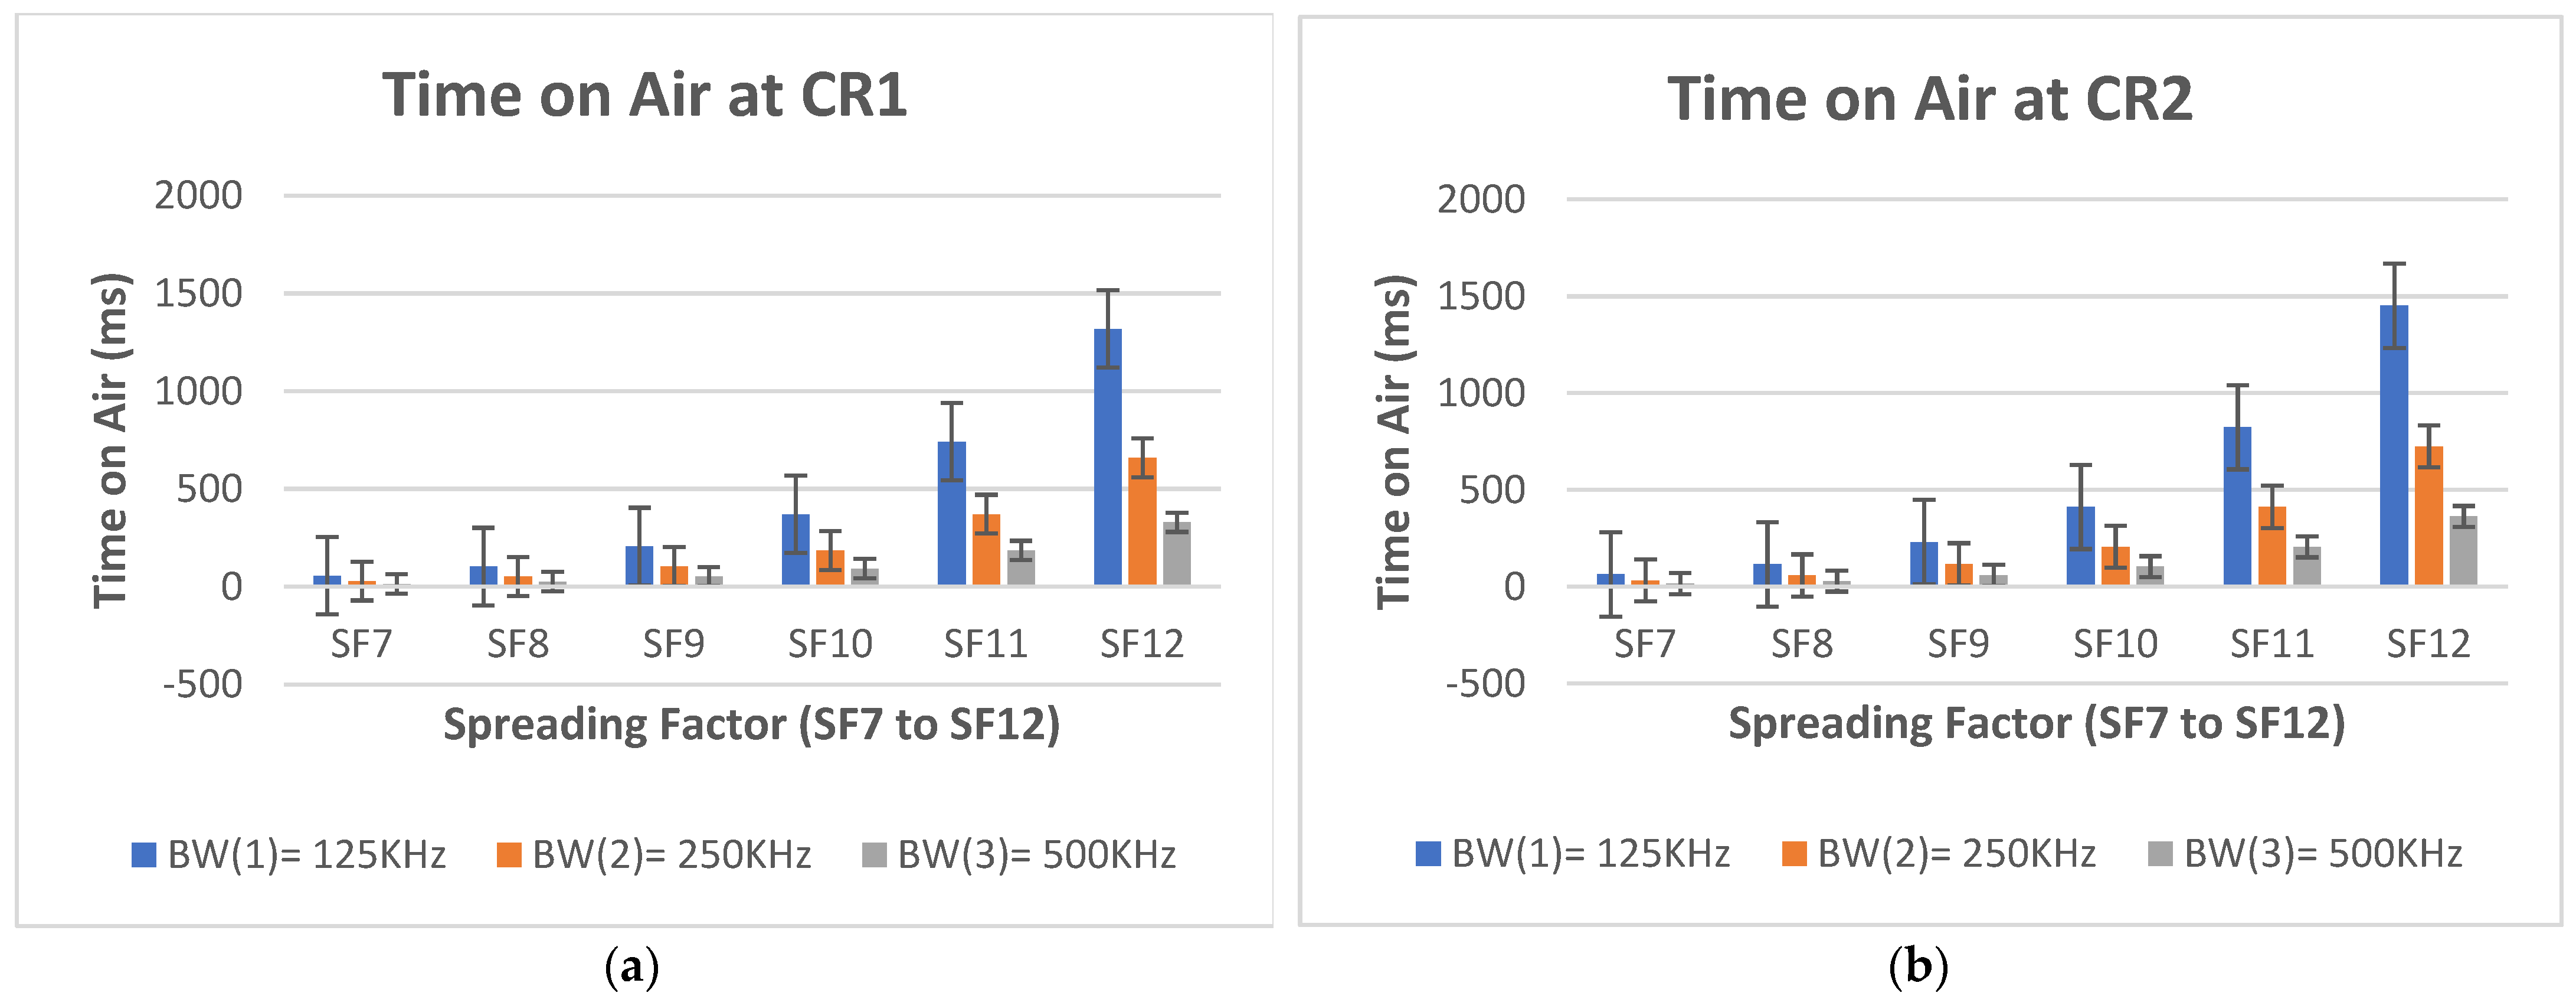
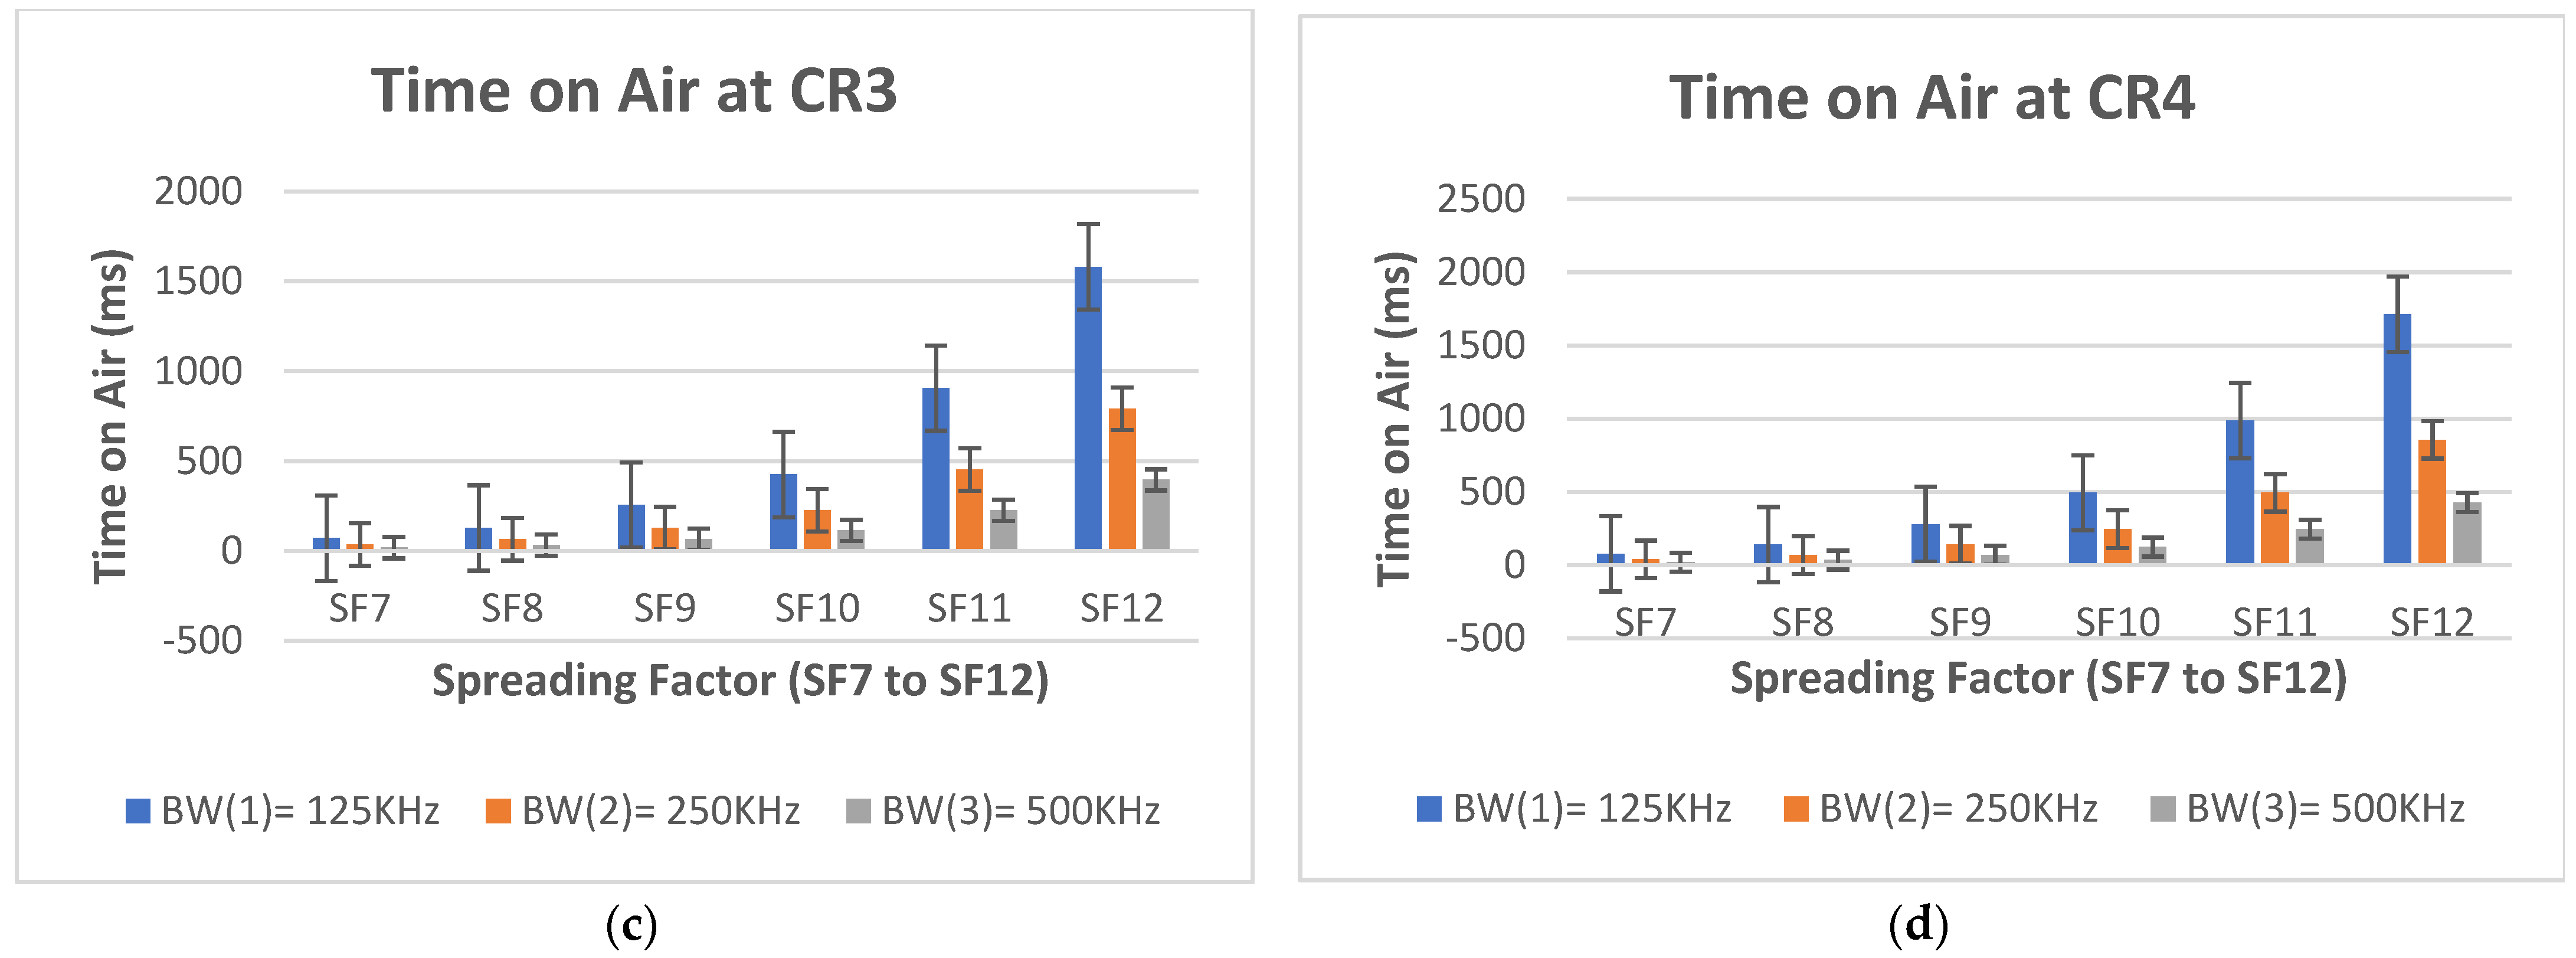
- Time on Air (ToA)
7. Results and Discussion
8. Conclusions
Author Contributions
Funding
Institutional Review Board Statement
Informed Consent Statement
Data Availability Statement
Acknowledgments
Conflicts of Interest
References
- Gubbi, J.; Buyya, R.; Marusic, S.; Palaniswami, M. Internet of things (Internet of Things): A vision, architectural elements, and future directions. Future Gener. Comp. Syst. 2013, 29, 1645–1660. [Google Scholar] [CrossRef] [Green Version]
- Xu, L.D.; He, W.; Li, S. Internet of things in industries: A survey. IEEE Trans. Ind. Inform. 2014, 10, 2233–2243. [Google Scholar] [CrossRef]
- Balamurugan, S.; Saravanakamalam, D. Energy monitoring and management using internet of things. In Proceedings of the International Conference on Power and Embedded Drive Control (ICPEDC), Chennai, India, 16–18 March 2017; pp. 208–212. [Google Scholar]
- Mohod, S.W.; Deshmukh, R.S. Internet of Things for Industrial Monitoring and Control Applications. Int. J. Sci. Eng. Res. 2016, 7, 494–498. [Google Scholar]
- Rawat, A.S.; Rajendran, J.; Ramiah, H.; Rana, A. Long-Range (Long Range) and Long-Range WAN Technology for Internet of Things Applications in COVID-19 Pandemic. In Proceedings of the International Conference on Advances in Computing, Communication & Materials (ICACCM), Dehradun, India, 21–22 August 2020; pp. 419–422. [Google Scholar]
- Reşitoğlu, İ.A.; Altinişik, K.; Keskin, A. The pollutant emissions from diesel-engine vehicles and exhaust aftertreatment systems. Clean Technol. Environ. Policy 2015, 17, 15–27. [Google Scholar] [CrossRef] [Green Version]
- Manisalidis, I.; Stavropoulou, E.; Stavropoulos, A.; Bezirtzoglou, E. Environmental and Health Impacts of Air Pollution: A Review. Front. Public Health 2020, 8, 14. Available online: https://www.frontiersin.org/article/10.3389/fpubh.2020.00014 (accessed on 15 June 2022). [CrossRef] [PubMed] [Green Version]
- Kumar, P.G.; Lekhana, P.; Tejaswi, M.; Chandrakala, S. Effects of vehicular emissions on the urban environment-a state of the art. Mater. Today Proc. 2021, 45, 6314–6320. [Google Scholar] [CrossRef]
- Available online: https://www.nps.gov/subjects/air/sources.htm (accessed on 15 June 2022).
- Zanella, A.; Bui, N.; Castellani, A.; Vangelista, L.; Zorzi, M. Internet of things for smart cities. IEEE Internet Things J. 2014, 1, 22–32. [Google Scholar] [CrossRef]
- Monzon, A. Smart cities concept and challenges: Bases for the assessment of smart city projects. In Proceedings of the International Conference on Smart Cities and Green ICT Systems, Prague, Czech Republic, 2–4 May 2015; pp. 1–11. [Google Scholar]
- Sayed, E.; Ahmed, A.; Yousef, M.E. Internet of things in Smart Environment: Concept, Applications, Challenges, and Future Directions. World Sci. News 2019, 134, 1–51. [Google Scholar]
- Jovanovska, E.M.; Davcev, D. No pollution Smart City Sightseeing Based on WSN Monitoring System. In Proceedings of the 2020 Sixth International Conference on Mobile And Secure Services (MobiSecServ), Miami Beach, FL, USA, 22–23 February 2020; pp. 1–6. [Google Scholar]
- Pathak, A.; Uddin, M.A.; Jainal Abedin, M.; Andersson, K.; Mustafa, R.; Hossain, M.S. Internet of Things based smart system to support agricultural parameters: A case study. Procedia Comput. Sci. 2019, 155, 648–653. [Google Scholar] [CrossRef]
- Reshi, A.A.; Shafi, S.; Kumaravel, A. VehNode: Wireless Sensor Network platform for automobile pollution control. In Proceedings of the 2013 IEEE Conference on Information & Communication Technologies, Thuckalay, India, 11–12 April 2013; pp. 963–966. [Google Scholar] [CrossRef]
- Prasanth, L.; Sreekanthan, D.; Lakshmi, D.A.; Harikumar, G.; Vissutha, M.P.; Anjali, T. Intelligent Traffic Control System Using WSN: A Perspective. In Proceedings of the 2021 Fourth International Conference on Microelectronics, Signals & Systems (ICMSS), Kollam, India, 18–19 November 2021; pp. 1–5. [Google Scholar] [CrossRef]
- Salman, N.; Kemp, A.H.; Khan, A.; Noakes, C.J. Real Time Wireless Sensor Network (WSN) based Indoor Air Quality Monitoring System. IFAC-PapersOnLine 2019, 52, 324–327, ISSN 2405-8963. [Google Scholar] [CrossRef]
- Yi, W.Y.; Lo, K.M.; Mak, T.; Leung, K.S.; Leung, Y.; Meng, M.L. A Survey of Wireless Sensor Network Based Air Pollution Monitoring Systems. Sensors 2015, 15, 31392–31427. [Google Scholar] [CrossRef] [PubMed] [Green Version]
- Hu, Z.; Tang, H. Design and Implementation of Intelligent Vehicle Control System Based on Internet of Things and Intelligent Transportation. Sci. Program. 2022, 2022, 6201367. [Google Scholar] [CrossRef]
- Makhija, J.; Nakkeeran, M.; Anantha Narayanan, V. Detection of Vehicle Emissions Through Green Internet of Things for Pollution Control. In Advances in Automation, Signal Processing, Instrumentation, and Control. Lecture Notes in Electrical Engineering; Komanapalli, V.L.N., Sivakumaran, N., Hampannavar, S., Eds.; Springer: Singapore, 2021; Volume 700. [Google Scholar] [CrossRef]
- Sharma, R.; Arya, R. UAV-based long-range environment monitoring system with Industry 5.0 perspectives for smart city infrastructure. Comput. Ind. Eng. 2022, 168, 108066, ISSN 0360-8352. [Google Scholar] [CrossRef]
- Zheng, K.; Zhao, S.; Yag, Z.; Xiong, X.; Xiang, W. Design and implementation of LPWAbased air quality monitoring system. IEEE Access 2016, 4, 3238–3245. [Google Scholar] [CrossRef]
- Balasubramaniyan, C.; Manivannan, D. Internet of Things enabled air quality monitoring system (AQMS) using Raspberry Pi. Indian J. Sci. Technol. 2016, 9, 1–6. [Google Scholar] [CrossRef]
- Sofia, D.; Lotrecchiano, N.; Trucillo, P.; Giuliano, A.; Terrone, L. Novel Air Pollution Measurement System Based on Ethereum Blockchain. J. Sens. Actuator Netw. 2020, 9, 49. [Google Scholar] [CrossRef]
- Dhingra, S.; Madda, R.B.; Gandomi, A.H.; Patan, R.; Daneshmand, M. Internet of Things Mobile–Air Pollution Monitoring System (Internet of Things-Mobair). IEEE Internet Things J. 2019, 6, 5577–5584. [Google Scholar] [CrossRef]
- Camarillo-Escobedo, R.; Flores, J.L.; Marin-Montoya, P.; García-Torales, G.; Camarillo-Escobedo, J.M. Smart Multi-Sensor System for Remote Air Quality Monitoring Using Unmanned Aerial Vehicle and Long-Range WAN. Sensors 2022, 22, 1706. [Google Scholar] [CrossRef] [PubMed]
- Yeh, W.C.; Lin, J.S. New parallel swarm algorithm for smart sensor systems redundancy allocation problems in the Internet of Things. J. Supercomput. 2018, 74, 4358–4384. [Google Scholar] [CrossRef]
- Zhang, R.; Xue, R.; Liu, L. Security and privacy on blockchain. ACM Comput. Surv. 2019, 52, 1–34. [Google Scholar] [CrossRef] [Green Version]
- Khan, S.N.; Loukil, F.; Ghedira-Guegan, C.; Benkhelifa, E.; Bani-Hani, A. Blockchain smart contracts: Applications, challenges, and future trends. Peer-Peer Netw. Appl. 2021, 14, 2901–2925. [Google Scholar] [CrossRef] [PubMed]
- Wang, S.; Ouyang, L.; Yuan, Y.; Ni, X.; Han, X.; Wang, F.Y. Blockchain-enabled smart contracts: Architecture, applications, and future trends. IEEE Trans. Syst. Man Cybern. Syst. 2019, 49, 2266–2277. [Google Scholar] [CrossRef]
- Lo Re, G.; Peri, D.; Vassallo, S. Urban Air Quality Monitoring Using Vehicular Sensor Networks. In Advances onto the Internet of Things; Gaglio, S., Lo Re, G., Eds.; Springer International Publishing: Gewerbestrasse, Switzerland, 2014; pp. 311–323. [Google Scholar]
- Semtech Corporation. SX1276/77/78/79—137 MHz to 1020 MHz Low Power Long Range Transceiver. 2016. Available online: https://www.scribd.com/document/399165229/SX1276-1278 (accessed on 15 June 2022).
- Atmel Corporation. Data Sheet ATmega328P. 2015, pp. 1–294. Available online: http://ww1.microchip.com/downloads/en/DeviceDoc/Atmel-7810-Automotive-Microcontrollers-ATmega328P_Datasheet.pdf (accessed on 15 June 2022).
- Ray, P.P. A survey of IoT cloud platforms. Futur. Comput. Inform. J. 2016, 1, 35–46. [Google Scholar] [CrossRef]
- Pipeline Incident 20 Year Trends—PHMSA. Available online: https://www.phmsa.dot.gov/data-and-statistics/pipeline/pipeline-incident-20-year-trends (accessed on 12 July 2022).
- Sendra, S.; García, L.; Lloret, J.; Bosch, I.; Vega-Rodríguez, R. Long-RangeWAN network for fire monitoring in rural environments. Electronics 2020, 9, 531. [Google Scholar] [CrossRef] [Green Version]
- LoRaTool. Available online: https://www.loratools.nl (accessed on 13 July 2022).
- Liu, B.; Zimmerman, N. Fleet-based vehicle emission factors using low-cost sensors: Case study in parking garages. Transp. Res. Part D Transp. Environ. 2021, 91, 102635, ISSN 1361-9209. [Google Scholar] [CrossRef]
- Surannavar, K.; Tatwanagi, M.b.; Nadaf, S.P.; Hunshal, P.B.; Patil, D. Vehicular pollution monitoring system and detection of vehicles causing global warming. Int. J. Eng. Sci. Comput. 2017, 7, 12611–12614. [Google Scholar] [CrossRef]
- Wu, Y.C.; Shiledar, A.; Li, Y.C.; Wong, J.; Feng, S.; Chen, X.; Chen, C.; Jin, K.; Janamian, S.; Yang, Z.; et al. Air quality monitoring using mobile microscopy and machine learning. Light Sci. Appl. 2017, 6, e17046. [Google Scholar] [CrossRef]
- Moreno-Rangel, A.; Sharpe, T.; Musau, F.; McGill, G. Field evaluation of a low-cost indoor air quality monitor to quantify exposure to pollutants in residential environments. J. Sens. Sens. Syst. 2018, 7, 373–388. [Google Scholar] [CrossRef] [Green Version]
- Libelium Libelium Waspmote. Available online: http://www.libelium.com/products/waspmote/ (accessed on 27 May 2015).
- Mansour, S.; Nasser, N.; Karim, L.; Ali, A. Wireless Sensor Network-based air quality monitoring system. In Proceedings of the 2014 International Conference on Computing, Networking and Communications (ICNC), Honolulu, HI, USA, 3–6 February 2014; pp. 545–550. [Google Scholar]


| Pollutants | Health Effect | Environmental Effects | Climate Change | ||||
|---|---|---|---|---|---|---|---|
| Direct | Indirect | Acid Rains | Eutrophication | Visibility | Direct | Indirect | |
| CO | Yes | No | Yes | No | No | No | Yes |
| HC | Yes | Yes | Yes | Yes | No | No | Yes |
| NOx | Yes | Yes | Yes | Yes | Yes | Yes | No |
| PM | Yes | No | Yes | No | Yes | Yes | No |
| SOx | Yes | No | Yes | No | Yes | No | Yes |
| Characteristic | Specification |
|---|---|
| Network Topology | Point-to-Point, Point-to-Multipoint, Peer-to-Peer |
| Frequency | 433 MHz |
| Modulation | FSK/GFSK/Long-Range/MSK |
| Data Rate | <300 kbps |
| Sensitivity | −136 dBm |
| Output Power | +20 dB |
| Operating Voltage | 1.8 V to 3.6 V |
| RSSI | 127 dB |
| Link budget | 168 dB |
| Current | Tx: 120 mA, Rx: 10.8 mA |
| Characteristic | Specification |
|---|---|
| Architecture | RISC |
| Controller | 8-bit microcontroller |
| Serial Interface | Master/slave SPI |
| Programming | In-system programming |
| Pin 6 analog pins | 14 digital pins |
| PWM channels | 6 |
| Operating Voltage | 2.7 V to 5.5 V |
| Current | Active state: 1.5 mA at 3 V–4 MHz, Power-down state: 1 µA at 3 V |
| Characteristic | Specification |
|---|---|
| Processor | Tensilica L106 32-bit processor |
| IEEE standard | 802.11 b/g/n |
| Frequency | 2.4 GHz |
| Data rate | 72 Mbps |
| Network Protocols | IPv4, TCP/UDP, HTTP |
| Tx Power | 20 dBm (802.11b) 17 dBm (802.11g) & 14 dBm (802.11n) |
| Rx Sensitivity | −91 dBm (802.11b), −75 dBm (802.11g) & −71 dBm (801.11n) |
| Operating Voltage | 2.5 V to 3.6 V |
| Current | Average: 80 mA |
| SF | LoRa Data Rate (BPS) | ||
|---|---|---|---|
| BW1 (125 kHz) | BW2 (250 kHz) | BW3 (500 kHz) | |
| SF7 | 5468.75 | 10,937.5 | 21,875 |
| SF8 | 3125 | 6250 | 12,500 |
| SF9 | 1757.81 | 3515.62 | 7031.25 |
| SF10 | 976.56 | 1953.12 | 3906.25 |
| SF11 | 537.1 | 1074.21 | 2148.43 |
| SF12 | 292.96 | 585.93 | 1171.87 |
| SF | LoRa Data Rate (BPS) | ||
|---|---|---|---|
| BW1 (125 kHz) | BW2 (250 kHz) | BW3 (500 kHz) | |
| SF7 | 4557.29 | 9114.58 | 18,229.16 |
| SF8 | 2604.16 | 5208.33 | 10,416.66 |
| SF9 | 1464.84 | 2929.68 | 5859.37 |
| SF10 | 813.8 | 1627.6 | 3255.2 |
| SF11 | 447.59 | 895.18 | 1790.36 |
| SF12 | 244.14 | 488.28 | 976.56 |
| SF | LoRa Data Rate (BPS) | ||
|---|---|---|---|
| BW1 (125 kHz) | BW2 (250 kHz) | BW3 (500 kHz) | |
| SF7 | 3906.25 | 7812.5 | 15,625 |
| SF8 | 2232.14 | 4464.28 | 8928.57 |
| SF9 | 1255.58 | 2511.16 | 5022.32 |
| SF10 | 697.54 | 1395.08 | 2790.17 |
| SF11 | 383.64 | 767.29 | 1534.59 |
| SF12 | 209.26 | 418.52 | 837.05 |
| SF | LoRa Data Rate (BPS) | ||
|---|---|---|---|
| BW1 (125 kHz) | BW2 (250 kHz) | BW3 (500 kHz) | |
| SF7 | 3417.96 | 6835.93 | 13,671.87 |
| SF8 | 1953.12 | 3906.25 | 7812.5 |
| SF9 | 1098.63 | 2197.26 | 4394.53 |
| SF10 | 610.35 | 1220.7 | 2441.4 |
| SF11 | 335.69 | 671.38 | 1342.77 |
| SF12 | 183.1 | 366.21 | 732.42 |
| SF | BW1 | BW2 | BW3 | BW4 | BW5 | BW6 | BW7 | BW8 | BW9 | BW10 |
|---|---|---|---|---|---|---|---|---|---|---|
| SF7 | −150.07 | −148.82 | −147 | −145 | −144 | −142 | −141 | −138 | −135 | −132 |
| SF8 | −155.07 | −153.82 | −152 | −150 | −149 | −147 | −146 | −143 | −140 | −137 |
| SF9 | −160.07 | −158.82 | −157 | −155 | −154 | −125 | −151 | −148 | −145 | −142 |
| SF10 | −165.07 | −163.82 | −162 | −160 | −159 | −157 | −156 | −153 | −150 | −147 |
| SF11 | −170.07 | −168.82 | −167 | −165 | −164 | −162 | −161 | −158 | −155 | −152 |
| SF12 | −175.07 | −173.82 | −172 | −170 | −169 | −167 | −166 | −163 | −160 | −157 |
| SF | LoRa Data Rate (BPS) | ||
|---|---|---|---|
| BW1 (125 kHz) | BW2 (250 kHz) | BW3 (500 kHz) | |
| SF7 | 56.58 | 28.29 | 14.14 |
| SF8 | 102.91 | 51.46 | 25.73 |
| SF9 | 205.82 | 102.91 | 51.46 |
| SF10 | 370.69 | 185.34 | 92.67 |
| SF11 | 741.38 | 370.69 | 185.34 |
| SF12 | 1318.91 | 659.46 | 329.73 |
| SF | LoRa Data Rate (BPS) | ||
|---|---|---|---|
| BW1 (125 kHz) | BW2 (250 kHz) | BW3 (500 kHz) | |
| SF7 | 63.74 | 31.87 | 15.94 |
| SF8 | 115.2 | 57.6 | 28.8 |
| SF9 | 230.4 | 115.2 | 57.6 |
| SF10 | 411.65 | 205.82 | 102.91 |
| SF11 | 823.3 | 411.65 | 205.82 |
| SF12 | 1449.98 | 724.99 | 362.5 |
| SF | LoRa Data Rate (BPS) | ||
|---|---|---|---|
| BW1 (125 kHz) | BW2 (250 kHz) | BW3 (500 kHz) | |
| SF7 | 70.91 | 35.46 | 17.73 |
| SF8 | 127.49 | 63.74 | 31.87 |
| SF9 | 254.98 | 127.49 | 63.74 |
| SF10 | 425.61 | 226.3 | 113.15 |
| SF11 | 905.22 | 452.61 | 226.3 |
| SF12 | 1581.06 | 790.53 | 395.26 |
| SF | LoRa Data Rate (BPS) | ||
|---|---|---|---|
| BW1 (125 kHz) | BW2 (250 kHz) | BW3 (500 kHz) | |
| SF7 | 78.08 | 39.04 | 19.52 |
| SF8 | 139.78 | 69.89 | 34.94 |
| SF9 | 279.55 | 139.78 | 69.89 |
| SF10 | 493.57 | 246.78 | 123.39 |
| SF11 | 987.14 | 493.57 | 246.78 |
| SF12 | 1712.13 | 856.06 | 428.03 |
| Air Quality Index (µg/m3) Category (Range) | ||||||
|---|---|---|---|---|---|---|
| Good (0–50) | Satisfactory (51–100) | Moderate (101–200) | Poor (201–300) | Very Poor (301–400) | Severe (401–500) | |
| PM10 (24 h) | 0–50 | 51–100 | 101–250 | 251–350 | 351–430 | 430 + |
| PM2.5 (24 h) | 0–30 | 31–60 | 61–90 | 91–120 | 121–250 | 250 + |
| NO2 (24 h) | 0–40 | 41–80 | 81–180 | 181–280 | 281–400 | 400 + |
| O3 (24 h) | 0–50 | 51–100 | 101–168 | 169–208 | 209–748 | 748 + * |
| CO (24 h) | 0–1.0 | 1.1–2.0 | 2.1–10 | 10.1–17 | 17.1–34 | 34 + |
| References | Parameters Considered | Communication | Customized Hardware | Gateway | Cloud Server | Blockchain Integration |
|---|---|---|---|---|---|---|
| [39] | PM | NA | Not Implemented | NA | No | No |
| [40] | Fine PM2.5, CO2, VOCs, RH, and temperature | Wi-Fi | Not Implemented | NA | Yes | No |
| [41] | O3, CO, NO2 | ZigBee + Wi-Fi | Not Implemented | Yes | Yes | No |
| [43] | CO, NO2, O3, CO2 | ZigBee + Wi-Fi | Not Implemented | Yes | Yes | No |
| Proposed Work | PM10, PM2.5, NO2, O3, CO | Long-Range + Wi-Fi | Customized sensor node and gateway | Yes | Yes | Blockchain interfaced with hardware for node authentication |
Publisher’s Note: MDPI stays neutral with regard to jurisdictional claims in published maps and institutional affiliations. |
© 2022 by the authors. Licensee MDPI, Basel, Switzerland. This article is an open access article distributed under the terms and conditions of the Creative Commons Attribution (CC BY) license (https://creativecommons.org/licenses/by/4.0/).
Share and Cite
Rana, A.; Rawat, A.S.; Afifi, A.; Singh, R.; Rashid, M.; Gehlot, A.; Akram, S.V.; Alshamrani, S.S. A Long-Range Internet of Things-Based Advanced Vehicle Pollution Monitoring System with Node Authentication and Blockchain. Appl. Sci. 2022, 12, 7547. https://doi.org/10.3390/app12157547
Rana A, Rawat AS, Afifi A, Singh R, Rashid M, Gehlot A, Akram SV, Alshamrani SS. A Long-Range Internet of Things-Based Advanced Vehicle Pollution Monitoring System with Node Authentication and Blockchain. Applied Sciences. 2022; 12(15):7547. https://doi.org/10.3390/app12157547
Chicago/Turabian StyleRana, Arti, Arvind Singh Rawat, Ashraf Afifi, Rajesh Singh, Mamoon Rashid, Anita Gehlot, Shaik Vaseem Akram, and Sultan S. Alshamrani. 2022. "A Long-Range Internet of Things-Based Advanced Vehicle Pollution Monitoring System with Node Authentication and Blockchain" Applied Sciences 12, no. 15: 7547. https://doi.org/10.3390/app12157547
APA StyleRana, A., Rawat, A. S., Afifi, A., Singh, R., Rashid, M., Gehlot, A., Akram, S. V., & Alshamrani, S. S. (2022). A Long-Range Internet of Things-Based Advanced Vehicle Pollution Monitoring System with Node Authentication and Blockchain. Applied Sciences, 12(15), 7547. https://doi.org/10.3390/app12157547