Article

Persistent Spatial Patterns of Listeria monocytogenes and Salmonella enterica Concentrations in Surface Waters: Empirical Orthogonal Function Analysis of Data from Maryland

1
Environmental Microbial and Food Safety Laboratory, Agricultural Research Service (USDA ARS), United States Department of Agriculture, Beltsville, MD 20705, USA
2
Department of Environmental Science and Technology, University of Maryland, College Park, MD 20742, USA
3
Department of Plant Sciences and Landscape Architecture, University of Maryland, College Park, MD 20742, USA
4
Maryland Institute of Applied Environmental Health, University of Maryland, College Park, MD 20742, USA
5
Department of Agriculture, Food and Resource Sciences, University of Maryland Eastern Shore, Princess Anne, MD 21853, USA
6
Department of Animal and Food Sciences, University of Delaware, Newark, DE 19716, USA
*
Author to whom correspondence should be addressed.
Appl. Sci. 2022, 12(15), 7526; https://doi.org/10.3390/app12157526
Submission received: 30 May 2022 / Revised: 8 July 2022 / Accepted: 21 July 2022 / Published: 26 July 2022
(This article belongs to the Special Issue New Frontiers into Environmental Microbiology)

Abstract

:
High spatiotemporal variability of pathogen concentrations in surface waters complicates the design and interpretation of microbial water quality monitoring. Empirical orthogonal function (EOF) analysis can provide spatial patterns (EOFs) of variability in deviations of concentrations in specific locations from the average concentration across the study area. These patterns can be interpreted to assess the effect of environmental factors on pathogen levels in the water. The first and the second EOFs for Listeria monocytogenes explained 84.4% and 9.7% of the total variance of deviations from average, respectively. That percentage was 50.8% and 45.0% for Salmonella enterica. The precipitation also had a strong explanatory capability (79%) of the first EOF. The first EOFs of Listeria and precipitation were similar at pond sites but were opposite to the precipitation at the stream sites. The first EOF of S. enterica and precipitation demonstrated opposite trends, whereas the second S. enterica EOF pattern had similar signs with the precipitation EOF at pond sites, indicating a relationship between rainfall and Salmonella at these sites. Overall, the rainfall data could inform on persistent spatial patterns in concentrations of the two pathogens at the pond sites in farm settings but not at stream sites located in forested areas.

1. Introduction

Pathogenic bacteria are of serious concern due to their effect on public health. Salmonella enterica is one of the most common bacterial pathogens associated with foodborne illness in the United States [1]. There is a history of outbreaks associated with fresh produce contaminated with Salmonella enterica in the Mid-Atlantic region of the United States [2,3]. Listeria monocytogenes have been found in soil, surface waters, food processing plants, and agricultural areas throughout the United States [4,5,6,7,8]. The presence of Listeria monocytogenes in pre-harvest environments can cause contamination of fresh produce, leading to product recalls and outbreaks. The most well-known example of a high-mortality produce-related outbreak involved cantaloupes contaminated with L. monocytogenes associated with 33 deaths in 2011 [9].
For spatio-temporal monitoring purposes in environmental studies, it is desirable to determine the locations representing the entire observation area. These representative locations aid in determining the persistent spatial patterns in deviations of individual observations from the mean across the observation area. Locations where such deviations from the mean are consistently close to zero best represent the mean across the observation area [10]. Two commonly used techniques to find spatial patterns in deviations from average are the mean relative difference (MRD) method and the empirical orthogonal function (EOF) method. The EOF method can identify and rank several patterns, allowing the user to gauge the impact of each pattern, whereas the MRD method generates a single pattern. As an efficient method to uncover spatial patterns of variability [11,12], the EOF analysis was used in oceanography and climate studies [13,14], hydrogeology [15], soil hydrology [16], crop yield as related to the access to groundwater and nutrient management [17], and other fields. For example, persistent spatial patterns were found with EOF analysis of Escherichia coli and Enterococcus spp. levels along a Pennsylvania creek [18]. To our knowledge, EOF analysis has not been used to analyze patterns of enteric pathogens across several water bodies. The spatiotemporal dynamics of microbial water quality are affected by many environmental factors that can manifest the superposition of several spatial patterns. Hence, the EOF method may be preferable to the MRD method in microbial water quality studies.
Weather provides strong controls for the fate and transport of enteric pathogens. In particular, the weather was shown to affect S. enterica and L. monocytogenes populations in surface waters [7,19,20,21,22]. Previous studies have shown that precipitation and storm events may drive pathogens into waterways from agricultural and urban land [23,24]. Some studies have suggested that the prevalence of pathogens may change after precipitation and storm events when they are released from sediments in water [25,26]. Correlations were established between rainfall events and the prevalence of Salmonella in stream water [19]. Several other studies showed that levels of Salmonella in pond water increased after rain events [20,21,22]. Similarly, Listeria monocytogenes levels also increased after storm events in Austria [7]. To our knowledge, no attempt has been made so far to relate spatial weather patterns to spatial patterns in pathogen concentrations.
Salmonella enterica and Listeria monocytogenes were detected at quantifiable levels in streams and ponds of Maryland and Delaware [27,28,29]. The availability of the monitoring dataset [28] and weather data allowed us to set the objectives of this study as (i) use EOF analysis to explore the persistent spatial patterns of Salmonella enterica and Listeria monocytogenes concentrations at four different sites (two ponds, two streams) in Maryland and Delaware over a two-year period (2016–2018) and (ii) compare persistent patterns of precipitation and pathogen concentrations.

2. Materials and Methods

2.1. Experimental Data

Experimental data from this study were collected from a previous study determining the quantitative levels of Listeria monocytogenes and Salmonella enterica at four sites representing two types of irrigation water sources (streams and ponds) [28]. More details on the sites can be found in previous work in which water from those sites was analyzed for Shiga-toxigenic E. coli [30] and E. coli, Enterococcus spp., and Aeromonas spp. [31]. Detailed descriptions of the quantitative recovery and isolation of Salmonella spp. and Listeria monocytogenes can be found in [28]. The frequency of the collection and the total number of water samples collected, along with more specific information about their location, can be found in previously published work [28,30,31]. Briefly, 0.1 L, 1 L, and 10 L of water (in triplicate) were filtered through modified Moore swabs (MMS) at each sampling event. MMS of each triplicate volume were analyzed for the presence of S. enterica or L. monocytogenes. Levels of S. enterica and L. monocytogenes at each site on each date were quantified using a Most Probable Number assay (MPN/L), leading to a total of 9 samples for each MPN/L determination. The description of the culture methods used to recover presumptive L. monocytogenes and S. enterica, along with the polymerase chain reaction (PCR) methods used for confirmation of these pathogens, were published previously in detail [28]. The dataset collected was also published as supplementary material in the previous publication [28].
More details on land use and cover were obtained from the USDA-NASS database [32]. The Cropland Data Layer (CDL) is a crop-specific land cover data layer that is created every year for the continental United States using moderate resolution satellite imagery and extensive agricultural ground truth. LU/LC (land use/land cover) data were collected for each sampling site as both percentages and area (in square kilometers). For stream samples, the LU/LC data were collected for the watershed; for ponds, the LU/LC data were collected for areas within 1 km surrounding the pond. The land use dataset is characterized in the Supplementary Table S1.
Cumulative precipitation amounts for one-day (Rain1) and seven-day (Rain7) periods before sampling were retrieved from weather underground (www.wunderground.com, accessed on 29 May 2022) for weather stations within 5 km of the sampling sites. Supplementary Table S2 shows the summary of rainfall from the four sampling sites during the two-year period of water collection and analysis.

2.2. Empirical Orthogonal Function Analysis and Statistical Computations

EOF analysis is the technique that uses the time series of the environmental variable of interest measured at several locations to find persistent spatial patterns in deviations from the average across all locations. Let Z(s,t) be the variable of interest; s is the number of the location; t is the observation time. The EOF analysis finds the set EOFs (empirical orthogonal functions) EOF1(s), EOF2(s), EOF3(s), etc., that depend only on the location number s, and the expansion coefficients EC1(t), EC2(t), EC3(t), etc., that depend only on time. The EOFs are the sought persistent spatial patterns.
The EOFs and the expansion coefficients are found to meet two requirements. The first requirement is that at any location s at any time t, the deviation of the variable of interest Z(s,t) from the average across all locations (Z(t)) at the time t can be presented as the sum:
Z s , t Z ¯ t = EOF 1 s * EC 1 t + EOF 2 s * EC 2 t + EOF 3 s * EC 3 t +
The second requirement is that the first EOF, i.e., EOF1(s), has to explain as much variability in Z s , t Z ¯ t ) as possible, the second EOF has to explain as much as possible of variability in Z s , t Z ¯ t left unexplained by EOF1. The third EOF has to explain as much variability as possible left unexplained by EOF1 and EOF2, etc. This is accomplished by using mathematical operations with matrices [11]. The ‘eof’ function in R was used for computations.
In this study, one EOF analysis was applied to model the spatial and temporal variability of L. monocytogenes, and S. enterica levels; another EOF analysis was conducted to examine the spatial and temporal variability of Rain1 and Rain7.
The point biserial correlation coefficients [33] were computed between the prevalence values of pathogens (0—absent; 1—present) and the rainfall data. The non-parametric Mann–Whitney test was used to compare the distributions of pathogen levels in growing and non-growing seasons at the significance level of 0.05. The R version 3.5.3 (https://cran.r-project.org/bin/windows/base/old/3.5.3/, accessed on 29 May 2022) was used for the statistical analysis.

3. Results and Discussions

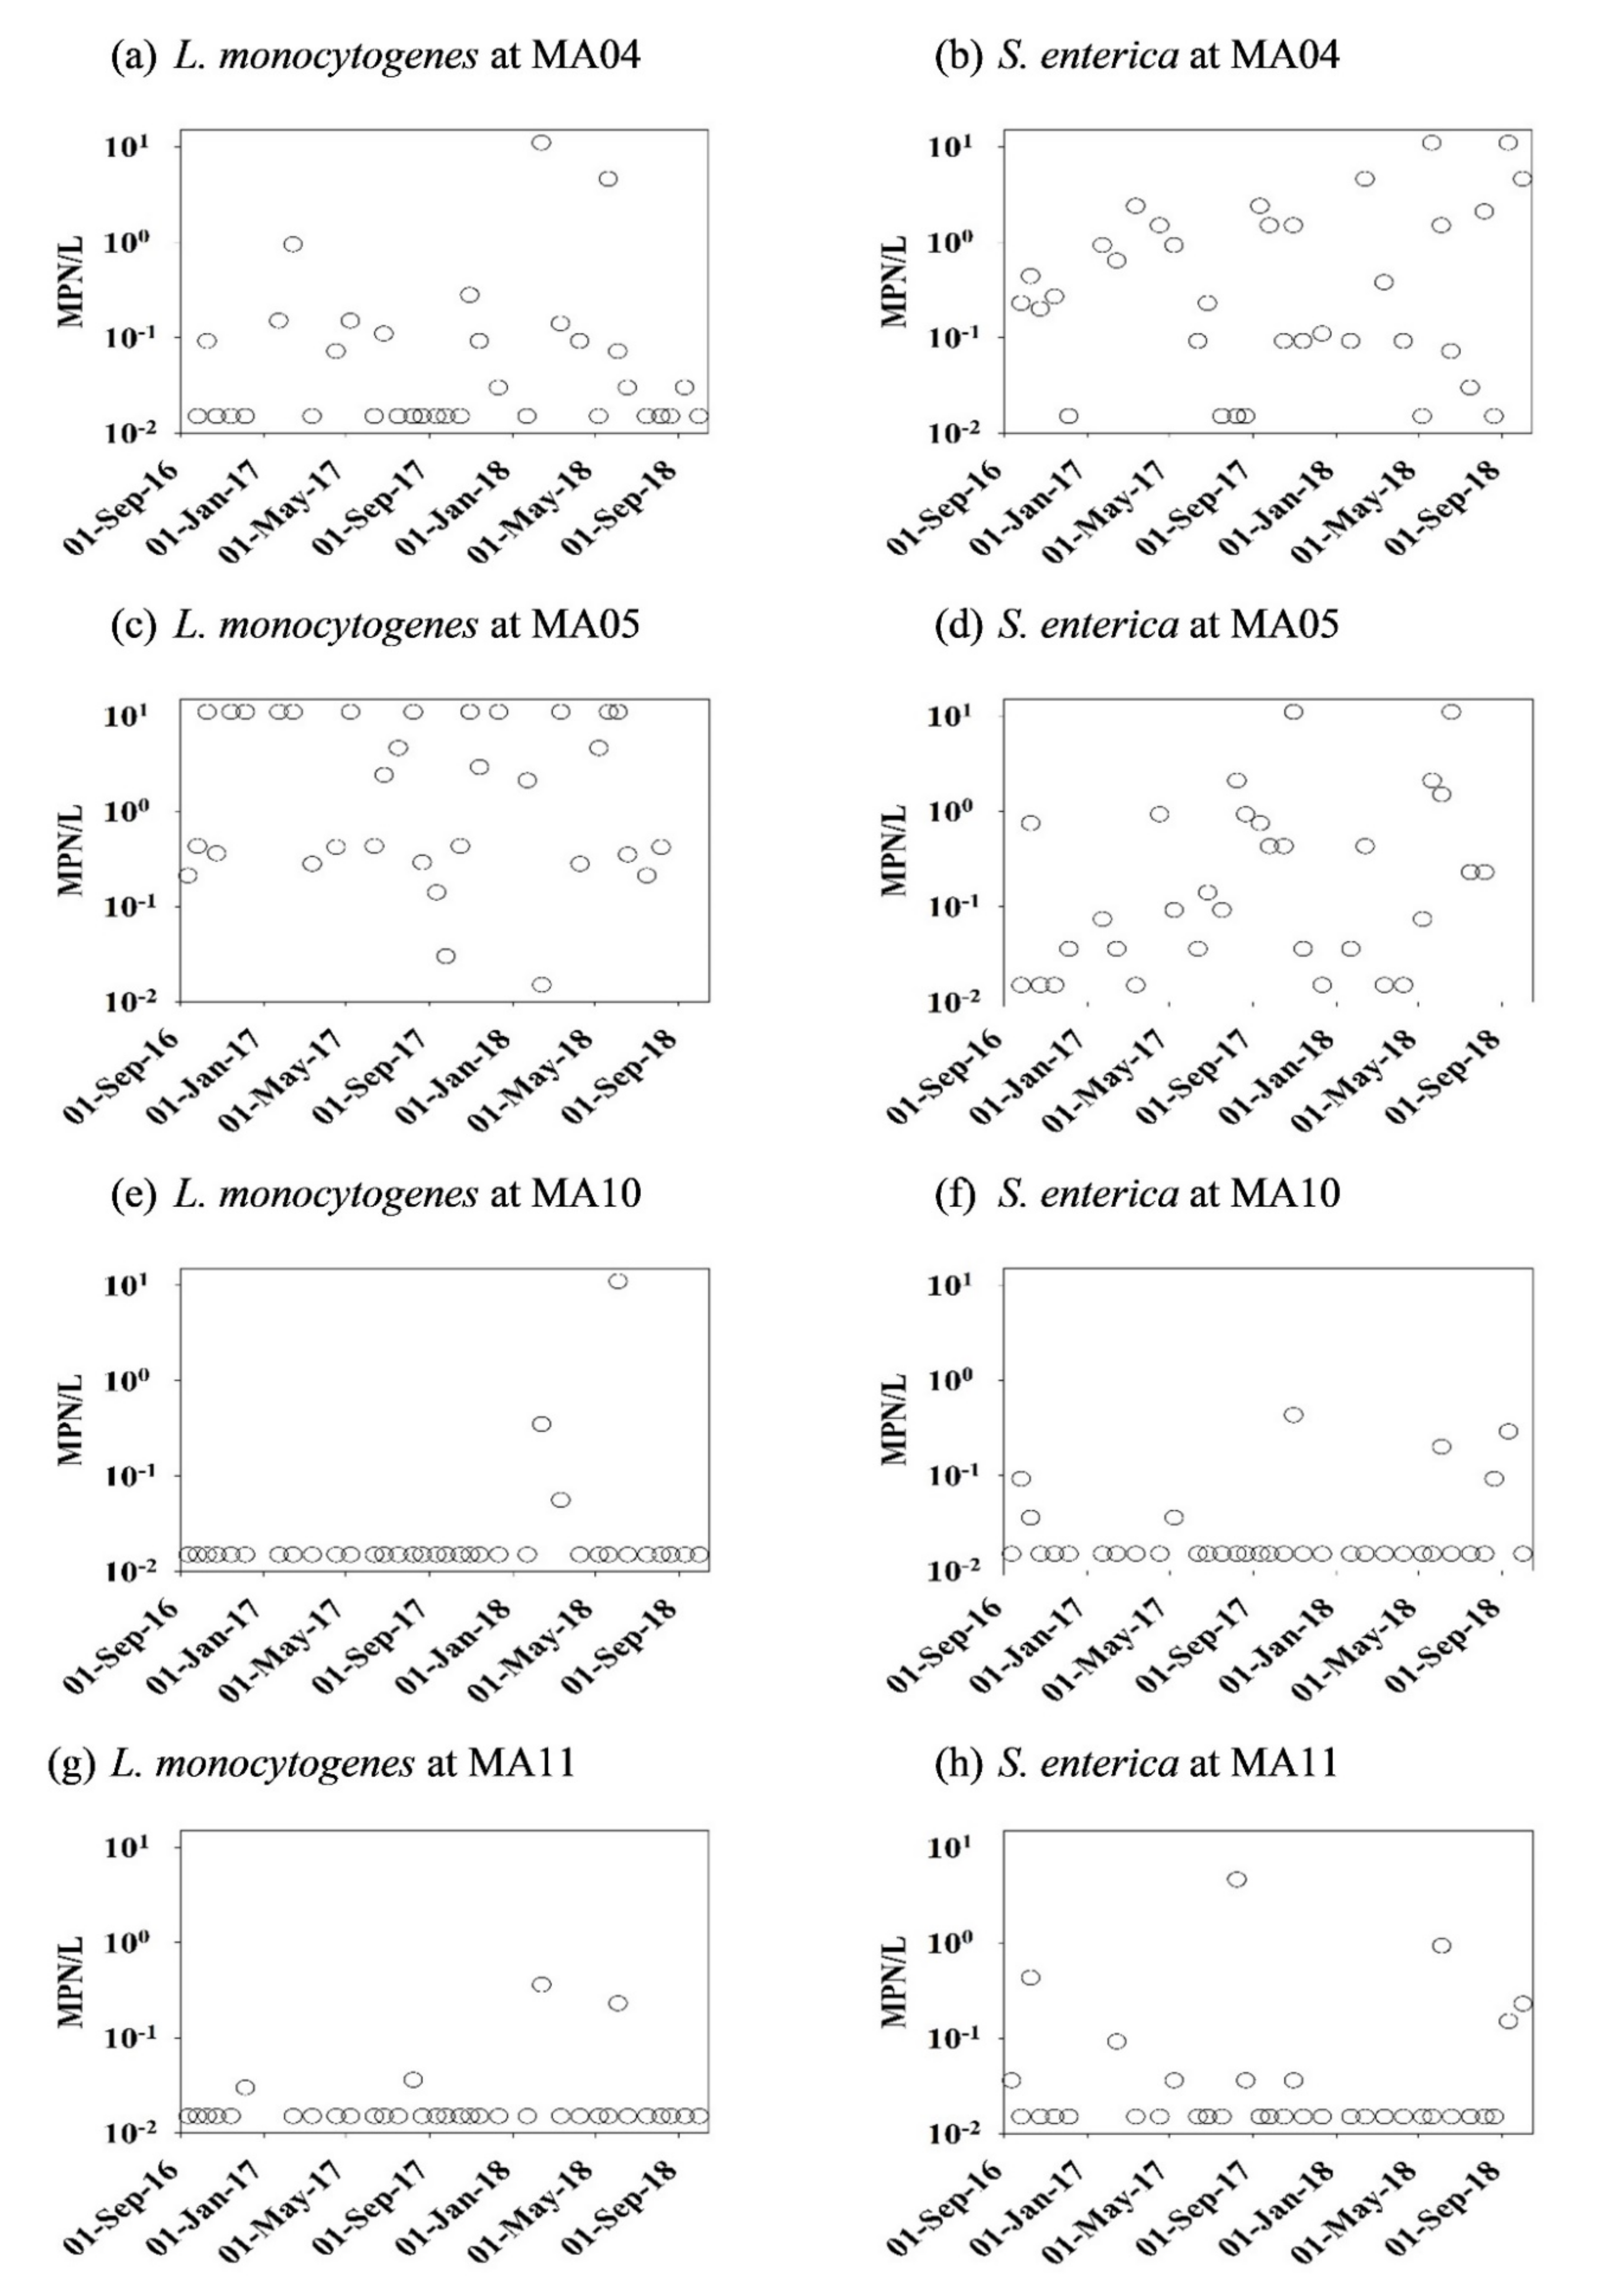
3.1. The Dataset Overview

The concentrations (MPN/L) of L. monocytogenes and S. enterica at each sampling date by month over two years are shown in Figure 1. Over the entire observation period, the mean concentration value of L. monocytogenes at MA05 was significantly (p < 0.05) higher than at the other three sampling sites (MA04, MA10, and MA11). S. enterica levels were significantly greater in stream water (1.29 MPN/L at MA04 and 1.08 MPN/L at MA05) compared to pond water sites (0.05 MPN/L at MA10 and 0.20 MPN/L at MA11). S. enterica levels measured in ponds agree with results from [34]. In that work, S. enterica values in the ponds were relatively low (geometric mean 0.3 MPN/L). Conditions in ponds appear to be less conducive for the survival of S. enterica and L. monocytogenes.
The mean levels of pathogens and prevalence data by season are shown in Table 1. The prevalence of both pathogens was higher in stream water samples (sites MA04 and MA05) than in pond samples (sites MA10 and MA11). These results can be partially explained by the fact that pathogens can be more readily exposed to solar UV radiation in shallow and slow-flowing pond waters than in streams. The prevalence of L. monocytogenes was higher in the non-growing season at all sampling sites except at stream site MA05. A similar seasonality was observed in Nova Scotia, Canada, where the prevalence of L. monocytogenes in surface waters was higher in winter (72%) in comparison to summer (55%) months [35]. Analogous results were reported in [36]. In that work, the prevalence of L. monocytogenes along the Salinas River in California was found greater in the winter and spring, and lower in the fall. L. monocytogenes prevalence in water was higher during colder seasons in agricultural regions in New York [21].
No significant differences in L. monocytogenes and S. enterica levels were observed between the non-growing season (cold season) and growing season (warm season) at each sampling site. These results agree with Southern Ontario and New York reports, where Salmonella levels did not significantly differ by season [37,38]. Studies in other US geographic regions showed that the prevalence of Salmonella in surface water in California followed a noticeable seasonal trend [36,39]. Similarly, S. enterica levels were significantly higher during warmer seasons than during colder seasons in stream water samples from the Suwannee River basin in Georgia [19].
Correlation analysis between rainfall and prevalence of pathogen for each sampling site yielded a biserial correlation coefficient for L. monocytogenes in ponds versus streams (Table 2). L. monocytogenes prevalence positively correlated with rainfall in ponds but not in streams. That may be related to the proximity of ponds to the agricultural lands and the resulting pathogen transport in runoff to ponds. We note that the effect of direct runoff from farmlands on the L. monocytogenes prevalence was suggested earlier by [40,41] based on observations at streams of different orders. Streams MA04 and MA05 were likely not directly affected by the agricultural runoff. The prevalence of L. monocytogenes was probably affected by the dilution effect that manifested itself in a negative biserial correlation (Table 2). This assumption is supported by the fact that a significant negative correlation of the L. monocytogenes prevalence was observed with the Rain1 but not with the Rain7, as the dilution should be affected by the recent precipitation rather than weekly cumulative precipitation for a week. Salmonella prevalence correlated with precipitation in streams much better than in ponds. One of the reasons for such a relationship can be the strong effect of bottom sediment disturbance at high flows on the Salmonella spp prevalence. Bottom sediment was shown to be a possible substantial source of Salmonella spp. in agricultural and forested watersheds [40]). The higher correlation of the Salmonella prevalence with Rain1 compared with Rain7 supports the assumption of the role of sediment disturbance in increased Salmonella prevalence in streams after rainfall events.

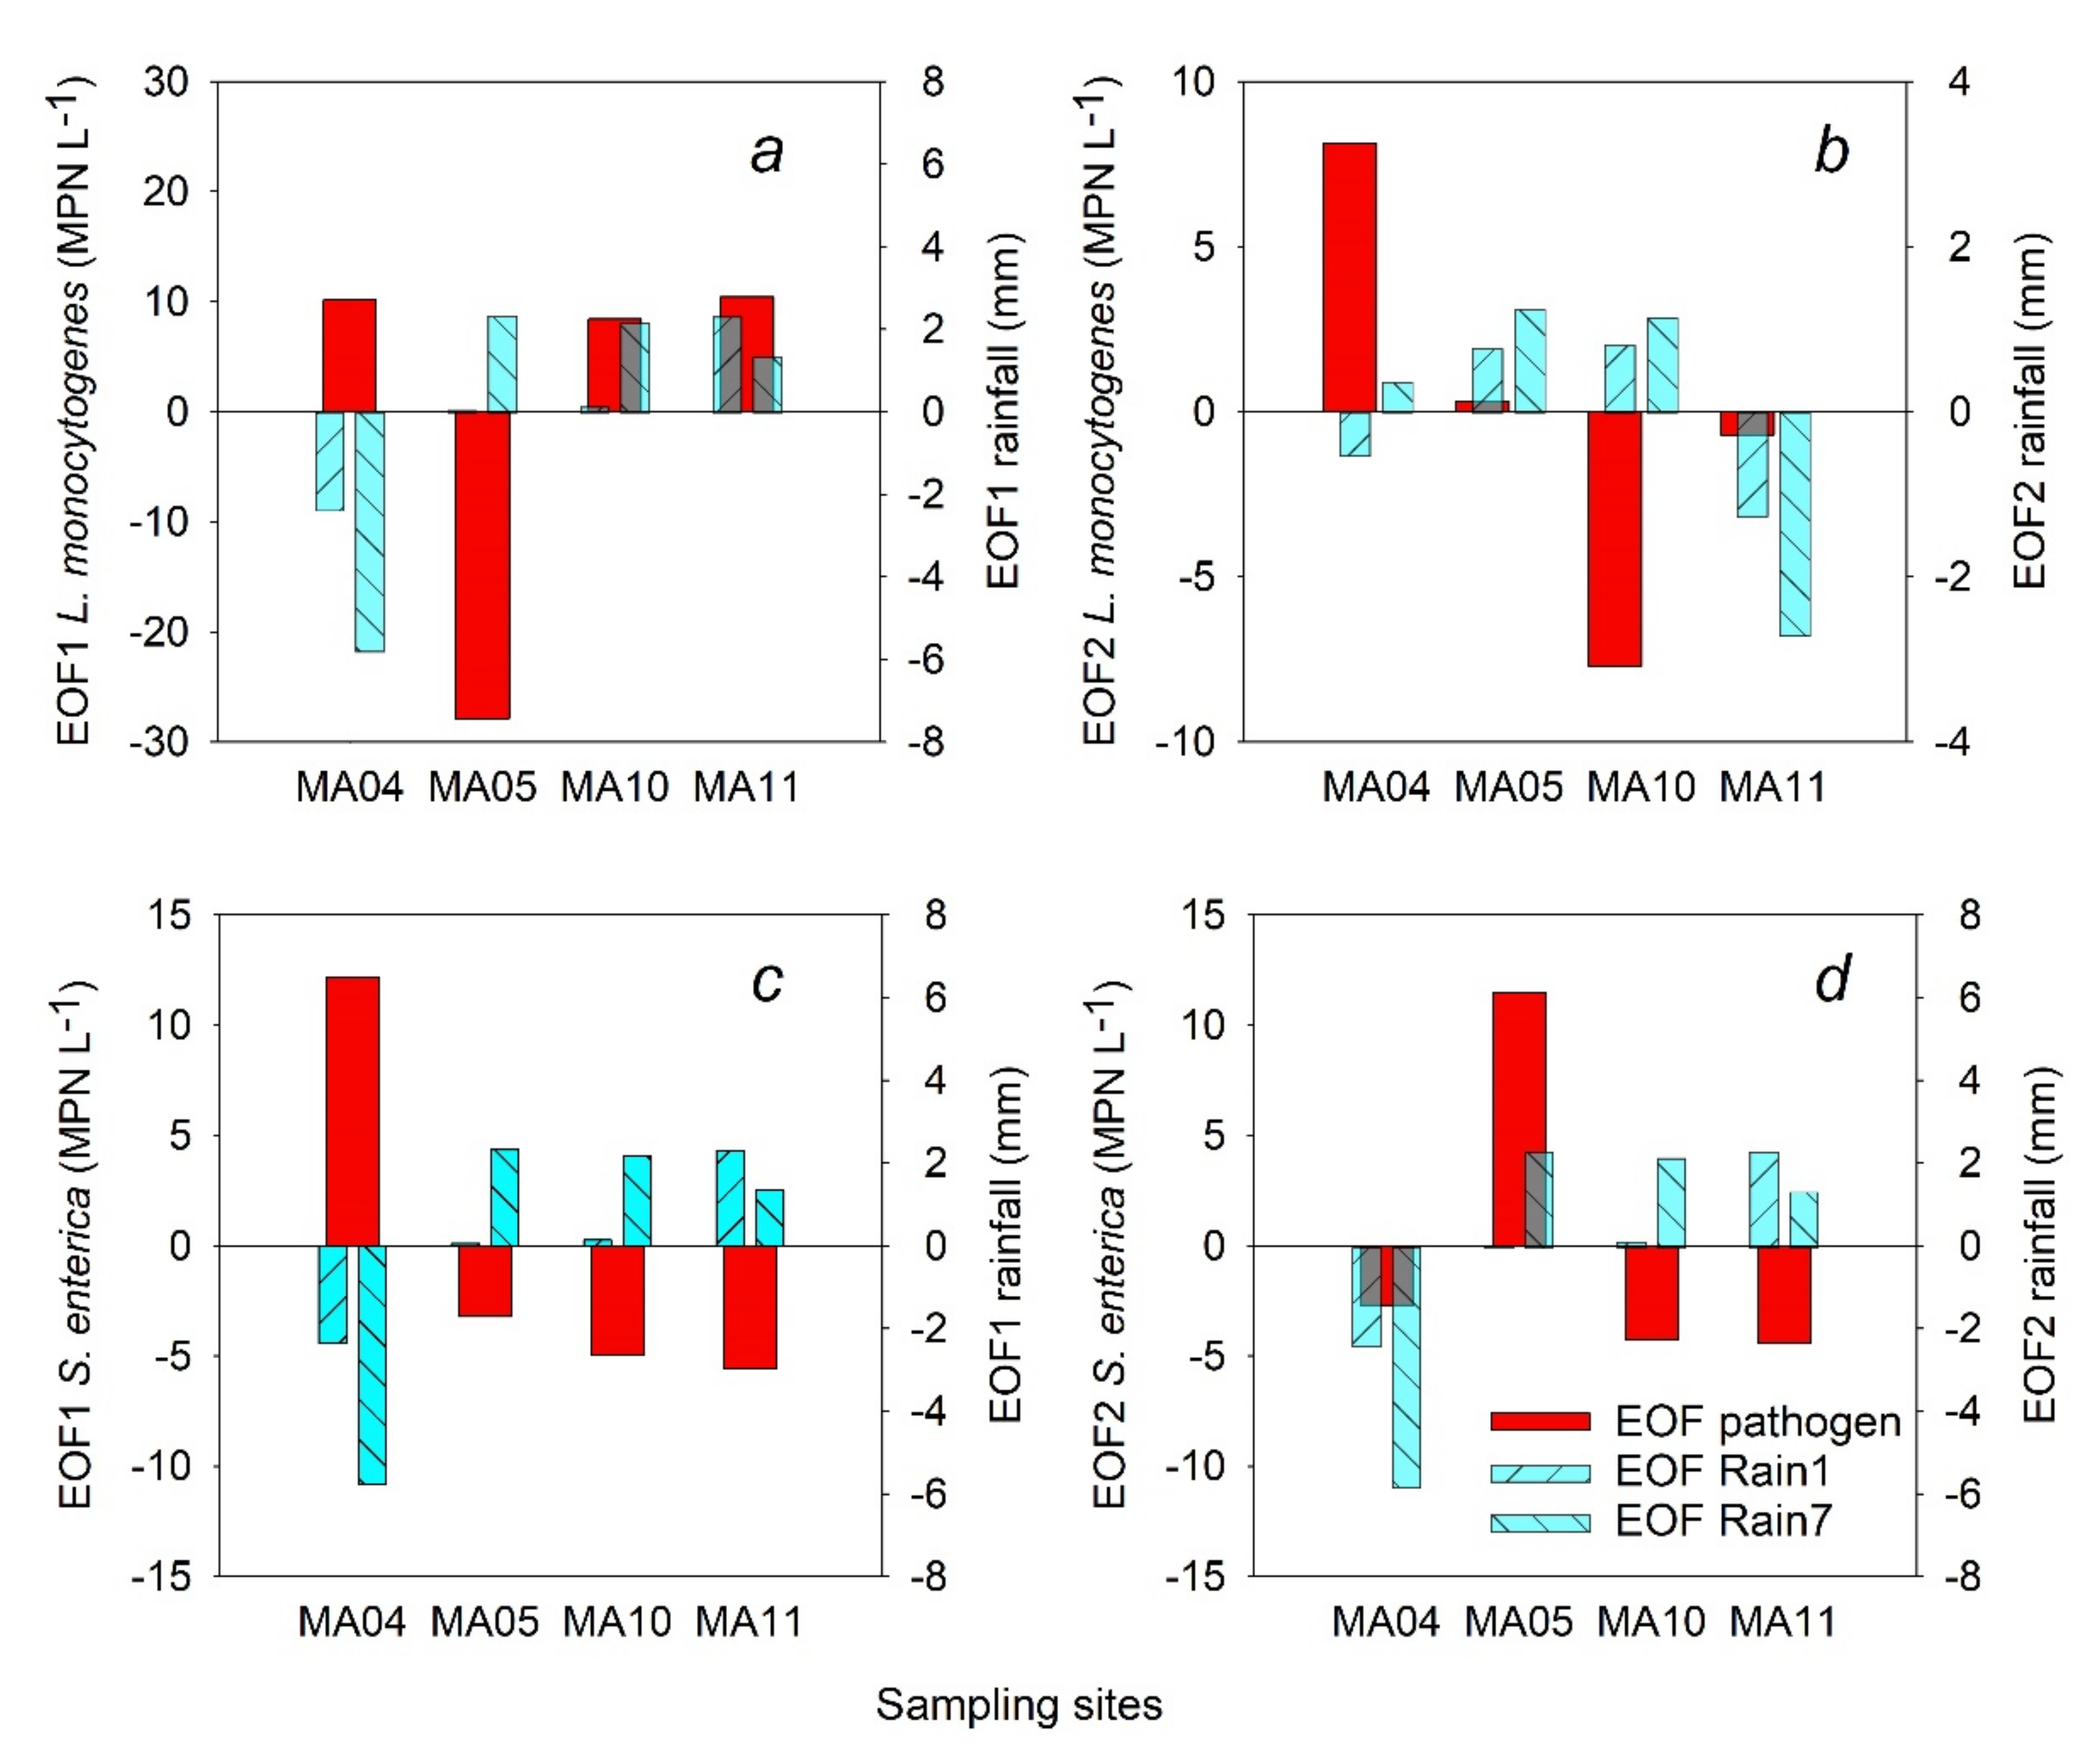
3.2. Empirical Orthogonal Functions

For L. monocytogenes concentrations, EOF1 (Figure 2a) and EOF2 (Figure 2b) explained 84.4% and 9.7%, respectively, of the variance of the deviations from the average. For Rain1, EOF1 explained 78.5% (Figure 2a) and EOF2 explained 19.1% (Figure 2b) of the variance of deviations from average. Similarly, EOF1 and EOF2 for Rain7 explained 79.2% and 18.7% of the variance, respectively (Figure 2).
The EOF1 values of Rain1 and Rain7 had the same signs at each of the four sites (Figure 2). Hence, deviations of the accumulated rainfall from the average were similar over the observation time for one-day and seven-day rainfall accumulation. The MA04 site had deviations opposite to the deviations at the other three sites. The L. monocytogenes EOF1 had similar signs as precipitation (Rain1, Rain7) at pond sites but was opposite to precipitation at the stream sites. These findings indicate that levels of L. monocytogenes potentially could be associated with rainfall at pond sites across the study area. On the contrary, there was no similarity in signs of L. monocytogenes levels and rainfall values at the stream sites MA04 and MA05. While the EOF1 value for L. monocytogenes at MA05 was negative, the EOF1 value for L. monocytogenes from all other sampling sites was positive. These results indicate different fate and transport mechanisms and possibly different sources of L. monocytogenes at the stream site MA05 compared to stream MA04 or pond MA10 or MA11 sites. Comparison of absolute values of EOF1 shows that the levels of L. monocytogenes at the MA05 sampling site were mostly greater than the average across all sampling sites and were influenced more by sampling-site specific characteristics than by rainfall.
EOF1 and EOF2 values for S. enterica and rainfall are presented in Figure 2. EOF1 (Figure 2c) and EOF2 (Figure 2d) values for S. enterica explained 50.8% and 45.0% of the spatial variance of deviations from average, respectively. S. enterica concentration distributions across all the sites follow a more complex spatial pattern compared to survival patterns of L. monocytogenes. For S. enterica levels, two equally important patterns (EOF1, EOF2) needed to account for most of the variability (95.8%). In contrast, only a single pattern described by one EOF (EOF1) accounts for the majority (84.4%) of the variance for L. monocytogenes levels (Figure 2).
The EOF1 value for S. enterica at the stream site MA04 was positive, while EOF1 values for other sampling sites were all negative (Figure 2c), indicating that MA04 had higher Salmonella levels than stream site MA05 and pond sites MA10 and MA11. EOF1 values for rainfall (Rain1, Rain7) showed the opposite pattern to S. enterica values across all sampling sites. Interpretation of all these results indicates that at least 50% of the concentration deviations variance may not be rainfall related. However, the remaining deviation variance explained by EOF2 appears to be associated with rainfall. S. enterica and rainfall EOF2 values have the same signs at MA04 (negative), MA05 (positive), and MA11 (positive) (Figure 2c).
Spatial patterns of deviations from average values were different for S. enterica and L. monocytogenes, implying that sources of the two pathogens and potentially dominant processes of their fate, transport, and survival in the studied water bodies are different. Aside from inherent differences in ecophysiology between the two taxa, the possible reasons for different EOF patterns between L. monocytogenes and S. enterica across monitoring sites may be related to differences in surrounding land use at these sampling sites. Cropland (barley/soybeans, corn, soybeans, and winter wheat) covered approximately 60% of the land near MA04. The dominant land use type (65%) in MA05 is deciduous and evergreen forests (Table S1). The dominant forest area land cover may account for the high prevalence and levels of L. monocytogenes at MA05 compared to other sampling sites. The forested area (deciduous and evergreen forests) surrounding MA05 is about six times greater than the forested areas around MA04 (65.4% vs. 11.38%, Table S1). The physical canopy created by the trees in the forest may help maintain reduced water temperature values at MA05 compared to other sites by shielding the water from sunlight, leading to colder water temperature, and promoting the higher prevalence and levels of L. monocytogenes [28,36]. Forested areas may also support more wildlife (deer) reported as a reservoir for L. monocytogenes [41]. Proximity to forest, pasture, scrublands, water, and wetlands were significantly associated with Listeria-positive samples by univariable analysis [42]. The MA05 site was located in an area partially covered with wetlands. Such environments had areas with high soil water contents, which was found to be conducive to L. monocytogenes prevalence [43,44,45].
The values of the explained variance for EOF1 and EOF2 for S. enterica were essentially equivalent, indicating that a dominant factor shaping S. enterica distribution was not evident in the data analyzed. Other work characterizing Salmonella in a stream watershed showed an association between volume of flow and Salmonella prevalence, indicating that factors beyond land use and rainfall type may influence S. enterica prevalence [46]. Prevalence of Salmonella was reported in four different watersheds in the eastern part of North Carolina forming part of the White Oak River Basin [47]; the prevalence was highest in residential or industrial areas (58.8%), followed by forests (57.1%) and crop agriculture (50%) [47]. Salmonella enterica levels in water may be affected by agricultural practices such as using untreated manure as organic fertilizer, contributing to contaminated runoff to water bodies [48]. Other reports have shown that soil runoff containing organic fertilizers (heat-treated poultry pellets) can support Salmonella growth in water [49], and that soils amended with synthetic and heat-treated or composted organic fertilizers were contaminated with Salmonella as well [50]. In addition to the agricultural land use proximate to MA05, there was also relatively high wetlands land cover (17.7%), which may support wildlife (including avian, amphibian, and reptile populations), and these animals are known contributors to the S. enterica burden in this stream [51,52].
As in any study, the analysis of the data we present here is limited by the number of sampling sites and the frequency of microbial analysis from the sampling sites. However, the application of EOF shows that the survival patterns of pathogens can be characterized by a single method for a better understanding of the likelihood of contamination.

4. Conclusions

This study investigated the spatial and temporal patterns of L. monocytogenes and S. enterica using data at four sites (two stream and two pond sites) in the Mid-Atlantic United States over two years. The empirical orthogonal function (EOF) analysis presented the spatial patterns of both pathogen levels and rainfall amounts. A single dominant pattern was found for L. monocytogenes levels across these sites. Spatial patterns of L. monocytogenes were more clearly identified and appeared closely related to land use type; however, Salmonella enterica levels across the sites were explained by a more complex relationship between rainfall and S. enterica levels, where the variations in pathogen levels closely tracked variations in rainfall. Uncovering spatial patterns of pathogens variability is worthwhile for monitoring locations to investigate microbial water quality among irrigation water sources.

Supplementary Materials

The following supporting information can be downloaded at: https://www.mdpi.com/article/10.3390/app12157526/s1, Table S1: Distribution of land use/land cover type (%) across sampling locations; Table S2: Rainfall amounts (mm) for the one day (Rain1) or seven days (Rain7) preceding sampling events for S. enterica or L. monocytogenes at four sites.

Author Contributions

Conceptualization, Y.P.; methodology, S.K., Y.P. and M.S.; formal analysis, S.K. and Y.P.; investigation, S.K.; resources, M.P., M.N.-A., S.A.M., R.E.R.G., F.H., S.P., A.S., A.R.S. and A.S.; data curation, M.P. and M.N.-A.; writing—original draft preparation, S.K.; writing—review and editing, Y.P., M.S., M.N.-A., K.K., S.A.M., R.E.R.G., F.H., S.P., A.S. and A.S.; supervision, Y.P. and M.S. All authors have read and agreed to the published version of the manuscript.

Funding

This work was funded by the U.S. Department of Agriculture, Agricultural Research Service Project “Improving Pre-harvest Produce Safety through Reduction of Pathogen Levels in Agricultural Environments and Development and Validation of Farm-Scale Microbial Quality Model for Irrigation Water Sources” (8042-42610-001-000-D) and USDA NIFA Grant 20166800725064 project CONSERVE (Coordinating Nontraditional Sustainable watER Use in Variable climatEs): A Center of Excellence at the Nexus of Sustainable Water Reuse, Food and Health (www.conservewaterforfood.org), USDA National Institute of Food and Agriculture.

Informed Consent Statement

Not applicable.

Data Availability Statement

Data provided in the reference [28] and Supplementary Tables.

Conflicts of Interest

The authors declare no conflict of interest.

References

  1. Scallan, E.; Hoekstra, R.M.; Angulo, F.J. Foodborne illness acquired in the USA—Major pathogens. Emerg. Infect. Dis. 2011, 17, 7–15. [Google Scholar] [CrossRef] [PubMed]
  2. Greene, S.K.; Daly, E.R.; Talbot, E.A.; Demma, L.J.; Holzbauer, S.; Patel, N.J.; Hill, A.; Walderhaug, M.O.; Hoekstra, R.M.; Painter, J.A. Recurrent multistate outbreak of Salmonella Newport associated with tomatoes from contami-nated fields. Epidemiol. Infect. 2008, 136, 157–165. [Google Scholar] [CrossRef] [PubMed]
  3. Angelo, K.M.; Chu, A.; Anand, M.; Nguyen, T.A.; Bottichio, L.; Wise, M.; Williams, I.; Seelman, S.; Bell, R.; Fatica, M.; et al. Outbreak of Salmonella Newport infections linked to cucumbers—United States. MMWR Morb. Mortal. Wkly. Rep. 2015, 64, 144. [Google Scholar]
  4. Wiedmann, M.; Sauders, B. Ecology of Listeria Species and L. monocytogenes in the Natural Environment. In Food Science and Technology; Marcel Dekker: New York, NY, USA, 2007; Volume 161, p. 21. [Google Scholar]
  5. Sauders, B.D.; Overdevest, J.; Fortes, E.; Windham, K.; Schukken, Y.; Lembo, A.; Wiedmann, M. Diversity of Listeria Species in Urban and Natural Environments. Appl. Environ. Microbiol. 2012, 78, 4420–4433. [Google Scholar] [CrossRef] [PubMed] [Green Version]
  6. Ferreira, V.B.; Wiedmann, M.; Teixeira, P.; Stasiewicz, M.J. Listeria monocytogenes Persistence in Food-Associated Environments: Epidemiology, Strain Characteristics, and Implications for Public Health. J. Food Prot. 2014, 77, 150–170. [Google Scholar] [CrossRef]
  7. Linke, K.; Rückerl, I.; Brugger, K.; Karpiskova, R.; Walland, J.; Muri-Klinger, S.; Tichy, A.; Wagner, M.; Stessl, B. Reservoirs of Listeria Species in Three Environmental Ecosystems. Appl. Environ. Microbiol. 2014, 80, 5583–5592. [Google Scholar] [CrossRef] [PubMed] [Green Version]
  8. Chhetri, V.S.; Janes, M.E.; King, J.M.; Doerrler, W.; Adhikari, A. Effect of residual chlorine and organic acids on survival and attachment of Escherichia coli O157: H7 and Listeria monocytogenes on spinach leaves during storage. LWT 2019, 105, 298–305. [Google Scholar] [CrossRef]
  9. McCollum, J.T.; Cronquist, A.B.; Silk, B.J.; Jackson, K.A.; O’Connor, K.A.; Cosgrove, S.; Gossack, J.P.; Parachini, S.S.; Jain, N.S.; Ettestad, P.; et al. Multistate Outbreak of Listeriosis Associated with Cantaloupe. N. Engl. J. Med. 2013, 369, 944–953. [Google Scholar] [CrossRef] [Green Version]
  10. Vereecken, H.; Pachepsky, Y.; Simmer, C.; Rihani, J.; Kunoth, A.; Korres, W.; Graf, A.; Franssen, H.-H.; Thiele-Eich, I.; Shao, Y. On the role of patterns in understanding the functioning of soil-vegetation-atmosphere systems. J. Hydrol. 2016, 542, 63–86. [Google Scholar] [CrossRef]
  11. Hannachi, A.; Jolliffe, I.T.; Stephenson, D.B. Empirical orthogonal functions and related techniques in atmos-pheric science: A review. Int. J. Climatol. 2007, 27, 1119–1152. [Google Scholar] [CrossRef]
  12. Navarra, A.; Simoncini, V. A Guide to Empirical Orthogonal Functions for Climate Data Analysis; Springer Science & Business Media: Berlin/Heilderberg, Germany, 2010. [Google Scholar] [CrossRef]
  13. Roundy, P.E. On the Interpretation of EOF Analysis of ENSO, Atmospheric Kelvin Waves, and the MJO. J. Clim. 2015, 28, 1148–1165. [Google Scholar] [CrossRef]
  14. Lian, T.; Chen, D. An Evaluation of Rotated EOF Analysis and Its Application to Tropical Pacific SST Variability. J. Clim. 2012, 25, 5361–5373. [Google Scholar] [CrossRef]
  15. Yue, W.; Meng, K.; Hou, K.; Zuo, R.; Zhang, B.T.; Wang, G. Evaluating climate and irrigation effects on spati-otemporal variabilities of regional groundwater in an arid area using EOFs. Sci. Total Environ. 2020, 709, 136147. [Google Scholar] [CrossRef]
  16. Korres, W.; Koyama, C.N.; Fiener, P.; Schneider, K. Analysis of surface soil moisture patterns in agricultural landscapes using Empirical Orthogonal Functions. Hydrol. Earth Syst. Sci. 2010, 14, 751–764. [Google Scholar] [CrossRef] [Green Version]
  17. Kim, S.; Daughtry, C.; Russ, A.; Pedrera-Parrilla, A.; Pachepsky, Y. Analysis of Spatiotemporal Variability of Corn Yields Using Empirical Orthogonal Functions. Water 2020, 12, 3339. [Google Scholar] [CrossRef]
  18. Jeon, D.J.; Pachepsky, Y.; Harriger, D.; Picard, R.; Coppock, C.; Wells, E.; Hong, E.-M. Analysis of Escherichia coli and Enterococci Concentrations Patterns in a Pennsylvania Creek Using Empirical Orthogonal Functions. J. Environ. Qual. 2019, 48, 1703–1710. [Google Scholar] [CrossRef]
  19. Haley, B.J.; Cole, D.J.; Lipp, E.K. Distribution, Diversity, and Seasonality of Waterborne Salmonellae in a Rural Watershed. Appl. Environ. Microbiol. 2009, 75, 1248–1255. [Google Scholar] [CrossRef] [Green Version]
  20. Walters, S.P.; Thebo, A.L.; Boehm, A.B. Impact of urbanization and agriculture on the occurrence of bacterial pathogens and stx genes in coastal waterbodies of central California. Water Res. 2011, 45, 1752–1762. [Google Scholar] [CrossRef]
  21. Strawn, L.K.; Fortes, E.D.; Bihn, E.A.; Nightingale, K.K.; Gröhn, Y.T.; Worobo, R.W.; Wiedmann, M.; Bergholz, P.W. Landscape and Meteorological Factors Affecting Prevalence of Three Food-Borne Pathogens in Fruit and Vegetable Farms. Appl. Environ. Microbiol. 2013, 79, 588–600. [Google Scholar] [CrossRef] [Green Version]
  22. Harris, C.S.; Tertuliano, M.; Rajeev, S.; Vellidis, G.; Levy, K. Impact of storm runoff on Salmonella and Escherichia coli prevalence in irrigation ponds of fresh produce farms in southern Georgia. J. Appl. Microbiol. 2018, 124, 910–921. [Google Scholar] [CrossRef]
  23. Lipp, E.K.; Schmidt, N.; Luther, M.E.; Rose, J.B. Determining the Effects of El Nino-Southern Oscillation Events on Coastal Water Quality. Estuaries 2001, 24, 491–497. [Google Scholar] [CrossRef]
  24. Martinez-Urtaza, J.; Saco, M.; de Novoa, J.; Perez-Piñeiro, P.; Peiteado, J.; Lozano-Leon, A.; Garcia-Martin, O. Influence of environmental factors and human activity on the presence of Salmonella serovars in a marine environment. Appl. Environ. Microbiol. 2004, 70, 2089–2097. [Google Scholar] [CrossRef] [Green Version]
  25. Crabill, C.; Donald, R.; Snelling, J.; Foust, R.; Southam, G. The impact of sediment fecal coliform reservoirs on seasonal water quality in Oak Creek, Arizona. Water Res. 1999, 33, 2163–2171. [Google Scholar] [CrossRef]
  26. Pandey, P.; Soupir, M.L.; Wang, Y.; Cao, W.; Biswas, S.; Vaddella, V.; Pasternack, G. Water and sediment microbial quality of mountain and agricultural streams. J. Environ. Qual. 2018, 47, 985–996. [Google Scholar] [CrossRef] [PubMed] [Green Version]
  27. Callahan, M.T.; Van Kessel, J.A.; Micallef, S.A. Salmonella enterica recovery from river waters of the Maryland Eastern Shore reveals high serotype diversity and some multidrug resistance. Environ. Res. 2019, 168, 7–13. [Google Scholar] [CrossRef]
  28. Sharma, M.; Handy, E.T.; East, C.L.; Kim, S.; Jiang, C.; Callahan, M.T.; Allard, S.M.; Micallef, C.; Anderson-Coughlin, B.; Gartley, S.; et al. Prevalence of Salmonella and Listeria monocytogenes in non-traditional irrigation waters in the Mid-Atlantic United States is affected by water type, season, and recovery method. PLoS ONE 2020, 5, e0229365. [Google Scholar] [CrossRef]
  29. Truitt, L.N.; Vazquez, K.M.; Pfuntner, R.C.; Rideout, S.L.; Havelaar, A.H.; Strawn, L.K. Microbial Quality of Agricultural Water Used in Produce Preharvest Production on the Eastern Shore of Virginia. J. Food Prot. 2018, 81, 1661–1672. [Google Scholar] [CrossRef] [PubMed]
  30. Haymaker, J.R.; Sharma, M.; Parveen, S.; Hashem, F.; May, E.B.; Handy, E.T.; White, C.; East, C.; Bradshaw, R.; Micallef, S.A.; et al. Prevalence of shi-ga-toxigenic and atypical enteropathogenic Escherichia coli in untreated surface water and reclaimed water in the Mid-Atlantic U.S. Environ. Res. 2019, 172, 630–636. [Google Scholar] [CrossRef]
  31. Sultana, S.; Theresa, C.M.; Chengsheng, J.; Eric, H.; Cheryl, E.; Joseph, H.; Bui, A.; Craddock, H.; Murray, R.; Kulkurni, P.; et al. A longitudinal assessment of Escherichia coli, total coliforms, Enterococcus and Aeromonas spp. dynamics in alternative irrigation water sources: A CONSERVE study. Appl. Environ. Microbiol. 2020, 86, 1098–5336. [Google Scholar]
  32. Cropland Data Layer Database, USDA-NASS 2020. Available online: https://nassgeodata.gmu.edu/CropScape/ (accessed on 29 May 2022).
  33. Glass, G.V.; Hopkins, K.D. Statistical Methods in Education and Psychology, 3rd ed.; Allyn & Bacon: Boston, MA, USA, 1995. [Google Scholar]
  34. Luo, Z.; Gu, G.; Ginn, A.; Giurcanu, M.C.; Adams, P.; Vellidis, G.; van Bruggen, A.H.C.; Danyluk, M.D.; Wright, A.C. Distribution and Characterization of Salmonella enterica Isolates from Irrigation Ponds in the Southeastern United States. Appl. Environ. Microbiol. 2015, 81, 4376–4387. [Google Scholar] [CrossRef] [PubMed] [Green Version]
  35. Stea, E.C.; Purdue, L.M.; Jamieson, R.C.; Yost, C.K.; Hansen, L.T. Comparison of the Prevalences and Diversities of Listeria Species and Listeria monocytogenes in an Urban and a Rural Agricultural Watershed. Appl. Environ. Microbiol. 2015, 81, 3812–3822. [Google Scholar] [CrossRef] [Green Version]
  36. Cooley, M.B.; Quiñones, B.; Oryang, D.; Mandrell, R.E.; Gorski, L. Prevalence of shiga toxin producing Escherichia coli, Salmonella enterica, and Listeria monocytogenes at public access watershed sites in a California Central Coast agricultural region. Front. Cell. Infect. Microbiol. 2014, 4, 30. [Google Scholar] [CrossRef] [Green Version]
  37. Lu, Z.; Lapen, D.; Scott, A.; Dang, A.; Topp, E. Identifying Host Sources of Fecal Pollution: Diversity of Escherichia coli in Confined Dairy and Swine Production Systems. Appl. Environ. Microbiol. 2005, 71, 5992–5998. [Google Scholar] [CrossRef] [PubMed] [Green Version]
  38. Nightingale, K.K.; Schukken, Y.H.; Nightingale, C.R.; Fortes, E.D.; Ho, A.J.; Her, Z.; Grohn, Y.T.; McDonough, P.L.; Wiedmann, M. Ecology and Transmission of Listeria monocytogenes Infecting Ruminants and in the Farm Environment. Appl. Environ. Microbiol. 2004, 70, 4458–4467. [Google Scholar] [CrossRef] [PubMed] [Green Version]
  39. Gorski, L.; Parker, C.T.; Liang, A.; Cooley, M.B.; Jay-Russell, M.T.; Gordus, A.G.; Atwill, E.R.; Mandrell, R.E. Prevalence, Distribution, and Diversity of Salmonella enterica in a Major Produce Region of California. Appl. Environ. Microbiol. 2011, 77, 2734–2748. [Google Scholar] [CrossRef] [PubMed] [Green Version]
  40. Wilkes, G.; Edge, T.; Gannon, V.; Jokinen, C.; Lyautey, E.; Neumann, N.; Ruecker, N.; Scott, A.; Sunohara, M.; Topp, E.; et al. Associations among pathogenic bacteria, parasites, and environmental and land use factors in multiple mixed-use watersheds. Water Res. 2011, 45, 5807–5825. [Google Scholar] [CrossRef]
  41. Weindl, L.; Frank, E.; Ullrich, U.; Heurich, M.; Kleta, S.; Ellerbroek, L.; Gareis, M. Listeria monocytogenes in Different Specimens from Healthy Red Deer and Wild Boars. Foodborne Pathog. Dis. 2016, 13, 391–397. [Google Scholar] [CrossRef] [PubMed]
  42. Lyautey, E.; Lu, Z.; Lapen, D.R.; Wilkes, G.; Scott, A.; Berkers, T.; Topp, E. Distribution and diversity of Escherichia coli populations in the South Nation River drainage basin, eastern Ontario, Canada. Appl. Environ. Microbiol. 2010, 76, 1486–1496. [Google Scholar] [CrossRef] [Green Version]
  43. Baudart, J.; Grabulos, J.; Barusseau, J.P.; Lebaron, P. Salmonella spp. and fecal coliform loads in coastal waters from a point vs. nonpoint source of pollution. J. Environ. Qual. 2000, 29, 241–250. [Google Scholar] [CrossRef]
  44. Weller, D.; Shiwakoti, S.; Bergholz, P.; Grohn, Y.; Wiedmann, M.; Strawn, L.K. Validation of a Previously Developed Geospatial Model That Predicts the Prevalence of Listeria monocytogenes in New York State Produce Fields. Appl. Environ. Microbiol. 2016, 82, 797–807. [Google Scholar] [CrossRef] [Green Version]
  45. Chapin, T.K.; Nightingale, K.K.; Worobo, R.W.; Wiedmann, M.; Strawn, L.K. Geographical and Meteorological Factors Associated with Isolation of Listeria Species in New York State Produce Production and Natural Environments. J. Food Prot. 2014, 77, 1919–1928. [Google Scholar] [CrossRef] [PubMed]
  46. Deaven, A.M.; Ferreira, C.M.; Reed, E.A.; See, J.R.C.; Lee, N.A.; Almaraz, E.; Rios, P.C.; Marogi, J.G.; Lamendella, R.; Zheng, J.; et al. Salmonella Genomics and Population Analyses Reveal High Inter- and Intraserovar Diversity in Freshwater. Appl. Environ. Microbiol. 2021, 87, 1–14. [Google Scholar] [CrossRef] [PubMed]
  47. Patchanee, P.; Molla, B.; White, N.; Line, D.E.; Gebreyes, W.A. Tracking Salmonella Contamination in Various Watersheds and Phenotypic and Genotypic Diversity. Foodborne Pathog. Dis. 2010, 7, 1113–1120. [Google Scholar] [CrossRef] [PubMed]
  48. Tauxe, R.; Kruse, H.; Hedberg, C.; Potter, M.; Madden, J.; Wachsmuth, K. Microbial Hazards and Emerging Issues Associated with Produce† A Preliminary Report to the National Advisory Committee on Microbiologic Criteria for Foods. J. Food Prot. 1997, 60, 1400–1408. [Google Scholar] [CrossRef] [PubMed]
  49. Shah, M.K.; Bradshaw, R.; Nyarko, E.; Millner, P.D.; Neher, D.; Weicht, T.; Bergholz, T.M.; Sharma, M. Survival and Growth of Wild-Type and rpoS-Deficient Salmonella Newport Strains in Soil Extracts Prepared with Heat-Treated Poultry Pellets. J. Food Prot. 2019, 82, 501–506. [Google Scholar] [CrossRef]
  50. Litt, P.K.; Kelly, A.; Omar, A.; Johnson, G.; Vinyard, B.T.; Kniel, K.E.; Sharma, M. Temporal and Agricultural Factors Influence Escherichia coli Survival in Soil and Transfer to Cucumbers. Appl. Environ. Microbiol. 2021, 87, 1–14. [Google Scholar] [CrossRef]
  51. Libby, S.J.; Lesnick, M.; Hasegawa, P.; Kurth, M.; Belcher, C.; Fierer, J.; Guiney, D.G. Characterization of the spv Locus in Salmonella enterica Serovar Arizona. Infect. Immun. 2002, 70, 3290–3294. [Google Scholar] [CrossRef] [Green Version]
  52. Ferguson, C.; Husman, A.M.D.R.; Altavilla, N.; Deere, D.; Ashbolt, N. Fate and Transport of Surface Water Pathogens in Watersheds. Crit. Rev. Environ. Sci. Technol. 2003, 33, 299–361. [Google Scholar] [CrossRef]
Figure 1. Concentrations of L. monocytogenes and S. enterica for four sites in this study from October 2016 to September 2018. (a) L. monocytogenes at MA04, (b) S. enterica at MA04, (c) L. monocytogenes at MA05, (d) S. enterica at MA05, (e) L. monocytogenes at MA10, (f) S. enterica at MA10, (g) L. monocytogenes at MA11 and (h) S. enterica at MA11.
Applsci 12 07526 g001
Figure 2. First (EOF1) and second (EOF2) spatial patterns of L. monocytogenes and Salmonella and cumulative rain fall over one (Rain1) and seven (Rain 7) days before sampling; (a) L. monocytogenes EOF1; (b) L. monocytogenes EOF2; (c) Salmonella EOF 1; (d) Salmonella EOF2. Solid (red) lines indicate EOF values of the pathogens; striped (turquoise) lines indicate EOF values of Rain1 (diagonal to the left) or Rain7 (diagonal to the right).
Applsci 12 07526 g002
Table 1. Mean levels (MPN/L) of L. monocytogenes and S. enterica, followed by prevalence (percentage and number of samples which were positive for the pathogen) in non-growing (October–April) and produce-growing (May–September) seasons.
PathogenSeasonSite
MA04MA05MA10MA11
L. monocytogenesNon-growing0.76 ± 0.15 1
(58.8%) 2
(10/17) 3
5.92 ± 0.32
(93.8%)
(15/16)
0.03 ± 0.00
(11.1%)
(2/18)
0.03 ± 0.00
(12.5%)
(2/16)
L. monocytogenesGrowing0.30 ± 0.05
(35.3%)
(6/17)
3.63 ± 0.27
(100%)
(16/16)
0.62 ± 0.14
(5.6%)
(1/18)
0.02 ± 0.00
(11.1%)
(2/18)
S. entericaNon-growing1.05 ± 0.08
(94.1%)
(16/17)
0.86 ± 0.16
(62.5%)
(10/16)
0.04 ± 0.00
(11.8%)
(2/17)
0.06 ± 0.00
(25.0%)
(4/16)
S. entericaGrowing1.83 ± 0.20
(70.6%)
(12/17)
1.31 ± 0.16
(93.3%)
(14/15)
0.05 ± 0.00
(27.8%)
(5/18)
0.33 ± 0.05
(33.3%)
(6/18)
1 mean ± standard error. 2 Prevalence, %. 3 Number of positive pathogens samples/number of total samples.
Table 2. The biserial correlation coefficient (r) for the relationship between cumulative rainfall data (one-day rainfall, Rain1, and seven-day rainfall, Rain7) and the prevalence of pathogens at each site.
Correlated variablesMA04 (Stream)MA05 (Stream)MA10 (Pond)MA11 (Pond)
rp-Valuerp-Valuerp-Valuerp-Value
Rain1 vs.
L. monocytogenes
0.003 10.987−0.6340.0030.5890.0010.725<0.001
Rain1 vs.
S. enterica
0.707<0.0010.310.1150.3710.0560.140.485
Rain7 vs.
L. monocytogenes
0.0850.67−0.5620.0020.4470.0190.3340.087
Rain7 vs.
S. enterica
0.1070.5930.4480.0190.2080.2960.1080.591
Values in bold are statistically significant (p < 0.05).
Publisher’s Note: MDPI stays neutral with regard to jurisdictional claims in published maps and institutional affiliations.

