Article

Evaluation and Correction Method of Asphalt Pavement Rutting Performance Prediction Model Based on RIOHTrack Long-Term Observation Data

National Observation and Research Station of Corrosion of Road Materials and Engineering Safety in Dadushe Beijing, Research Institute of Highway Ministry of Transport, Beijing 100088, China
*
Author to whom correspondence should be addressed.
Appl. Sci. 2022, 12(13), 6805; https://doi.org/10.3390/app12136805
Submission received: 10 June 2022 / Revised: 1 July 2022 / Accepted: 2 July 2022 / Published: 5 July 2022
(This article belongs to the Special Issue Advances in Asphalt Pavement Technologies and Practices)

Abstract

:
In order to improve the accuracy and reliability of an existing rutting performance prediction model, based on the long-term observation data of the RIOHTrack’s full-scale pavement structure, the rutting performance prediction model in China’s Specifications for Design of Highway Asphalt Pavement was evaluated, and the model correction method was proposed, which improves the model’s reliability and makes it more suitable for rutting estimation in the region. The research found that the rutting model in China’s Specifications for Design of Highway Asphalt Pavement has significant structural dependence. The model with the highest prediction accuracy and the smallest error is the semi-rigid base asphalt pavement structure with an asphalt concrete layer thickness of 12 cm; the prediction accuracy of other structures is not high. In order to improve the accuracy and reliability of the rutting prediction model, a new model is established by introducing local correction coefficients into the existing model. After local correction, the accuracy of the rutting prediction models for all structures has been greatly improved, and the determination coefficient R2 is greater than 0.87. Since the basic data has already reflected the characteristics of different pavement structures and materials, as well as the impact of local climate environment and traffic load conditions, the new model is more suitable for rutting prediction of various pavement structures in the region where the RIOHTrack is located.

1. Introduction

Rutting is one of the main diseases of asphalt pavement, and it is also a key design index in the structural design of asphalt pavement in many countries such as: the American Mechanistic-Empirical Pavement Design Guide (MEPDG) [1], the Shell Pavement Design Manual [2], China’s Specifications for Design of Highway Asphalt Pavement [3], etc.; all control the structural design through the allowable rutting deformation within the design life. In these design methods, the rutting performance prediction model is mainly used to predict the rutting deformation of the asphalt concrete structure at the end of the design life, and through structural combination and material performance optimization, the rutting deformation at the end of the design life is less than the allowable value, so as to ensure the rationality of pavement structure design. It can be seen that how to ensure the accuracy and reliability of the rutting performance prediction model is one of the key issues of these design methods.
The core basis of the rutting performance prediction model is the conversion relationship between the permanent strain accumulation of the laboratory repeated load test and the actual road rutting accumulation [4,5]. At present, two methods are mainly used to establish the rutting performance prediction model. The first is the layered strain method [6,7,8,9,10,11], which combines the mechanical analysis of pavement structure, material performance tests, and actual rutting measurement results of pavement structures, and predicts the rutting deformation according to the layered strain accumulation method. For example, in the MEPDG research [12], Kaloush [13,14] first established the relationship between the permanent strain of each layered asphalt mixture and the number of loading times. Then 387 sets of observation data from 88 LTPP observation sections in 28 states were used to calibrate and verify the relationship, and finally the prediction model for asphalt layer rutting performance [1] was obtained. As for China’s Specifications [3], considering the difference of stress distribution at different depths of asphalt pavement and the rutting resistance performance of different layers, the permanent deformation is calculated layer by layer, and based on 229 rutting test results of various asphalt mixtures, a rutting performance model based on the layered strain accumulation method was established, and the model was revised and verified using the rutting data of more than 10 highways and 5 test sections [5]. The Shell Pavement Design Manual [2] uses simplified linear elastic stress analysis and laboratory static load creep tests without confining pressure to establish a model for predicting the permanent deformation of the asphalt layer. The model considers the thickness of the asphalt layer, the average stress in the layer, and the asphalt concrete stiffness, which could compare the resistance to permanent deformation of different asphalt mixtures. Yang [15] introduced the generalized stiffness modulus of the viscosity part of the asphalt layer on the basis of the Shell model, and Finn and Monismith [10] suggested to directly use the asphalt mixture stiffness from the static load creep test under given load stress and temperature conditions, further optimizing the Shell model’s rutting estimation equation. Verstvaeten, Ververka, and Francken et al. [16] established a rutting model considering the intermittent time of load action. Zhang et al. [17] established a high-grade asphalt pavement rutting prediction model by using the elastic layered system theory combined with the rheological model of asphalt mixture. Kenis [18] considered that the permanent deformation depends on parameters such as stress, loading time, and temperature, and assumed that the viscoelastic deformation of the asphalt mixture had sufficient recovery time within the load interval, and established a corresponding rutting model accordingly.
The second is the empirical method [19], which directly uses the observation data accumulated over several years to establish the regression relationship between the rutting amount and the relevant influencing variables through statistical analysis. Considering the actual conditions of test sections or field roads and laboratory tests, this method establishes an empirical equation for predicting the relationship between the permanent strain of the asphalt mixture layer and the properties of load and material. Finally, the rutting of the asphalt pavement under long-term repeated loads is determined. For example, Kim et al. [20] used data collected from 930 test points in 39 test road sections in Michigan from 1991 to 1997, and established a rutting prediction model through structure analysis and nonlinear regression analysis, which took into account the correlation between the amount of rutting and the pavement structure, material parameters, and axle loads. Based on the laboratory asphalt pavement analyzer (APA) test, Shami et al. [21] extended to APA test prediction research under different temperatures and axis loads. Through a large number of experiments, Monismith et al. [22,23] obtained an empirical method for rutting prediction; that is, the relationship between rutting and influencing factors. A. Wijeratane et al. [24] established a double-logarithmic model of the relationship between permanent strain and cumulative axis loads. Huang [25] conducted regression analysis on the data through a laboratory loop test, and established an empirical model including the thickness of the asphalt layer and the cumulative axis loads. Because the second method is limited by observation objects and regional conditions, the model is less applicable. Therefore, the first method is mainly used in the design of asphalt pavement in many countries to establish a rutting performance prediction model.
For the prediction model of rutting performance established by the first method, due to the natural environment and loads that the actual pavement structure bears, there are certain differences from the test conditions imposed in the laboratory. It is necessary to continuously accumulate actual observation data during the service process to make periodic corrections and improvements to the established prediction model [26,27,28,29,30,31,32,33]. Taking the American MEPDG as an example, the first edition of the guide [1] was officially promulgated in 2008, and the rutting prediction model was established based on the observation data and research results at that time. Afterwards, in the process of using this guide, in order to improve the accuracy and reliability of the rutting model, in the second edition of the guide [34] in 2015 and the third edition of the guide [35] in 2020, both of them have made a relatively large revision to the rutting prediction model. Although the model expression remains unchanged, the model parameters are adjusted greatly, and the prediction effect of the rutting performance prediction model after the correction has been greatly improved. The rutting model established by the first method is also used, as well as China’s Specifications [3] promulgated in 2017. Due to the late promulgation of the specification, the asphalt pavement designed and opened to traffic in China in accordance with this specification has a longest service life of only 2 years. Due to the lack of long-term observation data of rutting in actual engineering, the effect of using the rutting prediction model is still unknown, and the model cannot be revised and improved periodically.
Therefore, this research uses the long-term observation data of the RIOHTrack’s full-scale pavement structures to carry out the accuracy analysis of the rutting performance prediction model in China’s Specifications, and proposes a model correction method for the structure with poor model prediction to improve the reliability of the model, and make it more suitable for rutting prediction in the local region. As of April 2022, according to the rutting equivalent conversion principle, the RIOHTrack has completed 51.6 million equivalent single-axle loads (ESALs), which is equivalent to the traffic load level of the expressway heavy traffic level in China’s Specification for more than 30 years. The service time of the simulated pavement structure is long enough, and can be used as the basic data to evaluate the accuracy of the rutting prediction model of China’s asphalt pavement and propose a correction method.
This research is relatively new work. As mentioned above, after the rutting performance prediction model is established, it is necessary to continuously correct the model according to the long-term observation data accumulated during actual service life, which is very important and practical work. However, there are few asphalt pavements designed and put into operation according to this the newest design specification in China, and long-term observation data cannot be accumulated in the short term, so it is difficult to carry out the work to correct the rutting model. In order to solve this problem, this research analyzes the long-term rutting observation data of the RIOHTrack, and explores a new correction method for the rutting model used by China’s Specification. By introducing correction coefficients to locally correct the existing rutting model, the accuracy of the model can be significantly improved. This is of great significance for rutting prediction, and also has important reference value for application in other regions.

2. Objective and Scope

This research aims to evaluate the accuracy of the rutting performance predication model in China’s Specifications by using the long-term observation data of full-scale pavement structures and present a model correction method to improve the reliability of the model and make it more suitable for the rutting prediction in the region. The research is mainly carried out on the full-scale test track of the Research Institute of Highway Ministry of Transport (RIOHTrack). A total of 14 kinds of asphalt pavement test sections from 7 categories, including semi-rigid base asphalt pavement, rigid base asphalt pavement, inverted asphalt pavement, and full-depth asphalt pavement with different thicknesses of asphalt concrete materials, are selected as the research object.

3. Methods

This research is mainly carried out on the RIOHTrack, which was completed in October 2015, and has been officially in operation for loading tests since December 2016. To date, the RIOHTrack has been in operation for more than 5 years for accelerated loading tests using real vehicles. As heavy trucks are used for the accelerated loading test, according to China’s Specifications, each axle load of the truck should be converted into the cumulative number of equivalent standard axle loads (10 t) to characterize the traffic load level and correspond to the design service life of the pavement structure. During the test, heavy trucks are used for accelerated loading. Given that the pavement structure simulated by the RIOHTrack accelerated loading test has been in service for long enough, the accuracy of the rutting prediction model of asphalt pavement in China can be evaluated on the basis of the evolution data of the pavement structure rutting depth obtained during accelerated loading tests, and the correction method is proposed.

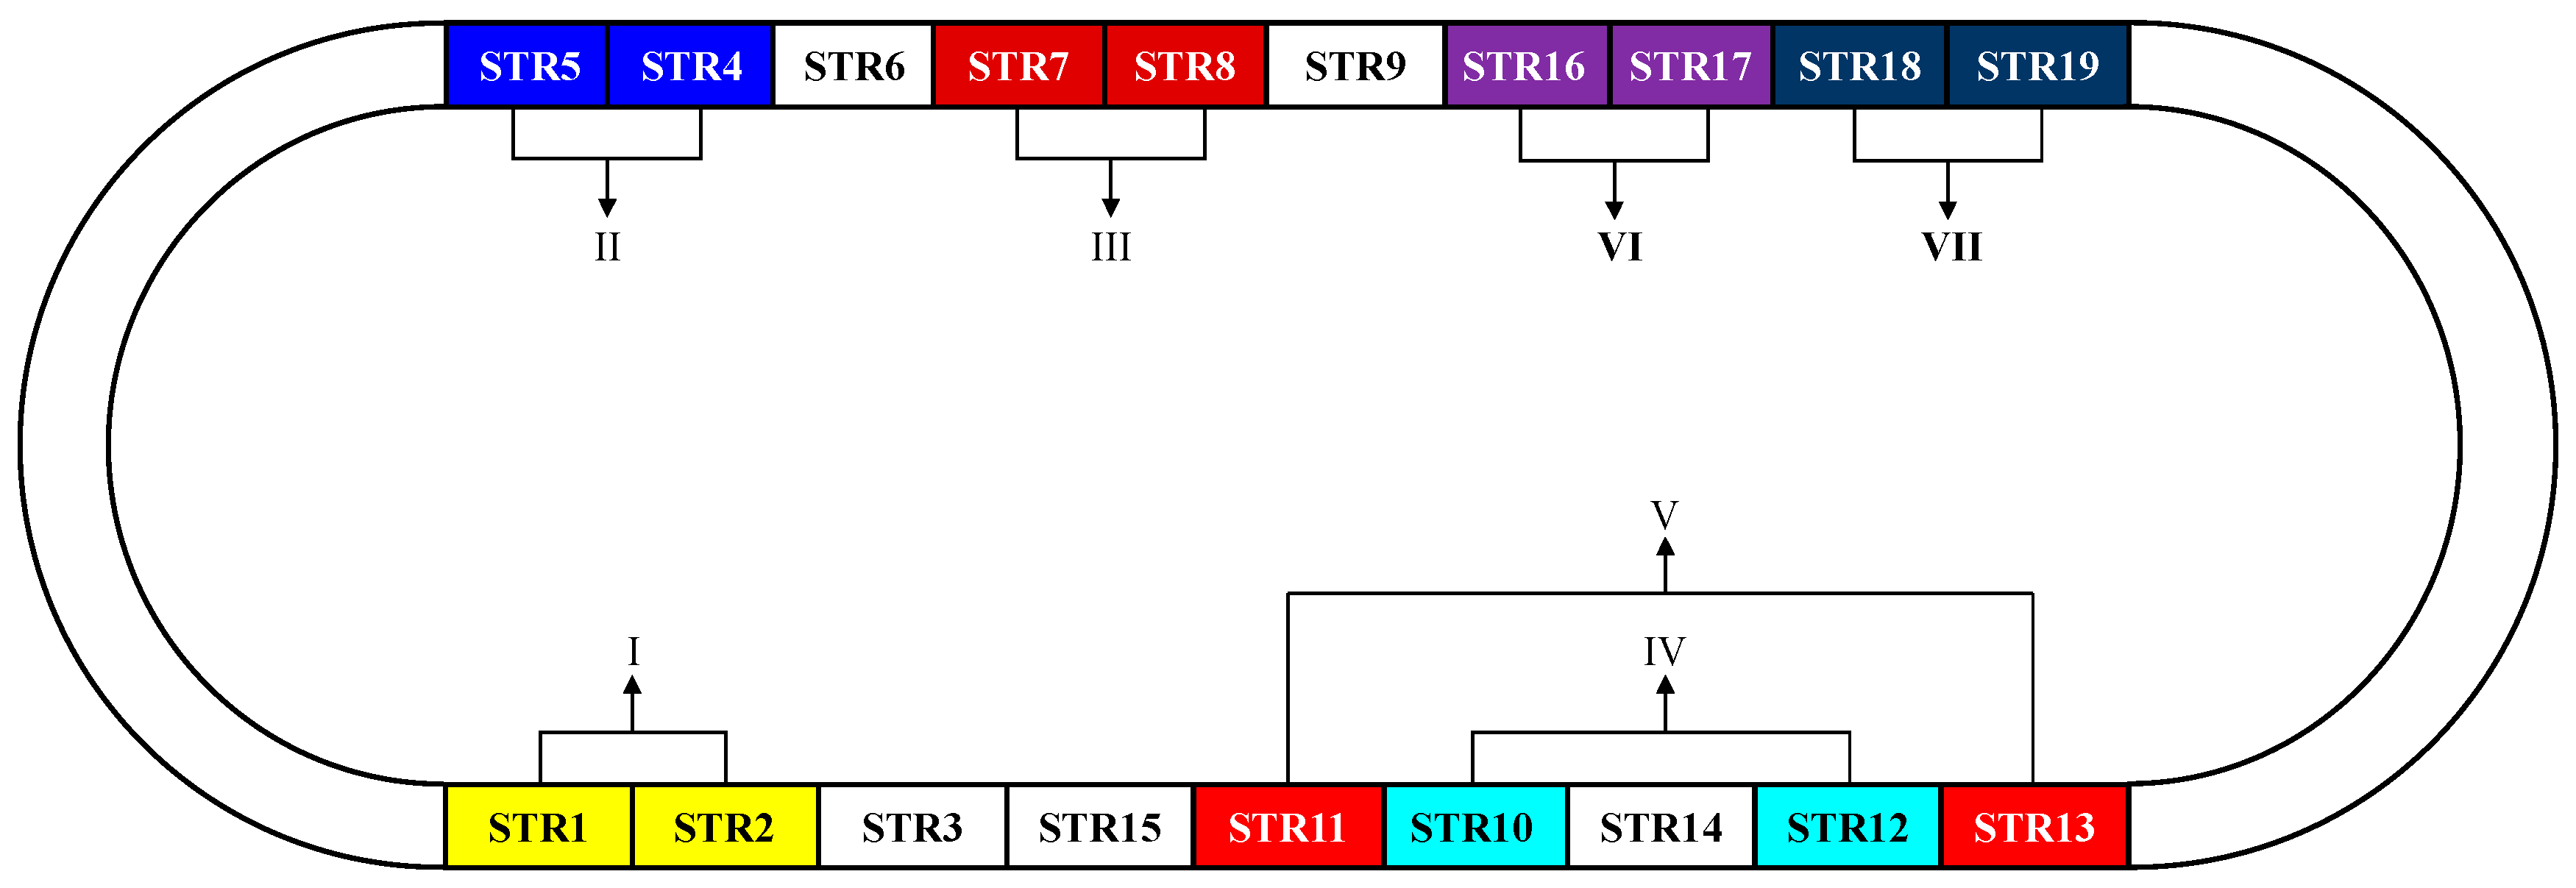
4. Overview of RIOHTrack Full-Scale Pavement Test Track

The RIOHTrack, for which this research based, is the first full-scale pavement test track of road fields in China. It is located in Beijing, where the average air temperature of the coldest month is −4.6 °C and the average air temperature of the hottest month is 25.8 °C. The RIOHTrack, with a total length of 2039 m, is an enclosed curve composed of straight lines and circular curves, with a north–south trend and a symmetrical arrangement. The long-term observation data of each pavement structure of the RIOHTrack is selected to carry out the model accuracy analysis, for several reasons. First, various pavement structures paved by the RIOHTrack are very representative in China, basically covering more than 90% of the commonly used pavement structure types on the asphalt pavement of China’s expressways. Moreover, each test section of the RIOHTrack was constructed with the same structure thickness, pavement material, and construction technology as the actual project. The width of each test section is 7.5 m, and two inner and outer lanes are set; each lane is 3.75 m wide, the section length is 50–60 m, and the test size is also completely consistent with the actual engineering project. Therefore, these test structures can better reflect the real situation of actual engineering projects, and the performance observations carried out on this basis are also well representative. Second, the evaluation and accuracy analysis of the rutting model requires the support of long-term service performance observation data. We know that the evolution of pavement service performance is a long-term process. If calculated according to natural life, the service life of pavement usually reaches several decades, which is too long for model verification, and it is difficult and impractical to obtain continuous observation data for decades. The RIOHTrack is a very efficient accelerated loading test platform with the ability to simulate long-term performance in short-term tests. It accelerates the service performance of pavement by increasing the test load of the vehicle. According to the axle load conversion equation, it can be known that each time the test load of the existing RIOHTrack acts once, it is equivalent to dozens or hundreds of times the ESAL of 10 t acts. In this way, the simulation of the long-term service performance of pavement can be realized in the short term. These long-term performance observations can be used to verify the model.
Structure I is a semi-rigid base pavement with an asphalt layer thickness of 12 cm, and the structure numbers are STR1 and STR2. Structure II is rigid base asphalt pavement, the structure numbers are STR4 and STR5. Structure III is a semi-rigid base pavement with an asphalt layer thickness of 18 cm, and the structure numbers are STR7 and STR8. Structure IV is inverted asphalt pavement, and the structure numbers are STR10 and STR12. Structure V is a semi-rigid base pavement with an asphalt layer thickness of 24–28 cm, and the structure numbers are STR11 and STR13. Structure VI is a semi-rigid base pavement with an asphalt layer thickness of 36 cm, and the structure numbers are STR16 and STR17. Structure VII is full-depth asphalt pavement, and the structure numbers are STR18 and STR19 [36,37,38,39].
The RIOHTrack layout is shown in Figure 1, and the structure is shown in Figure 2. In the base layer shown in Figure 2, CBG25-I and CBG25-II are cement-bonded graded aggregate material, and the 7-day unconfined compressive strengths are 6 MPa and 4.5 MPa, respectively. CS is cement-stabilized soil, and the 7-day unconfined compressive strength is 2 MPa. LCC and CC are lean cement concrete and cement concrete, respectively. GA is graded aggregate.
To ensure test efficiency, heavy trucks are used for the accelerated loading on the RIOHTrack. From December 2016 to December 2018, loading mode I is adopted for loading. The loading vehicles include four three-axle trucks (Figure 3). Since January 2019, loading mode II is adopted for loading. The loading vehicles, including six six-axle trucks, are updated, as shown in Figure 4. The test loading efficiency is increased to more than 3 times that of loading mode I. The axle load of the loading vehicles is heavy, more than 10 t, the standard axle load stipulated in China’s Specifications. Therefore, it is necessary to convert it into the cumulative number of ESALs taking the rutting as a design indicator based on Equation (1). Based on this, the cumulative number of ESALs in RIOHTrack loading tests has been 51.60 million from December 2016 to April 2022, as shown in Figure 5.
N e = C 1 C 2 ( P i 10 ) 4
where C1 refers to the axle-number coefficient of converted vehicles, converted according to the rutting equivalence principle; when the distance between the front and rear axles is greater than 3 m, take 1. when the distance between the front and rear axles is less than 3 m, take 1.05; C2 refers to the wheel-set coefficient of converted vehicles. 1.0 for double wheels and 4.5 for single wheels; and Pi refers to the axle load of the converted vehicles (t).

5. Rutting Prediction Model and Parameter Values of China’s Asphalt Pavement

The rutting performance prediction model in China’s Specifications is established by the cumulative permanent deformation. First, each asphalt mixture layer is layered, and then according to the rutting test under standard conditions, the rutting permanent deformation of each layer of asphalt mixture is obtained, and the permanent deformation of each layer and the total permanent deformation of the asphalt mixture layer are calculated, so as to achieve the purpose of controlling the structure design. The rutting performance prediction model expressions are shown in Equations (2) and (3).
R a = i = 1 n R a i
R ai = 2.31 × 10 8 k Ri T pef 2.93 p i 1.80 N e 0.48 R 0 i
where Ra is the permanent deformation of the asphalt mixture layer (mm); Rai is the permanent deformation of the i-th layer (mm); R0i is the permanent deformation of the i-th layer of the asphalt mixture in the laboratory rutting test at 60 °C (mm); Ne is the cumulative number of ESALs; Tpef is the rutting equivalent temperature of the asphalt mixture layer (°C); pi is the vertical compressive stress on the top surface of the i-th layer (MPa); kRi is the comprehensive correction coefficient, calculated according to Equations (4)–(6); zi is the depth (mm) from the midpoint of the i-th layer to the road surface; and ha is the thickness of the asphalt mixture layer (mm); when it is greater than 200 mm, take 200 mm.
k R i = ( d 1 + d 2 · z i ) · 0.9731 z i
d 1 = 1.35 × 10 4 h a 2 + 8.18 × 10 2 h a 14.50
d 2 = 8.78 × 10 7 h a 2 1.50 × 10 3 h a + 0.90
Since the long-term evolution data of rutting in this research is obtained based on the RIOHTrack full-scale pavement test track, the traffic loads on each pavement structure are exactly the same, so the Ne of each structure should take the same value for rutting prediction, which can be taken according to Equation (1) and Figure 5.
According to the regulations in China’s Specifications, Tpef is related to the temperature in the region where the pavement structure is located and the thickness of the asphalt mixture layer. It can be seen from the calculation that for the STR1, STR2, STR4, and STR5 in this research, the equivalent temperature of the rutting is 22.02 °C; the equivalent temperature of rutting of STR7 and STR8 is 22.98 °C; and the equivalent temperature of rutting of STR10, STR12, STR11, STR13, STR16, STR17, STR18, and STR19 is 23.30 °C.
There are 10 kinds of asphalt mixtures in the structures of this research. The test results of the permanent deformation of each asphalt mixture in the laboratory rutting test at 60 °C are shown in Table 1. The value of R0i can be selected according to Table 1. In addition, pi and kRi can be calculated according to the layered model of each pavement structure, and calculated according to the mechanics of the elastic layered system and Equations (4)–(6), and will not be repeated here.

6. Results and Discussion

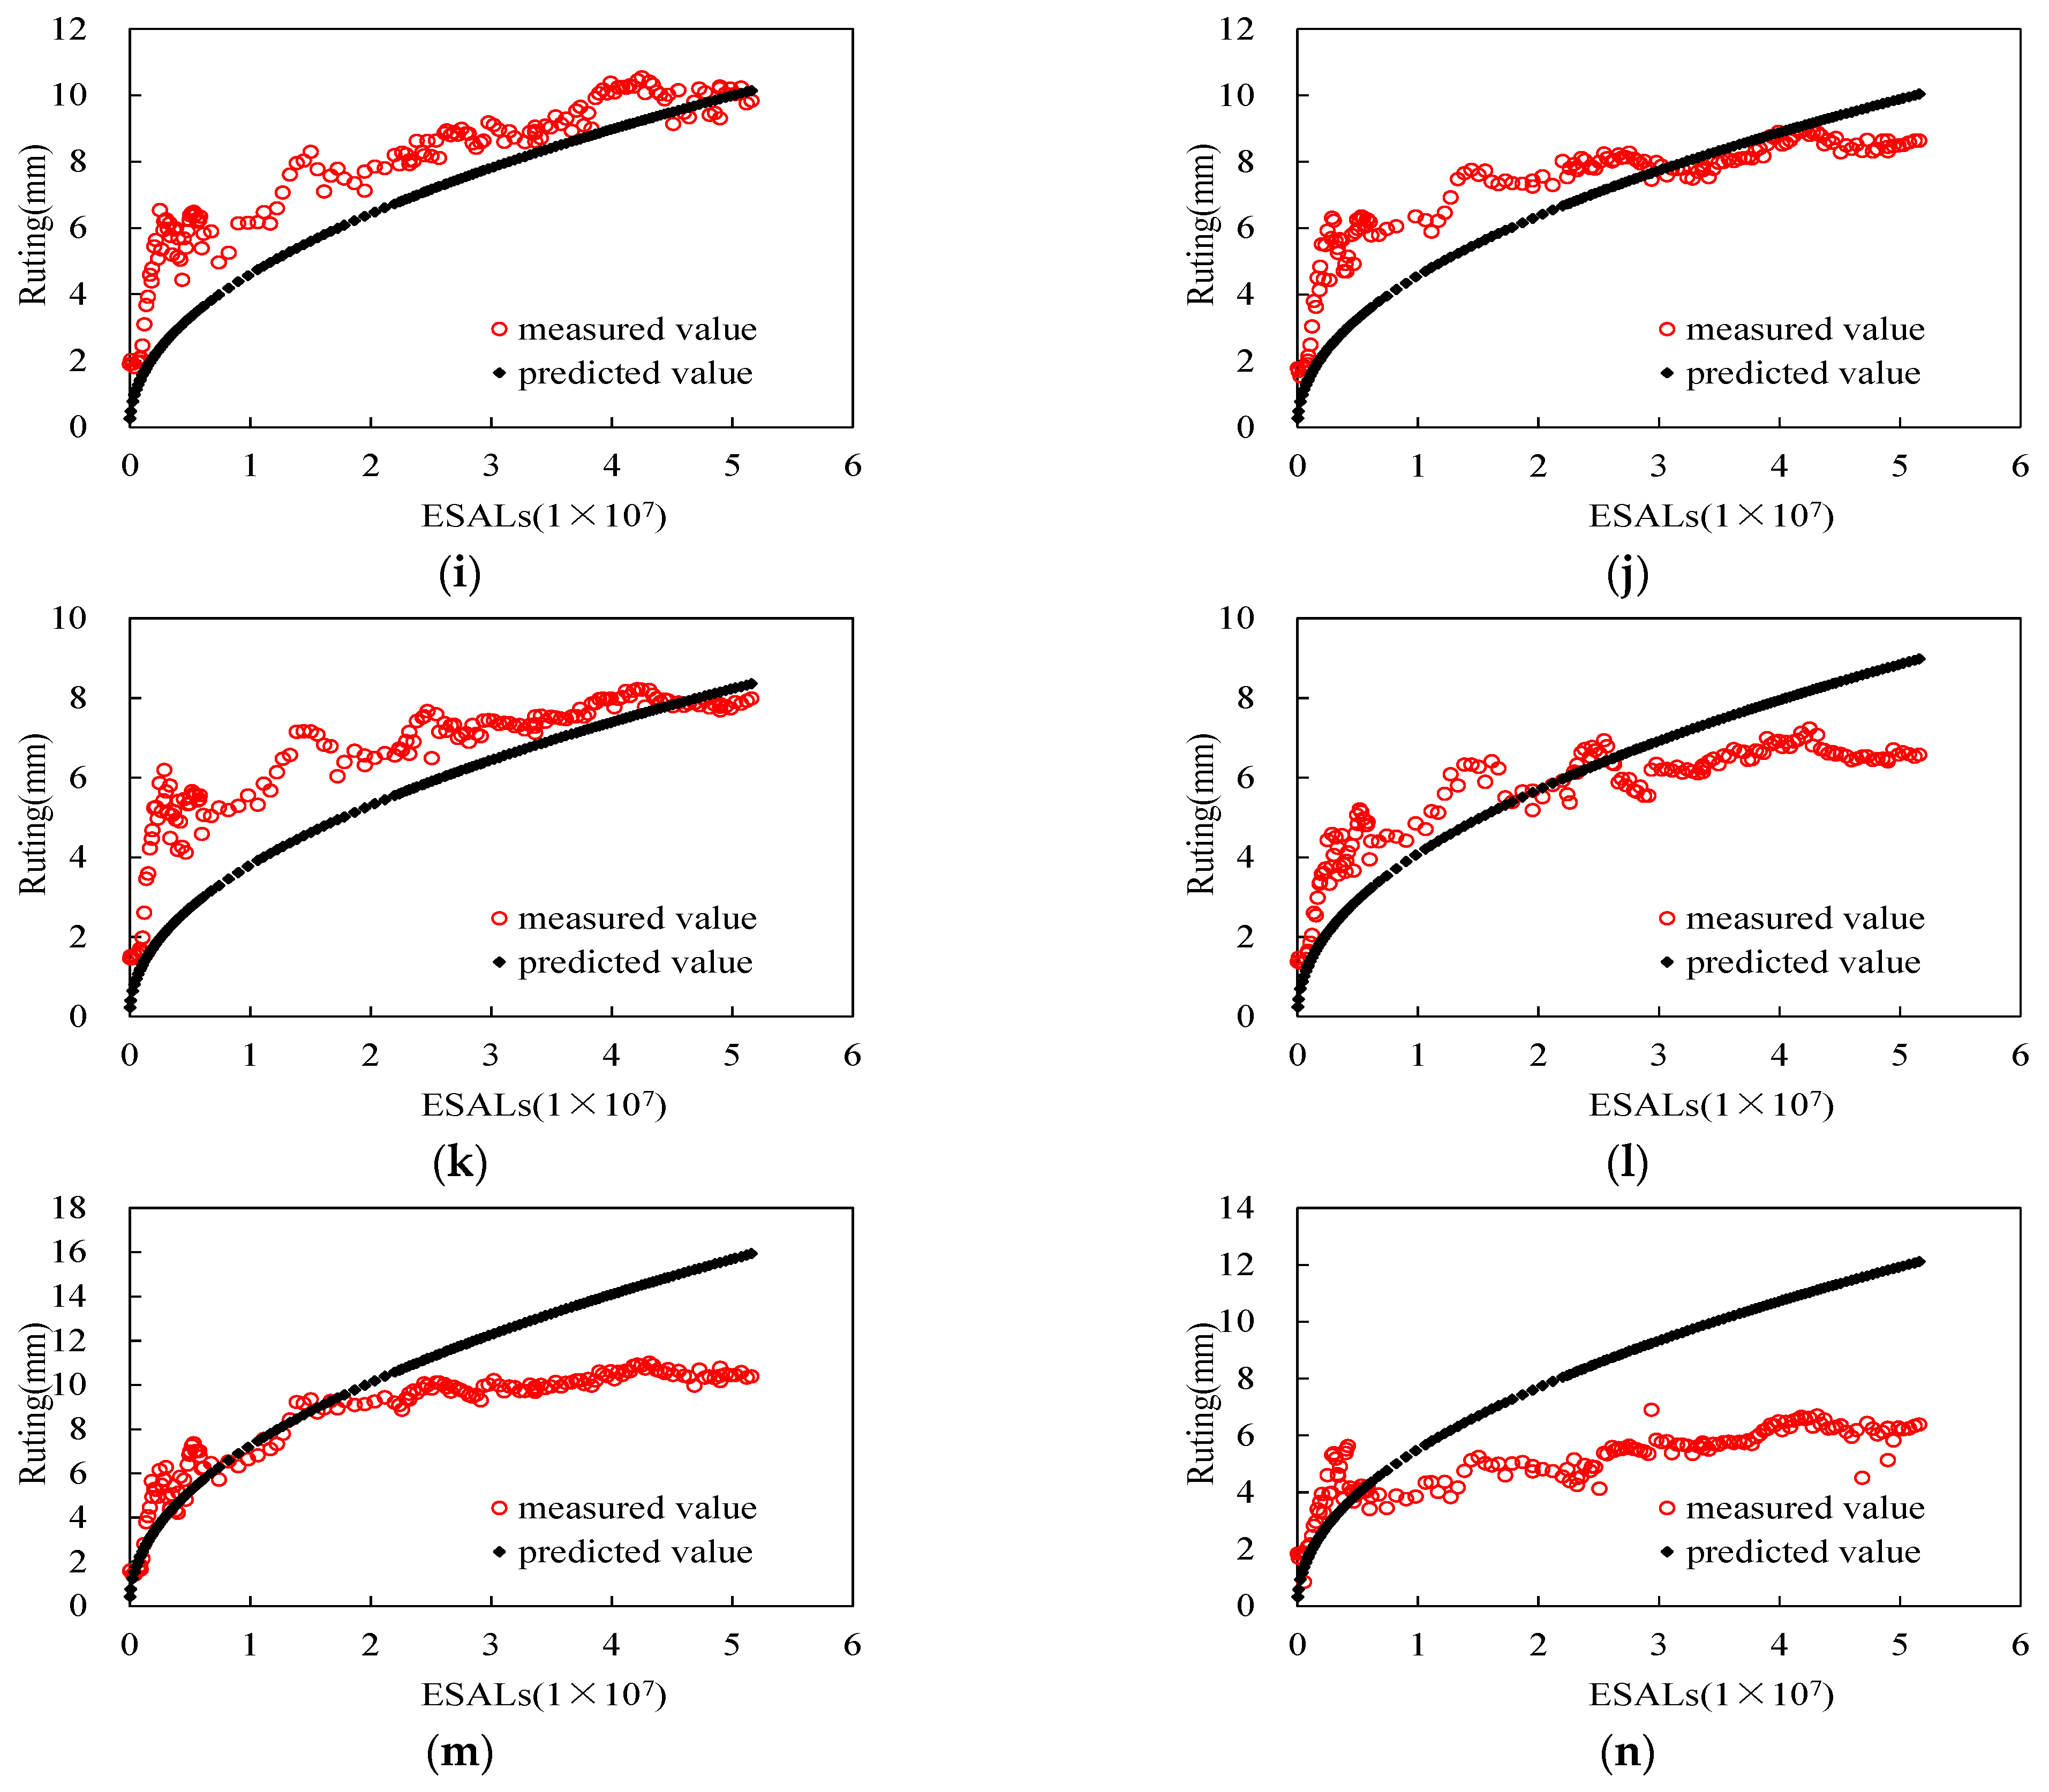
6.1. Evaluation on Asphalt Pavement Rutting Prediction Model

Figure 6 shows the comparison between the predicted value of the model and the measured value during the long-term evolution of rutting of seven categories of structures. To evaluate the accuracy and prediction effect of the rutting prediction model quantitatively, the mean square error (MSE), root mean square error (RMSE), mean absolute error (MAE), mean relative error (MAPE), coefficient of determination (R2), and other indicators between the predicted value of the rutting model and the measured value are calculated and summarized in Table 2.
It can be seen from Figure 6 and Table 2 that:
(1)
For Structure I, the predicted value of the rutting model is relatively close to the measured value. The measured result fluctuates up and down near the prediction curve, and the error of the model prediction is small. For STR2 with the smallest error, the MSE is 1.12 mm2; the RMSE is 1.06 mm; the MAE is 0.85 mm; and the MAPE is 17.6%. The R2 of STR1 and STR2 rutting models are 0.6346 and 0.6223, respectively. According to [12], the R2 of the predicted value of the model and the measured value in MEPDG is 0.6425. For Structure I, the accuracy of the rutting model in China’s Specifications is basically equivalent to that in American MEPDG, and the model has a similar prediction effect.
(2)
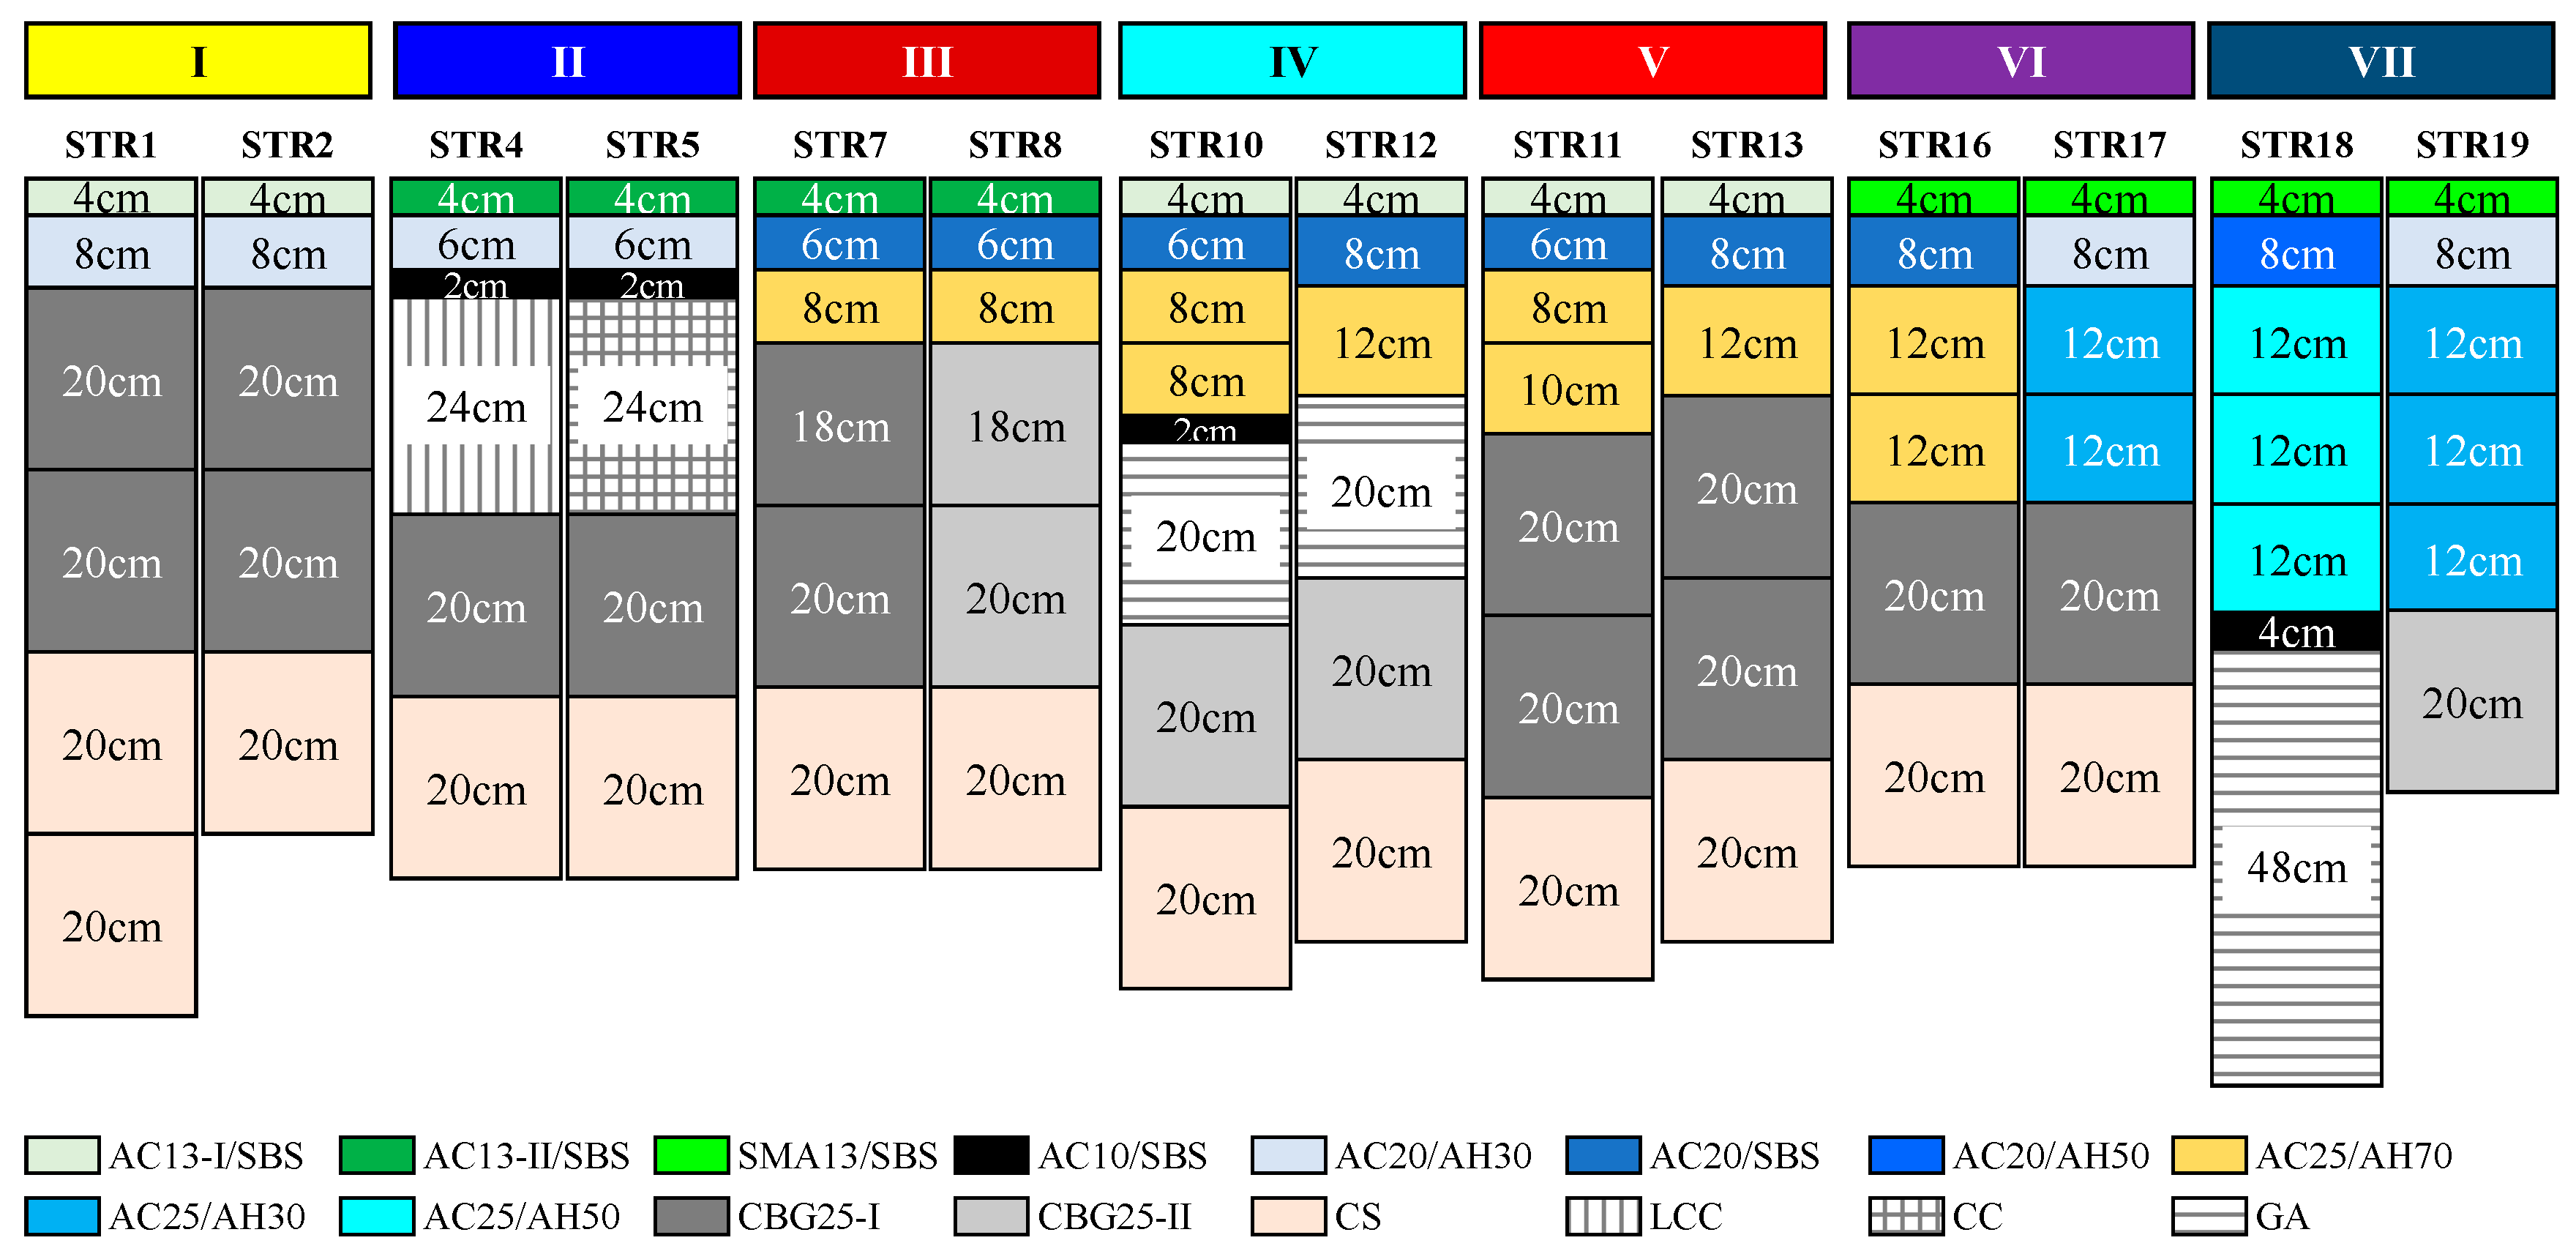
For Structures II and VII, the correlation between the predicted value of the rutting model and the measured value is similar. A great difference is observed between the predicted value and the measured value of the rutting model with the two categories of structures. The predicted value is significantly larger than the measured value. The predicted curve is above the measured value. In addition, with the increase in the cumulative number of ESALs, the error in the model prediction rises. For STR5 with the smallest error, the MSE is 3.67 mm2; the RMSE is 1.92 mm; the MAE is 1.69 mm; and the MAPE is 32.1%. The R2 of STR4, STR5, STR18, and STR19 structural rutting models, namely, −8.2491, −1.2133, −0.0792, and −1.0787, respectively, are all negative. According to the meaning of the determination coefficient R2, when R2 is negative, the effect of the simulated prediction is poor and even cannot reach the prediction accuracy of the average value curve of the measured value. Therefore, for Structures II and VII, the accuracy of the rutting model in China’s Specifications is relatively poor. This model is not suitable for the rutting prediction. The reason for this phenomenon may be that the characteristics of the two structures are not fully considered when Equation (3) is established, thereby resulting in the poor prediction effect of the model. Figure 2 shows that Structure II belongs to the rigid base asphalt pavement. The lean concrete or cement concrete is adopted for the base, and the modulus and strength of the base are relatively high in value. Structure VII belongs to the full-depth asphalt pavement structure with the thickness of asphalt materials reaching 48–52 cm. According to [3], the rutting model in China’s Specifications is established on the basis of the rutting data of 10 highways and 5 test sections. Semi-rigid materials are used as the base or subbase of more than 95% of asphalt pavement in China, and the thickness of the asphalt concrete structural layer generally does not exceed 30 cm. Therefore, to make the rutting model in the design specification more widely applicable, semi-rigid materials are used as the base in the construction of 10 highways and 5 test sections used in the model, and the thickness of the asphalt concrete is in the range of 16–28 cm. When establishing Equation (3), Structure II, which has lean concrete or cement concrete as the base, and Structure VII, which has 48–52 cm-thick asphalt material layer thickness, are not considered, which is also the main reason for the poor prediction effect of Equation (3) on the two kinds of structures.
(3)
For Structure III and STR10 in Structure IV, the predicted value is significantly larger than the measured value. The predicted curve is below the measured value. After the initial loading stage (Ne is about 5 million), the predicted curve is basically parallel to the measured curve, and the difference between the predicted value and the measured value is basically constant with the increase in cumulative ESALs. For STR7 with the smallest error, the MSE is 3.52 mm2; the RMSE is 1.88 mm; the MAE is 1.64 mm; and the MAPE is 25.2%. The R2 of STR7, STR8, and STR10 structural rutting models are 0.3337, 0.2222, and 0.0469, respectively. R2 is in the range of 0–0.4. The prediction effect is not ideal.
(4)
For the remaining structures, namely, STR12 in Structures IV, V, and VI, an intersection between the model prediction curve and the measured curve of the rutting model exists with the increase in ESALs. Therefore, it can be obviously divided into two stages. The first stage is the first section of the whole rutting evolution curve. When the ESALs reach a certain critical value (Ne′) from 0 at the beginning, the predicted value of the rutting model is obviously less than the measured value. However, with the increase in ESALs, the error of the model prediction gradually becomes small. When it reaches the critical value (Ne′) of ESALs, the predicted value is almost the same as the measured value. The second stage is the latter section of the whole rutting evolution curve. When the number of ESALs is greater than the critical value (Ne′), the predicted value of the rutting model is higher than the measured value. With the increase in ESALs, the model prediction error gradually rises. For different structures, the critical values (Ne′) of ESALs vary greatly. For STR17 with the smallest error, the MSE is 1.72 mm2; the RMSE is 1.31 mm; the MAE is 1.15 mm; and the MAPE is 23.1%. The critical values (Ne′) of STR12, STR11, STR13, STR16, and STR17 are 35 million, 50 million, 30 million, 45 million, and 25 million, respectively. The R2 of five structural rutting models are 0.0860, 0.4220, 0.2500, 0.0444, and 0.2084. R2 is in the range of 0–0.5. The prediction effect is not ideal. From the meaning of the R2, although the rutting model can be used to predict these structures with R2 between 0 and 0.5, the accuracy is not high. The main reason is that the rutting observation data in this research are based on the RIOHTrack accelerated loading test. Compared with 10 highways and 5 test sections used for establishing the model in China’s Specification, some differences are observed in the geographical location, climate environment, and traffic load, etc. A local correction coefficient should be introduced into the rutting model by referring to [26,27,28,29,30,31,32,33], and the model must be modified to obtain a rutting prediction model suitable for the location of the RIOHTrack, thereby improving the accuracy of model prediction.
According to the equivalence relationship between the design life and the cumulative ESALs in China’s Specification, under the heavy traffic load level, the expressway with a 30-year design life is equivalent to more than 50 million cumulative ESALs of pavement. Table 3 summarizes the measured rutting values and model-predicted values of each pavement structure of the RIOHTrack under the cumulative 50 million ESALs in Figure 6. From the data in Table 3, it can be seen that, at the end of design life, the structures with the largest difference between the measured rutting values and the model predicted values are Structure II and VII, which are also predicted poorly in Table 2. Furthermore, STR7 and STR11 have the smallest difference between the measured rutting values and the model predicted values. However, from the rutting evolution curve in Figure 6, the rutting model has the highest prediction effect only when it reaches the end of design life. The prediction effect of the whole life cycle is not ideal, which is basically consistent with the results of the previous analysis.
The aforementioned analysis results show that the rutting model in China’s Specifications has significant structural dependence. Some problems are encountered in using a unified rutting model for the prediction of different structures, especially for rigid base and full-depth asphalt pavements. The rutting evolution process of the two structures is not considered when the model is established, so the prediction effect of the model on both structures is poor. To ensure the prediction accuracy of the rutting model, we should correct, improve, and optimize the established rutting model combined with the long-term evolution data of rutting deformation of pavement structure with load and environment according to the characteristics of the pavement structures and materials in different areas, as well as the geographical location, climate environment, and traffic load, to improve the prediction accuracy. Finally, a high-precision rutting prediction model suitable for different pavement structures and areas is obtained.

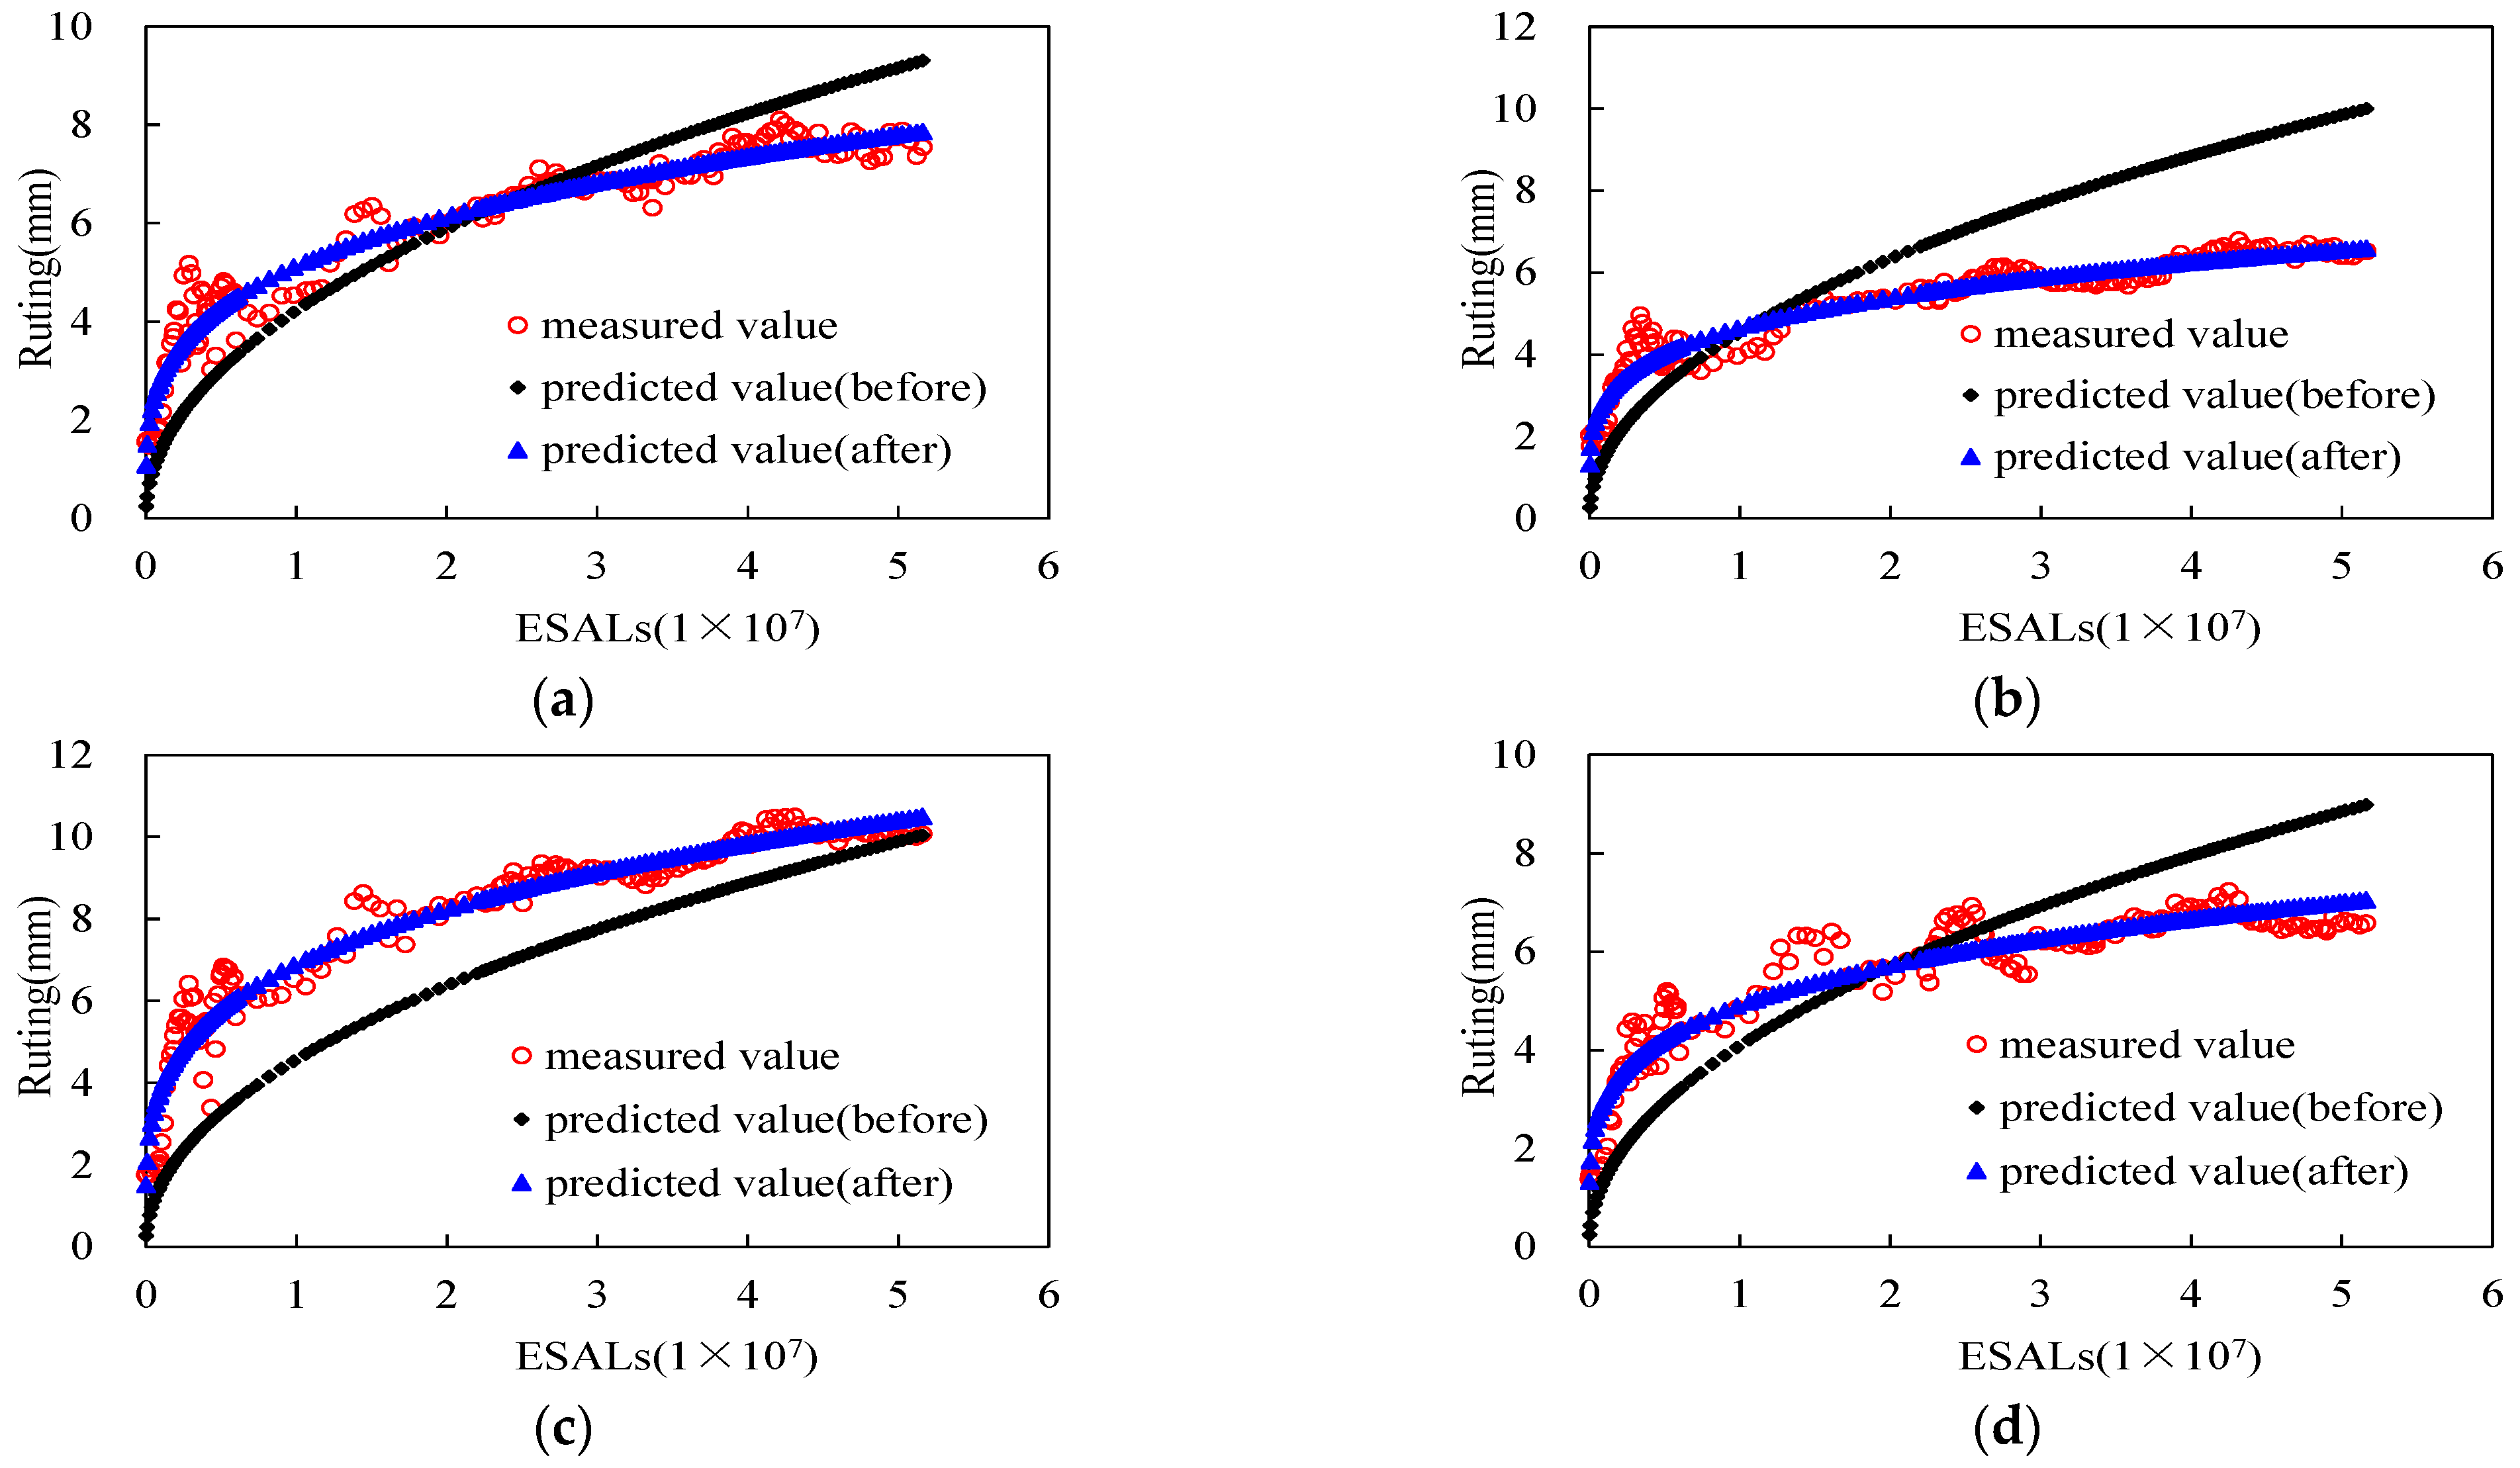
6.2. Correction of Asphalt Pavement Rutting Prediction Model

To ensure the wide applicability of the rutting prediction model in China’s Specifications and the model in MEPDG, the measured rutting data from actual projects and test tracks in different regions of the country were used in establishing the model. As a result, the applicability is ensured, but the prediction accuracy of the model is limited. As shown in [12], when R2 is higher than 0.60, the prediction effect of the model is acceptable and can be used for design. After verifying the rutting prediction models of different pavement structures based on the RIOHTrack measured results, the predicted value of only the rutting with Structure I is close to the measured value. The R2 of the rutting model can reach 0.60 and above, and the accuracy of other structures cannot reach the value. The reason for this phenomenon is that, on the one hand, the structure and material characteristics of some sections, such as rigid base structure and full-depth asphalt concrete layer structure, are not considered when the model is established, which leads to the poor prediction effect of the model on these structures. On the other hand, the RIOHTrack, which provides the measured data in this research, has certain differences from the model in climate and traffic environments. The rutting model can only be used with local correction.
At present, in terms of the rutting model, the commonly used correction method aims to introduce a local correction coefficient based on the existing model expression to improve the model, thereby improving the prediction accuracy. In [26,27,28,29,30,31,32,33], the local correction is carried out for the rutting model in MEPDG. The main method is that three local correction coefficients, namely, β1, β2, and β3, are introduced to correct the constant term of the model, the exponential term of temperature, and the exponential term of cumulative ESALs, respectively. Subsequently, the model parameters are calibrated using the rutting observation results of local actual projects or test tracks. The rutting model in China’s Specifications is similar to that in the MEPDG in its principles and expression. Therefore, this method can be used to make the local correction of the rutting model to establish a high-precision rutting model suitable for the region where the RIOHTrack is located. According to this idea, we propose a local correction method for the prediction model of the rutting performance of China’s asphalt pavement, which is briefly described as follows:
(1)
On the basis of the existing rutting performance prediction model Equation (3) in China, the local correction coefficients β1, β2, and β3 are introduced to improve a new rutting prediction model; see Equation (7). Among them, β1 is used to correct the constant term of the existing rutting model, β2 is used to correct the exponential term of the temperature, and β3 is used to correct the exponential term of the cumulative ESALs.
(2)
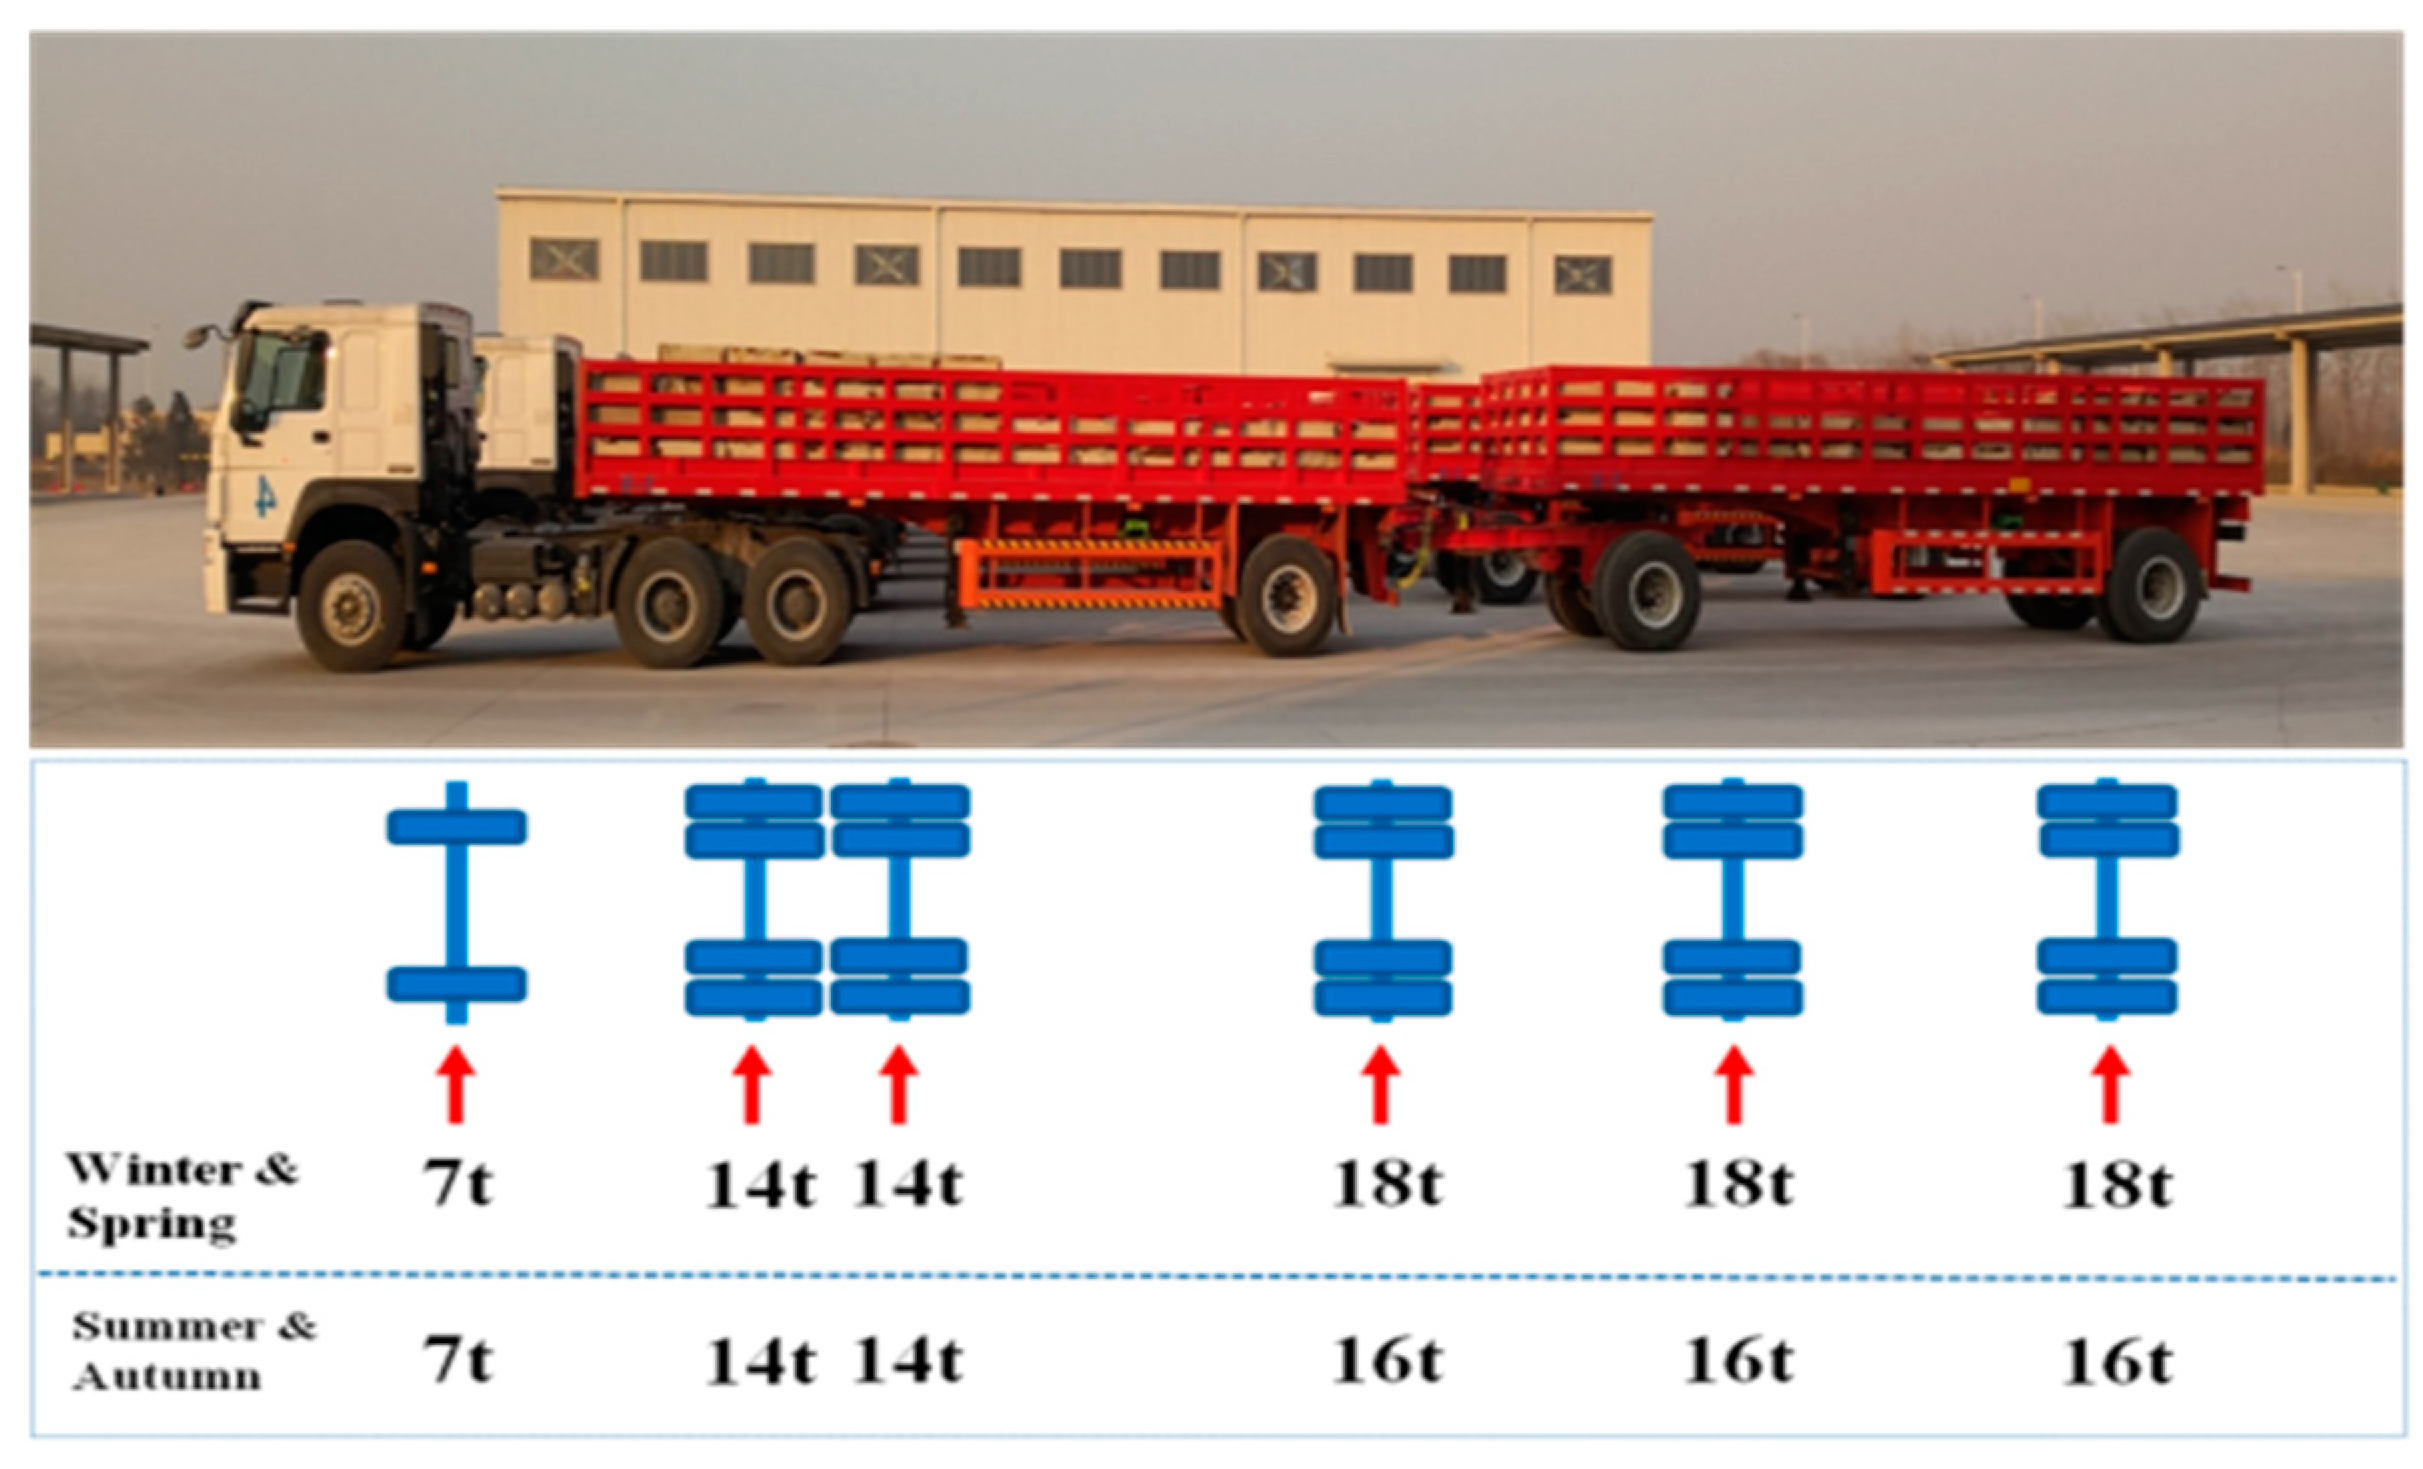
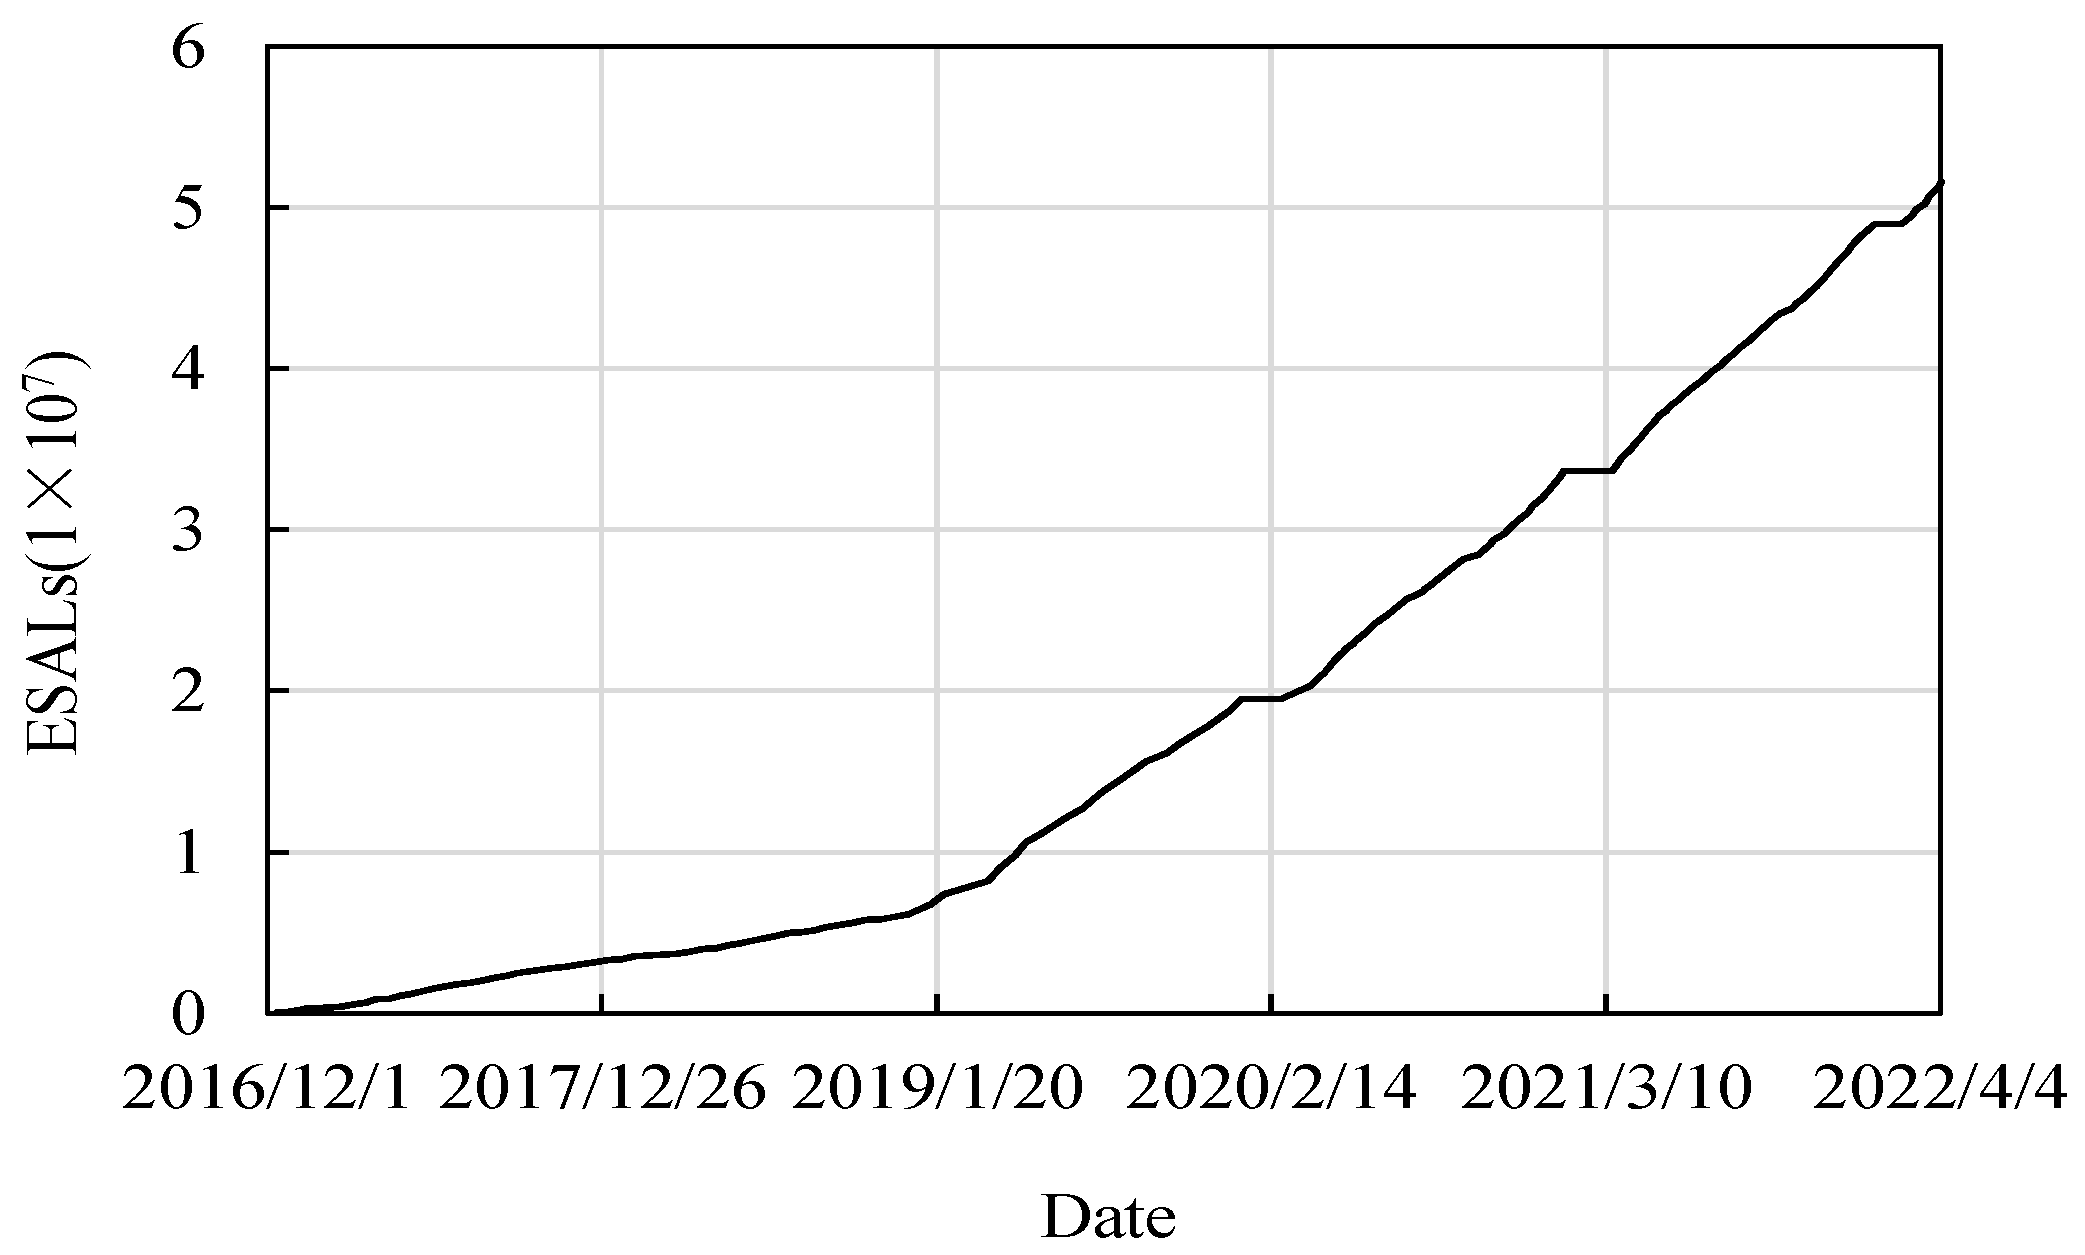
Relying on local projects and test sections, long-term observation of rutting deformation of asphalt pavement is carried out, and the measured rutting data with the cumulative ESALs are obtained. These data can reflect the long-term evolution of pavement rutting under the combined effect of multiple factors such as local climate environment, traffic load, pavement structure, and material type.
(3)
Based on the long-term observation results of rutting deformation, a new rutting prediction model after correction is used to fit the rutting data according to the least squares method, so the local correction coefficients β1, β2, and β3 can be obtained, and the model prediction errors are obtained to judge the model accuracy. Finally, taking these coefficients into Equation (7), the new rutting prediction model after local correction can be obtained.
R a = i = 1 n 2.31 × 10 8 · β 1 k Ri T pef 2.93 · β 2 p i 1.80 N e 0.48 · β 3 R 0 i
Equation (7) is adopted to fit the measured results shown in Figure 6. The local correction coefficients of different structures and all kinds of errors in the model prediction can be obtained (Table 4). Table 4 shows that the accuracy of rutting prediction models of all structures is greatly improved after local correction. The determination coefficients R2 are higher than 0.87, which indicates that the new rutting prediction model after local correction is suitable for the rutting prediction of all kinds of pavement structures where the RIOHTrack is located.
Figure 7 shows the comparison of results before and after the local correction of the rutting models of several representative pavement structures. After local correction, the predicted values of the rutting models with these structures are relatively close to the measured values. The measured result fluctuates up and down near the prediction curve, the error of the model prediction decreases, and the accuracy is improved significantly. For Structures II and VII, the prediction curve is no longer above the measured curve but fluctuates up and down near the measured curve. R2 becomes higher than 0.87 from a negative value. For STR5 with the smallest error, the MSE is 0.13 mm2; the RMSE is 0.36 mm; the MAE is 0.26 mm; and the MAPE is 6.4%. The rutting model can fit the measured value of rutting better, and the prediction effect of the model is better. For Structures III, IV, V, and VI, the prediction curve is no longer parallel to the measured curve and no longer crosses in the middle but fluctuates up and down near the measured curve. R2 increases to 0.87 and above from 0–0.50. For STR8 with the smallest error, the MSE is 0.30 mm2; the RMSE is 0.55 mm; the MAE is 0.39 mm; and the MAPE is 7.5%. The accuracy of the model has been improved significantly.
Comparing the results in Figure 6 and Figure 7, it can be seen that the prediction effect of the new rutting model after correction is significantly better than that of the model before, which is mainly related to the introduction of local correction coefficients β1, β2, and β3. The evolution curves of the measured rutting values of 14 kinds of pavement structures in Figure 6 with the cumulative ESALs basically show a similar phenomenon; that is, the rutting deformation in the initial loading stage (Ne is about 0 to 5 million ESALs) increases rapidly, and the rutting evolution curve is relatively steep. When the initial stage is over, the rutting deformation begins to increase slowly, and the rutting evolution curve also becomes relatively flat. The reason for this phenomenon may be that in the initial loading stage, the voids inside the mixture of the newly paved asphalt pavement are compressed under the load, resulting in obvious compaction deformation of the asphalt concrete structure layer, as can be seen from Figure 6. At the end of the initial loading stage (generally Ne is about 5 million ESALs), the compaction deformation of the asphalt pavement can reach about 4–6 mm. After that, due to the limited compressible voids inside the asphalt mixture, when the voids can no longer be compressed, the asphalt mixture begins to produce plastic permanent deformation. Compared with the compaction deformation, the increase of the plastic deformation is relatively slow and not as rapid as the compaction deformation in the initial stage.
As can be seen from Figure 7, although the overall change in trend of the new and old models is in the form of a monotonically increasing power function, the new model has a steeper curve shape in the initial loading stage, which can better simulate the initial compaction deformation of asphalt mixture when Ne is from 0 to 5 million ESALs. As seen in Equation (7), correction coefficients β1 and β2 respectively correct the constant term of the model and the exponential term of the equivalent temperature, and the equivalent temperature is fixed for the same structure, so the coefficient β2 can also be regarded as a correction to the constant term. According to the results in Table 4, it can be seen that when correction coefficients β1 and β2 are introduced, the constant term of the new model is numerically at least approximately 6 times higher than that of the old model. In addition, when the initial loading stage is over, the evolution curve of the second stage of the new model is smoother than that of the old model, and it can better simulate the slowly increasing plastic permanent deformation, and the model prediction effect is also better. It can be seen from Equation (7) that β3 mainly corrects the exponential term of Ne, and Ne is also the only independent variable in Equation (7), and the evolution curve in the second stage of the model mainly depends on the value of the exponential term. The smaller the value, the smoother the curve. From the values in Table 4, it can be seen that the average value of β3 is about 0.5, the exponential term of the new model is half of that of the old model, and its curve is gentler, which can better simulate the slowly increasing plastic permanent deformation after the initial loading stage.
It should be noted that the measured rutting data of 14 kinds of structures in Figure 6 are obtained based on the accelerated loading test of the RIOHTrack’s full-scale pavement structure. Since the test section is built in the wild, it has always been bearing the long-term effect of the local climate environment, and the pavement structure and material type are quite different. In other words, the measured rutting data in Figure 6 is the test result under the combined effect of local climate environment, traffic load, pavement structure, and material type, which also comprehensively reflects the influence of these factors. On the basis of this test data, the new rutting prediction model obtained after local correction will have higher regional applicability, and is more suitable for rutting prediction of various pavement structures in the area where the RIOHTrack is located, and the accuracy is also higher.

7. Conclusions

Based on the measured value of the rutting model with the pavement structure represented by the RIOHTrack full-scale test track, the rutting prediction model in China’s Specifications is analyzed. Moreover, the following conclusions are drawn:
(1)
The rutting model in China’s Specifications for Design of Highway Asphalt Pavement has significant structural dependence. Different structures are predicted using a unified rutting model with different prediction accuracies.
(2)
The existing rutting model is used for prediction. Structure I has the highest accuracy and the smallest error, and the R2 is greater than 0.6. Rigid base and full-depth asphalt pavement structures have the worst accuracy, and the R2 is negative. The prediction accuracy of other structures is not high, and the R2 is in the range of 0–0.5.
(3)
To improve prediction accuracy, local correction coefficients are introduced in the existing rutting prediction model to establish a new one. The RIOHTrack rutting measured value is adopted to fit the new rutting prediction model, and the local correction coefficients of different structures are obtained.
(4)
After local correction, the accuracy of the rutting prediction model of all structures is greatly improved. The R2 values are greater than 0.87. The predicted values of the rutting models with these structures are relatively close to the measured values. The measured result fluctuates up and down near the prediction curve, the error of the model prediction declines, and the accuracy is improved significantly.
(5)
The measured rutting data in this research are the test results under the combined effect of local climate environment, traffic load, pavement structure, and material type. On the basis of this test data, the new rutting prediction model obtained after local correction will also have higher regional applicability, and is more suitable for rutting prediction of various pavement structures in the area where the RIOHTrack is located, and the accuracy is also higher.
In this research, a local correction method of the rutting prediction model is proposed. Although this method is discussed for the rutting model in China’s Specification, the basic principle of this method is to introduce correction coefficients. The constant terms, exponential terms of loads, and environment parameters in the model are modified respectively to improve the prediction accuracy of the model. The ideas and methods of this model correction also have a certain reference value for the correction of rutting models in other regions. When the accuracy of the estimation of the existing rutting models in other regions is poor, you can refer to this research’s method to make local correction on key parameters to improve accuracy and enhance regional applicability. In addition, the RIOHTrack full-scale pavement test track, which this research is based on, is still carrying out accelerated loading tests. It is expected that by the end of 2022, cumulative ESALs will reach 65 million ESALs. The related work in this research will also carry out further tracking research and analysis with the update of long-term observation data of rutting.

Author Contributions

The authors confirm contribution to the paper as follows: conceptualization and methodology: X.Z.; data curation: Y.W. and Z.M.; formal analysis and validation: Y.W., X.Z. and X.W.; writing and visualization: Y.W., X.Z. and Z.M. All authors have read and agreed to the published version of the manuscript.

Funding

This work was funded by the National Key of Research and Development Plan under Grant number 2020YFA0714300.

Institutional Review Board Statement

Not applicable.

Informed Consent Statement

Not applicable.

Data Availability Statement

Not applicable.

Conflicts of Interest

The authors declare no conflict of interest.

References

  1. AASHTO. Mechanistic-Empirical Pavement Design Guide: A Manual of Practice, Interim Edition; American Association of State Highway and Transportation Officials: Washington, DC, USA, 2008. [Google Scholar]
  2. Shell. Pavement Design Manual; Shell International Petroleum Company, Ltd.: London, UK, 1978. [Google Scholar]
  3. Ministry of Transport of the People’s Republic of China. Specifications for Design of Highway Asphalt Pavement; China Communications Press: Beijing, China, 2017.
  4. Tseng, K.H.; Lytton, R.L. Prediction of Permanent Deformation in Flexible Pavement Materials; American Society for Testing and Materials: West Conshohocken, PA, USA, 1989. [Google Scholar]
  5. Yao, Z.K. Structural Design of Asphalt Pavements; China Communications Press: Beijing, China, 2011. [Google Scholar]
  6. Van de Loo, P.J. Practical approach to the prediction of rutting in asphalt pavements: The Shell method. Transp. Res. Rec. 1976, 616, 15–21. [Google Scholar]
  7. Van de Loo, P.J. Creep test: A key tool in asphalt mix evaluation and in prediction of rutting. J. Assoc. Asph. Paving Technol. 1978, 47, 522–557. [Google Scholar]
  8. Zhang, J.; Cooley, L.A., Jr.; Kandhal, P.S. Comparison of fundamental and simulative test methods for evaluating permanent deformation of hot mix asphalt. Transp. Res. Rec. 2002, 1789, 91–100. [Google Scholar] [CrossRef] [Green Version]
  9. Monismith, C.L.; Hicks, R.G.; Finn, F.N.; Sousa, J.; Harvey, J.; Weissman, S.; Deacon, J.; Coplantz, J.; Paulsen, G. Permanent Deformation Response of Asphalt Aggregate Mixes; Report SHRP-A-415; Strategic Highway Research Program, National Research Council: Washington, DC, USA, 1994. [Google Scholar]
  10. Monismith, C.L.; Epps, J.A.; Finn, F.N. Improved asphalt mix design. J. Assoc. Asph. Paving Technol. 1985, 54, 340–406. [Google Scholar]
  11. El-Basyouny, M.M.; Witczak, M.; Zapata, C.E. Development of asphalt concrete rutting model using permanent strain database. In Proceedings of the Transportation Research Board 86th Annual Meeting, Washington, DC, USA, 21–25 January 2007. [Google Scholar]
  12. National Cooperative Highway Research Program. Guide for Mechanistic-Empirical Design of New and Rehabilitated Pavement Structures, Final Document, Appendix GG-1: Calibration of Permanent Deformation Models for Flexible Pavements; National Cooperative Highway Research Program: Champaign, IL, USA, 2004. [Google Scholar]
  13. Kaloush, K.E.; Witczak, M.W. Tertiary flow characteristics of asphalt mixtures. J. Assoc. Asph. Paving Technol. 2002, 71, 248–280. [Google Scholar]
  14. Kandhal, P.S.; Mallick, R.B. Effect of mix gradation on rutting potential of dense-graded asphalt mixtures. Transp. Res. Rec. 2001, 1767, 146–151. [Google Scholar] [CrossRef]
  15. Yang, Z.; He, D. Summarizing and Improving of Rut Pre Evaluating Method in Asphalt Pavement. J. East North Highw. 2001, 24, 12–15. [Google Scholar]
  16. Verstraeten, J.; Veverka, V.; Francken, L. Rational and Practical Designs of Asphalt Pavements to Avoid Cracking and Rutting. In Proceedings of the 5th International Conference on the Structural Design of Asphalt Pavements, Delft, The Netherlands, 23–26 August 1982. [Google Scholar]
  17. Zhang, D.; Li, J. Prediction of Rutting in Asphalt Pavement. China J. Highw. Transp. 1995, 8, 23–29. [Google Scholar]
  18. Kenis, W.; Sherwood, J.; McMahon, T. Verification and Application of the Vesys Structural Subsystem. In Proceedings of the 5th International Conference on the Structural Design of Asphalt Pavements, Delft, The Netherlands, 23–26 August 1982. [Google Scholar]
  19. Kim, H.B.; Buch, N.; Park, D. Mechanistic-empirical rut prediction model for in-service pavements. Transp. Res. Rec. 2000, 1730, 99–109. [Google Scholar] [CrossRef]
  20. Kim, M.; Mohammad, L.; Elseifi, M. Effects of Various Extrapolation Techniques for Abbreviated Dynamic Modulus Test Data on the MEPDG Rutting Predictions. J. Mar. Sci. Technol. 2015, 23, 353–363. [Google Scholar]
  21. Shami, H.I.; Lai, J.S.; D’angelo, J.A.; Harman, T.P. Development of Temperature-Effect Model for Predicting Rutting of Asphalt Mixtures Using Georgia Loaded Wheel Tester. Transp. Res. Rec. 1997, 1590, 17–22. [Google Scholar] [CrossRef]
  22. Monismith, C.L.; McLean, D.B.; Ogawa, N. Design Considerations for Asphalt Pavements; FHWA-CA-77-D-6-1; Federal Highway Administration: Berkley, CA, USA, 1978.
  23. Monismith, C.L.; Tayebali, A.A. Permanent deformation (rutting) consideration in asphalt concrete pavement sections (with discussion and closure). J. Assoc. Asph. Paving Technol. 1988, 57, 414–463. [Google Scholar]
  24. Wijeratne, A.; Sargious, M. Prediction of Rutting in Virgin and Recycled Asphalt Mixtures for Pavement Using Triaxial Tests. J. Assoc. Asph. Paving Technol. 1987, 56, 111–129. [Google Scholar]
  25. Huang, X.; Zhang, X.; Deng, X. Asphalt Pavement Rutting Prediction of High-Grade Highway. J. Southeast Univ. (Nat. Sci. Ed.) 2000, 30, 96–101. [Google Scholar]
  26. Wang, H.; Zhang, C.; You, Z. Calibration of rutting prediction model in MEPDG based on mathematical statistics method. J. Chang. Univ. (Nat. Sci. Ed.) 2013, 33, 1–7. [Google Scholar]
  27. Liu, W.; Lin, Z. Study on area correction factor of rutting prediction model for flexible base asphalt pavement based on MEPDG. J. Highw. Transp. Res. Dev. 2017, 34, 67–70. [Google Scholar]
  28. Retherford, J.; Mcdonald, M. Reliability Methods Applicable to Mechanistic-Empirical Pavement Design Method. Transp. Res. Rec. J. Transp. Res. Board 2010, 2154, 130–137. [Google Scholar] [CrossRef]
  29. Hoegh, K.; Khazanovich, L.; Jensen, M. Local Calibration of MEPDG Rutting Model for MnROAD Test Sections. Transp. Res. Rec. J. Transp. Res. Board 2010, 2180, 130–141. [Google Scholar] [CrossRef]
  30. Muthadi, N.; Kim, Y. Local Calibration of Mechanistic-Empirical Pavement Design Guide for Flexible Pavement Design. Transp. Res. Rec. J. Transp. Res. Board 2008, 2087, 131–141. [Google Scholar] [CrossRef]
  31. Seitllari, A.; Lanotte, M.; Kutay, M. Recommended Calibration Procedure of MEPDG Asphalt Rutting Model Using Repeated Load Permanent Deformation and Confined and Unconfined Dynamic Modulus Data. J. Transp. Eng. Part B Pavements 2020, 147, 04020079. [Google Scholar] [CrossRef]
  32. Jannat, G.; Yuan, X.; Shehata, M. Development of regression equations for local calibration of rutting and IRI as predicted by the MEPDG models for flexible pavements using Ontario’s long-term PMS data. Int. J. Pavement Eng. 2016, 17, 166–175. [Google Scholar] [CrossRef]
  33. Hassan, H.; Baaj, H.; Kadhim, H. Calibration of MEPDG permanent deformation models using Hamburg Wheel Rut Tester and field data. Int. J. Pavement Eng. 2021. [Google Scholar] [CrossRef]
  34. AASHTO. Mechanistic-Empirical Pavement Design Guide: A Manual of Practice, 2nd ed.; American Association of State Highway and Transportation Officials: Washington, DC, USA, 2015. [Google Scholar]
  35. AASHTO. Mechanistic-Empirical Pavement Design Guide: A Manual of Practice, 3rd ed.; American Association of State Highway and Transportation Officials: Washington, DC, USA, 2020. [Google Scholar]
  36. Wang, X. Design of Pavement Structure and Material for Full-scale Test Track. J. Highw. Transp. Res. Dev. 2017, 34, 30–37. [Google Scholar]
  37. Wang, X.D.; Zhang, L.; Zhou, X.Y.; Xiao, Q.; Wei, G. Review of Researches of RIOHTrack in 2017. J. Highw. Transp. Res. Dev. 2017, 35, 5–13. [Google Scholar]
  38. Zhang, L.; Zhou, X.; Wang, X. Research progress of long-life asphalt pavement behavior based on the RIOHTrack full-scale accelerated loading test. Chin. Sci. Bull. 2020, 65, 3247–3258. [Google Scholar] [CrossRef]
  39. Wang, X.D.; Zhang, L.; Zhou, X.Y.; Xiao, Q.; Guan, W.; Shan, L.Y. Research progress of RIOHTrack in China. In Accelerated Pavement Testing to Transport Infrastructure Innovation; Springer: Cham, Switzerland, 2020. [Google Scholar]
Figure 1. The RIOHTrack layout.
Applsci 12 06805 g001
Figure 2. The RIOHTrack structure.
Applsci 12 06805 g002
Figure 3. Axle load and axial distribution of trucks in loading mode I.
Applsci 12 06805 g003
Figure 4. Axle load and axial distribution of trucks in loading mode II.
Applsci 12 06805 g004
Figure 5. Curves of the cumulative number of equivalent single-axle loads.
Applsci 12 06805 g005
Figure 6. Comparison between the predicted value of the model and the measured value. (a) Structure I-STR1. (b) Structure I-STR2. (c) Structure II-STR4. (d) Structure II-STR5. (e) Structure III-STR7. (f) Structure III-STR8. (g) Structure IV-STR10. (h) Structure IV-STR12. (i) Structure V-STR11. (j) Structure V-STR13. (k) Structure VI-STR16. (l) Structure VI-STR17. (m) Structure VII-STR18. (n) Structure VII-STR19.
Applsci 12 06805 g006aApplsci 12 06805 g006b
Figure 7. Comparison of predicted and measured values before and after rutting model correction. (a) STR2. (b) STR5. (c) STR7. (d) STR17.
Applsci 12 06805 g007
Table 1. Permanent deformation of asphalt mixture rutting test.
AC TypeAC10AC13-IAC13-IISMA13AC20AC20AC20AC25AC25AC25
Asphalt TypeSBSSBSSBSSBSAH30AH50SBSAH30AH50AH70
Permanent Deformation (mm)2.401.541.651.821.702.671.301.962.122.82
Table 2. Error between the predicted value of the rutting model and the measured value.
Structure TypeMSERMSEMAEMAPER2
Unitmm2mmmm--
ISTR11.161.080.9118.3%0.6346
STR21.121.060.8517.6%0.6223
IISTR47.702.782.4053.7%−8.2491
STR53.671.921.6932.1%−1.2133
IIISTR73.521.881.6425.2%0.3337
STR85.682.382.2930.9%0.2222
IVSTR105.632.372.2030.5%0.0469
STR123.091.761.3523.0%0.0860
VSTR112.891.701.4323.1%0.4220
STR132.451.561.2621.8%0.2500
VISTR162.671.631.3124.4%0.0444
STR171.721.311.1523.1%0.2084
VIISTR187.232.692.2025.3%−0.0792
STR195.512.352.0131.8%−1.0787
Table 3. Rutting values at the end of design life.
Structure
Type
IIIIIIIVVVIVII
STR1STR2STR4STR5STR7STR8STR10STR12STR11STR13STR16STR17STR18STR19
RIOHTrack
Measured values (mm)
7.70 7.89 5.15 6.40 9.99 11.60 10.69 8.90 10.05 8.50 7.89 6.63 10.45 7.36
Model
Predicted Values (mm)
9.20 9.19 9.69 9.87 9.91 9.85 9.57 9.28 10.02 9.91 8.25 8.86 15.72 11.96
MAPE (%)19.5 16.5 88.1 54.2 0.8 15.1 10.5 4.3 0.4 16.6 4.5 33.8 50.5 62.5
Table 4. Local correction coefficients and errors of rutting model.
Structure Typeβ1β2β3MSERMSEMAEMAPER2
ISTR16.1319 1.2123 0.5440 0.210.460.388.6%0.9331
STR26.1201 1.2120 0.5425 0.180.420.317.4%0.9400
IISTR49.4764 1.2749 0.3677 0.110.330.246.6%0.8722
STR57.5312 1.2573 0.4409 0.130.360.266.4%0.9237
IIISTR77.0638 1.2254 0.5330 0.310.560.408.2%0.9415
STR85.4336 1.1970 0.6079 0.300.550.397.5%0.9591
IVSTR107.2853 1.2287 0.5340 0.470.690.4910.1%0.9203
STR1210.0245 1.2674 0.4357 0.410.640.4810.6%0.8787
VSTR117.0344 1.2237 0.5301 0.340.590.468.7%0.9311
STR139.6484 1.2624 0.4367 0.310.560.429.2%0.9045
VISTR169.9075 1.2660 0.4412 0.310.550.3910.0%0.8901
STR178.2984 1.2436 0.4598 0.240.490.389.6%0.8913
VIISTR184.8346 1.1941 0.5643 0.460.680.5210.8%0.9312
STR196.9198 1.2416 0.4625 0.250.500.377.9%0.9073
Publisher’s Note: MDPI stays neutral with regard to jurisdictional claims in published maps and institutional affiliations.

