Abstract
In order to study the influence of moisture on the interface of crumb rubber–asphalt (CR) mixture, the interface bonding performance and crack resistance of a crumb rubber–asphalt mixture under dry and wet conditions were studied at three scales. At the macroscale, the characteristics of medium temperature fatigue cracking and low temperature fracture were studied by semi-circular bending tensile test (SCB) on the example of digital image correlation (DIC) technique. At the microscale, the surface energy of CR with basalt and limestone was measured using the contact angle measurement test, and then the adhesion work was calculated and analyzed. At the molecular scale, the model of CR, the model of basalt representative mineral (augite) and limestone representative mineral (calcite) were studied by molecular dynamics simulation. The relationship between these three scales was further explored to reveal the mechanism of the damage of moisture on the interface deterioration of the CR mixture. The results show that moisture has a certain effect on the interface of the CR mixture, which is characterized by macroscopically reducing the crack resistance of the asphalt mixture, microscopically reducing the adhesion ability between the asphalt and the aggregate and weakening the interaction between the asphalt and aggregate molecules at the molecular scale. Molecular dynamics can accurately simulate the deterioration of micro asphalt-aggregate adhesion under the damage of moisture. The decrease in microadhesion leads to the decrease in the crack resistance of the macro-CR mixture.
1. Introduction
The study of a crumb rubber–asphalt (CR) mixture proved that it had good road performance and diverse functions [1,2,3,4,5,6]. However, in the service process of crumb rubber–asphalt pavement, the looseness, spalling, cracks and other diseases have seriously affected the service performance and service life of crumb rubber–asphalt pavement [7,8,9]. The reason is that many issues are related to moisture. The performance of the interface between CR and aggregate decreases under the condition of moisture, resulting in moisture damage to the CR mixture, thus affecting the service life of asphalt pavement [10,11]. Therefore, clarifying the interaction mechanism between the CR and the aggregate in the presence of moisture is the core issue to ensure the service durability of a CR mixture and provides a reference for the application and promotion of a crumb asphalt mixture.
The interface behavior of asphalt mixtures under the action of moisture is usually evaluated by macro-indicators such as the crack strength and spalling rate [12,13,14,15]. In addition, some scholars have used microcharacterization technology to study the asphalt mixture, including the surface morphology, structure, mechanical properties and other microproperties of the material [16,17,18,19,20]. Molecular simulation [21,22] is a computer numerical simulation test, which is not limited by the detection means, specimen preparation or other conditions. It effectively complements the shortcomings of macro tests and can reveal the molecular-scale mechanism of many macro tests. In recent years, it has also been more widely applied to the research of asphalt mixtures. From the current research, the research on the interface effect of asphalt mixtures mainly focuses on single-scale research and analyses of macroperformance and materials’ microcharacteristics, but the multiscale and cross-scale research idea can better solve the mechanism problem of asphalt mixture performance. Many scholars have also carried out multiscale studies on different properties of asphalt and asphalt mixtures, including asphalt aging performance [23,24], the combination of old and new materials in recycled asphalt mixtures [25,26,27], the diffusion of modifiers [28,29], and the interaction between asphalt and aggregates [30,31]. A large number of studies have confirmed that the multiscale idea is feasible in the research of asphalt and asphalt mixtures.
Therefore, in order to study the interface adhesion and failure mechanism of CR mixtures under the action of moisture using the multiscale method, this study carried out a cracking resistance test of a CR mixture at the macroscale and compared the effects of different cracking forms on the CR mixture. At the microscale, the surface free energies of asphalt and aggregate were calculated and analyzed by the surface energy theory, and the damage from moisture on the surface adhesion of asphalt and aggregate was studied. At the molecular scale, the interaction mechanism between CR and aggregate under the action of moisture was studied by constructing a 12-component CR model, a representative molecular aggregate model, and an interface model of CR and aggregate. Finally, the interface adhesion mechanism and failure behavior of the CR mixture under the action of moisture was revealed by correlating the interface properties under different scales.
2. Materials and Models
2.1. Preparation of Test Materials and SCB Specimens
2.1.1. Asphalt
The penetration degree of matrix asphalt used in this study was 90, and the modifier was 0.25 mm rubber powder particles. The rubber powder particle content was 20% by weight of asphalt. The quantitative matrix asphalt was weighed, the quality accuracy was controlled at 0.01 g, the temperature of the matrix asphalt was controlled at 140 °C, and the rubber powder particles preheated and dried in advance were slowly added to the matrix asphalt many times, and gradually heated up and stirred. Finally, the temperature of asphalt and rubber powder mixture was controlled at 180 °C, and the mixture was stirred for 30 min. The evenly mixed mixture of asphalt and rubber powder was put into the high-speed shear emulsifier to maintain the shear rate of 6000~7000 r/min and the temperature of 160 °C for 30 min, and then it was kept in the oven at 120 °C for 2 h to prepare the CR. The technical matrix asphalt and CR indices indices are shown in Table 1.

Table 1.
Technical indices of CR and matrix asphalt.
Asphalt is a complex mixture of macromolecules. In the study of the chemical composition of asphalt, the asphalt was divided into several parts according to different solubility and physicochemical properties by using the different solubilities of various organic compounds in asphalt. According to the four-component analysis method stipulated in Standard Test Methods of Bitumen and Bituminous Mixtures for Highway Engineering (JTG E20-2011) [32], the four-component analysis test of matrix asphalt was carried out. The mass percentages of the four components of matrix asphalt are shown in Table 2.

Table 2.
Mass percentages of four components of matrix asphalt.
2.1.2. Aggregate and Gradation of CR Mixture
The aggregate used in this study was basalt machine-made crushed aggregate, and relevant tests were carried out according to Test Methods of Aggregate for Highway Engineering (JTG E42-2005) [33]. The technical indices of the coarse aggregate and fine aggregate are shown in Table 3 and Table 4, respectively.

Table 3.
Technical indices of coarse aggregate.

Table 4.
Technical indices of fine aggregate.
The filler was lime powder ground from limestone. Relevant tests were carried out according to Test Methods of Aggregate for Highway Engineering (JTG E42-2005). The technical indices are shown in Table 5.

Table 5.
Technical indices of filler.
The gradation of the CR mixture was AC-16, and the gradation was designed in accordance with the requirements of Technical Specifications for Construction of Highway Asphalt Pavement (JTG F40-2004) [34]. The gradation composition is shown in Table 6.

Table 6.
Gradation composition of CR mixture.
2.1.3. Preparation of SCB Specimen
The SCB specimen was simple in molding and had strong repeatability. In addition, the stress state of the specimen was more in line with the actual use of road surface and better simulates the wheel load [35].
The CR mixture was formed by a rotary compaction instrument. The diameter of the specimen was 150 mm, the compressive stress was 600 kPa, the deviation angle was 1.16°, the speed was 30 r/min, and the compaction control method was 170 mm height control. The target void ratio was 5.0%. A 100 mm diameter core machine was used to core the cylindrical CR mixture. The core sample was cut into a semicircle specimen with a thickness of 40 mm ± 0.5 mm. Then, a pre-cut with a depth of 1 cm and width of 4 mm was made in the middle of the semicircle span. Preparation process of SCB specimen is shown in Figure 1.

Figure 1.
SCB specimen preparation.
Half of the SCB specimens were saturated with water for 15 min under the vacuum degree of 97.3 kpa and then soaked in water for 48 h to achieve the purpose of soaking. The water temperature was 25 °C. The dried specimen was used as a control for reserve.
2.2. Preparation of Contact Angle Measurement Sample
The CR was heated to a molten state and placed on the glass slide. The glass slide and asphalt were put into the oven and heated at 120 °C for 30 min to make the asphalt on the surface of the glass slide fully leveled. The leveled asphalt and the glass slide were removed and put into the drying chamber for cooling. The basalt and limestone aggregates were cut into cubes of 60 mm × 60 mm × 60 mm and then polished with lithographic polishing machine to remove surface particles to avoid their impact on experimental results. The polished test blocks were put into the drying chamber for standby. Contact angle measurement samples are shown in Figure 2.

Figure 2.
Contact angle measurement sample: (a) Crumb rubber sample, (b) Basalt and limestone blocks.
2.3. Construction of Models
2.3.1. Model of CR
In order to better study the physical, mechanical and rheological properties of asphalt, Li et al. [36] proposed a 12-component model of asphalt, including 3 asphaltenes, 5 resins, 2 saturates and 2 aromatics. The matrix asphalt molecular model was constructed according to the four-component ratio of asphalt obtained in the experiment (as shown in Table 2) and the 12-component asphalt model. The molecular ratio of each component was listed in Table 7.

Table 7.
Ratio of matrix asphalt component model.
Representative molecular models of asphaltenes, aromatics, saturates and resins were added according to the ratio calculated in Table 7 to construct the matrix asphalt molecular group model, as shown in Figure 3.
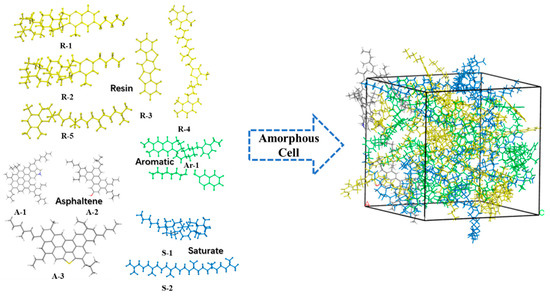
Figure 3.
Matrix asphalt model composition.
The rubber components of waste tire rubber powder were mainly natural rubber, butadiene rubber and styrene butadiene rubber. The main rubber components of radial truck tires were natural rubber and styrene–butadiene rubber, and the mass ratio of natural rubber to styrene–butadiene rubber was 7:3. Natural rubber was the homopolymer of the natural rubber repeat unit, while styrene–butadiene was formed by the emulsion polymerization of styrene and butadiene at low temperature. The content of each structural unit is shown in Table 8 below.

Table 8.
Content of styrene butadiene rubber polymer structure repeat unit (w%).
The natural rubber was polymerized into a single natural rubber chain according to 15 repeating units, the styrene–butadiene rubber was polymerized into a single styrene–butadiene rubber chain according to the content in Table 8, and then the structure and energy of the single natural rubber chain and the single styrene–butadiene rubber chain were optimized according to the ratio of 7:3. After optimization, the Amorphous Cell module was used to construct the rubber powder molecular group model. The construction process of the rubber powder molecular group model is shown in Figure 4.
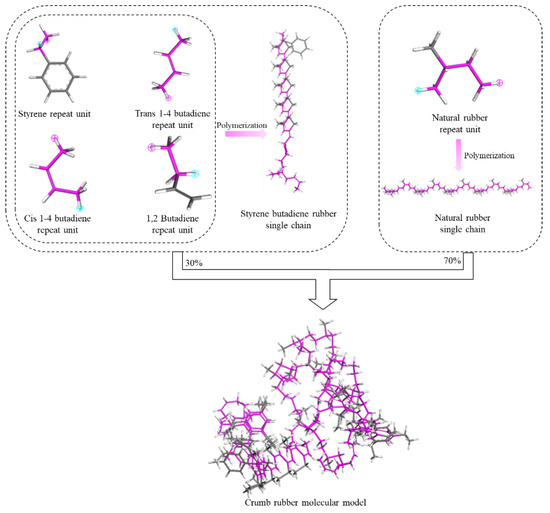
Figure 4.
Construction process of the crumb rubber molecular group model.
After the molecular model of asphalt and rubber powder was established, the molecular model of CR was constructed by combining the two molecular group models according to a 20%mass ratio of rubber powder to asphalt, as shown in Figure 5.
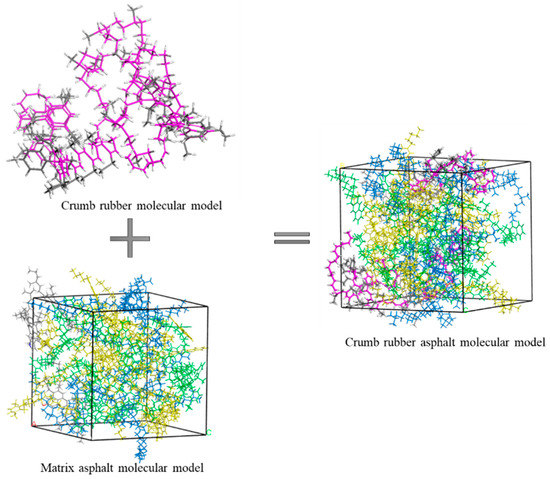
Figure 5.
Composition of molecular CR model.
2.3.2. Model of Aggregate Mineral
Basalt was the most commonly used aggregate in engineering applications in Inner Mongolia. Therefore, basalt was selected as the representative aggregate in this study, and limestone was selected as the control group. The main mineral composition of basalt was augite, and the main mineral composition of limestone was calcite. The crystal cells were treated with supercell, and the crystal surface was cut along the direction of (0 0 1) to form a two-dimensional supercell system. A 10 Å vacuum layer was established on the surface of the supercell along the Z direction, which had a three-dimensional periodic boundary condition. It was used as the representative molecular model of the aggregate. The molecular model and information are listed in Table 9.

Table 9.
The representative aggregate molecular models and information.
2.3.3. Interface Model of CR-Aggregate
The CR-aggregate interface model was constructed by attaching the asphalt layer to the aggregate model, a 50 Å vacuum layer was established along the Z direction on the asphalt layer and the aggregate model was fixed to eliminate the basement effect of three-dimensional periodic boundary conditions. Water molecules were added between the asphalt and aggregate interface to form the asphalt–aggregate interface model under water immersion conditions. The asphalt–aggregate interface model is shown in Figure 6.
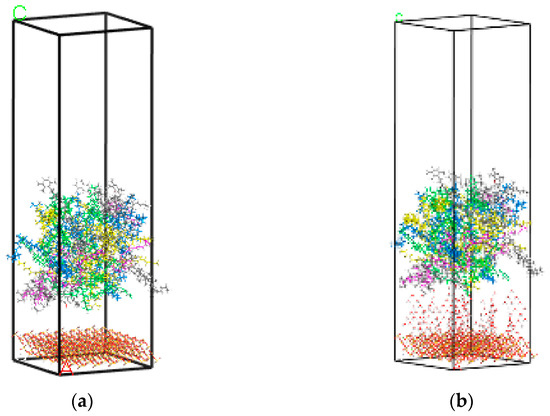
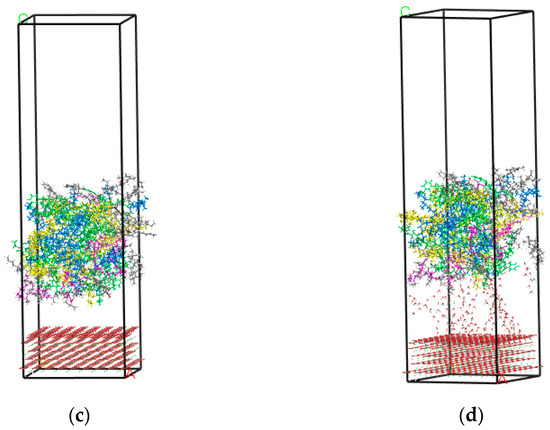
Figure 6.
(a) Interface model of CR–augite. (b) Interface model of CR–water–augite. (c) Interface model of CR-calcite. (d) Interface model of CR–water–calcite.
3. Results and Analysis
3.1. SCB Test and Analysis
3.1.1. SCB Test
The loading equipment was a universal material testing (UTM) machine, and the distance between the two fulcrum points at the bottom of the semicircular specimen was 80 mm. The two failure modes adopted different loading methods. Sinusoidal wave was selected for the loading waveform of the medium-temperature fatigue failure test, and the loading frequency was determined by simulating the actual road speed. Considering the highway driving speed (60–120 km/h), when the driving speed was 60 km/h, the road surface was unfavorable, and the corresponding frequency was 10 Hz. According to the preliminary semi-circular bending (SCB) test, the failure load of the specimen with a pre-cut slot was 2500 N and the selected stress ratio was 0.2, so the loading range was 50 to 500 N. The test termination condition was that the specimen was completely fractured. In the low-temperature fracture test, the specimens were subjected to vertical uniform load at a loading rate of 1 mm/min. The test termination condition was that the specimen was completely fractured. The loading conditions are shown in Table 10.

Table 10.
Loading conditions of SCB.
3.1.2. Digital Image Measurement System
The digital image measurement system consisted of two fixed light sources, image acquisition equipment (two CCD cameras), calibration equipment, image processing equipment, a loading system, etc. The basic principle of digital image correlation (DIC) technology is shown in Figure 7. Speckle images before and after the surface deformation of the measured object were recorded by image acquisition equipment. The reference subregion with displacement point (x, y) as the center and side length of (2 M + 1) × (2 M + 1) was selected in the speckle images before deformation. By searching the speckle image after deformation, the target subregion with the greatest correlation with the reference subregion was found. The center point of the target subregion was defined as (x’, y’). The horizontal and vertical displacement components u and v of the subregion before and after deformation were obtained by the changes of the center points of the reference subregion and the target subregion after deformation.
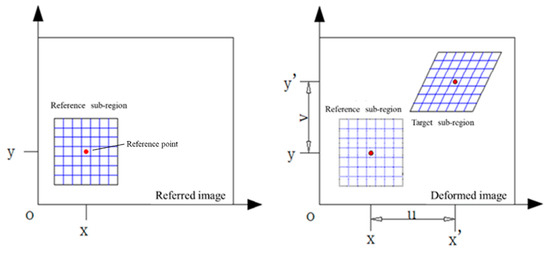
Figure 7.
Displacement diagram before and after deformation.
3.1.3. Strain Energy and Interfacial Damage Factor
The horizontal strain density DE was the area enclosed under the Exx-t curve before the horizontal strain reached the maximum value (macrofracture), namely, the cumulative value of horizontal strain of asphalt mixture from the beginning of loading to the macrofracture. The higher the horizontal strain density DE value was, the better the cracking resistance of the asphalt mixture was, and its function expression [37] was as follows:
where Exx (t) is a horizontal strain–time curve function; t0 is the time corresponding to the maximum horizontal strain; and dt is the derivative of time.
The interfacial damage factor can represent the damage degree of the interface, thus reflecting the aggregate–asphalt interface bonding strength. The greater the interface damage factor DI was, the greater the damage degree of the aggregate–asphalt interface was and the weaker the interface bonding strength was. The interfacial damage factor was defined as DI [38]:
where Exx max is the maximum value of Exx, that is, Exx at the time of specimen failure.
The medium-temperature fatigue fracture strain density DE was the loading time obtained according to the loading times of repeated load, and the horizontal strain before the cumulative horizontal strain reached the maximum value (macrofracture) was integrated with the loading time to obtain the area surrounded under the Exx-t curve, that is, the cumulative value of horizontal strain of asphalt mixture from the beginning of loading to the macrofracture. In the interfacial damage factor DI, Exxmax selected the maximum horizontal strain before crack penetration. Taking Figure 8 as an example, the variation curve of the horizontal strain of the medium-temperature fatigue fracture with the loading time/times of repeated load under dry condition, the dark area in the figure was the integral area of Exx to the loading time, that is, the horizontal strain energy density DE. The peak value of the Exx curve in the figure was the maximum horizontal strain Exxmax.
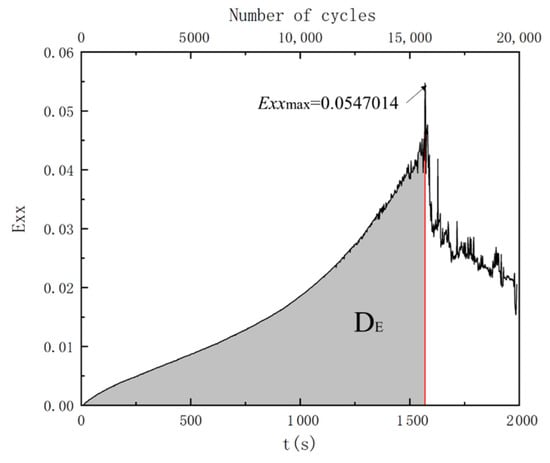
Figure 8.
Variation curve of horizontal strain with loading time/times of repeated load.
3.1.4. Analysis of Influence of Moisture on Cracking Resistance of the CR Mixture
The cracking of the asphalt mixture was mainly characterized by low-temperature fracture and medium-temperature fatigue cracking. Based on DIC technology, the strain energy density (DE) and interfacial damage factor (DI) of the CR mixture before and after immersion with different failure forms were analyzed, as shown in Figure 9, Figure 10, Figure 11 and Figure 12.
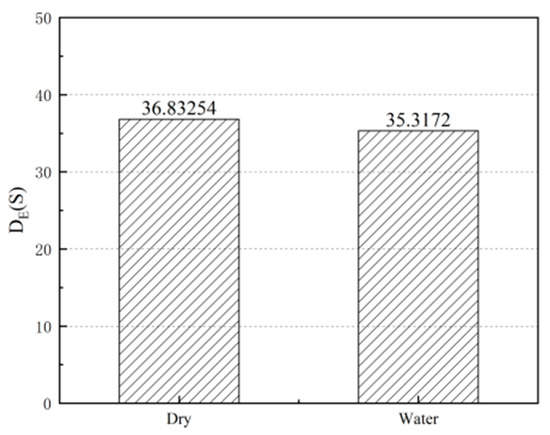
Figure 9.
DE of CR mixture before and after immersion under medium temperature fatigue failure.
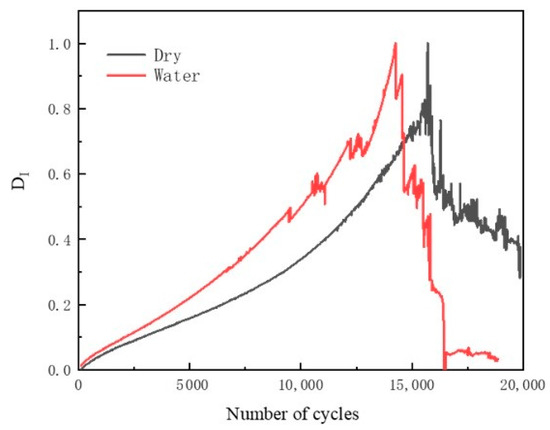
Figure 10.
DI of CR mixture before and after immersion under medium temperature fatigue failure.
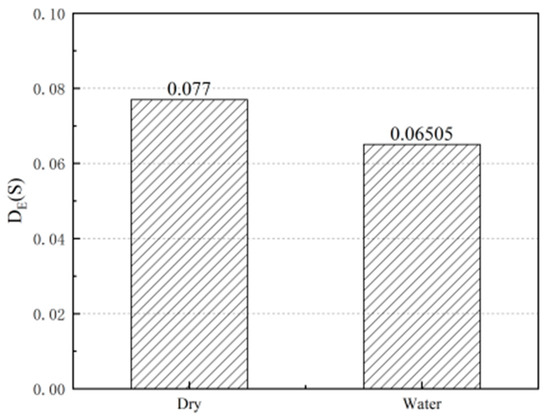
Figure 11.
DE of CR mixture before and after immersion under low temperature fracture.
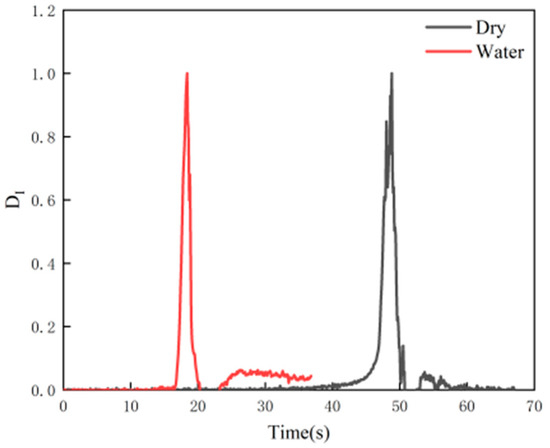
Figure 12.
DI of CR mixture before and after immersion under low-temperature fracture.
It can be seen from Figure 9, Figure 10, Figure 11 and Figure 12 that the DE of CR decreases after immersion, and the DI occurs earlier than that of the dry environment. In addition, it can be seen that the DI increases faster in the environment with water, indicating that the interface is easier to be destroyed in the environment with water.
As a kind of viscoelastic–plastic composite material, the temperature and loading mode have great significance to the performance of the asphalt mixture. By comparing Figure 9 and Figure 11, the strain energy density of the asphalt mixture at low temperature is significantly reduced by three orders of magnitude compared to that under repeated medium-temperature load. This indicates that when the temperature is lower, the loading time is shorter, the force is larger and the accumulated microstrain of the asphalt mixture before fracture is smaller; that is, the specimen fracture occurs when there is no obvious deformation. Although the strain energy density of the specimen decreases due to both failure modes, it can be found that the strain energy density of the specimen after immersion is 15.5% lower than that of the dry specimen under low-temperature fracture failure, and the strain energy density of the specimen after immersion is 4.1% lower than that of the dry specimen under medium temperature repeated load. Obviously, the damage from water is more serious under the low-temperature fracture. This is due to the decrease in asphalt adhesion caused by water immersion in the asphalt mixture, which makes the asphalt peel off from the aggregate surface. Under the low-temperature condition, the temperature stress generated in the asphalt layer exceeds the tensile strength of the asphalt mixture, and cracks occur at the adhesion interface between the asphalt and the aggregate. Therefore, the low-temperature condition intensifies the damage effect from water on the interface between the asphalt and the aggregate.
Comparing Figure 10 and Figure 12, it can be seen that the curve in Figure 10 shows that the damage factor of repeated medium-temperature load increases gradually with time, which can be divided into three stages. The first stage is the rapid growth stage, in which Exx increases rapidly, but the duration is short. The specimen as a whole resists the applied repeated load, but there is no cracking, and the strain increases rapidly, indicating that the crumb rubber–asphalt mixture has a certain deformation resistance. The second stage is the accelerated growth stage, in which Exx and the growth rate gradually increase until reaching the peak value, which is caused by the gradual generation and full development of cracks until they are penetrated. The third stage is the abrupt fluctuation decline stage. In this stage, Exx drops suddenly after the peak value. Then, the fluctuation drops to the lowest value because the specimen is completely cracked, and the horizontal strain gradually decreases with the release of horizontal stress. However, in Figure 12, the peak in the damage factor value of low-temperature fracture failure occurs suddenly. The results show that the cracks of specimens under medium temperature repeated load are a cumulative process from damage to micro-cracks and then to macro-cracks, while the cracks in specimens under low-temperature fracture failure appear suddenly, and the damage process is very short. The interfacial damage factors of the two failure modes reach the peak value in advance after immersion, while the dry one lags behind. However, the change in the interfacial damage factors of the two failure modes with time is also significantly different. It is not difficult to find that the distance between the two peaks before and after immersion under low-temperature fracture failure is greater than that before and after immersion under repeated medium-temperature load, which is consistent with the conclusion of the above-mentioned strain energy density. That is to say, the damage from water is more serious under low-temperature fracture.
3.2. Contact Angle Measurement Test and Analysis
3.2.1. Contact Angle Measurement Test
According to material surface theory, surface free energy in a vacuum was the energy that separated a solid or liquid to create a new interface. Gibbs free energy refers to the difference between the initial and final free energy of a certain system, which was represented by ΔG. According to Gibbs free energy, the asphalt–aggregate model in the dry condition and the asphalt–water–aggregate adhesion-cracking model in the wet condition were established, as shown in Figure 13.

Figure 13.
Schematic diagram of asphalt–aggregate adhesion-cracking model: (a) Dry condition; (b) Wet Condition.
Fowkes et al. [39] assumed that the dispersion force between the liquid and solid interface can be expressed by the geometric mean of the dispersion components of the free energy on liquid and solid surfaces. On this basis, Owens et al. [40] further developed this method to make it applicable to polar components. Adhesion work between asphalt and aggregate is calculated as follows:
where is the adhesion work between asphalt and aggregate under dry conditions (mJ/m2); is the adhesion work between asphalt and aggregate under wet conditions (mJ/m2); is the surface free energy between the asphalt and water interface (mJ/m2); is the surface free energy between the aggregate and water interface (mJ/m2); is the surface free energy between the asphalt–aggregate interface ((mJ/m2)); is the dispersion component of the surface free energy of water (mJ/m2); is the dispersion component of the surface free energy of aggregate (mJ/m2); is the dispersion component of the surface free energy of asphalt (mJ/m2); is the Lewis acid component of the surface free energy of aggregate (mJ/m2); is the Lewis basic component of the surface free energy of aggregate (mJ/m2); is the Lewis acid component of the surface free energy of asphalt (mJ/m2); is the Lewis basic component of the surface free energy of asphalt (mJ/m2); is the Lewis acid component of the surface free energy of water (mJ/m2); and is the Lewis basic component of the surface free energy of water (mJ/m2).
The water stability index [41] was defined, and its calculation is shown in Equation (4). The larger was, the less the adhesion work of the material was affected by water, and the better its surface adhesion ability was:
where is the water stability index; is the adhesion work between the asphalt and aggregate under dry conditions (mJ/m2); and is the adhesion work between the asphalt and aggregate under wet conditions (mJ/m2).
3.2.2. Analysis of the Contact Angle Measurement Results
The surface free energy parameters obtained through the contact angle measurement test were listed in Table 11.

Table 11.
Surface free energy parameters of different materials (mJ/m2).
The surface free energy parameters listed in Table 11 were substituted into Equation (3) to obtain the adhesion work and between CR and basalt and limestone in dry and wet conditions, respectively. The water stability indices of the adhesion work of different aggregates and CR were further calculated, and the results are plotted in Figure 14 and Figure 15.
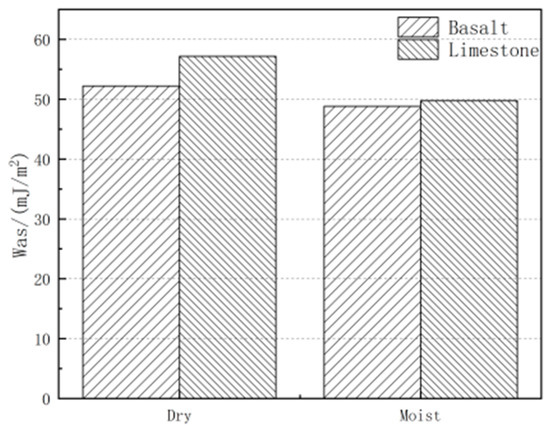
Figure 14.
Influence of water on adhesion work of CR.
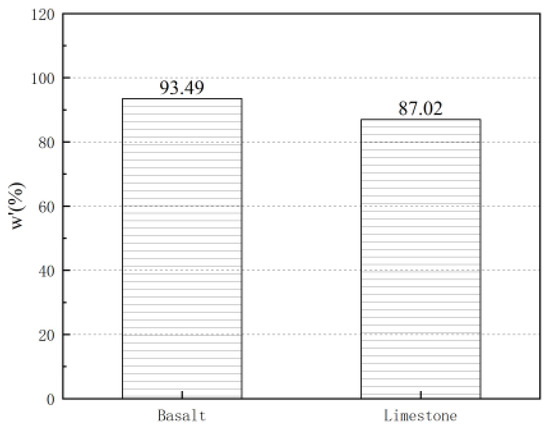
Figure 15.
Influence of different aggregates and CR on .
It can be seen from Figure 14 that the wet surface reduces the adhesion work between the aggregate and the CR. Although the adhesion work between the CR and the basalt and limestone aggregates decreases, it is obvious that water has a greater impact on the limestone. Under the wet condition, the adhesion work between the limestone and CR decreases more than that between the basalt and CR on the wet surface. It can be seen from Figure 15 that the between CR and basalt is greater than that between CR and limestone, indicating that the adhesion between limestone and CR decays faster under wet conditions. Although limestone has better adhesion with CR under dry conditions, limestone does not have good water stability.
3.3. Molecular Dynamics Simulation and Analysis
3.3.1. Optimization and Calculation of Molecular Dynamics Model
After the construction of the molecular dynamics model, it is necessary to optimize the model to ensure its accuracy, rationality and stability. (a) In order to eliminate the unreasonable configurations generated in the process of molecular model construction, the molecular model needed to be geometrically optimized first. The molecular model was iterated 100,000 times under the Compass II force field. At this time, the molecular group energy decreased and tended to be stable with the increase in the number of iterations. (b) In order to eliminate the unreasonable energy in the process of molecular model construction, an annealing treatment was carried out on the geometrically optimized molecular model. The NVE ensemble was selected at 300~500 K, and the number of steps was set to 50,000 for annealing. (c) In order to make the molecular model achieve energy and volume stability, the molecular model after annealing was optimized dynamically. The NVT ensemble was set at 1500 K, one configuration was output every 1000 steps and the dynamics calculation time was 100 ps. (d) At this time, the molecular model reached the stability of configuration, energy and volume, and the dynamics calculation can be carried out. The NVT ensemble was selected to set the temperature at 298 K, and one configuration was output every 1000 steps. The dynamics calculation time was 200 ps, and the dynamics calculation results can be obtained.
3.3.2. Intermolecular Interaction Energy
In order to quantify the adhesion between the aggregate and the asphalt binder, the interaction energy of the asphalt aggregate system was calculated. The interface interaction energy represented the energy absorbed or released by the formation of a new interface when the interface was separated. The interaction energy between terms A and B in system (A − B) was calculated by Formula (5) [42]:
where Einteraction is the interaction energy between system A and system B; EA is the potential energy of term A; EB is the potential energy of term B; and E(A − B) is the total potential energy of system (A − B).
Einteraction = E(A − B) − (EA + EB)
Considering the influence of the interface’s molecular weight on the adhesion energy of the crystal model, the influence of the molecular weight difference of the crystal interface model can be eliminated by converting the interface interaction energy into interface interaction energy density. The interface interaction energy density is the energy required or released per unit area during interface peeling. Because of the linear correlation between the interaction energy density and the interaction energy, the interaction energy density can also be used to evaluate the bonding degree of the interface. The interaction energy density was calculated by Equation (6):
where Eρ is the interaction energy density; Einteraction is the interaction energy between system A and system B; and A is the area of the model interface.
3.3.3. Analysis of Molecular Dynamics Results
It can be seen from Figure 16 that there are great differences in the interaction energy between different aggregates and CR. It is obvious that limestone has a better interaction relationship with CR, while basalt is worse. At the same time, it can be seen that the addition of water reduces the interaction energy between aggregates and CR. In order to eliminate the influence of contact area on the interaction energy between the aggregate and the asphalt in the molecular model, the interaction energy per unit area between the aggregate and CR in dry and wet conditions was further compared, as shown in Figure 17. It can be seen from Figure 17 that the addition of water has a significant impact on the interaction between aggregate and CR. By comparing the two aggregates, it can be found that the interaction energy density between basalt and CR decreases by only 38.2% after the addition of water, while the interaction energy density between limestone and CR decreases by 64.5% after the addition of water. It can be seen that the interaction relationship of basalt, as an aggregate mineral, decays more slowly after it is combined with CR. From the perspective of interaction energy, the interaction performance between basalt and CR is not as good as that of limestone, but the interaction energy density decreases less after immersion, indicating that basalt has better adhesion to asphalt under the action of water, and it is an aggregate mineral with better resistance to water damage of asphalt mixture. The reason why the performance of limestone is inferior to that of basalt in the presence of water is that the main component of limestone is calcium carbonate, and a small part of it will be hydrolyzed and ionized after encountering water, which destroys its original crystal structure and destroys the interaction relationship between limestone and CR, so it shows instability after encountering water. In addition, the combination of asphalt and aggregate is mainly in the form of hydrogen bond. When water molecules appear at the interface between asphalt and aggregate, the aggregate will be bonded with some water molecules in the form of hydrogen bonds, thus reducing the binding ability between the asphalt and the aggregate. The interaction between the asphalt and the aggregate is weakened. Limestone, as a more polar molecule than basalt, is more likely to bond with water molecules, so its interaction with asphalt decreases more dramatically in the presence of water.
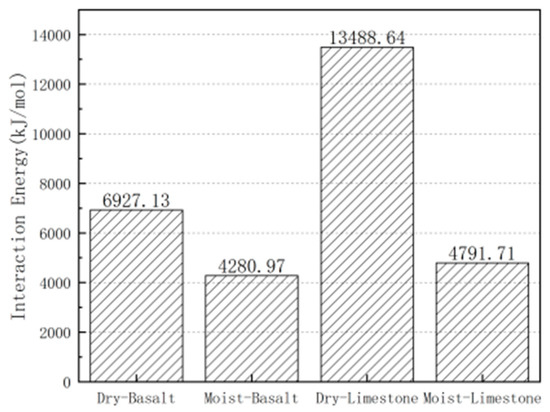
Figure 16.
Influence of water on the asphalt–aggregate interaction energy.
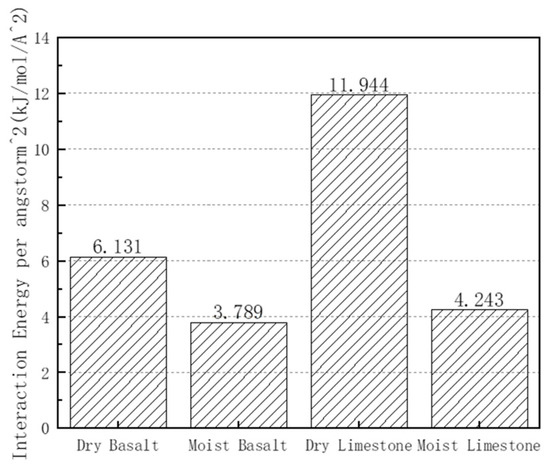
Figure 17.
Influence of water on interaction energy density.
3.4. Multiscale Association Analysis
For the unified research object, observation and analysis at multiple scales can provide basis and method at micro and molecular scales to solve the macroscopic performance problem. The relationship between multiple scales is shown in Figure 18. The influence indices of water at multiple scales on the interface of crumb rubber–asphalt mixture are shown in Table 12.
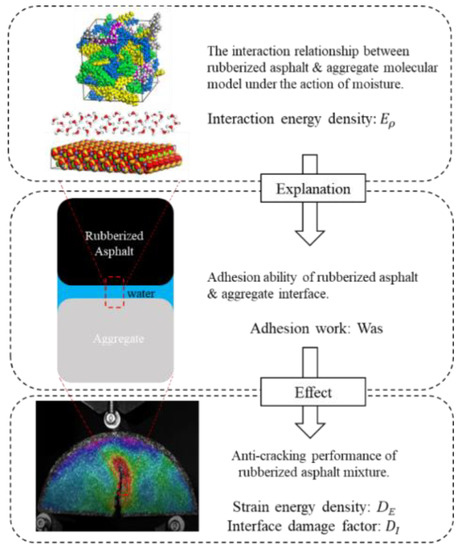
Figure 18.
Multiscale association analysis.

Table 12.
Multiscale indices of the influence of water.
Through molecular dynamics simulation calculation, it can be known that the interaction energy and interaction energy density of the asphalt and aggregate at the molecular scale decrease with water participation; the interaction energy density of basalt and CR decreases by 38.2%, and the interaction energy density of limestone and CR decreases by 64.5%. Due to the decrease in the interaction energy between CR and the aggregate, the adhesion ability between the asphalt and the aggregate at the microscale decreases obviously under the wet condition, the of basalt and CR decreases by 6.51%, and the of limestone and CR decreases by 12.98%. Since the adhesion ability between the crumb rubber asphalt and aggregate is an influencing factor on the crack resistance of the crumb rubber–asphalt mixture, the decrease in adhesion ability between the asphalt and aggregate at the microscale leads to the decrease in the crack resistance of the macro crumb rubber–asphalt mixture. The DE of medium-temperature fatigue failure decreases by 4.11%, and the DE of low-temperature fracture failure decreases by 15.52%. It can be seen from the above that the influence of water on the interface between the crumb rubber–asphalt and the aggregate is basically the same at the molecular scale, microscale and macroscale. The macrocracking of the asphalt mixture can further be analyzed for its internal mechanism and changes caused at the micro and molecular scale, so as to provide a certain theoretical basis for further improving the performance of asphalt mixtures. However, due to the influence of the size effect, the correlations of the three scales need to be further studied.
4. Conclusions
The influence of water on the interface of the crumb rubber–asphalt mixture was studied using the multiscale method. At the macroscale, the performance of the crumb rubber–asphalt mixture before and after water immersion under the two failure modes of medium-temperature fatigue failure and low-temperature fracture failure were analyzed. At the microscale, the adhesion work and water stability index between crumb rubber asphalt and basalt and limestone under dry and wet conditions were analyzed. A molecular dynamics simulation was carried out on the molecular model of crumb rubber asphalt and a representative molecular model of basalt and limestone at the molecular scale. The interaction energy and interaction energy density between the asphalt model and the mineral model were calculated and analyzed. The research conclusions are as follows:
- (1)
- At macroscale, water damage is more serious under low-temperature fracture damage than that of medium-temperature fatigue failure;
- (2)
- At the microscale, the adhesion energy between the crumb rubber asphalt and aggregate decreases under wet conditions, indicating that the participation of water has a certain damage to the adhesion ability between the crumb rubber asphalt and the aggregate;
- (3)
- The adhesion ability between limestone and crumb rubber asphalt is more affected by water than by basalt;
- (4)
- The results of the molecular-scale simulation are consistent with those of the micro-adhesion test and the macrofracture test, indicating that molecular simulation has certain significance in simulating the adhesion ability of water to the interface.
Author Contributions
L.W.: resources, writing—review and editing, supervision. Y.L.: writing—original draft, conceptualization, methodology, software, validation. L.Z.: formal analysis, writing—review and editing, visualization. All authors have read and agreed to the published version of the manuscript.
Funding
This research was supported by a grant (No. 2019GG031) from the Key Science-Technology Project of Inner Mongolia, China.
Data Availability Statement
The data presented in this research are available on request from the corresponding author. The data are not publicly available due to privacy.
Conflicts of Interest
The authors declare that they have no known competing financial interests or personal relationships that could have appeared to influence the work reported in this paper.
References
- Wang, L.; Shan, M.; Chang, C.; Zhou, X. The macro-and meso-cracking characteristics of warm mix crumb rubber asphalt mastics before and after aging. Constr. Build. Mater. 2020, 262, 120724. [Google Scholar] [CrossRef]
- Guo, Z.; Wang, L.; Feng, L.; Guo, Y. Research on fatigue performance of composite crumb rubber modified asphalt mixture under freeze thaw cycles. Constr. Build. Mater. 2022, 323, 126603. [Google Scholar] [CrossRef]
- Ding, X.; Chen, L.; Ma, T.; Ma, H.; Gu, L.; Chen, T.; Ma, Y. Laboratory investigation of the recycled asphalt concrete with stable crumb rubber asphalt binder. Constr. Build. Mater. 2019, 203, 552–557. [Google Scholar] [CrossRef]
- Ma, T.; Wang, H.; He, L.; Zhao, Y.; Huang, X.; Chen, J. Property characterization of asphalt binders and mixtures modified by different crumb rubbers. J. Mater. Civ. Eng. 2017, 29, 04017036. [Google Scholar] [CrossRef]
- Liu, Q.; Liu, J.; Yu, B.; Zhang, J.; Pei, J. Evaluation and optimization of asphalt binder and mixture modified with high activated crumb rubber content. Constr. Build. Materials. 2022, 314, 125676. [Google Scholar] [CrossRef]
- Asdollah-Tabar, M.; Heidari-Rarani, M.; Aliha, M.R.M. The effect of recycled PET bottles on the fracture toughness of polymer concrete. Compos. Commun. 2021, 25, 100684. [Google Scholar] [CrossRef]
- Liu, Z.; Li, S.; Wang, Y. Characteristics of asphalt modified by WEO/PPA: Conventional, high-temperature rheological, and mechanism properties. J. Clean. Prod. 2022, 330, 129844. [Google Scholar] [CrossRef]
- Ziari, H.; Divandari, H.; Akbar, S.M.S.A.; Hosseinian, S.M. Investigation of the effect of crumb rubber powder and warm additives on moisture resistance of SMA mixtures. Adv. Civ. Eng. 2021, 4, 6653594. [Google Scholar] [CrossRef]
- Zhang, H.; Gong, M.; Gao, D.; Yang, T.; Huang, Y. Comparative analysis of mechanical behavior of composite modified asphalt mixture based on PG technology. Constr. Build. Mater. 2020, 259, 119771. [Google Scholar] [CrossRef]
- Aigner, E.; Lackner, R.; Pichler, C. Multiscale prediction of viscoelastic properties of asphalt concrete. J. Mater. Civ. Eng. 2009, 21, 771–780. [Google Scholar] [CrossRef] [Green Version]
- Yao, H.; Dai, Q.; You, Z. Chemo-physical analysis and molecular dynamics (MD) simulation of moisture susceptibility of nano hydrated lime modified asphalt mixtures. Constr. Build. Mater. 2015, 101, 536–547. [Google Scholar] [CrossRef] [Green Version]
- Chen, Z.; Xie, J.; Xiao, Y.; Chen, J.; Wu, S. Characteristics of bonding behavior between basic oxygen furnace slag and asphalt binder. Constr. Build. Mater. 2014, 64, 60–66. [Google Scholar] [CrossRef]
- Wang, L.; Shen, A.; Yao, J. Effect of different coarse aggregate surface morphologies on cement emulsified asphalt adhesion. Constr. Build. Mater. 2020, 262, 120030. [Google Scholar] [CrossRef]
- Wei, J.; Dong, F.; Li, Y.; Zhang, Y. Relationship analysis between surface free energy and chemical composition of asphalt binder. Constr. Build. Mater. 2014, 71, 116–123. [Google Scholar] [CrossRef]
- Azarhoosh, A.R.; Nejad, F.M.; Khodaii, A. Using the surface free energy method to evaluate the effects of nanomaterial on the fatigue life of hot mix asphalt. J. Mater. Civ. Eng. 2016, 28, 04016098. [Google Scholar] [CrossRef]
- Guo, M.; Liang, M.; Jiao, Y.; Tan, Y.; Yu, J.; Luo, D. Effect of aging and rejuvenation on adhesion properties of modified asphalt binder based on AFM. J. Microsc. 2021, 284, 244–255. [Google Scholar] [CrossRef]
- Zhang, W.G.; Luan, Y.C.; Ma, T.; Wang, S. Multilevel analysis of the aging mechanisms and performance evolution of rubber-modified asphalt. J. Mater. Civ. Eng. 2021, 33, 04021365. [Google Scholar] [CrossRef]
- Cong, P.H.; van Thom, D.; Duc, D.H. Phase field model for fracture based on modified couple stress. Eng. Fract. Mech. 2022, 269, 108534. [Google Scholar] [CrossRef]
- Heidari-Rarani, M.; Bashandeh-Khodaei-Naeini, K. Micromechanics based damage model for predicting compression behavior of polymer concretes. Mech. Mater. 2018, 117, 126–136. [Google Scholar] [CrossRef]
- Doan, D.H.; Van Do, T.; Nguyen, N.X.; Van Vinh, P.; Trung, N.T. Multi-phase-field modelling of the elastic and buckling behaviour of laminates with ply cracks. Appl. Math. Model. 2021, 94, 68–86. [Google Scholar] [CrossRef]
- Wang, H.; Lin, E.; Xu, G. Molecular dynamics simulation of asphalt-aggregate interface adhesion strength with moisture effect. Int. J. Pavement Eng. 2015, 18, 414–423. [Google Scholar] [CrossRef]
- Wang, L.; Zhang, L.; Liu, Y. Study on compatibility of rubber powder and asphalt in rubber powder modified asphalt by molecular dynamics. J. Build. Mater. 2018, 21, 689–694. (In Chinese) [Google Scholar]
- Wang, L.; Zhang, L.; Liu, Y. Molecular dynamics study on compatibility of asphalt and rubber powders before and after aging. J. Build. Mater. 2019, 22, 474–479. (In Chinese) [Google Scholar]
- Wang, L.; Liu, Y.; Zhang, L. Micro/nanoscale study on the effect of aging on the performance of crumb rubber modified asphalt. Math. Probl. Eng. 2020, 2020, 1924349. [Google Scholar] [CrossRef]
- Rinaldini, E.; Schuetz, P.; Partl, M.N.; Tebaldi, G.; Poulikakos, L.D. Investigating the blending of reclaimed asphalt with virgin materials using rheology, electron microscopy and computer tomography. Compos. Part B 2014, 67, 579–587. [Google Scholar] [CrossRef]
- Nazzal, M.D.; Mogawer, W.; Austerman, A.; Abu Qtaish, L.; Kaya, S. Multi-scale evaluation of the effect of rejuvenators on the performance of high RAP content mixtures. Constr. Build. Mater. 2015, 101, 50–56. [Google Scholar] [CrossRef]
- Nazzal, M.D.; Holcombe, E.; Kim, S.S.; Abbas, A.; Kaya, S. Multi-scale evaluation of the effect of ras on the fracture properties of asphalt mixtures. Constr. Build. Mater. 2018, 175, 126–133. [Google Scholar] [CrossRef]
- Samieadel, A.; Oldham, D.; Fini, E.H. Multi-scale characterization of the effect of wax on intermolecular interactions in asphalt binder. Constr. Build. Mater. 2017, 157, 1163–1172. [Google Scholar] [CrossRef]
- Yang, S.Q.; Sun, S.; Qin, L.S.; Li, Q. Microstructure and meso-mechanical properties of asphalt mixture modified by rubber powder under a multi-scale effect. Coatings 2021, 11, 1321. [Google Scholar] [CrossRef]
- Zhang, L.; Long, N.; Liu, Y.; Wang, L. Cross-scale study on the influence of moisture-temperature coupling conditions on adhesive properties of rubberized asphalt and steel slag. Constr. Build. Mater. 2022, 332, 127401. [Google Scholar] [CrossRef]
- Wang, L.; Zhang, L.; Liu, Y. Molecular dynamics study on the effect of mineral composition on the interface interaction between rubberized asphalt and aggregate. J. Mater. Civ. Eng. 2022, 34, 04022032. [Google Scholar] [CrossRef]
- JTG E20-2011; Standard Test Methods of Bitumen and Bituminous Mixture for Highway Engineering. People Transportation Press: Beijing, China, 2011.
- JTG E42-2005; Highway Engineering Aggregate Test Regulations. People Transportation Press: Beijing, China, 2005.
- JTG F40-2004; Technical Specification for Construction of Asphalt Pavement in Highway Engineering. People Transportation Press: Beijing, China, 2004.
- Aliha, M.R.M.; Heidari-Rarani, M.; Shokrieh, M.M.; Ayatollahi, M.R. Experimental determination of tensile strength and KIc of polymer concretes using semi-circular bend (SCB) specimens. Struct. Eng. Mech. 2012, 43, 823–833. [Google Scholar] [CrossRef]
- Li, D.D.; Greenfield, M.L. Chemical compositions of improved model asphalt systems for molecular simulations. Fuel 2014, 115, 347–356. [Google Scholar] [CrossRef]
- Wang, L.; Shan, M.; Li, C. The cracking characteristics of the polymer-modified asphalt mixture before and after aging based on the digital image correlation technology. Constr. Build. Mater. 2020, 260, 119802. [Google Scholar] [CrossRef]
- Wang, L.; Cui, S.; Feng, L. Research on the influence of ultraviolet aging on the interfacial cracking characteristics of warm mix crumb rubber modified asphalt mortar. Constr. Build. Mater. 2021, 281, 122556. [Google Scholar] [CrossRef]
- Fowkes, F.M. Dispersion force contributions to surface and interfacial tensions, contact angles, and heats of immersion. Adv. Chem. Ser. 1964, 43, 99–111. [Google Scholar]
- Owens, D.K.; Wendt, R.C. Estimation of the surface free energy of polymers. Apply Polym. Sci. 1969, 13, 1741–1747. [Google Scholar] [CrossRef]
- Bhasin, A.; Masad, E.; Little, D.; Lytton, R. Limits on adhesive bond energy for improved resistance of hot-mix asphalt to moisture damage. Transp. Res. Rec. 2006, 1970, 2–13. [Google Scholar] [CrossRef]
- Golzar, K. Molecular simulation study of penetrant gas trans-port properties into the pure and nanosized silica particles filled poly-sulfone membranes. J. Membr. Sci. 2014, 451, 117–134. [Google Scholar] [CrossRef]
Publisher’s Note: MDPI stays neutral with regard to jurisdictional claims in published maps and institutional affiliations. |
© 2022 by the authors. Licensee MDPI, Basel, Switzerland. This article is an open access article distributed under the terms and conditions of the Creative Commons Attribution (CC BY) license (https://creativecommons.org/licenses/by/4.0/).


