Article

Influence of Fastener Failure on Dynamic Performance of Subway Vehicle

1
Nanchang Rail Transit Group Co., Ltd., Nanchang 330199, China
2
State Key Laboratory of Performance Monitoring and Protecting of Rail Transit Infrastructure, East China Jiaotong University, Nanchang 330013, China
3
School of Civil Engineering, Fujian University of Technology, Fuzhou 350118, China
*
Author to whom correspondence should be addressed.
Appl. Sci. 2022, 12(13), 6769; https://doi.org/10.3390/app12136769
Submission received: 30 May 2022 / Revised: 25 June 2022 / Accepted: 28 June 2022 / Published: 4 July 2022
(This article belongs to the Special Issue Design of Track System and Railway Vehicle Dynamics Analysis)

Abstract

:
The track fasteners may be damaged by fatigue and impact load during long-term subway operation, resulting in the failure of the connecting components between the rail and the track plate, and the spacing of rail support becomes larger, resulting in an increase in its dynamic deformation, affecting the subway vehicle’s running performance, and, in severe cases, endangering the vehicle’s running safety. A vehicle-subway track system model was created to study the running performance of subway vehicles when fasteners failed. A multi-rigid, body spring damping system is used to describe the vehicle system. The model for the track system is created using the finite element method (FEM), and the vehicle dynamic performances under various fastener failure scenarios are calculated, as well as the vehicle’s running comfort and safety in various scenarios. The findings show that fastener failure has little impact on the vehicle’s running comfort but it has a significant impact on the vehicle’s wheel unloading ratio.

1. Introduction

The advantages of a subway system include high speed, large carrying capacity, and no encroachment on urban space; all of which can help to relieve traffic congestion in the city. The fatigue performance of subway track structures is challenged by the frequent operation of subways. The track system may be damaged after a long period of operation, such as fastener failure, track slab interlayer damage, and so on, which will not only affect the subway structure’s operation life cycle, but also the vehicle’s running performance, and, in severe cases, the vehicle’s running safety [1,2,3,4].
Many studies have been conducted on the interaction of subway vehicles and structures. For example, Yan et al. [5] used the impact dynamics theory to develop a nonlinear dynamic analysis model of the lining rock mass when the vehicle passes through, and studied the shield tunnel damage evolution and crushing characteristics.
Zhu et al. [6] proposed a method for quickly calculating environmental vibration caused by subway vehicles passing by, in which the subway structure is built as a 2.5-dimensional model, allowing the model’s scale to be greatly reduced. Huang et al. [7] used a 2.5-dimensional finite element/infinite element simulation of soil vibration caused by subway vehicles to introduce railway irregularity and dynamic characteristics of moving vehicles. The results show that the presence of orbit irregularity greatly amplifies the soil velocity and acceleration response, and that the high frequency component caused by orbit irregularity can be effectively reduced by installing a floating plate.
Yang et al. [8] conducted a comparative study on the response of earth tunnel systems to moving vehicle loads using two-dimensional and 2.5D finite element/infinite element methods, taking into account the influence of vehicle speed, track roughness, and floating plate. Jin et al. [9] developed a numerical model of ground vibration caused by vehicles traveling through the tunnel and conducted field tests to verify the model, which included track, tunnel invert, and tunnel wall vibration. Additionally, the ground above the tunnel was synchronously tested. Rail roughness and rail characteristics were also tested, and the calculated results matched the vibration measured when the vehicle passed.
When a vehicle passes through the track structures, it will impact the track structure, and the dynamic response of track structure will, in turn, affect the running performance of the vehicle, and the two interact [10,11,12]; especially when track structure is damaged, the dynamic response of the track structure has a greater impact on the running performance, and even endangers the running safety.
Some academics have undertaken research on vehicle performance while taking into account track or bridge damage. For example, Liu et al. [13] used a probability model to determine the running safety and comfort of a vehicle travelling on a bridge with earthquake-induced deformation. Lai et al. [14] developed a vehicle–track–bridge model and calculated the bridge’s transverse deformation threshold based on the vehicle’s running safety and comfort. Based on reliability technology and vehicle–track interaction, Zhu et al. [15] evaluated the interface damage as one of the most critical damage problems of railway slab track. Furthermore, Zhu et al. [8] proposed a three-dimensional finite element model to investigate the interface damage between prefabricated plate and CA (cement asphalt) mortar layer in the China Railway Track System Slab track system (CRTS-II).
Based on the vehicle–track system, Xu et al. [16] investigated the interfacial and fatigue damage evolution of slab tracks. Wang et al. [17] used a coupled model to evaluate the fatigue performance of a railway bridge. The dynamic analysis of vehicle–bridge coupling with the proposed method provides a feasible and accurate solution for fatigue damage prediction under four load conditions studied, with the same cumulative fatigue damage prediction for both vehicle models for low speed and light load. Zhao et al. [18] constructed a ballastless track prestressed simply supported concrete box girder with 1/4 proportion of specimens for the CRTS II (Type II of China Railway Track System), and a series of fatigue tests were performed on the structural system. Xu et al. [19] presented a type of matrix coupling model for vehicle–track interaction analysis considering intersections. To improve efficiency and ensure the accuracy of simulation, the solution of time step change was adopted in the model. The simulation results show that the track irregularity mainly affects wheel–rail interaction on regular track. In the intersection panel, changes in track geometry play a dominant role in the wheel–intersection interaction, rather than track irregularities. Li et al. [20] established a three-dimensional FEM model to study the joint damage rule of CRTS-II slab track under the action of temperature and vehicle load.
In the above research, there are few studies on the vehicle running performance under the condition of fastener failure. During the long-term operation of subway, the rail fastener may be damaged by fatigue and impact [21,22,23,24], and it will lead to the failure of the connecting member (i.e., fastener) between the rail and the track plate. Therefore, the support spacing of the rail will become larger, and it will result in an increase in dynamic rail displacement under vehicle load, which will compromise the vehicle’s running comfort and even safety. This research used that information to create a vehicle–track system model, to compute the dynamic performance of the vehicle when fasteners fail, and to examine the vehicle’s comfort and safety under various working situations.

2. Model of Vehicle-Structure System

2.1. System Model

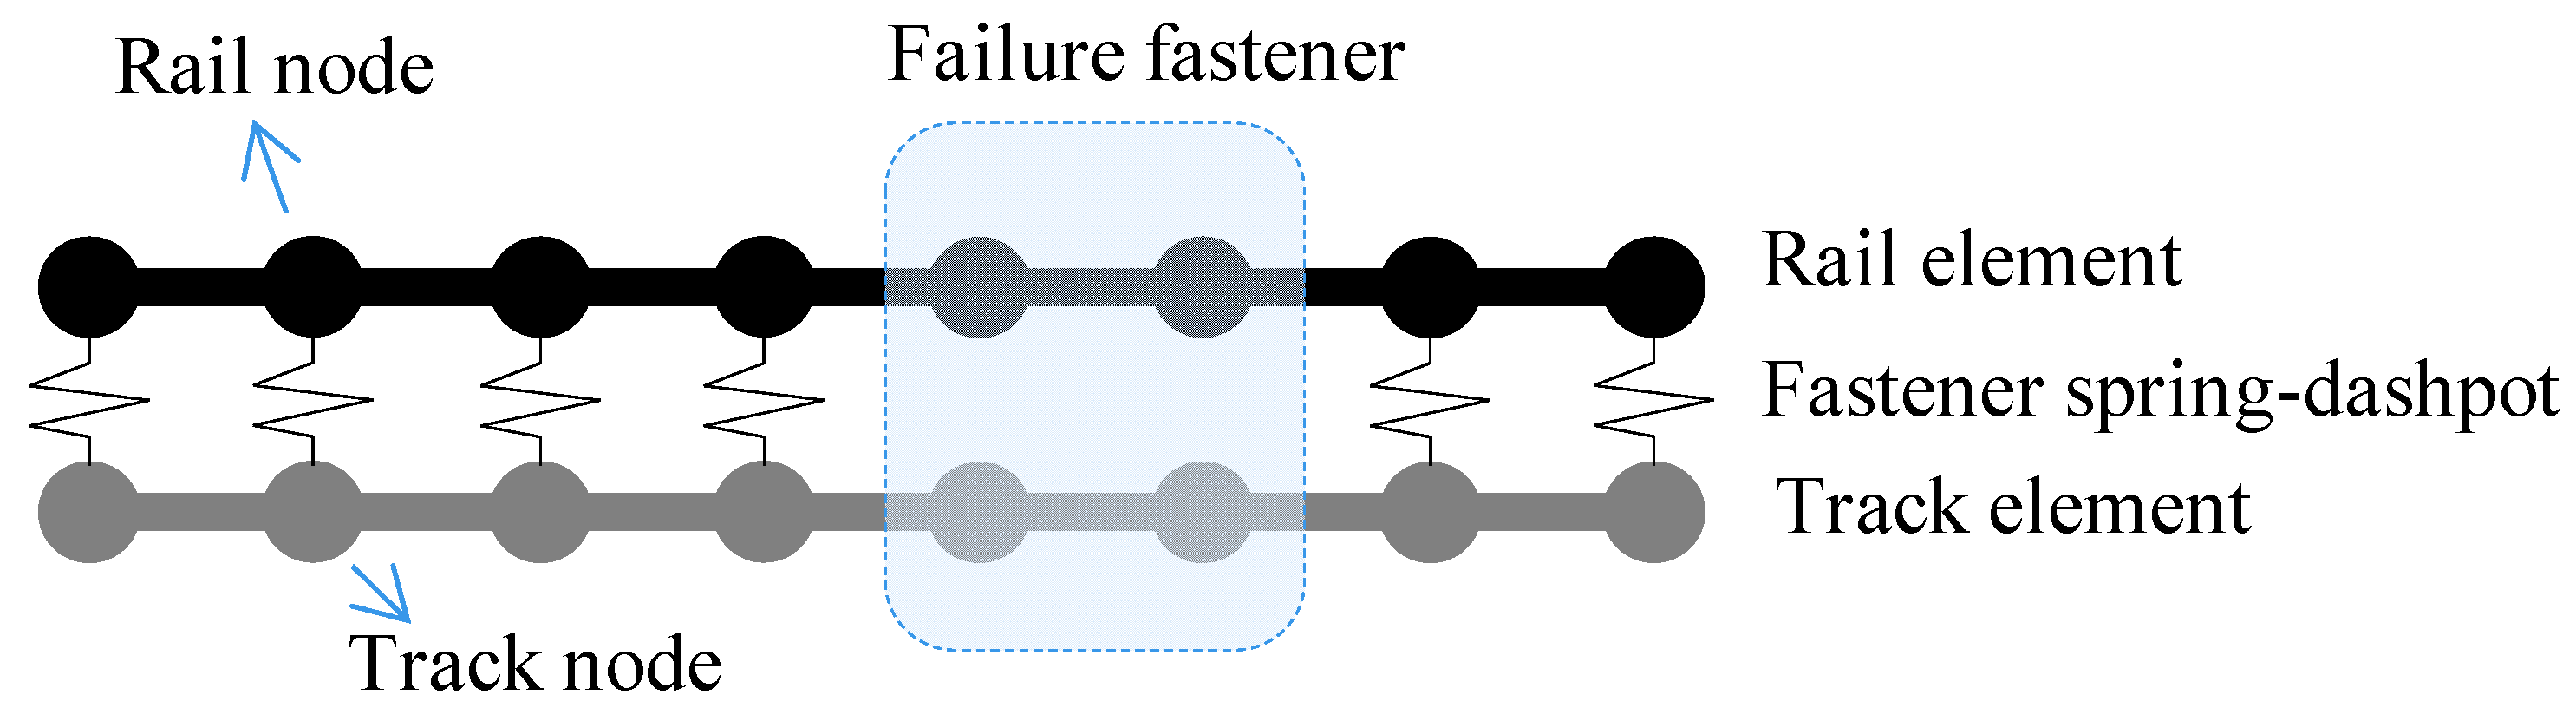
2.1.1. Model of Track

The subway vehicle will have an impact on the track system during subway line operation, and long-term operation may cause track structure fatigue damage. The dynamic deformation of the track system is similar to a type of dynamic track irregularity, which will affect the vehicle’s dynamic response. Excessive deformation can cause passenger discomfort and even jeopardize vehicle operation safety. They are usually considered together in a comprehensive analysis of the vehicle and track system, and a system model is established for analysis; that is, the coupling effect between the vehicle and track system is considered.
Soil layer–shield segment, structure–track, and plate–rail make up the majority of today’s subway track structures. The FEM can be used for modeling in the numerical simulation, with the track plate and rail simulated by plate and beam elements, respectively. A spring stiffness viscous damping element could be used to simulate the fastener between the track plate and rail. When considering fastener failure, both stiffness and damping are assumed to be zero, as shown in Figure 1. The dynamic equation of a subway structure can be calculated using the dynamic equation as following:
M t X ¨ t + C t X ˙ t + K t X t = F t
where M t , C t and K t denote mass, damping and stiffness matrix of subway track structure, respectively; X ¨ t ,   X ˙ t , and X t denote acceleration, velocity, and displacement vector, respectively. F t denotes force vector, and it mainly comes from the wheel–rail force of the vehicle. The mass matrix M t of the track system will not be changed if some fasteners are damaged. The stiffness matrix K t will be changed if a fastener spring fails. The damping matrix includes structural damping and material viscous damping, where structural damping is assumed to be the proportional damping of stiffness and mass, and Rayleigh damping is used here, and the material viscous damping includes fastener viscous, track interlayer member viscous, and other material viscous damping. As a result, if the fastener fails, the track’s damping C t will alter proportionately.

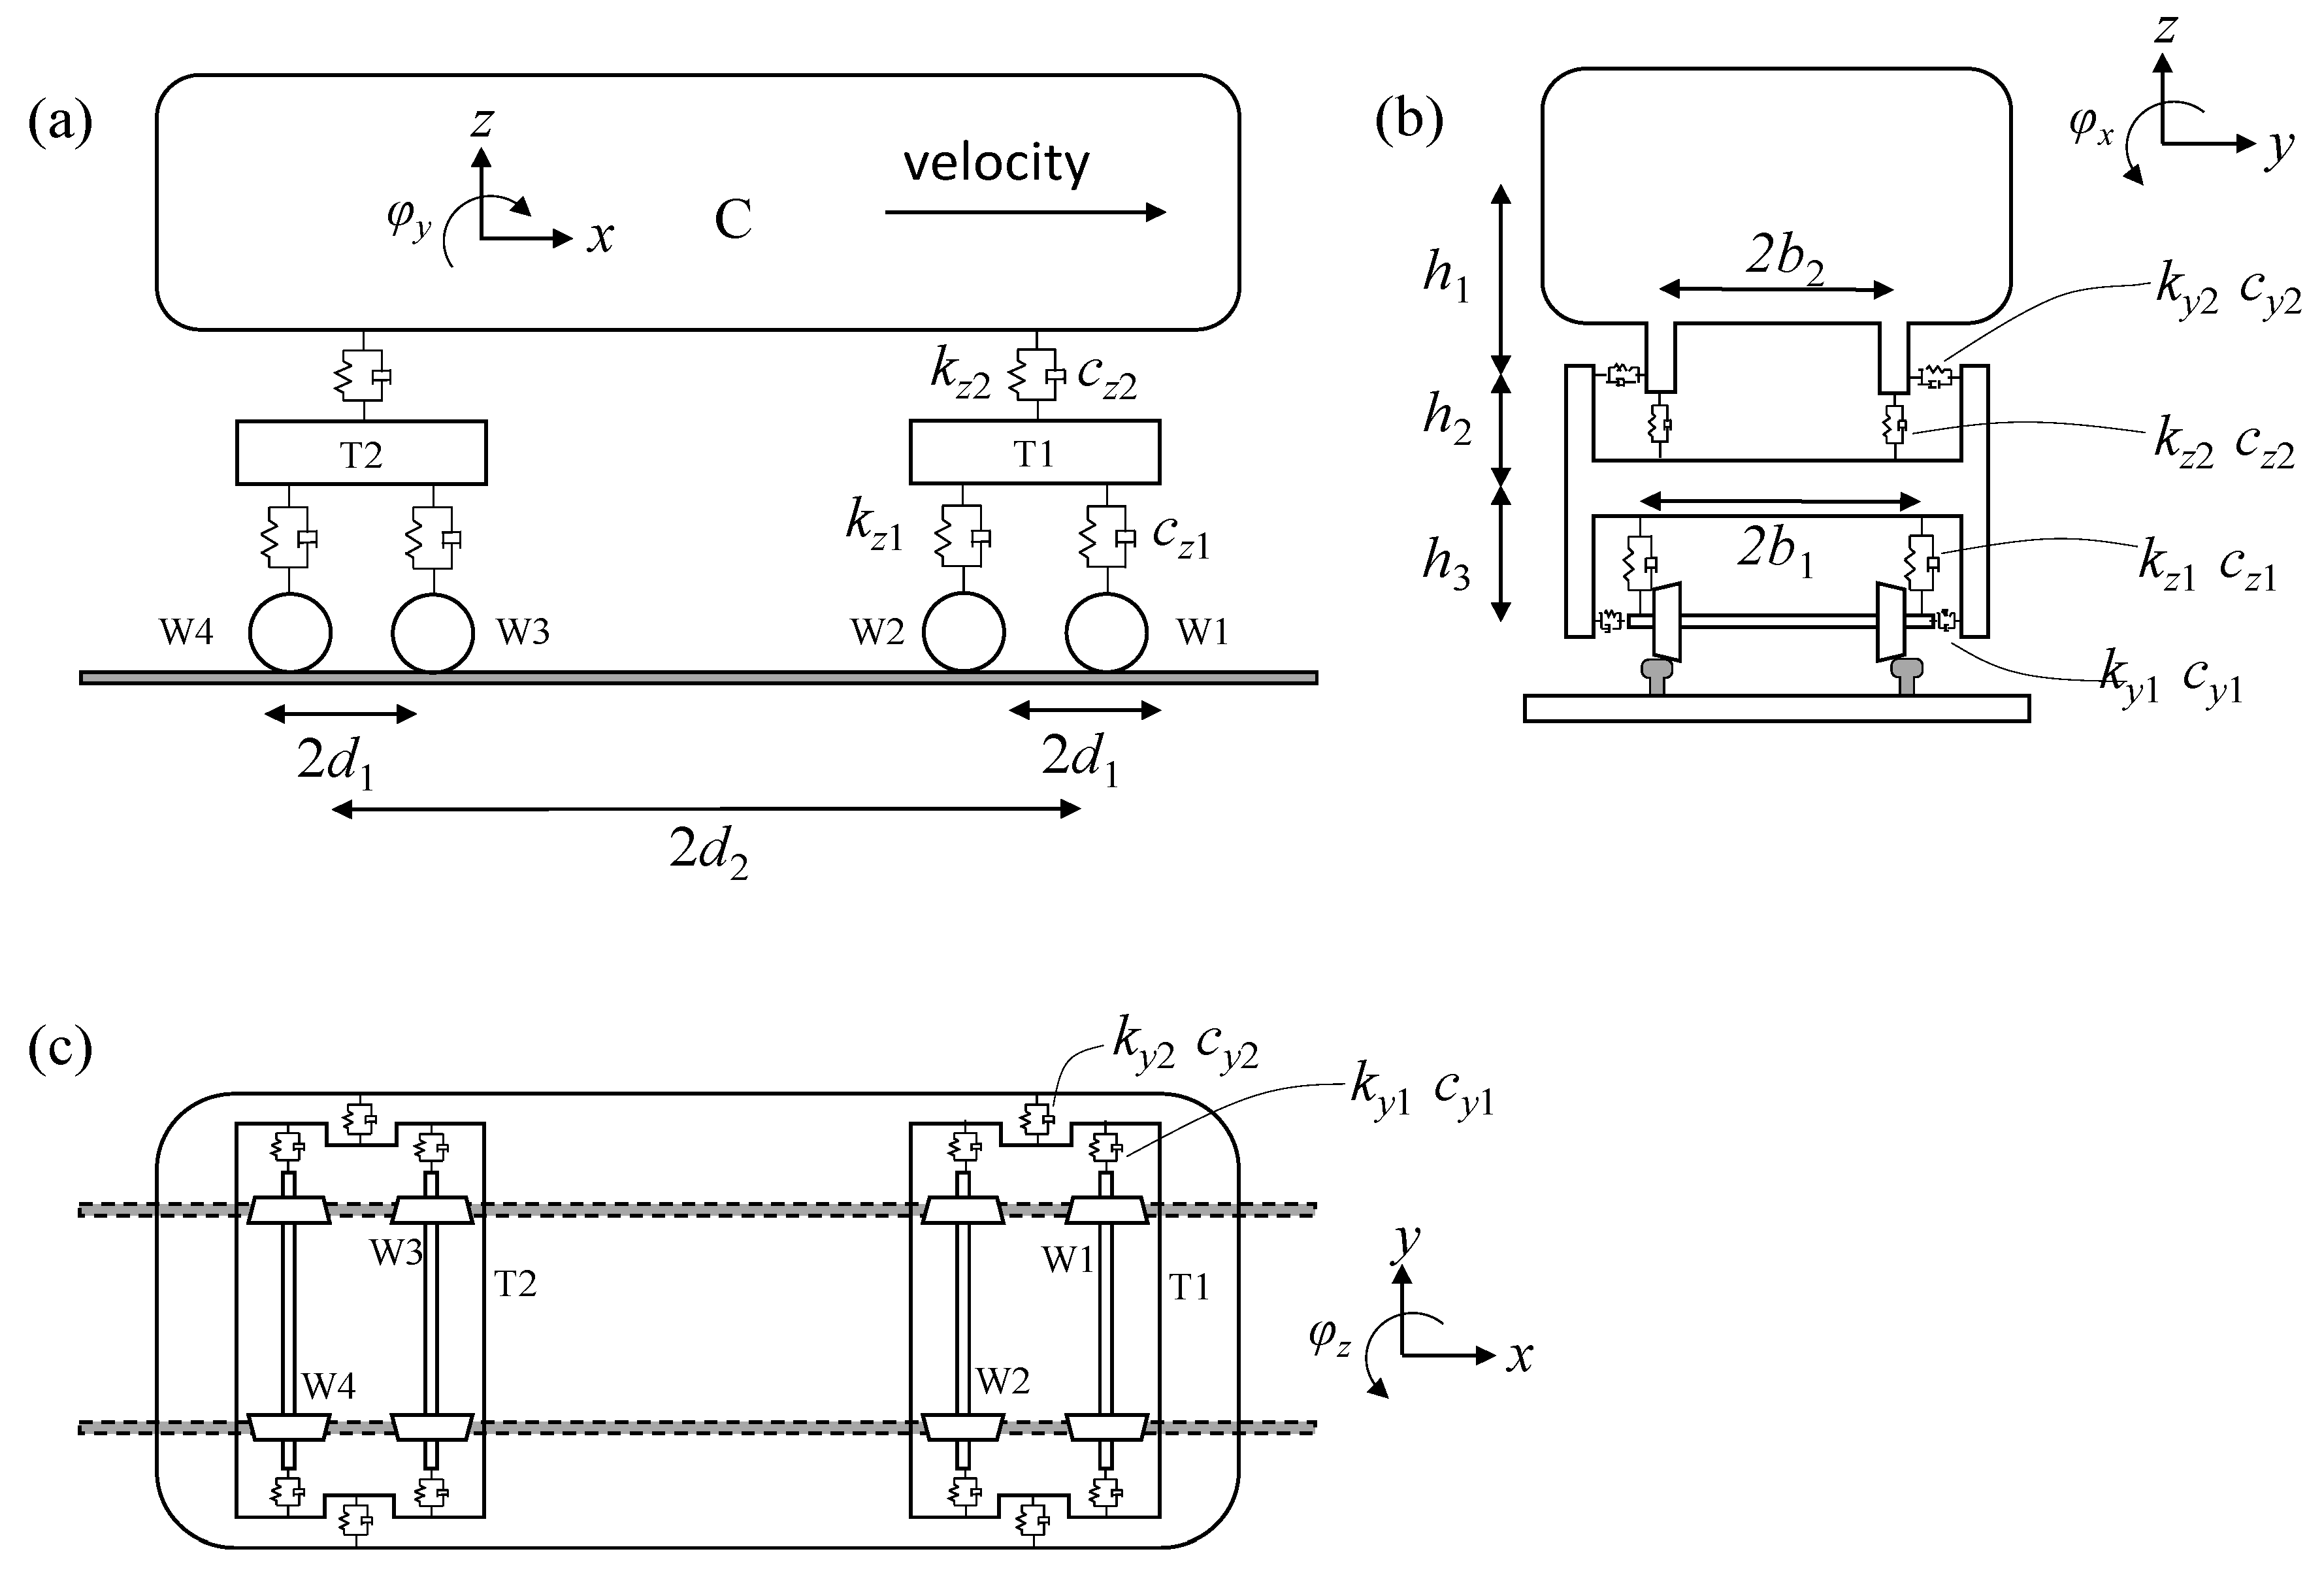
2.1.2. Model of Vehicle

The vehicle model is simulated using a multi-rigid, body-spring-damping system, with each vehicle consisting of one vehicle car body, two bogies, and four wheel sets; all of which are rigid bodies. Spring stiffness viscous damping is used to simulate the suspension systems between the vehicle car body and the bogie (secondary suspension), and the suspension system between the bogie and the wheel set (primary suspension), as shown in Figure 2. The dynamic equation of the vehicle can be written as the following equation using the principle of elastic potential energy invariance [25]:
M v X ¨ v + C v X ˙ v + K v X v = F v
where M v , C v , and K v denote the mass matrix, damping matrix and stiffness matrix of vehicle, respectively.
The mass matrix of vehicle can be written as:
M v = diag [ M v 1   M v 2 M v n ]
where n denotes the number of vehicle carriage; M v i denotes ith mass matrix of vehicle, and it can be represented as:
M v i = diag [ M c   M b 1   M b 2   M w 1   M w 2   M w 3   M w 4 ]
With
M c = diag [ m c   m c   J c x   J c y   J c z ]
M b i = diag [ m b   m b   J b x   J b y   J b z ]
M w i = diag [ m w   m w   J w x   J w y   J w z ]
where mc, mt and mw denote mass of car body, bogie, and wheel set, respectively; J denotes moment of inertia, and the first subscript c, b and w denote car body, bogie, and wheel set, respectively; the second subscript x, y, and z denotes X-axis, Y-axis, and Z-axis, respectively.
The stiffness matrix of vehicle can be written as:
K v = diag [ K v 1   K v 2 K v n ]
where K v i denotes stiffness matrix of ith carriage, and it can be represented as:
K v i = [ K c symm . K c b 1 K b 1 t 1 K c b 2 0 K b 2 b 2 0 K b 1 w 1 0 K w 1 w 1 0 K b 1 w 2 0 0 K w 2 w 2 0 0 K b 2 w 3 0 0 K w 3 w 3 0 0 K b 2 w 4 0 0 0 K w 4 w 4 ]
With
K c = [ 4 k y 2 s y m m . 0 4 k z 2 4 h 1 k y 2 0 4 h 1 2 k y 2 + 4 b 2 2 k z 2 0 0 0 4 d 2 2 k z 2 + 4 h 1 2 k x 2 0 0 0 0 4 d 2 2 k y 2 + 4 b 2 2 k x 2 ]
K c b 1 = [ 2 k y 2 0 2 h 1 k y 2 0 2 d 2 k y 2 0 2 k z 2 0 2 d 2 k z 2 0 2 h 2 k y 2 0 d 0 2 h 2 d 2 k y 2 0 0 0 2 h 1 h 2 k x 2 0 0 0 0 0 2 b 2 2 k x 2 ]
K c b 2 = [ 2 k y 2 0 2 h 1 k y 2 0 2 d 2 k y 2 0 2 k z 2 0 2 d 2 k z 2 0 2 h 2 k y 2 0 d 0 2 h 2 d 2 k y 2 0 0 0 2 h 1 h 2 k x 2 0 0 0 0 0 2 b 2 2 k x 2 ]
K b 1 b 1 = K b 2 b 2 = [ 2 k y 2 + 4 k y 1 s y m m . 0 2 k z 2 + 4 k z 1 4 h 3 k y 1 4 k y 1 0 a 0 0 0 b 0 0 0 0 c ]
a = 2 b 2 2 k z 2 + 2 h 2 2 k y 2 + 4 b 1 2 k z 1 + 4 h 3 2 k y 1
b = 2 h 2 2 k x 2 + 4 d 1 2 k z 1 + 4 h 3 2 k x 1
c = 4 b 1 2 k x 1 + 4 d 1 2 k y 1 + 2 b 2 2 k x 2
K b 1 w 1 = K b 2 w 3 = [ 2 k y 1 0 2 h 3 k y 1 0 2 d 1 k y 1 0 2 k z 1 0 2 d 1 k z 1 0 0 0 2 b 1 2 k z 1 0 0 0 0 0 0 2 b 1 2 k x 1 ]
K w 1 w 1 = K w 2 w 2 = K w 3 w 3 = K w 4 w 4 = [ 2 k y 1 0 0 0 0 2 k z 1 0 0 0 0 2 b 1 2 k z 1 0 0 0 0 2 b 1 2 k x 1 ]
The meaning of each symbol can be found in Table 1. The damping matrix of the vehicle can be obtained by replacing letter “k” with letter “c”. F v is the force vector of vehicle. The wheel–rail relationship is dealt with by the knife-edge model, the Hertz model is used to calculate wheel–rail normal force, and the Kalker model is used to calculate wheel–rail creep force [26].

2.1.3. Model of Coupled System

The wheel–rail contact relationship is used to couple the dynamic equations of the vehicle and the track after they have been obtained. At present, two popular kinds of model deal with the wheel–rail contact. The first is the “close fitting method” [27,28,29]. This method connects the vehicle and track system into a large system, which can ignore the degree of freedom of the wheel set, and the vehicle and track are connected directly through the primary suspension spring, and the gap between the wheel and rail can also be considered. The stiffness matrix and mass matrix of system need to be updated at each sub step of the calculation. Its advantage is that it does not need to consider the Hertz spring, so as to realize the large step calculation, and its disadvantage is that the wheel–rail separation cannot be considered. The other model is the “wheel–rail contact state method” [30,31]. This coupling method considers the real wheel–rail contact: the vehicle and track are coupled together through wheel–rail force. There is no need to update the matrix in the calculation process. The advantage is that it can accurately reflect the wheel–rail contact state. The disadvantage is that it needs to search the wheel–rail contact points, resulting in low computational efficiency, and the Hertz spring needs to be considered, resulting in a small integration step. To accurately reflect the wheel–rail contact state, the “weak coupling” model will be applied. The normal force of the wheel–rail is calculated by Hertz spring, and the creep force of the wheel–rail is calculated by the Kalker model. More details of modeling can be found in Refs. [14,32].
The dynamic equation of the vehicle-subway structure coupled system model (VSSCSM) can be written as:
{ M v X ¨ v + C v X ˙ v + K v X v = F v M t X ¨ t + C t X ˙ t + K t X t = F t
Then, Equation (19) is solved by moving the position of the wheel set on the element and combined with the step-by-step integration method.

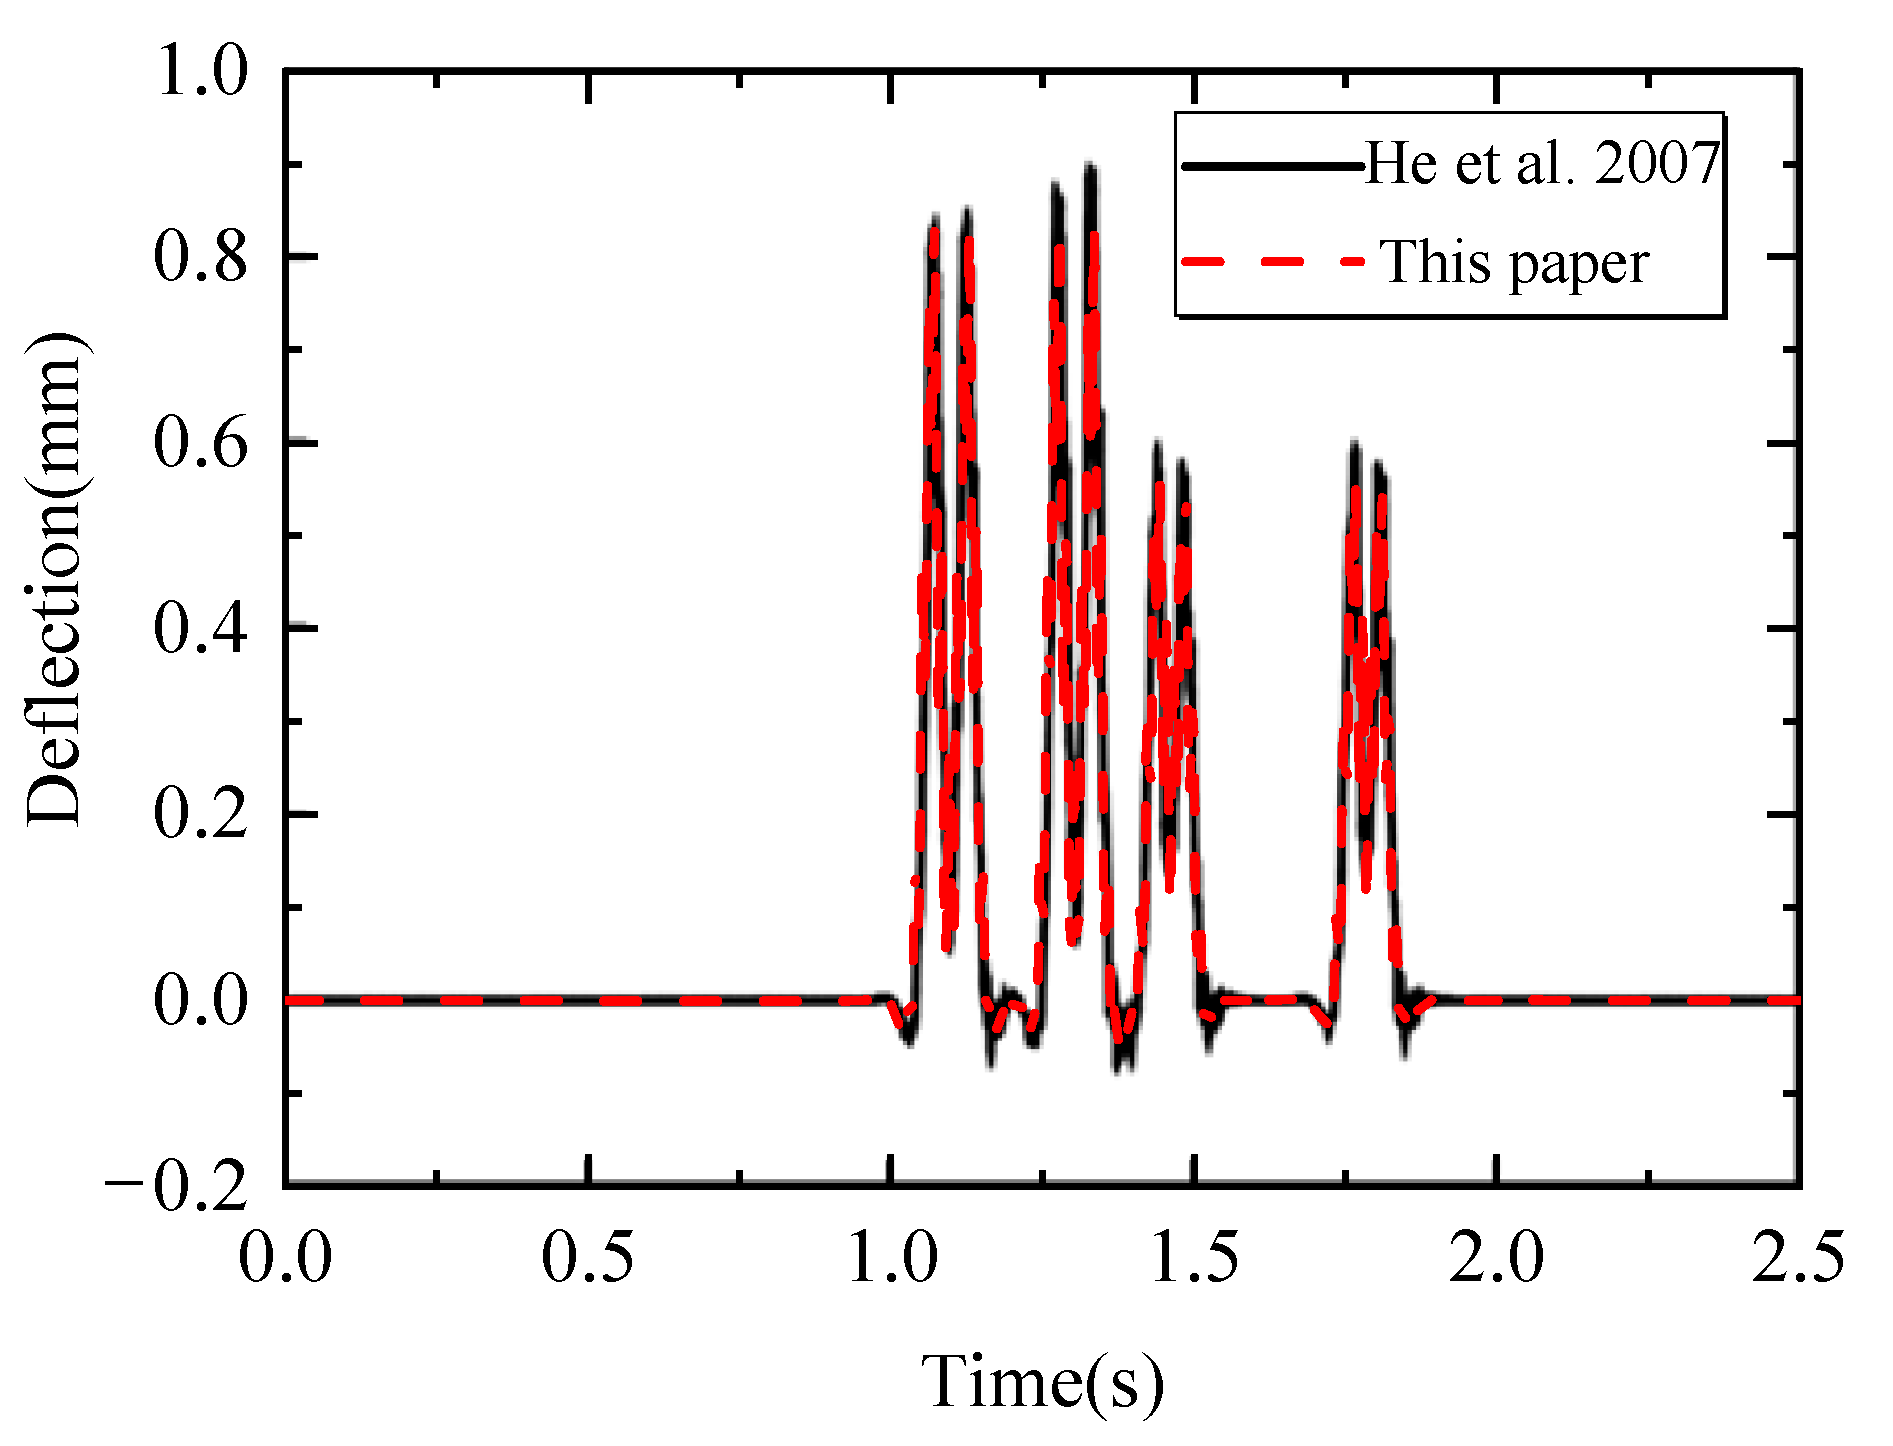
2.2. Model Validation

The reliability of the calculation results of the VSSCSM is the premise to ensure the accuracy of the analysis results. To verify the VSSCSM, the calculation results of the VSSCSM are compared with those in the work of He et al. [33].
The system vertical dynamic responses of the China Star high-speed train, which included one motor car and one trailer car, were calculated as it passed through the Borg slab ballastless track with a length of 120 m and a speed of 200 km/h. Figure 3 depicts the VSSCSM results, as well as the results from the literature. The calculation results are within the normal range; each response waveform follows the physical concept, and the amplitude and trend of the calculation result curve are very close to the literature results, implying that the system model’s calculation results are very reliable.

3. Numerical Analysis

The system model was established according to the vehicle and structural parameters of the actual subway. The vehicle was a six-carriage vehicle and the design speed is 140 km/h. The specific parameters are shown in Table 1.
The running comfort of the vehicle adopts the acceleration of the car body, and the limits of lateral acceleration and vertical acceleration are 1.0 m/s2 and 1.3 m/s2, respectively [30]. The running safety is evaluated by the wheel unloading ratio (also called offload ratio) and the Nadal index (also called derailment factor), and the limits of them are 0.6 and 0.8, respectively [30].

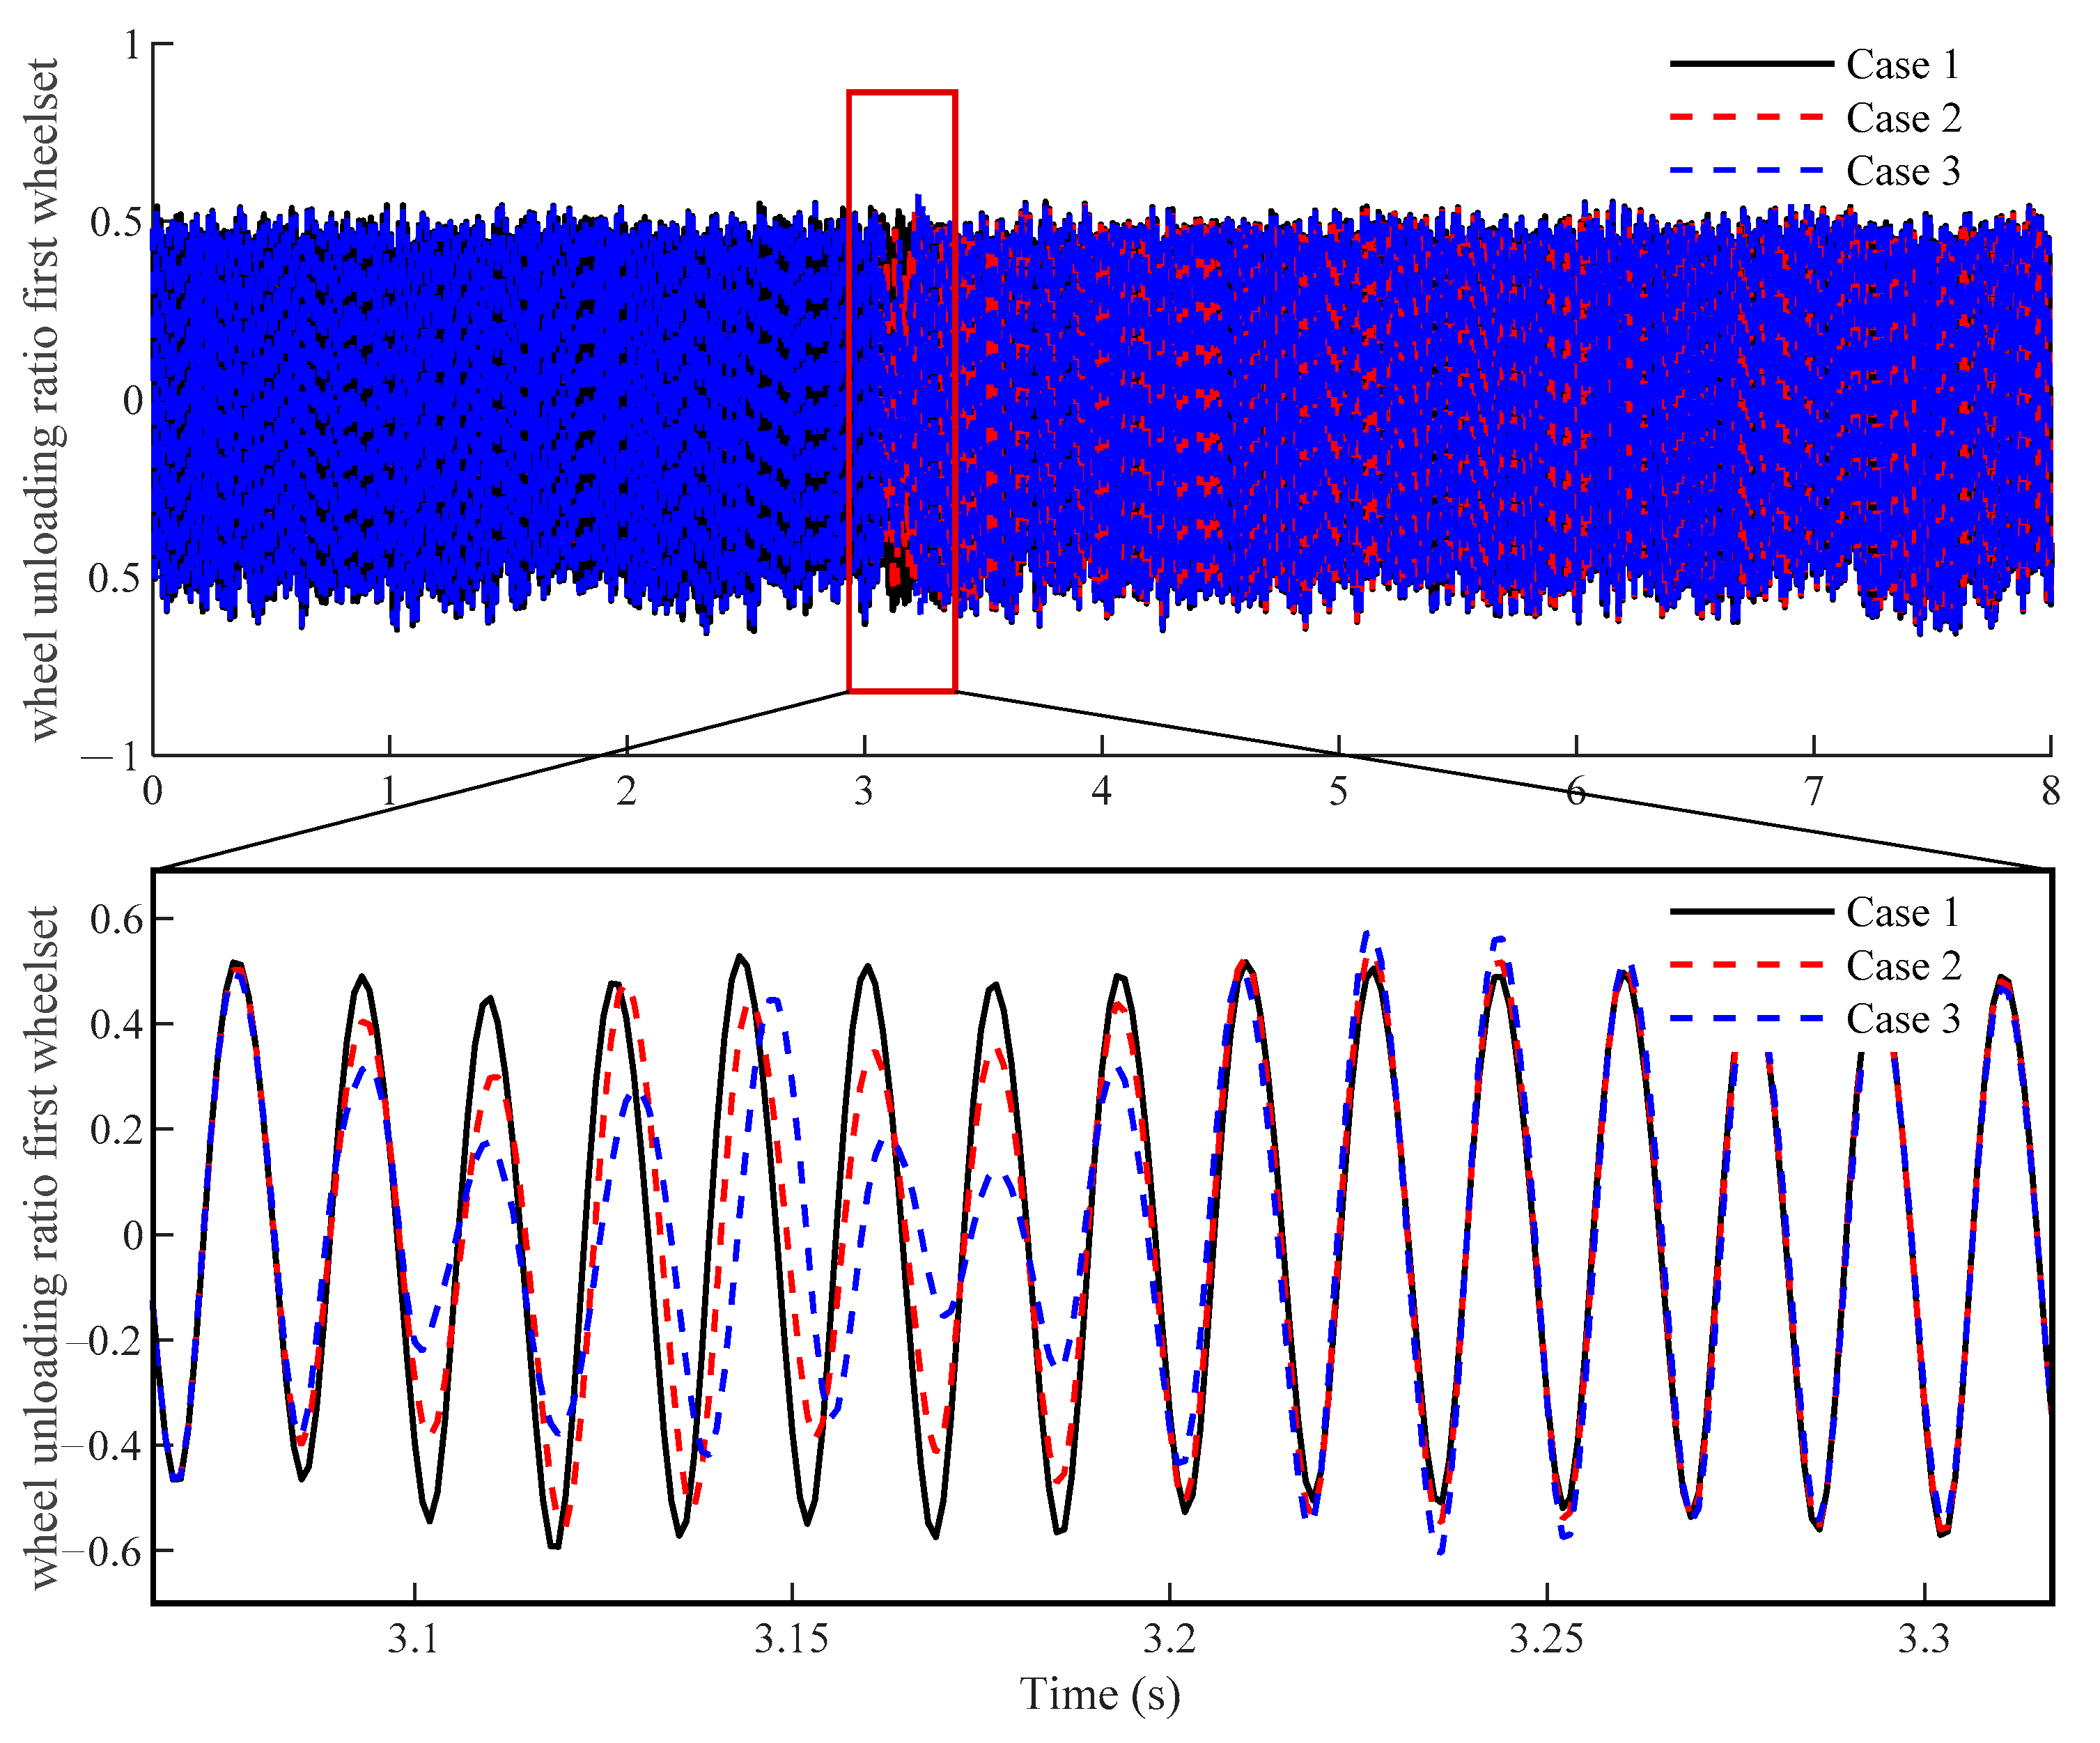
3.1. Time History Analysis

As shown in Table 2, multiple cases were set for possible fastener failure in the subway track structure, including perfect fastener, single failure on one side, and two continuous failures on one side. The key dynamic responses of the system at the design speed (140 km/h) are calculated.
When the subway vehicle passes through various failure conditions, Figure 4 shows the wheel unloading ratio of the first wheel set of the first carriage at the failure position of the fastener. The wheel unloading ratio of the vehicle changes suddenly when the vehicle passes near the failed rail, and the change is the largest when it reaches the center of failure region. Overall, the vehicle’s maximum wheel unloading ratio is around 0.5, which meets the requirements for safe operation. The wheel unloading ratio changes noticeably when the vehicle passes by a failed fastener, and the more failed fasteners there are, the more noticeable the change. The amplitude of the wheel unloading ratio decreases as the number of failed fasteners increases in all three cases. The wheel unloading ratio of the vehicle under the cases is the same before the vehicle passes the failed fastener. When the vehicle passes the failed fastener, the vehicle’s wheel unloading ratio gradually recovers to the same level as it passes the perfect fastener.
Figure 5 shows the time–history curve of the vehicle’s Nadal index. It can be seen that the time–history curve of the Nadal index under different fastener failure conditions is basically the same, which can preliminarily explain that a small amount of fastener failure has little influence on the vehicle’s Nadal index.
Figure 6 illustrates the lateral acceleration time–history curve of the barycenter position of the first car body at the failure position of the fastener when the subway vehicle passes through various failure conditions. In general, the car body acceleration ranges from −0.20 m/s2 to 0.20 m/s2. The body acceleration of the vehicle will change slightly as it passes through the failed fasteners. After the vehicle passes the failed fastener, the vehicle’s acceleration gradually recovers to the same.
Figure 7 depicts the vertical acceleration time–history curve of the barycenter position of the first car body at the failure position of the fastener when the subway vehicle passes through various failure conditions. In general, the car body acceleration ranges from −0.25 m/s2 to 0.25 m/s2. The body acceleration of the vehicle will change slightly as it passes through the failed fasteners. The body acceleration of the vehicle under the three cases is consistent before the vehicle passes the failed fastener. After the vehicle passes the failed fastener, the vehicle’s acceleration gradually recovers to the same level.

3.2. Parameter Analysis

In order to analyze the influence of fastener failure on vehicle dynamic performance more systematically, the dynamic response of the vehicle at different vehicle speeds (including 80 km/h, 100 km/h, 120 km/h, and 140 km/h) and different cases (including perfect fastener, one fastener failure, two fastener failures, three fastener failures, four fastener failures, and five fastener failures) are calculated, and the maximum responses are extracted.
Figure 8 depicts the maximum body vertical acceleration at various speeds and in various situations. It can be seen that the maximum acceleration of the vehicle body varies between 0.6 m/s2 and 0.8 m/s2. The failure of a fastener in various situations has little effect on the maximum acceleration of the vehicle body, whereas the vehicle speed has a minor effect on the acceleration of the vehicle body.
Figure 9 illustrates the maximum Nadal index for all wheelsets at various speeds and conditions. As can be seen, there is no obvious relationship between the number of fastener failures and the change in vehicle speed when it comes to the change in the Nadal index. The Nadal index of vehicles under various cases is generally within the acceptable range (less than 0.8). This is primarily due to the fact that when fastener failures occur, the rail vertical stiffness changes more, and the wheel–rail lateral force primarily comes from lateral component of normal and creep force. When the normal force changes, the vertical and horizontal component also change, and they increased almost in the same proportion. According to the calculation method of the coefficient of derailment, it is the ratio of horizontal and vertical force. Furthermore, the lateral component of normal force accounts for a significant portion of the lateral force on the wheel–rail. As a result, when a fastener fails, the vertical force on the wheel–rail changes, but the lateral force on the wheel–rail changes in nearly the same proportion, resulting in little change in the Nadal index.
Figure 10 demonstrates the maximum wheel unloading ratio of all wheel sets at various speeds and cases. It can be seen that the number of fastener failures has a great influence on the wheel unloading ratio, and the degree of influence increases with the rise in vehicle speed. When the vehicle is running at a low speed (the speed is 80 km/h), the wheel unloading ratio of the vehicle is only about 0.2 without fastener damage. With the increase in the number of fastener failure, the wheel unloading ratio gradually increases. The wheel unloading ratio is close to the allowable value of 0.6 in the case of four fasteners failure. The wheel unloading ratio is close to the running safety limit value of 0.8 when five fasteners are damaged.
When the vehicle is running at a high speed (design speed 140 km/h), the wheel unloading ratio of the vehicle reaches about 0.55 with perfect fastener. When the number of failure fastener is one or two, the wheel unloading ratio changes little. The wheel unloading ratio increases dramatically when three fasteners are damaged, exceeding the allowable running safety value of 0.6. The wheel unloading ratio exceeds the running safety limit value of 0.8 when four fasteners are damaged. When five fasteners are damaged, the wheel unloading ratio reaches 1.0, indicating that the vehicle wheel set has experienced wheel–rail separation, and even slight disturbances can cause the vehicle to derail. When one, two, or three fasteners fail, the vehicle is safe to drive at a lower speed than the design speed; when four fasteners fail, the vehicle’s allowable running speed is 130 km/h; and when five fasteners fail, the vehicle’s allowable running speed is 80 km/h.
Combined with the calculation results of vehicle operation safety and running stability, when the subway fastener is damaged, its impact on the acceleration of the vehicle is limited, and it is difficult to identify the inspection vehicle based on the acceleration index, but this does not mean that the vehicle operation is safe, because the failure of the fastener will endanger the vehicle operation safety performance, so it is necessary to use manual or other technical means for regular detection, so as to ensure the operation safety of the vehicle. According to the normal vehicle operation speed, it is suggested that when more than three continuous fasteners are likely to fail or have become loose, they must be maintained.

4. Conclusions

After a long period of operation, the subway track structure may be damaged. The vehicle–subway track system model was established with the goal of evaluating the influence caused by fastener failure. The model’s calculation results are verified for accuracy, and the dynamic responses of the track structure and vehicle running performance under different numbers of fastener failures are compared using time history responses. Finally, the vehicle’s running comfort and safety are investigated at various speeds while passing through various fastener failures, and the following conclusions can be obtained:
(1)
Through the comparison of time history response, it is found that the impact of fastener failure on the structural response is greater than that of vehicle response. Among them, the structural displacement response is more sensitive to structural failure than the acceleration response.
(2)
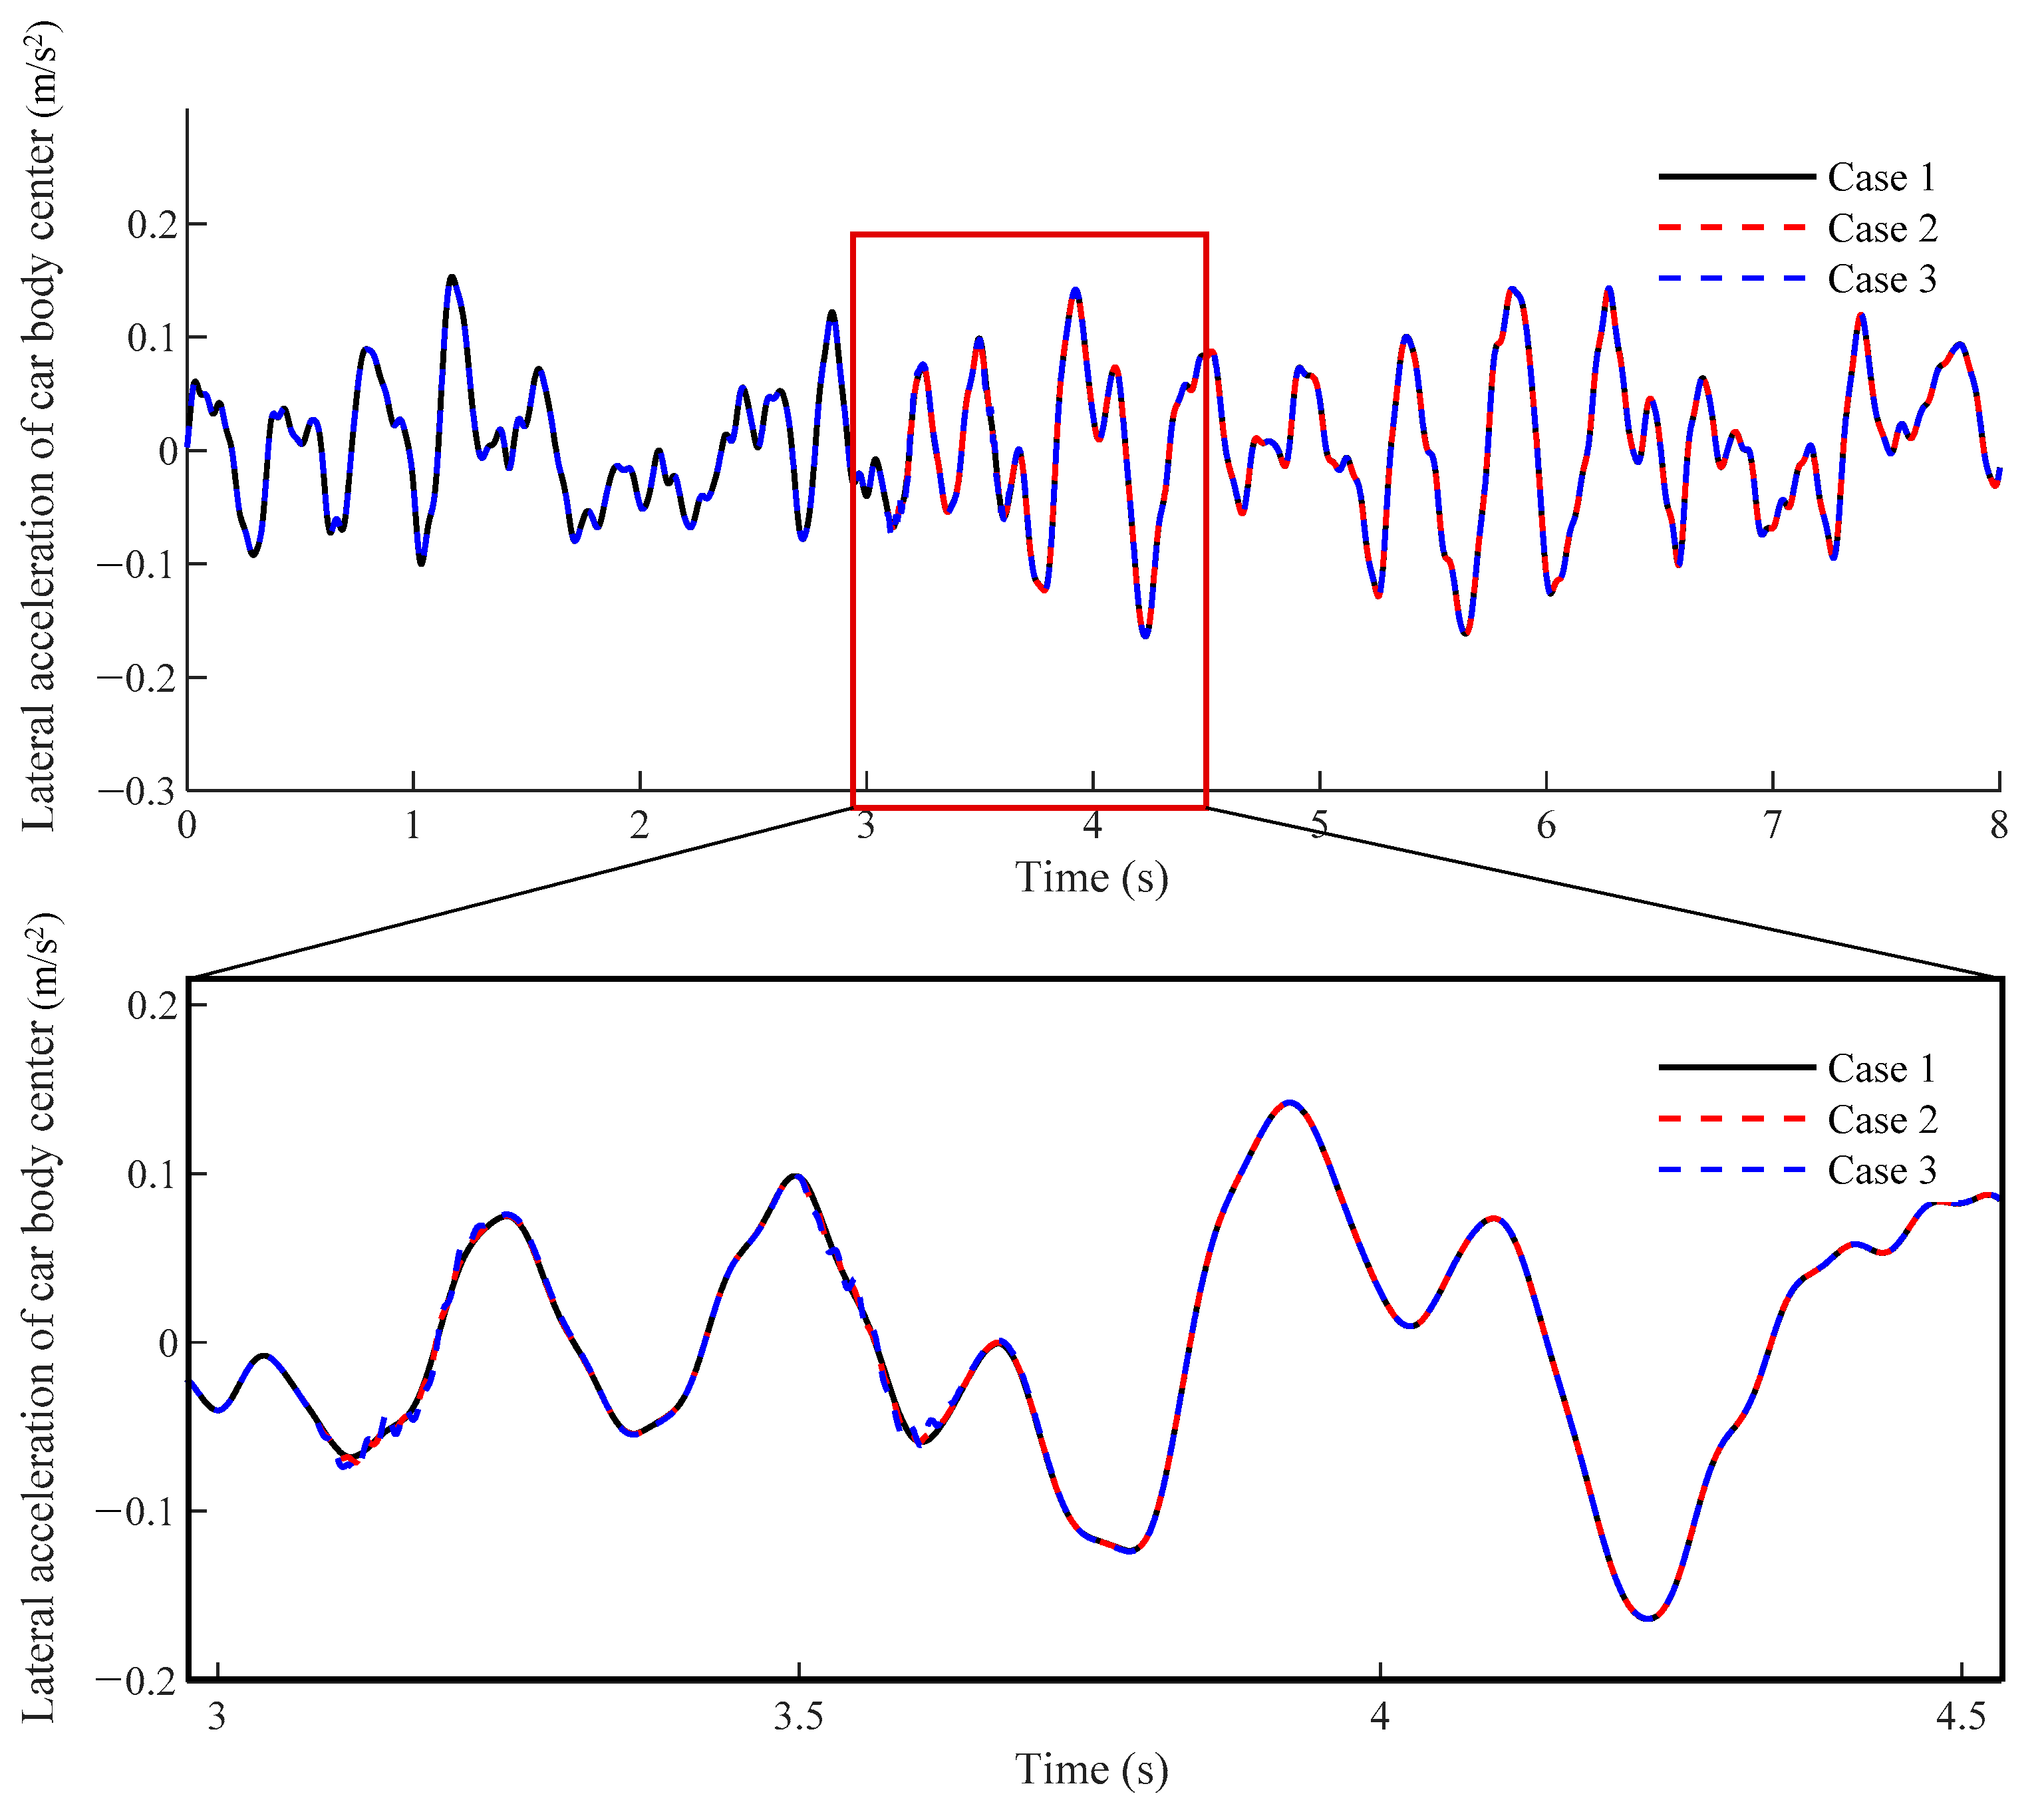
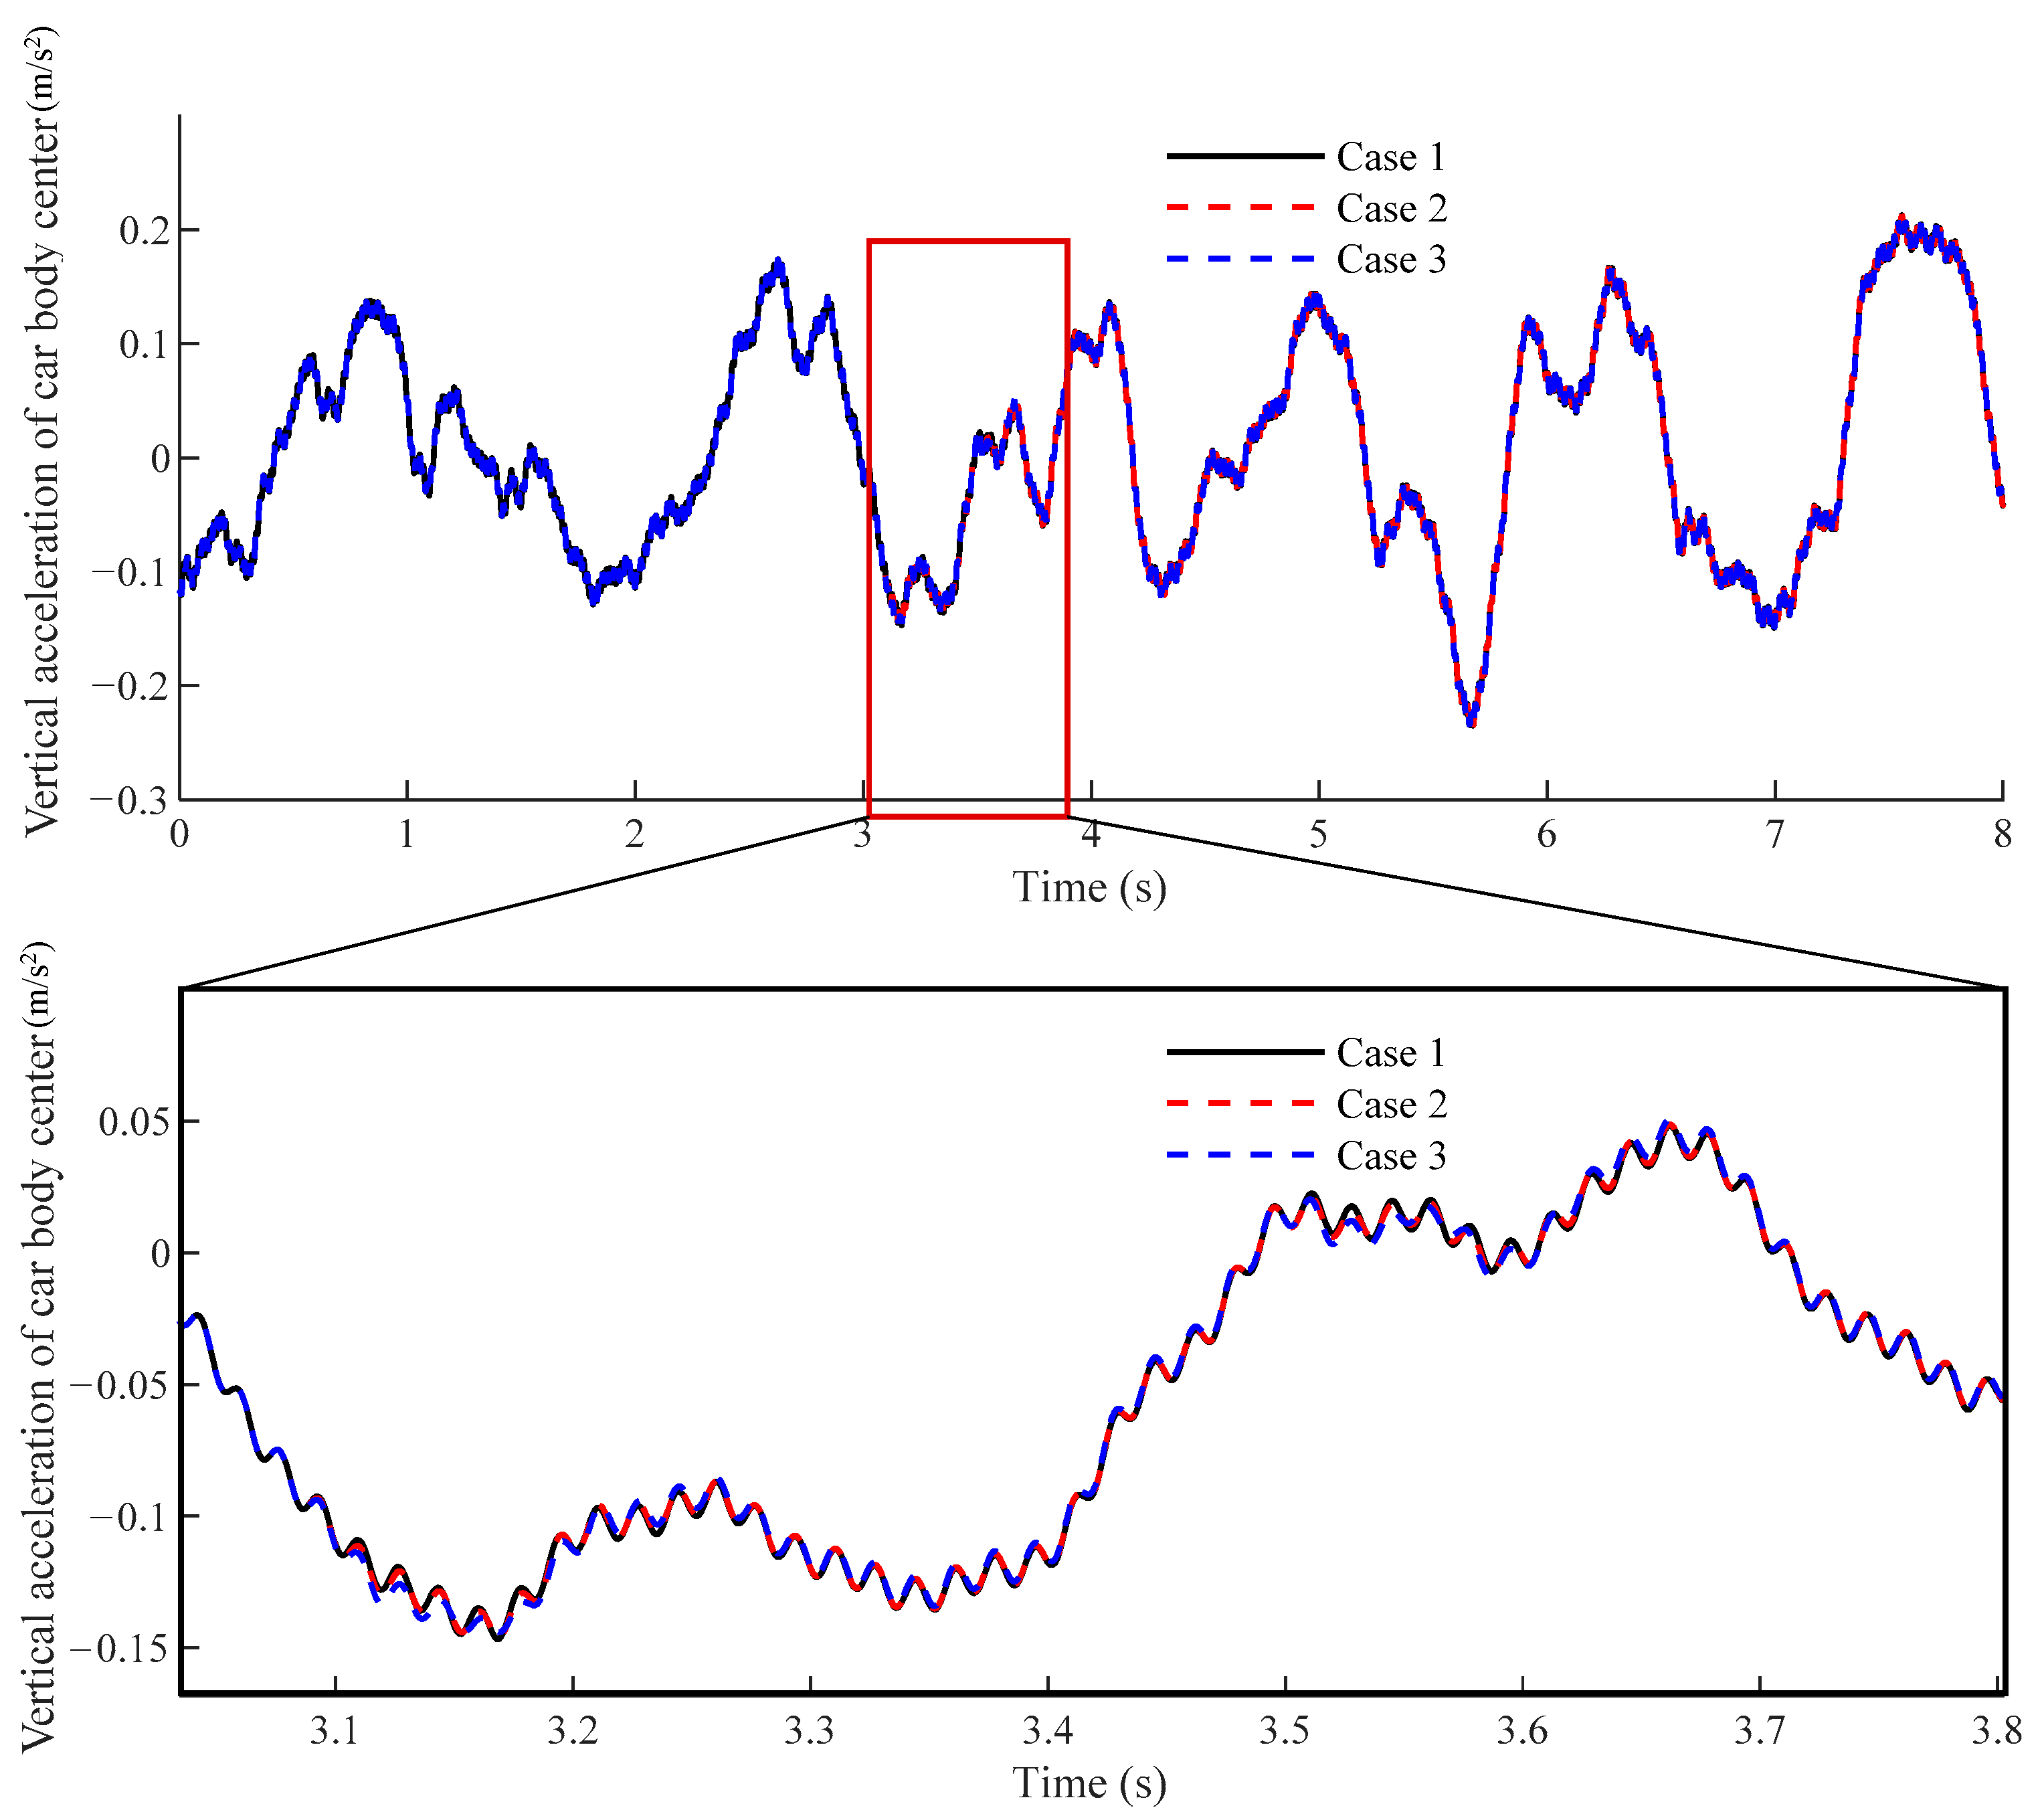
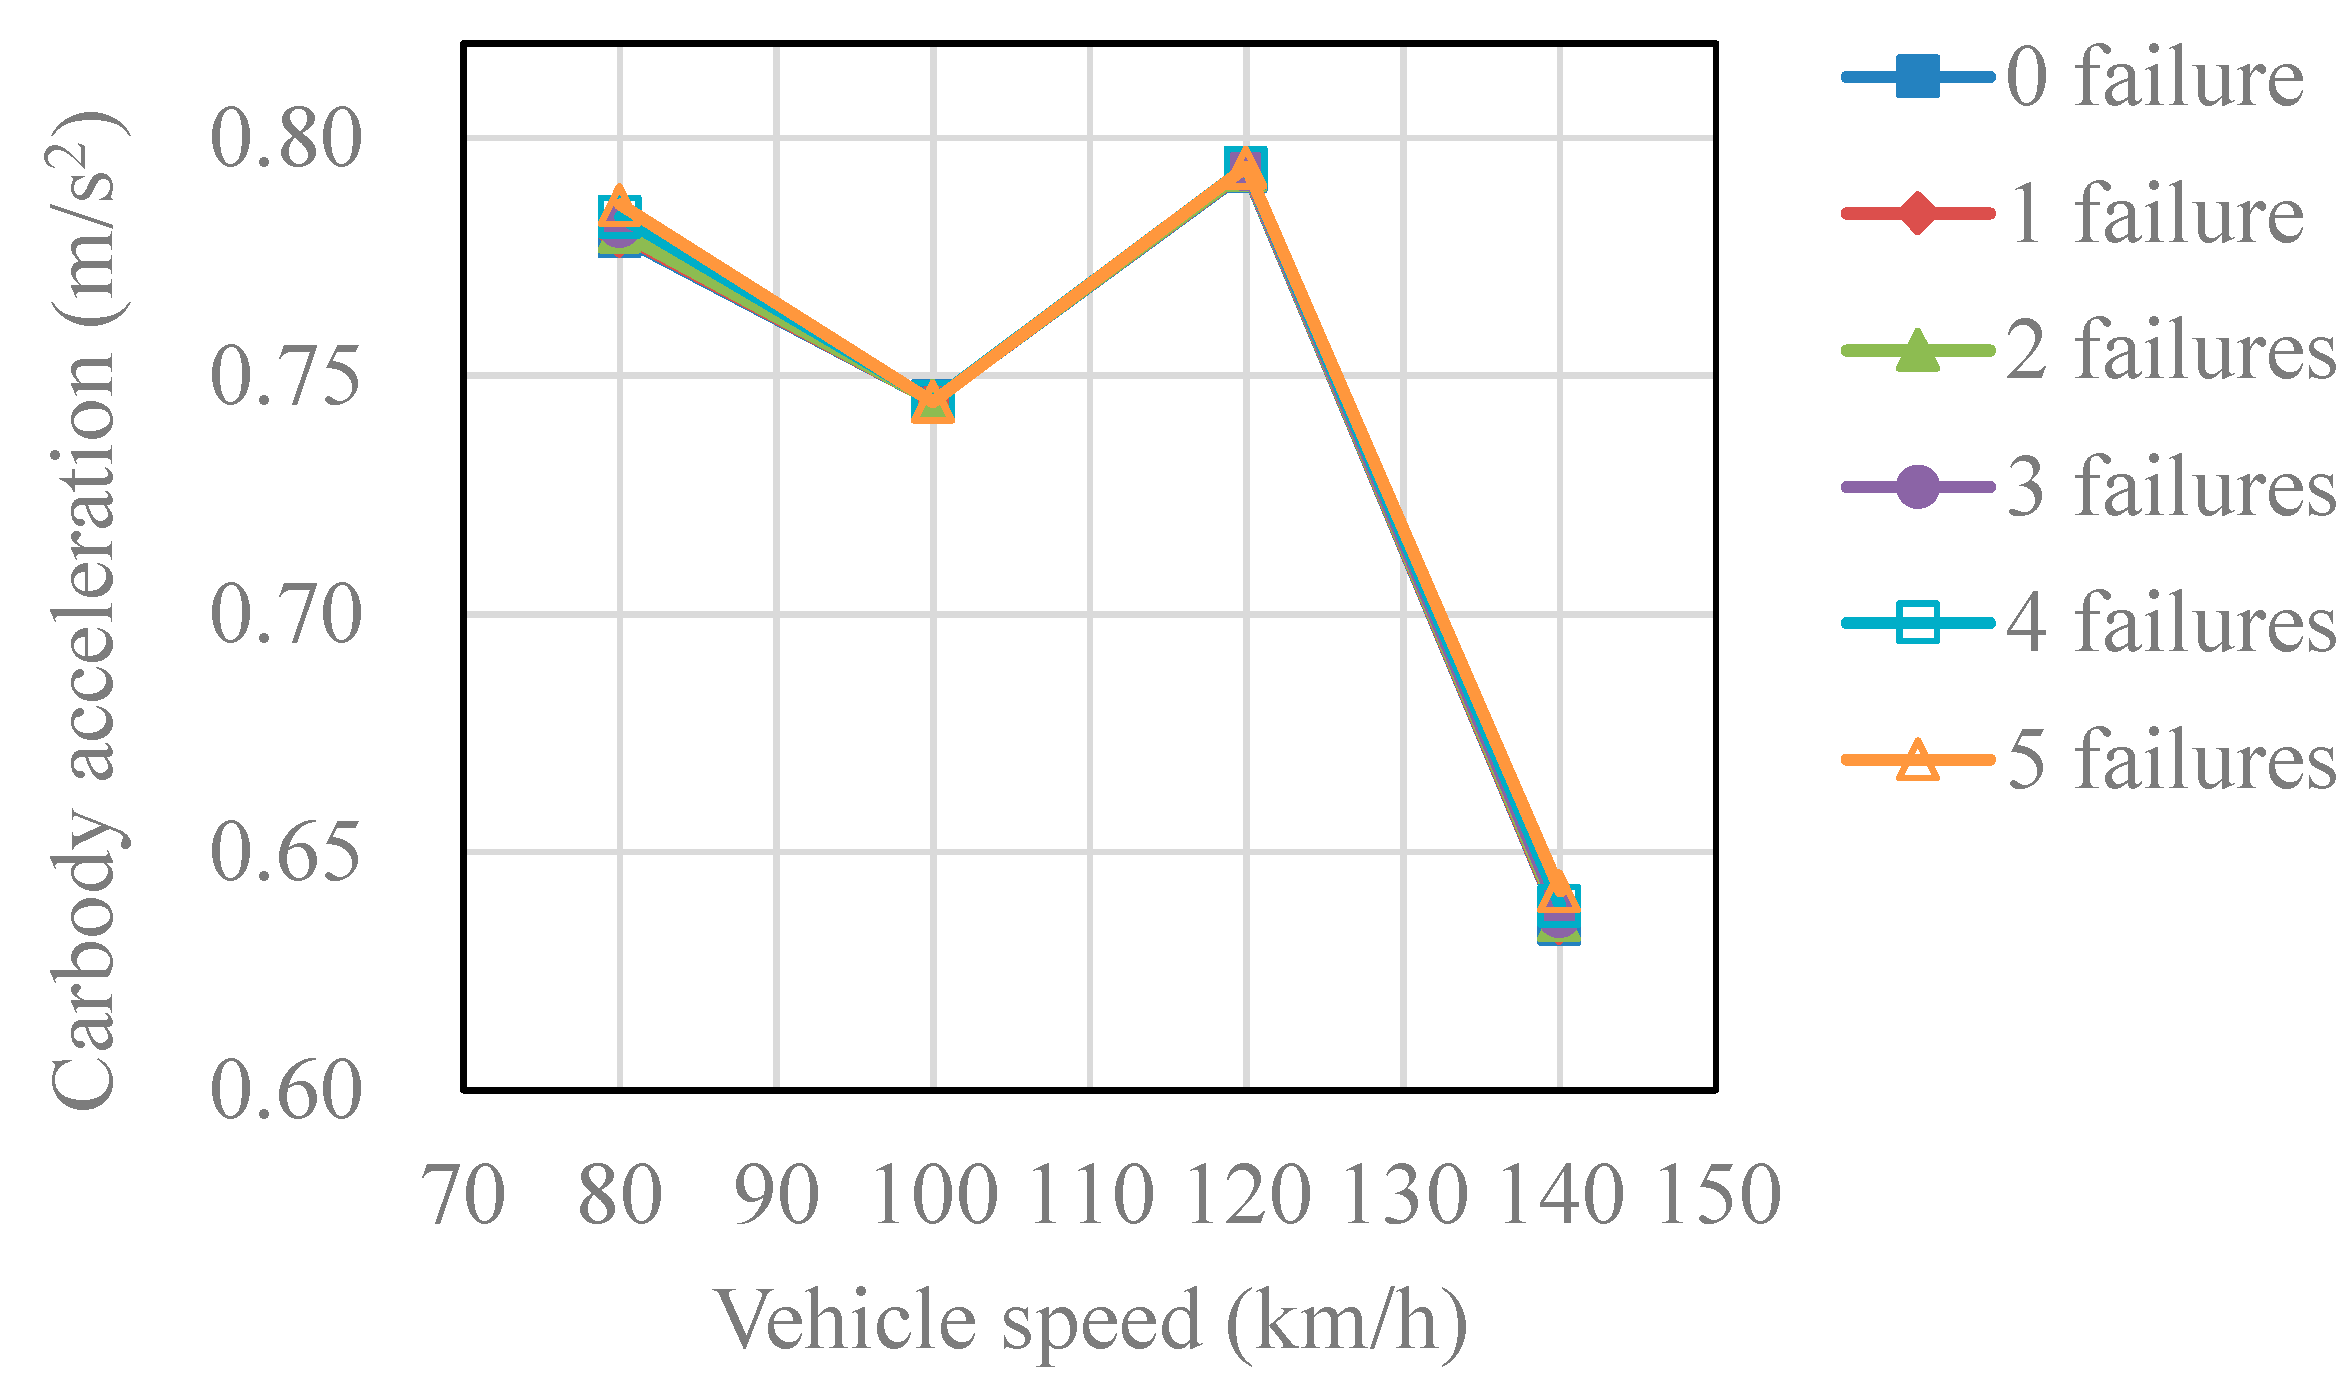
At different vehicle speeds, the number of fastener failures has little effect on the acceleration response of vehicle operation.
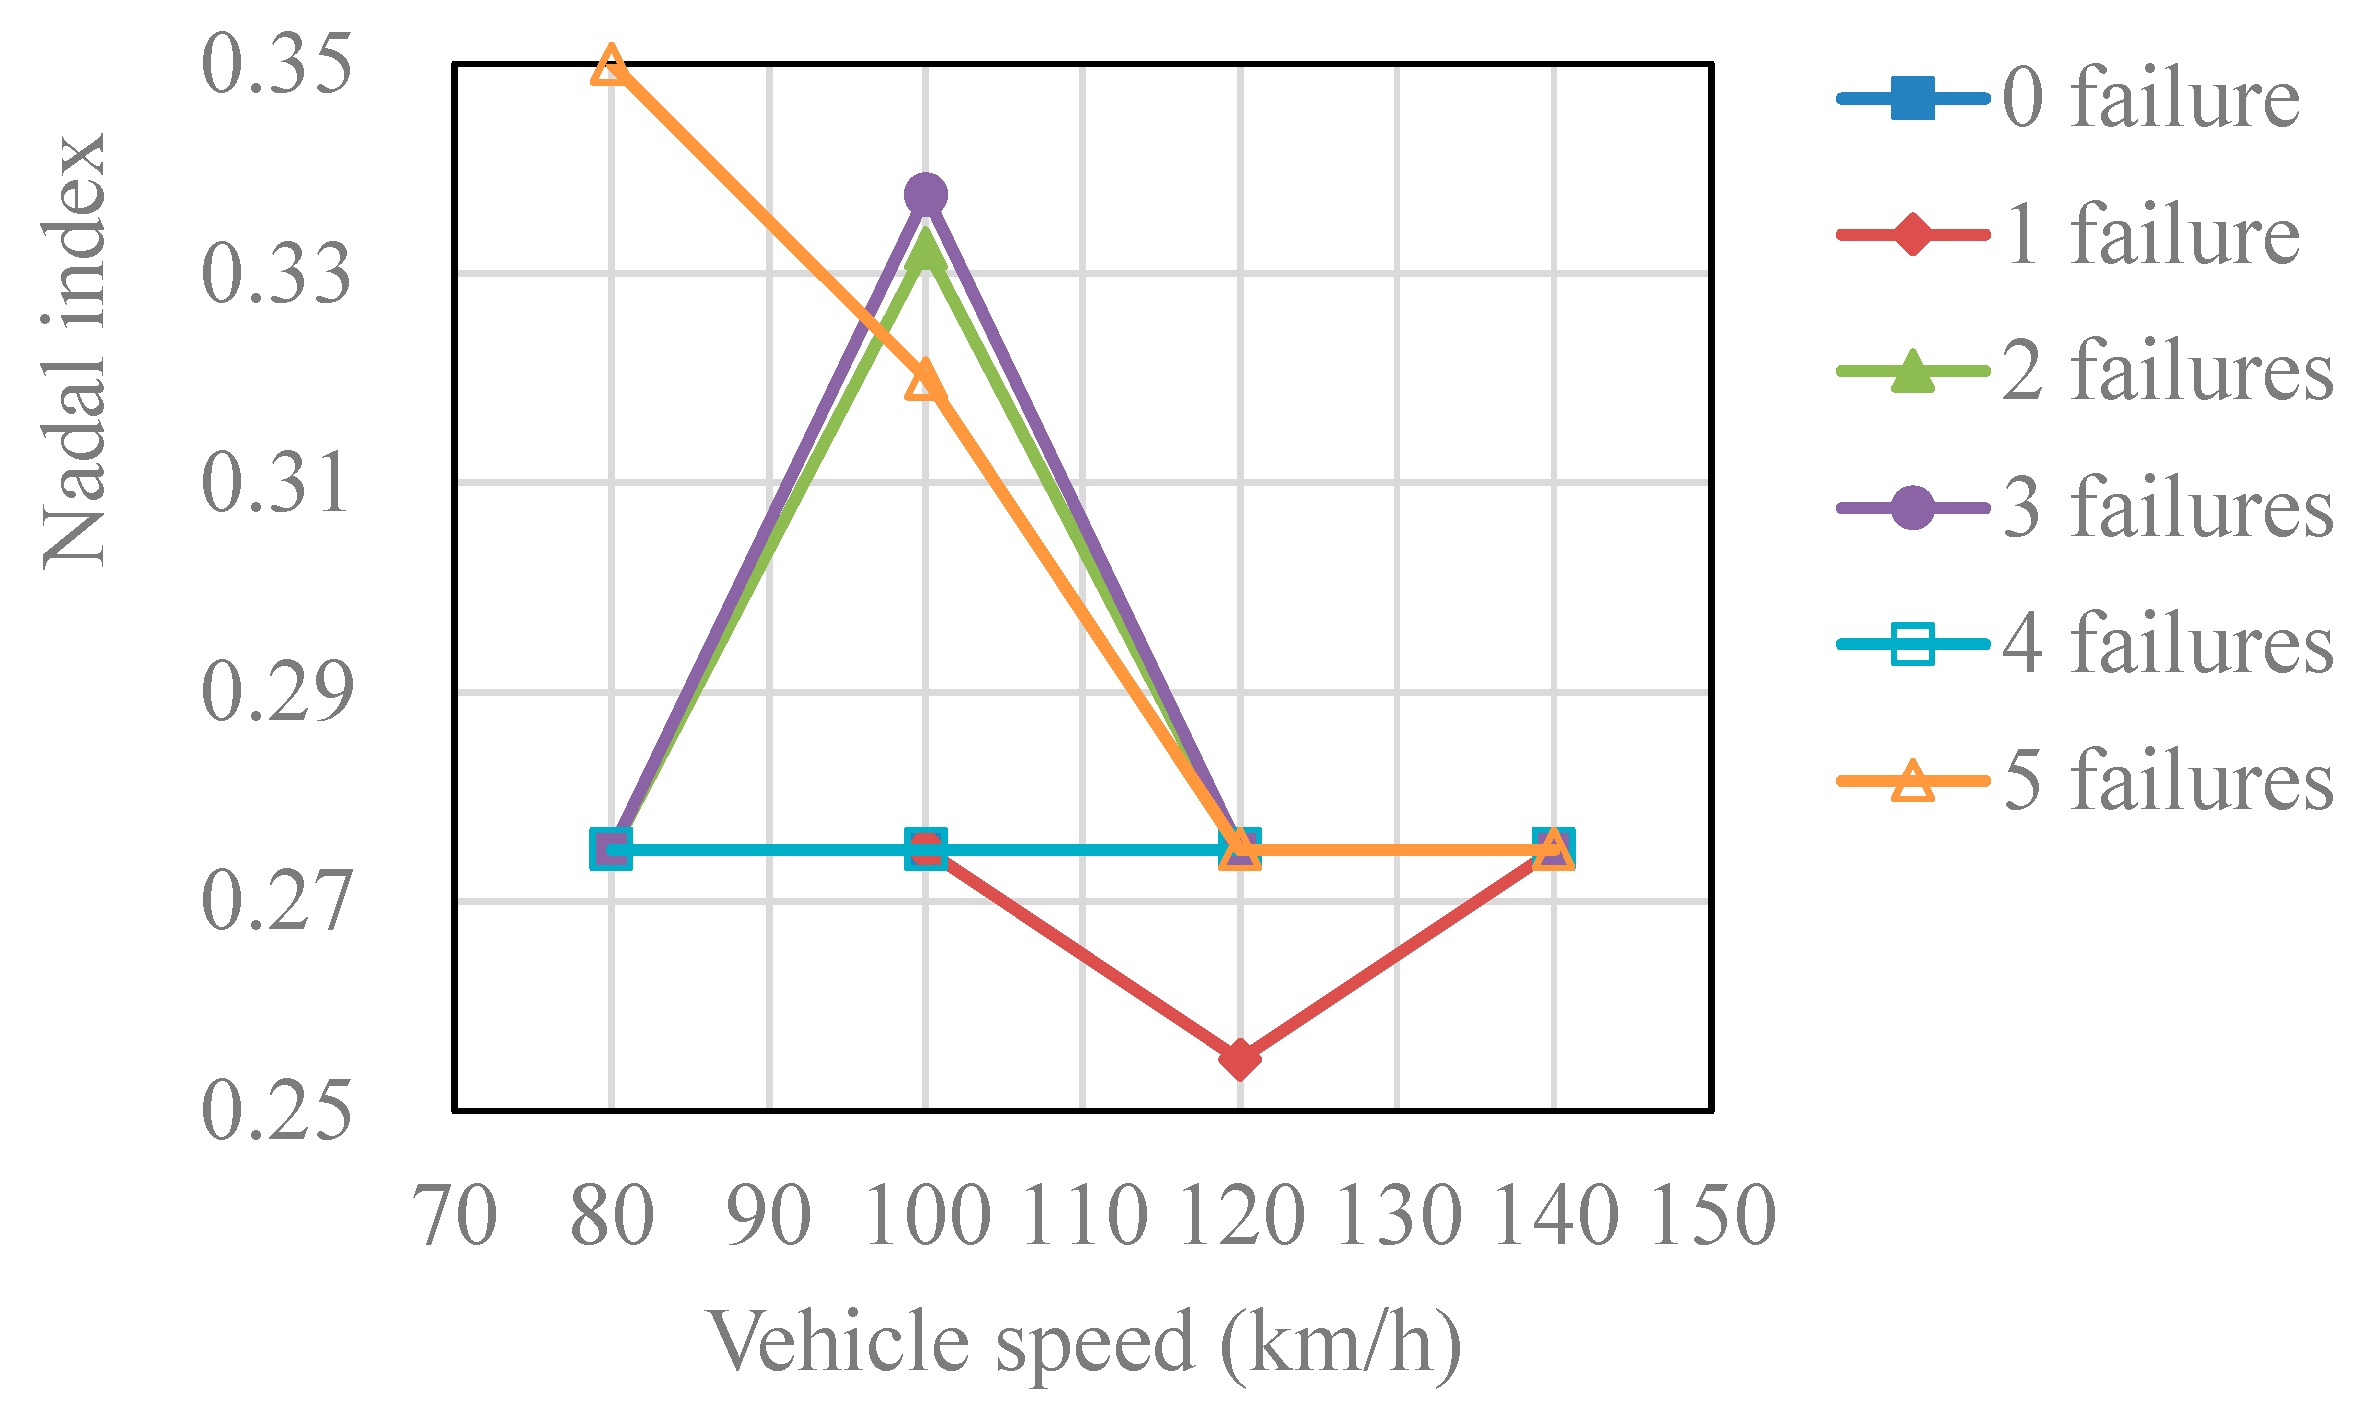
(3)
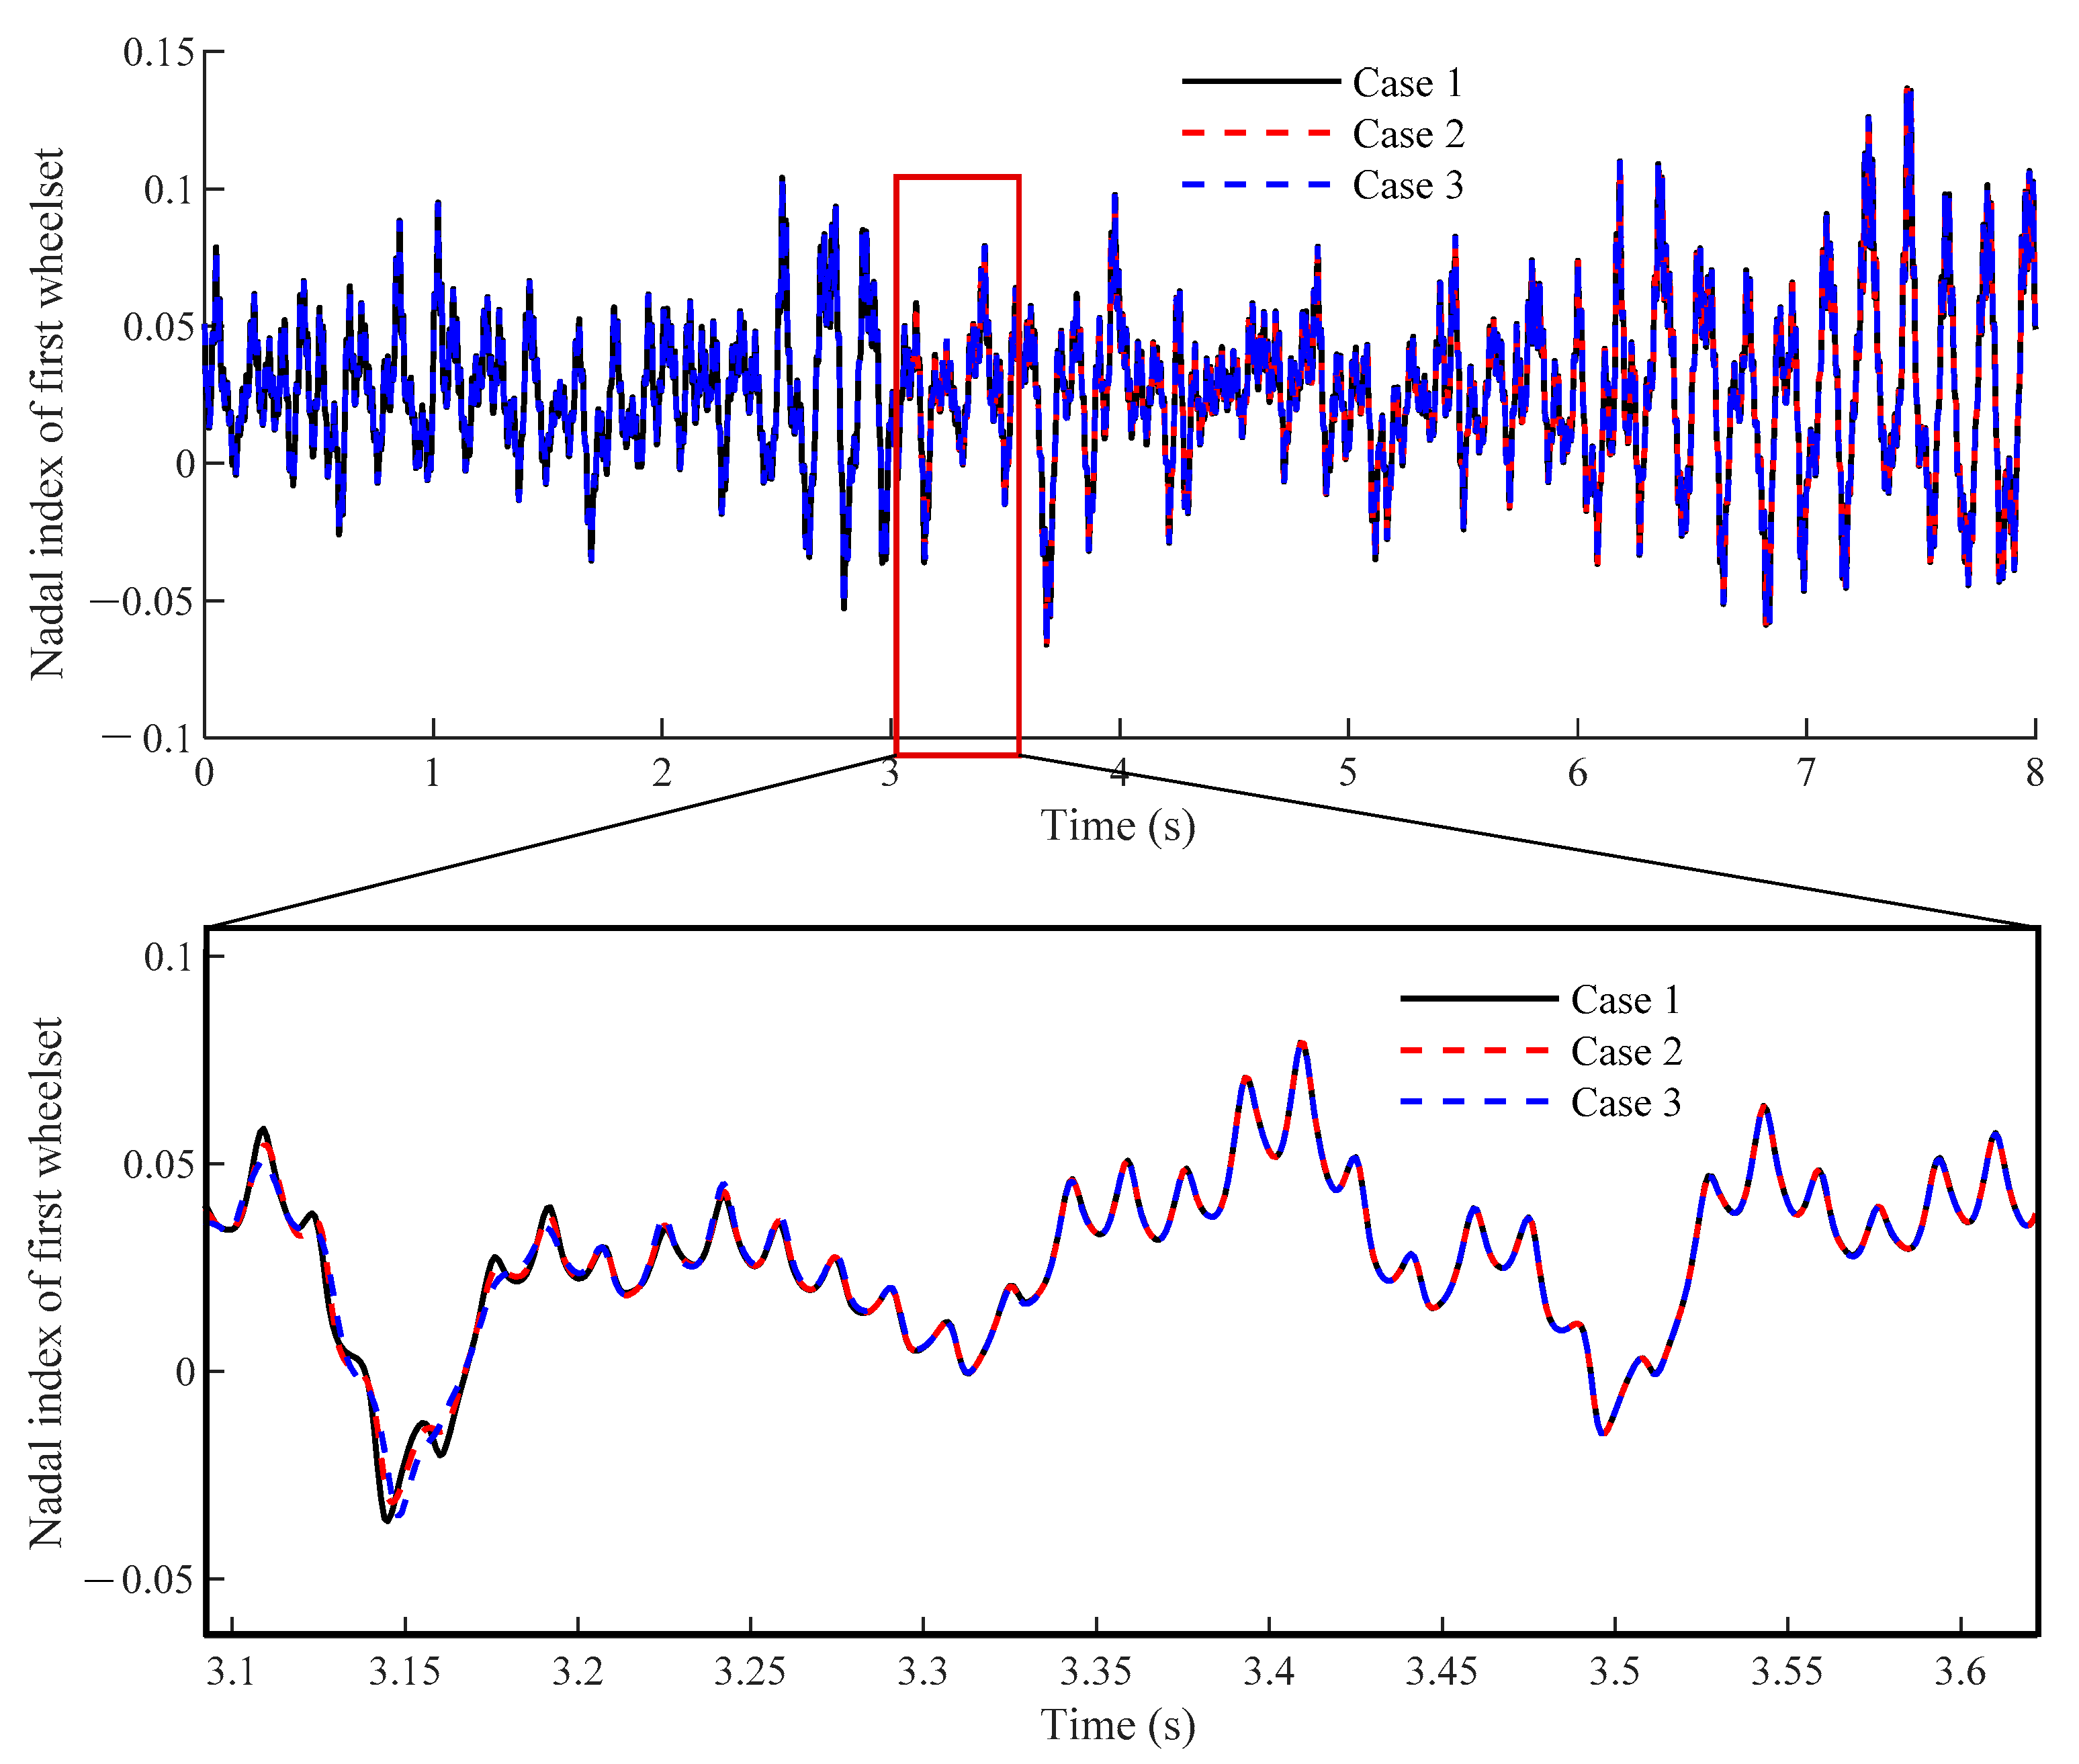
At different vehicle speeds, the number of fastener failures has an impact on the Nadal index of the vehicle, but the law is not obvious. In general, the more fastener failures, the more unsafe it is.
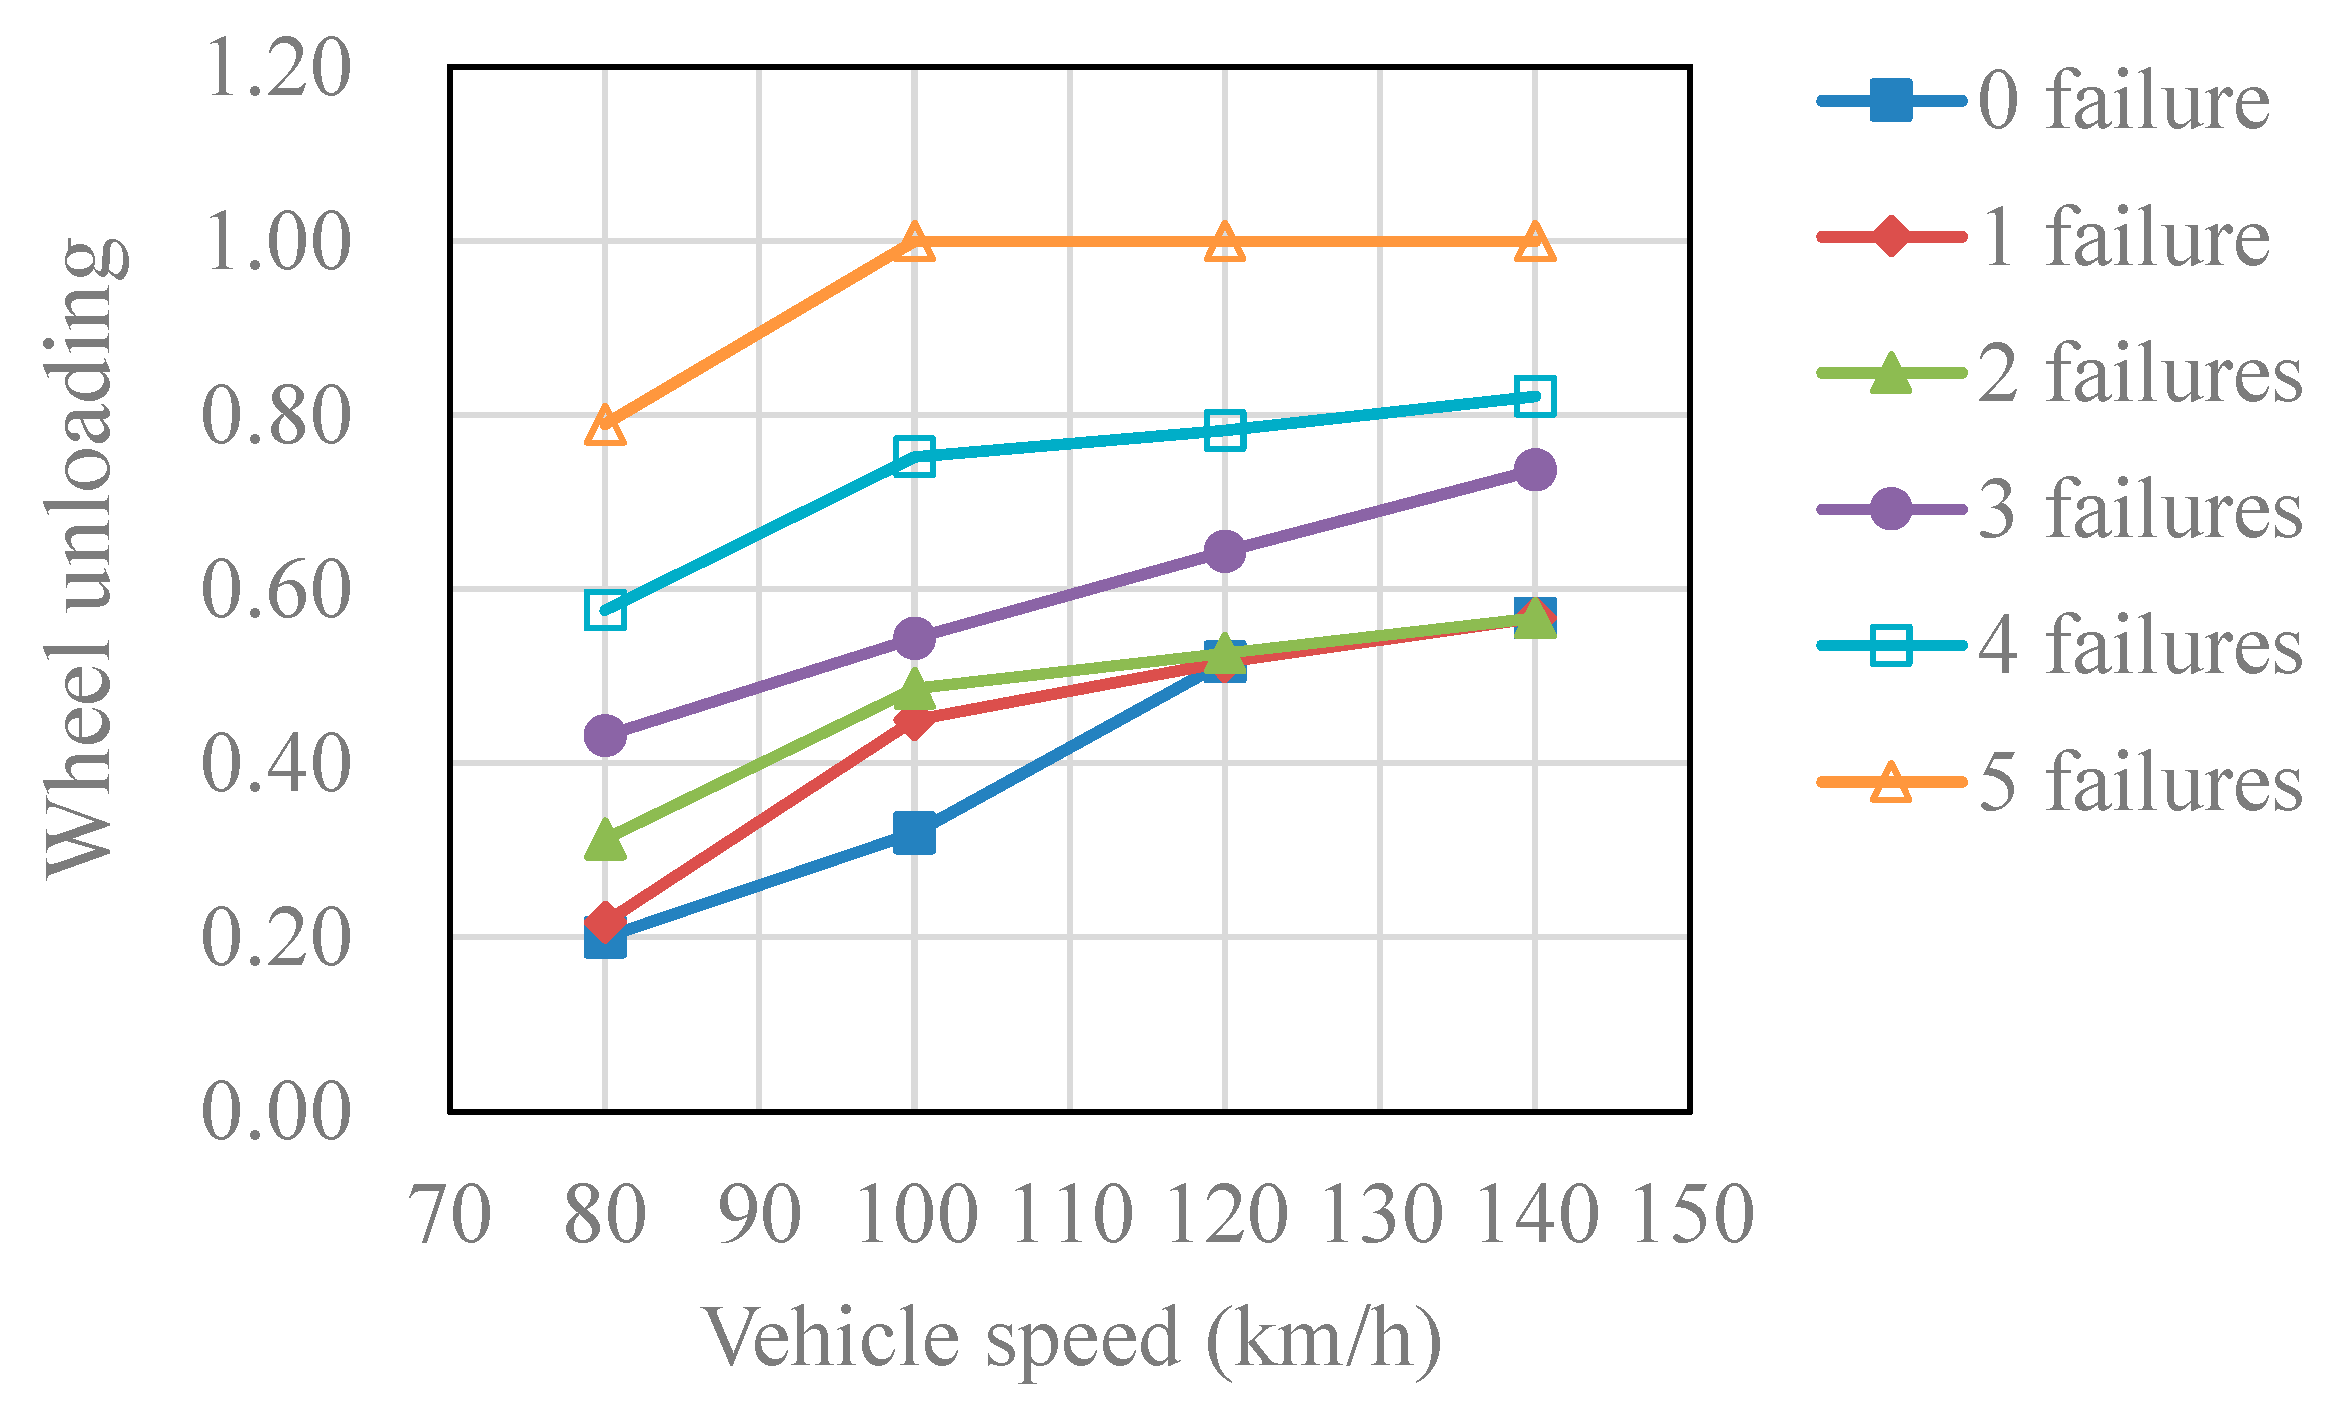
(4)
Under different vehicle speeds, the number of fastener failures has a significant impact on the wheel load reduction rate of the vehicle, and the wheel load reduction rate increases with the increase in vehicle speed and with the increase in the number of fastener failures. For the engineering background, when only less than three fasteners fail, the vehicle can run safely at the design speed; when four fasteners fail, the safe allowable speed of the vehicle is 130 km/h; when five fasteners fail, the safe allowable speed of the vehicle is 80 km/h.
(5)
The vehicle acceleration is not sensitive to the failure of the fastener but the failure of the fastener may endanger the running safety so it is necessary to use manual or other technical means for regular detection of fasteners. According to the normal vehicle operation speed, it is suggested that when more than three continuous fasteners are likely to fail or have become loose, they must be maintained.

Author Contributions

Conceptualization, Y.F.; Funding acquisition, Y.F.; Investigation, T.Z.; Project administration, Y.F.; Software, X.L.; Validation, Y.Y.; Writing—original draft, J.L.; Writing—review & editing, Y.Y. and X.L. All authors have read and agreed to the published version of the manuscript.

Funding

This research is jointly supported by the Research Project of Nanchang Rail Transit Group Co., Ltd.,(JS-2021-3A-ZG-A-ZX-001), the State Key Laboratory of Performance Monitoring and Protecting of Rail Transit Infrastructure (HJGZ20212009) and Fujian University of Technology (GY-Z21181), Science and Technology Project of Department of Transportation of Jiangxi Provincial (2019Q0024). The above support is greatly appreciated.

Institutional Review Board Statement

Not applicable.

Informed Consent Statement

Not applicable.

Data Availability Statement

The data used to support the findings of this study are included within the article.

Conflicts of Interest

The authors declare no conflict of interest.

References

  1. Ren, J.; Li, X.; Yang, R.; Wang, P.; Xie, P. Criteria for repairing damages of CA mortar for prefabricated framework-type slab track. Constr. Build. Mater. 2016, 110, 300–311. [Google Scholar] [CrossRef]
  2. Zeng, Z.; Wang, J.; Shen, S.; Li, P.; Abdulmumin Ahmed, S.; Wang, W. Experimental study on evolution of mechanical properties of CRTS III ballastless slab track under fatigue load. Constr. Build. Mater. 2019, 210, 639–649. [Google Scholar] [CrossRef]
  3. Feng, Y.; Jiang, L.; Zhou, W.; Lai, Z.; Chai, X. An analytical solution to the mapping relationship between bridge structures vertical deformation and rail deformation of high-speed railway. Steel Compos. Struct. 2019, 33, 209–224. [Google Scholar] [CrossRef]
  4. Feng, Y.; Jiang, L.; Zhou, W.; Chen, M. Post-earthquake track irregularity spectrum of high-speed railways continuous girder bridge. Steel Compos. Struct. 2021, 40, 323–338. [Google Scholar] [CrossRef]
  5. Yan, Q.; Sun, M.; Qing, S.; Deng, Z.; Dong, W. Numerical investigation on the damage and cracking characteristics of the shield tunnel caused by derailed high-speed train. Eng. Fail. Anal. 2020, 108, 104205. [Google Scholar] [CrossRef]
  6. Zhu, Z.; Wang, L.; Costa, P.A.; Bai, Y.; Yu, Z. An efficient approach for prediction of subway train-induced ground vibrations considering random track unevenness. J. Sound Vib. 2019, 455, 359–379. [Google Scholar] [CrossRef]
  7. Hung, H.H.; Chen, G.H.; Yang, Y.B. Effect of railway roughness on soil vibrations due to moving trains by 2.5D finite/infinite element approach. Eng. Struct. 2013, 57, 254–266. [Google Scholar] [CrossRef]
  8. Yang, Y.B.; Liang, X.; Hung, H.-H.; Wu, Y. Comparative study of 2D and 2.5D responses of long underground tunnels to moving train loads. Soil Dyn. Earthq. Eng. 2017, 97, 86–100. [Google Scholar] [CrossRef]
  9. Jin, Q.; Thompson, D.J.; Lurcock, D.E.J.; Toward, M.G.R.; Ntotsios, E. A 2.5D finite element and boundary element model for the ground vibration from trains in tunnels and validation using measurement data. J. Sound Vib. 2018, 422, 373–389. [Google Scholar] [CrossRef] [Green Version]
  10. Liu, X.; Xiang, P.; Jiang, L.; Lai, Z.; Zhou, T.; Chen, Y. Stochastic Analysis of Train–Bridge System Using the Karhunen–Loéve Expansion and the Point Estimate Method. Int. J. Str. Stab. Dyn. 2020, 20, 2050025. [Google Scholar] [CrossRef]
  11. Liu, X.; Jiang, L.; Lai, Z.; Xiang, P.; Chen, Y. Sensitivity and dynamic analysis of train-bridge coupled system with multiple random factors. Eng. Struct. 2020, 221, 111083. [Google Scholar] [CrossRef]
  12. Liu, X.; Jiang, L.; Xiang, P.; Lai, Z.; Feng, Y.; Cao, S. Dynamic response limit of high-speed railway bridge under earthquake considering running safety performance of train. J. Cent. South Univ. 2021, 28, 968–980. [Google Scholar] [CrossRef]
  13. Liu, X.; Jiang, L.; Xiang, P.; Jiang, L.; Lai, Z. Safety and comfort assessment of a train passing over an earthquake-damaged bridge based on a probability model. Struct. Infrastruct. Eng. 2021, 1–12. [Google Scholar] [CrossRef]
  14. Lai, Z.; Jiang, L.; Zhou, W.; Yu, J.; Zhang, Y.; Liu, X.; Zhou, W. Lateral girder displacement effect on the safety and comfortability of the high-speed rail train operation. Veh. Syst. Dyn. 2021, 1–25. [Google Scholar] [CrossRef]
  15. Zhu, S.; Cai, C.; Zhai, W. Interface damage assessment of railway slab track based on reliability techniques and vehicle-track interactions. J. Transp. Eng. 2016, 142, 04016041. [Google Scholar] [CrossRef]
  16. Xu, L.; Liu, H.; Yu, Z. A coupled model for investigating the interfacial and fatigue damage evolution of slab tracks in vehicle-track interaction. Appl. Math. Model. 2022, 101, 772–790. [Google Scholar] [CrossRef]
  17. Wang, C.; Zhang, J.; Tu, Y.; Sabourova, N.; Grip, N.; Blanksvärd, T.; Elfgren, L. Fatigue assessment of a reinforced concrete railway bridge based on a coupled dynamic system. Struct. Infrastruct. Eng. 2020, 16, 861–879. [Google Scholar] [CrossRef]
  18. Zhao, L.; Zhou, L.; Yu, Z.; Mahunon, A.D.; Peng, X.; Zhang, Y. Experimental study on CRTS II ballastless track-bridge structural system mechanical fatigue performance. Eng. Struct. 2021, 244, 112784. [Google Scholar] [CrossRef]
  19. Xu, L.; Liu, X. Matrix coupled model for the vehicle–track interaction analysis featured to the railway crossing. Mech. Syst. Signal Process. 2021, 152, 107485. [Google Scholar] [CrossRef]
  20. Li, Y.; Chen, J.; Wang, J.; Shi, X.; Chen, L. Analysis of damage of joints in CRTSII Slab track under temperature and vehicle loads. KSCE J. Civ. Eng. 2020, 24, 1209–1218. [Google Scholar] [CrossRef]
  21. Yuan, Z.; Zhu, S.; Yuan, X.; Zhai, W. Vibration-based damage detection of rail fastener clip using convolutional neural network: Experiment and simulation. Eng. Fail. Anal. 2021, 119, 104906. [Google Scholar] [CrossRef]
  22. Kang, C.; Schneider, S.; Wenner, M.; Marx, S. Experimental investigation on rail fatigue resistance of track/bridge interaction. Eng. Struct. 2020, 216, 110747. [Google Scholar] [CrossRef]
  23. Kang, C.; Wenner, M.; Marx, S. Experimental investigation on the rail residual stress distribution and its influence on the bending fatigue resistance of rails. Constr. Build. Mater. 2021, 284, 122856. [Google Scholar] [CrossRef]
  24. Masoudi Nejad, R.; Liu, Z.; Ma, W.; Berto, F. Fatigue reliability assessment of a pearlitic Grade 900A rail steel subjected to multiple cracks. Eng. Fail. Anal. 2021, 128, 105625. [Google Scholar] [CrossRef]
  25. Zeng, Q.; Dimitrakopoulos, E.G. Vehicle–bridge interaction analysis modeling derailment during earthquakes. Nonlinear Dyn. 2018, 93, 2315–2337. [Google Scholar] [CrossRef]
  26. Liu, X.; Jiang, L.; Xiang, P.; Feng, Y.; Lai, Z.; Sun, X. Evaluation of optimal ground motion intensity measures of high-speed railway train running safety on bridges during earthquakes. Struct. Eng. Mech. 2022, 81, 219–230. [Google Scholar]
  27. Mao, J.; Yu, Z.; Xiao, Y.; Jin, C.; Bai, Y. Random dynamic analysis of a train-bridge coupled system involving random system parameters based on probability density evolution method. Probabilistic Eng. Mech. 2016, 46, 48–61. [Google Scholar] [CrossRef]
  28. Zeng, Z.-P.; Zhao, Y.-G.; Xu, W.-T.; Yu, Z.-W.; Chen, L.-K.; Lou, P. Random vibration analysis of train–bridge under track irregularities and traveling seismic waves using train–slab track–bridge interaction model. J. Sound Vib. 2015, 342, 22–43. [Google Scholar] [CrossRef]
  29. Lou, P.; Zeng, Q. Formulation of equations of motion of finite element form for vehicle-track-bridge interaction system with two types of vehicle model. Int. J. Numer. Meth. Engng. 2005, 62, 435–474. [Google Scholar] [CrossRef]
  30. Zhai, W. Vehicle-Track Coupled Dynamic, 4th ed.; Science Press: Beijing, China, 2017. (In Chinese) [Google Scholar]
  31. Dinh, V.N.; Kim, K.D.; Warnitchai, P. Dynamic analysis of three-dimensional bridge–high-speed train interactions using a wheel–rail contact model. Eng. Struct. 2009, 31, 3090–3106. [Google Scholar] [CrossRef]
  32. Liu, X.; Jiang, L.; Xiang, P.; Lai, Z.; Liu, L.; Cao, S.; Zhou, W. Probability analysis of train-bridge coupled system considering track irregularities and parameter uncertainty. Mech. Based Des. Struct. Mach. 2021, 1–18. [Google Scholar] [CrossRef]
  33. He, D.; Xiang, J.; Zeng, Q. A new method for dynamics modeling of ballastless track. J. Cent. South Univ. 2007, 38, 1206–1211. (In Chinese) [Google Scholar]
Figure 1. Rail–slab system considering fastener failure.
Applsci 12 06769 g001
Figure 2. Vehicle model: (a) side view; (b) front view; and (c) vertical view.
Applsci 12 06769 g002
Figure 3. Model validation [33].
Applsci 12 06769 g003
Figure 4. Time–history curve of the wheel unloading ratio.
Applsci 12 06769 g004
Figure 5. Time–history curve of the Nadal index.
Applsci 12 06769 g005
Figure 6. Time–history curve of car body lateral acceleration.
Applsci 12 06769 g006
Figure 7. Time–history curve of car body vertical acceleration.
Applsci 12 06769 g007
Figure 8. Car body acceleration at different speeds and under different cases.
Applsci 12 06769 g008
Figure 9. The Nadal index under different cases.
Applsci 12 06769 g009
Figure 10. The wheel unloading ratio at different speeds and under different cases.
Applsci 12 06769 g010
Table 1. Vehicle parameter.
ParameterSymbolUnitValue
Mass of car bodymckg48,800
Mass of bogiemtkg2310
Mass of wheel setmwkg2080
Moment of inertia of vehicle body around X-axisJcxkg·m2159,300
Moment of inertia of vehicle body around Y-axisJcykg·m22,352,100
Moment of inertia of vehicle body around Z-axisJczkg·m22,033,900
Moment of inertia of bogie around X-axisJtxkg·m22080
Moment of inertia of bogie around Y-axisJtykg·m21405
Moment of inertia of bogie around Z-axisJtzkg·m22450
Moment of inertia of wheel set around X-axisJwxkg·m2749
Moment of inertia of wheel set around Y-axisJwykg·m281
Moment of inertia of wheel set around Z-axisJwzkg·m21026
Distance between two wheel sets of the same bogie2d1m2.50
Distance between two bogies of the same carriage2d2m15.7
Vertical distance between vehicle body and secondary suspensionh1m0.569
Vertical distance between secondary suspension and bogieh2m0.39
Vertical distance between primary suspension and wheel seth3m0.075
Horizontal distance between vertical springs of secondary suspension2b1m2.10
Horizontal distance between vertical springs of primary suspension2b2m1.90
Lateral stiffness of primary suspension springky1N/m980,000
Vertical stiffness of primary suspension springkz1N/m1,176,000
Lateral stiffness of secondary suspension springky2N/m165,000
Vertical stiffness of secondary suspension springkz2N/m·s373,000
Lateral stiffness of primary suspension dampingcy1N/m·s0
Vertical stiffness of primary suspension dampingcz1N/m·s10,000
Lateral stiffness of secondary suspension dampingcy2N/m·s25,000
Vertical stiffness of secondary suspension dampingcz2N/m·s30,000
Table 2. Fastener failure case.
NumberCase
Case 1Perfect
Case 2Single failure
Case 3Two consecutive failures
Publisher’s Note: MDPI stays neutral with regard to jurisdictional claims in published maps and institutional affiliations.

