Abstract
The problem of excessive wear of pantograph strips frequently occurs on China’s Z City Metro Line 1. After on-site investigation and analysis by the metro operating company, it was speculated that the problem was related to abnormal track irregularities. Therefore, taking Z City Metro Line 1 as the main research object, the measured track irregularity of the whole line was analyzed and compared with other typical track spectra, and a track-vehicle-pantograph-catenary coupling dynamics model was established to analyze the relationship between the pantograph-catenary dynamic characteristics and the track irregularity. The two frequency ranges of the track irregularity that have a significant impact on the pantograph-catenary contact were found. Finally, after numerical calculation and analysis, it is recommended to focus on the irregularities with the two wavelength ranges of 9~16 m and 3~4 m in the maintenance.
1. Introduction
The main structural components of urban rail transit are tracks, vehicles, and catenaries, which are coupled with each other. The pantograph–catenary (PC) is one of the most important interaction systems [1], responsible for providing power energy for the locomotive [2]. During the operation of the vehicle, the pantograph and catenary are always in sliding contact, and there are friction and wear effects between them [3]. With the increase in the operation time, the track line will inevitably deteriorate [4,5], aggravate the vehicle vibration, and may make contributions to the wear of the pantograph strip, which will lead to a significant reduction in the service life and even the separation of the PC system [6], slowing down the train and affecting the safety.
Aiming at the problem of the abnormal vibration and wear of the pantograph strip, a series of studies have been carried out. Shining et al. analyzed the statistical data from an operating railway line and concluded that the irregular height of the contact wire relative to the rails and high humidity could lead to the abnormal wear of the collector strip [7]. Ding et al. carried out a series of tests to study the influence of the temperature and the arc discharge on the wear of the pantograph strip [8]. Wei et al. proposed a wear model to calculate the wear rate and predict the wear of the contact wire [9]. By experimental studies, Mei pointed out that the direct current and vibration of the pantograph strip can largely affect the tribological performance [10]. Daocharoenporn et al. proposed a wear prediction method based on nonlinear multibody dynamic algorithms, which can account for the electrical and the mechanical effects [11]. Derosa et al. proposed a heuristic wear model for predicting the wear of the pantograph strip and the contact wire [12]. Yi et al. established a PC dynamics model and concluded through computational analysis that the pantograph crack would aggravate the wear rate of the pantograph strip [13]. Wang et al. analyzed the wear of the contact wire using the measured data, and the results show that the wear is related to the structural characteristics of the wire, but it has little effect on the PC interaction [14]. Zhang et al. carried out a series of tests and concluded that the best tribological properties could be obtained at 80 km/h, and the increasing amplitude could extend the cracks [15].
Besides the research from the perspective of PC interaction, the influence of track disturbance on vehicle vibration and PC contact has gradually drawn attention. There have also been some studies on the influence of track irregularity on pantograph vibration characteristics. Yao et al. established a track–vehicle–PC coupling dynamics model and studied the influence of the AAR track spectrum on the pantograph vibration [16]. Carnicero et al. presented a PC–vehicle–track model to analyze the vertical dynamics of the whole system, and the results show that the track irregularities influence the PC contact points [17]. Yang et al. constructed a PC model and a vehicle–track model to study the dynamic responses of PC with random track irregularities and concluded that the irregularities could increase the fluctuation of PC contact forces [18].
As can be seen from the above research work, the influence of track disturbance on PC contact is also a hot spot for researchers. It was mainly analyzed based on the random track excitations generated from the typical irregularity spectrum, such as the American level 6 spectrum. These random irregularities are general disturbances, which cannot reflect the abnormal characteristics of the real track lines. In fact, there are great differences in the characteristics of track irregularities under different lines [19], such as the differential settlement of the foundation [20,21], or the periodic irregularities such as rail weld [22,23], which will increase the medium–long-wavelength irregularity of the track. They have non-negligible impacts on the vehicle system, as well as the PC system. It is necessary to carry out specific research and analysis according to the actual situation.
The authors received feedback from the metro operation company, claiming that the problem of rapid wear of the pantograph strip occurred frequently on Metro Line 1 in Z City. The problem led to the frequent replacement of the pantograph strip, which greatly increased the maintenance cost. Since the problem could not be simply solved by the replacement of different types of pantograph strips, after a great deal of on-site investigation and inspection, the maintenance department considered that there were specific relationships between the track geometry and the PC contact.
To explore the relationship and propose solutions to this defect, taking Z City Metro Line 1 as the main research object, a pantograph–vehicle–track coupling dynamic model is established, and the relationship of the measured track irregularity on the vehicle and pantograph system is studied. The causes that lead to abnormal wear of the pantograph strip are analyzed, and control suggestions are proposed.
2. Analysis of the Measured Excitations
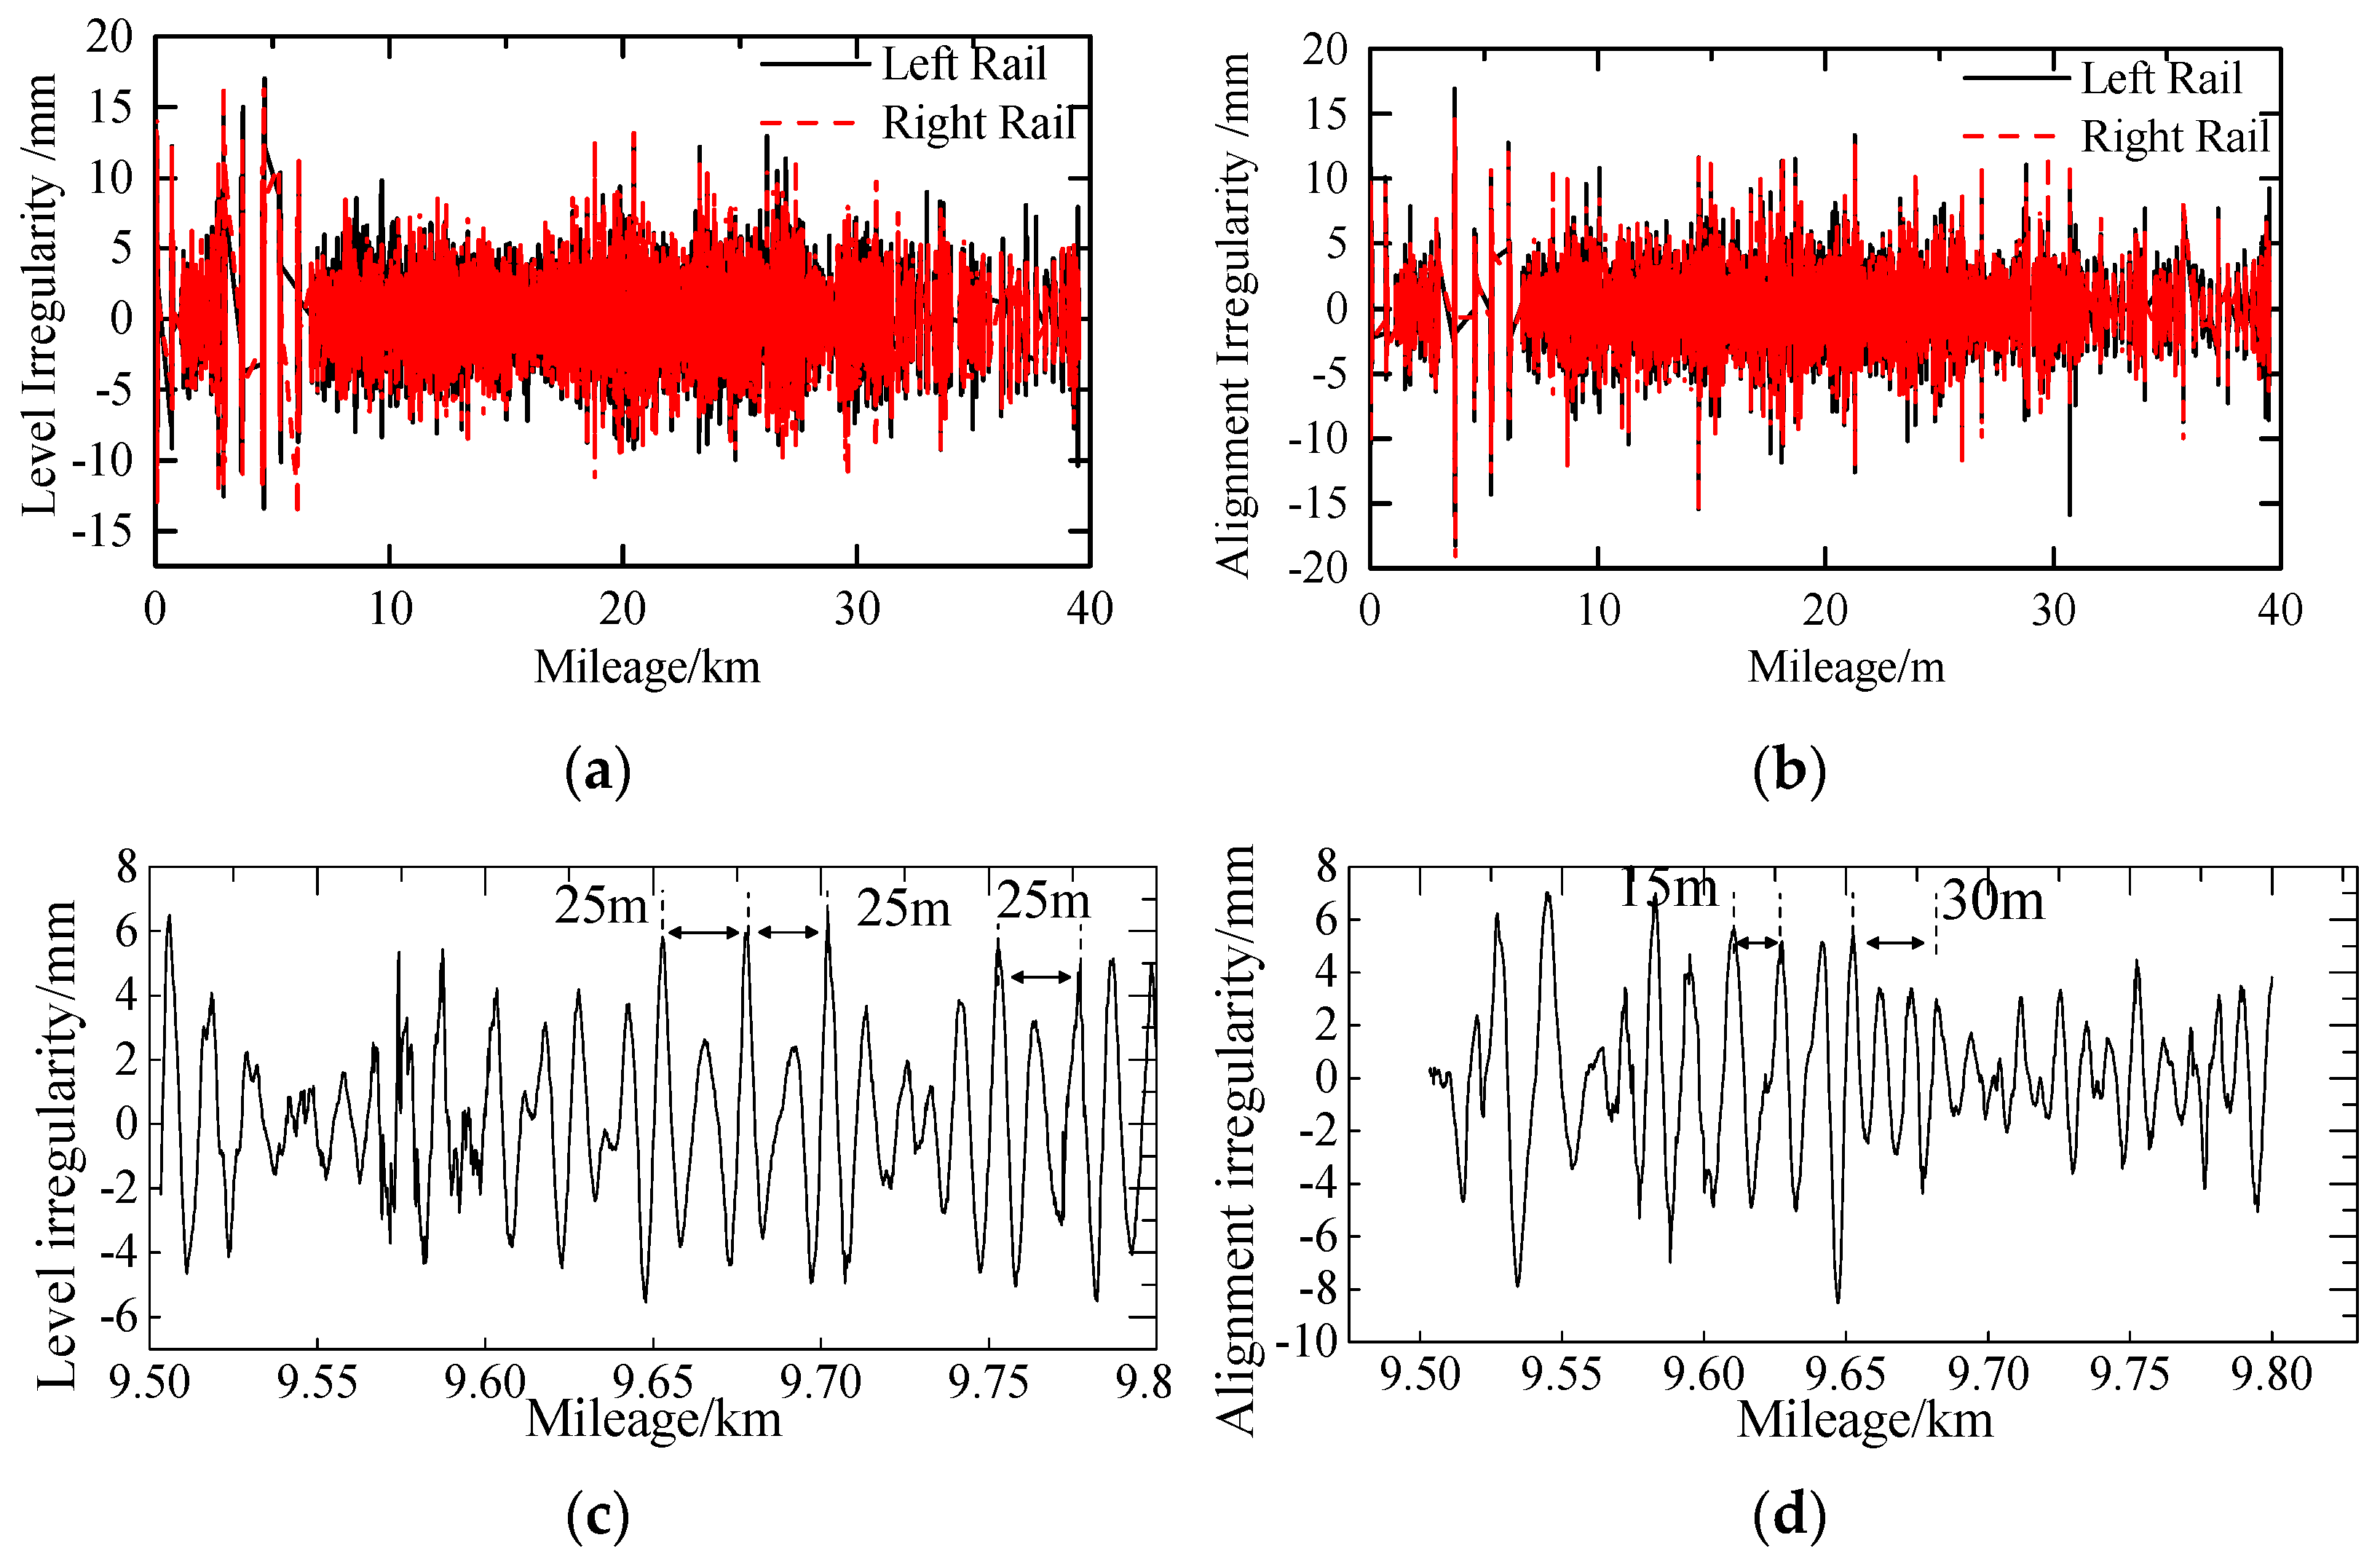
The analysis of the track irregularity of the whole line and the comparison with typical irregularities is given in this section to evaluate the track geometry. Figure 1 shows the whole line track irregularity measured by the inspection vehicle of Metro Line 1 in Z City (with the speed of 15~60 km/h; the average speed is approximately 43 km/h, and the sampling interval is 0.266 m/point).
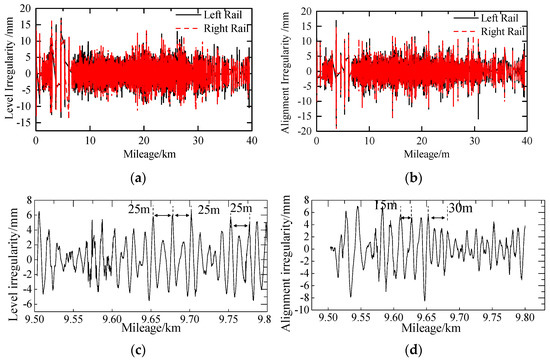
Figure 1.
The time-domain characteristics of the track geometries: (a) the time-history diagram of level irregularity; (b) the time-history diagram of alignment irregularity; (c) the feature of the level irregularity; (d) the feature of the alignment irregularity.
It can be observed from Figure 1c,d that there are periodic irregularities with wavelengths of 12.5 m and 25 m, and the amplitude of −6~7 mm existing in the level irregularity; there are periodic irregularities with wavelengths of 10~15 m, and the amplitude of −10~8 mm existing in the alignment irregularity. These characteristics are prevalent in the whole line of Metro Line 1 in Z City.
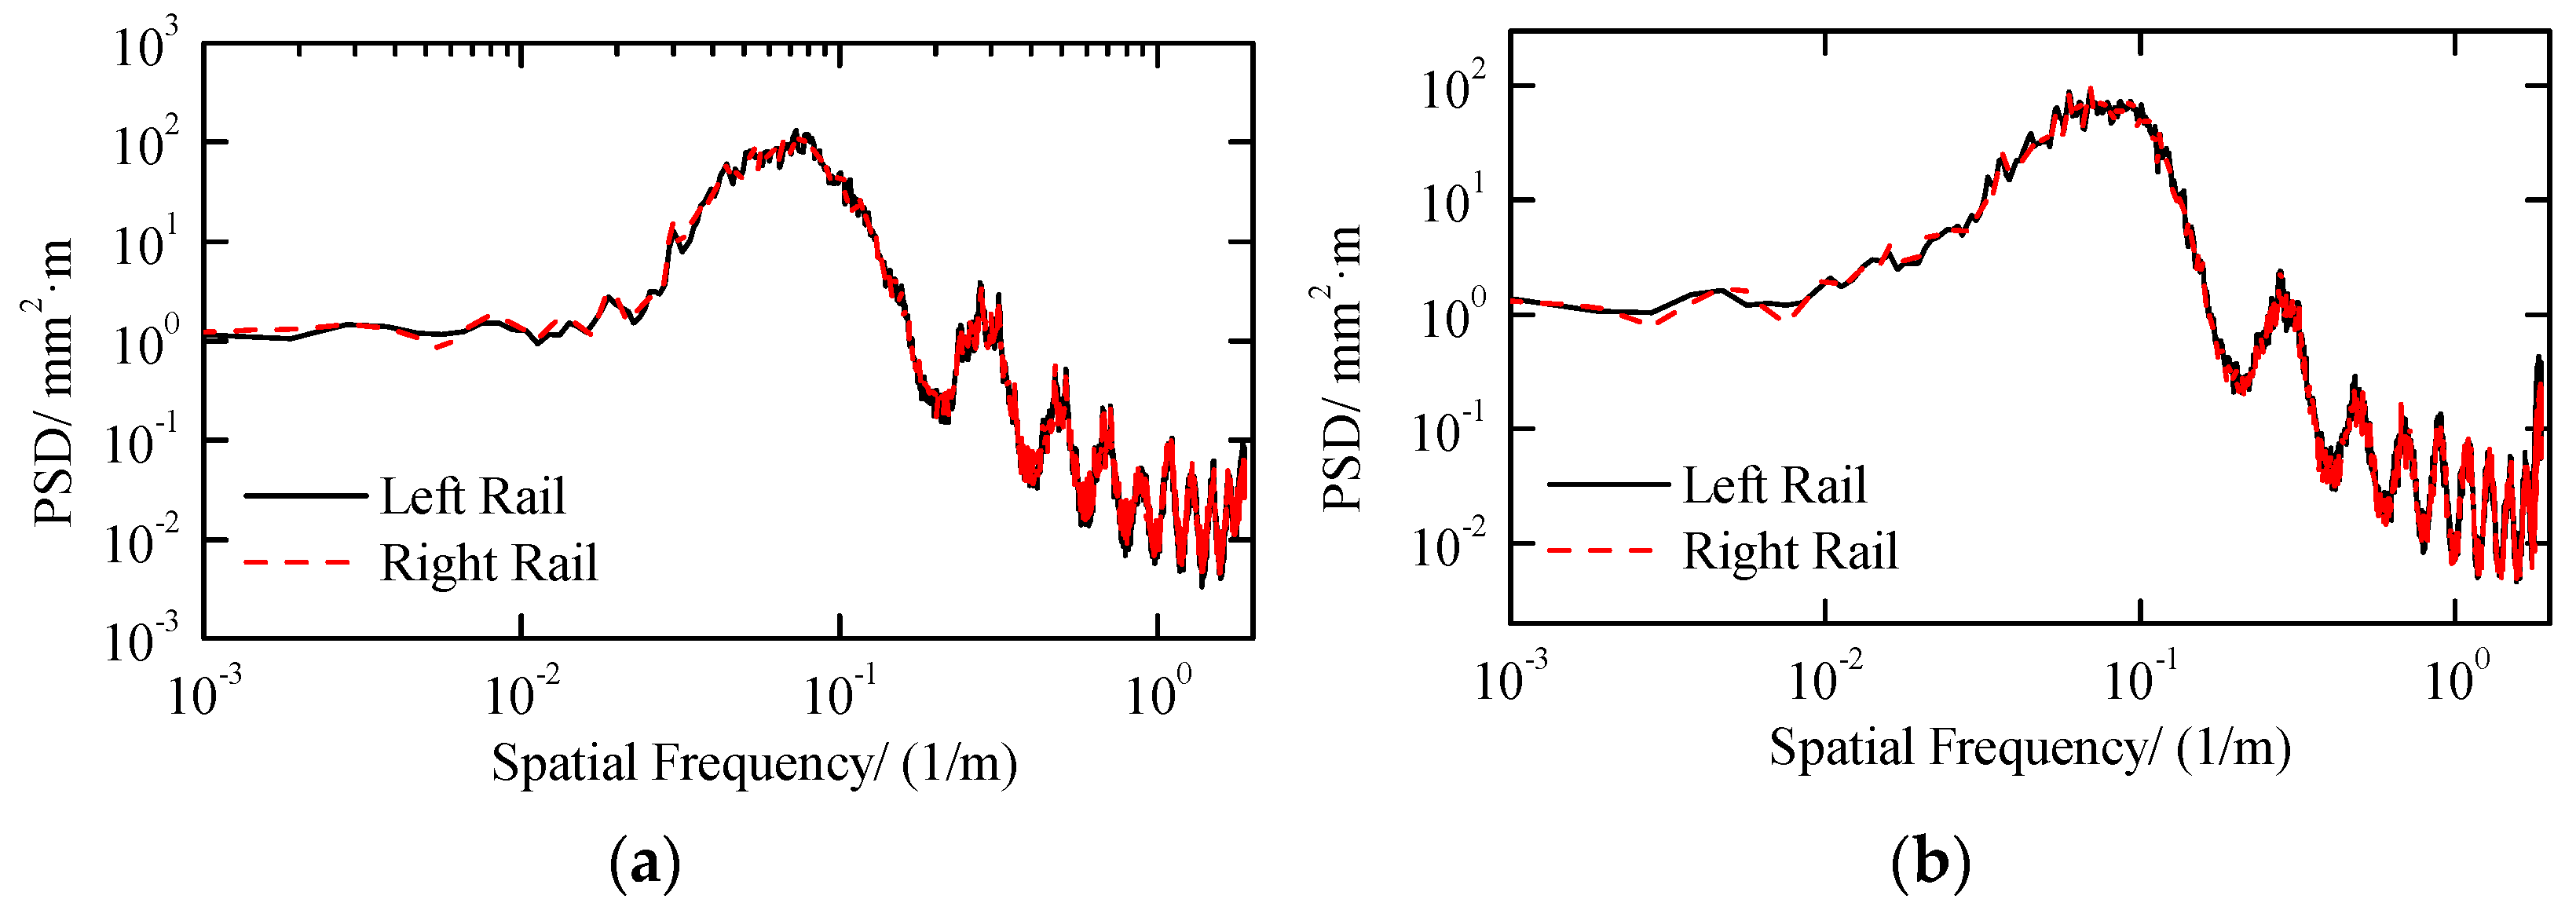
To analyze the periodic characteristics of the track geometry more comprehensively, the track geometry power spectral density (PSD) is calculated, as shown in Figure 2.
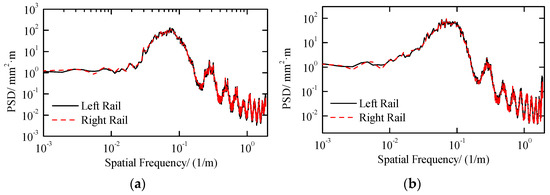
Figure 2.
Spectral characteristics of the track geometries: (a) the PSD of the level irregularity; (b) the PSD of the alignment irregularity.
There are several spectral peaks in the level irregularities, indicating the existence of periodic irregularities. The wavelength range of the first spectral peak is 5.6~41.6 m with the largest component of 12.5~13.6 m, which may be caused by the periodic irregularities of the 25 m welded rail. The wavelength range of the second spectral peak is 2.5~4.5 m, and the peak wavelength is 3.6 m. The wavelength range of the third spectral peak is 1.78~2.38 m, and its peak value is located at the wavelength of 2.1 m. Considering that the irregularity with a shorter wavelength has less influence on the car body and pantograph, this manuscript does not focus on them.
The PSD of the alignment irregularity is similar to that of the level irregularities. There are also several periodic irregularities. The frequency bands where the three largest peaks are located are 10~20 m, 2.7~4.5 m, and 1.78~2.38 m, which are basically the same as the level irregularities.
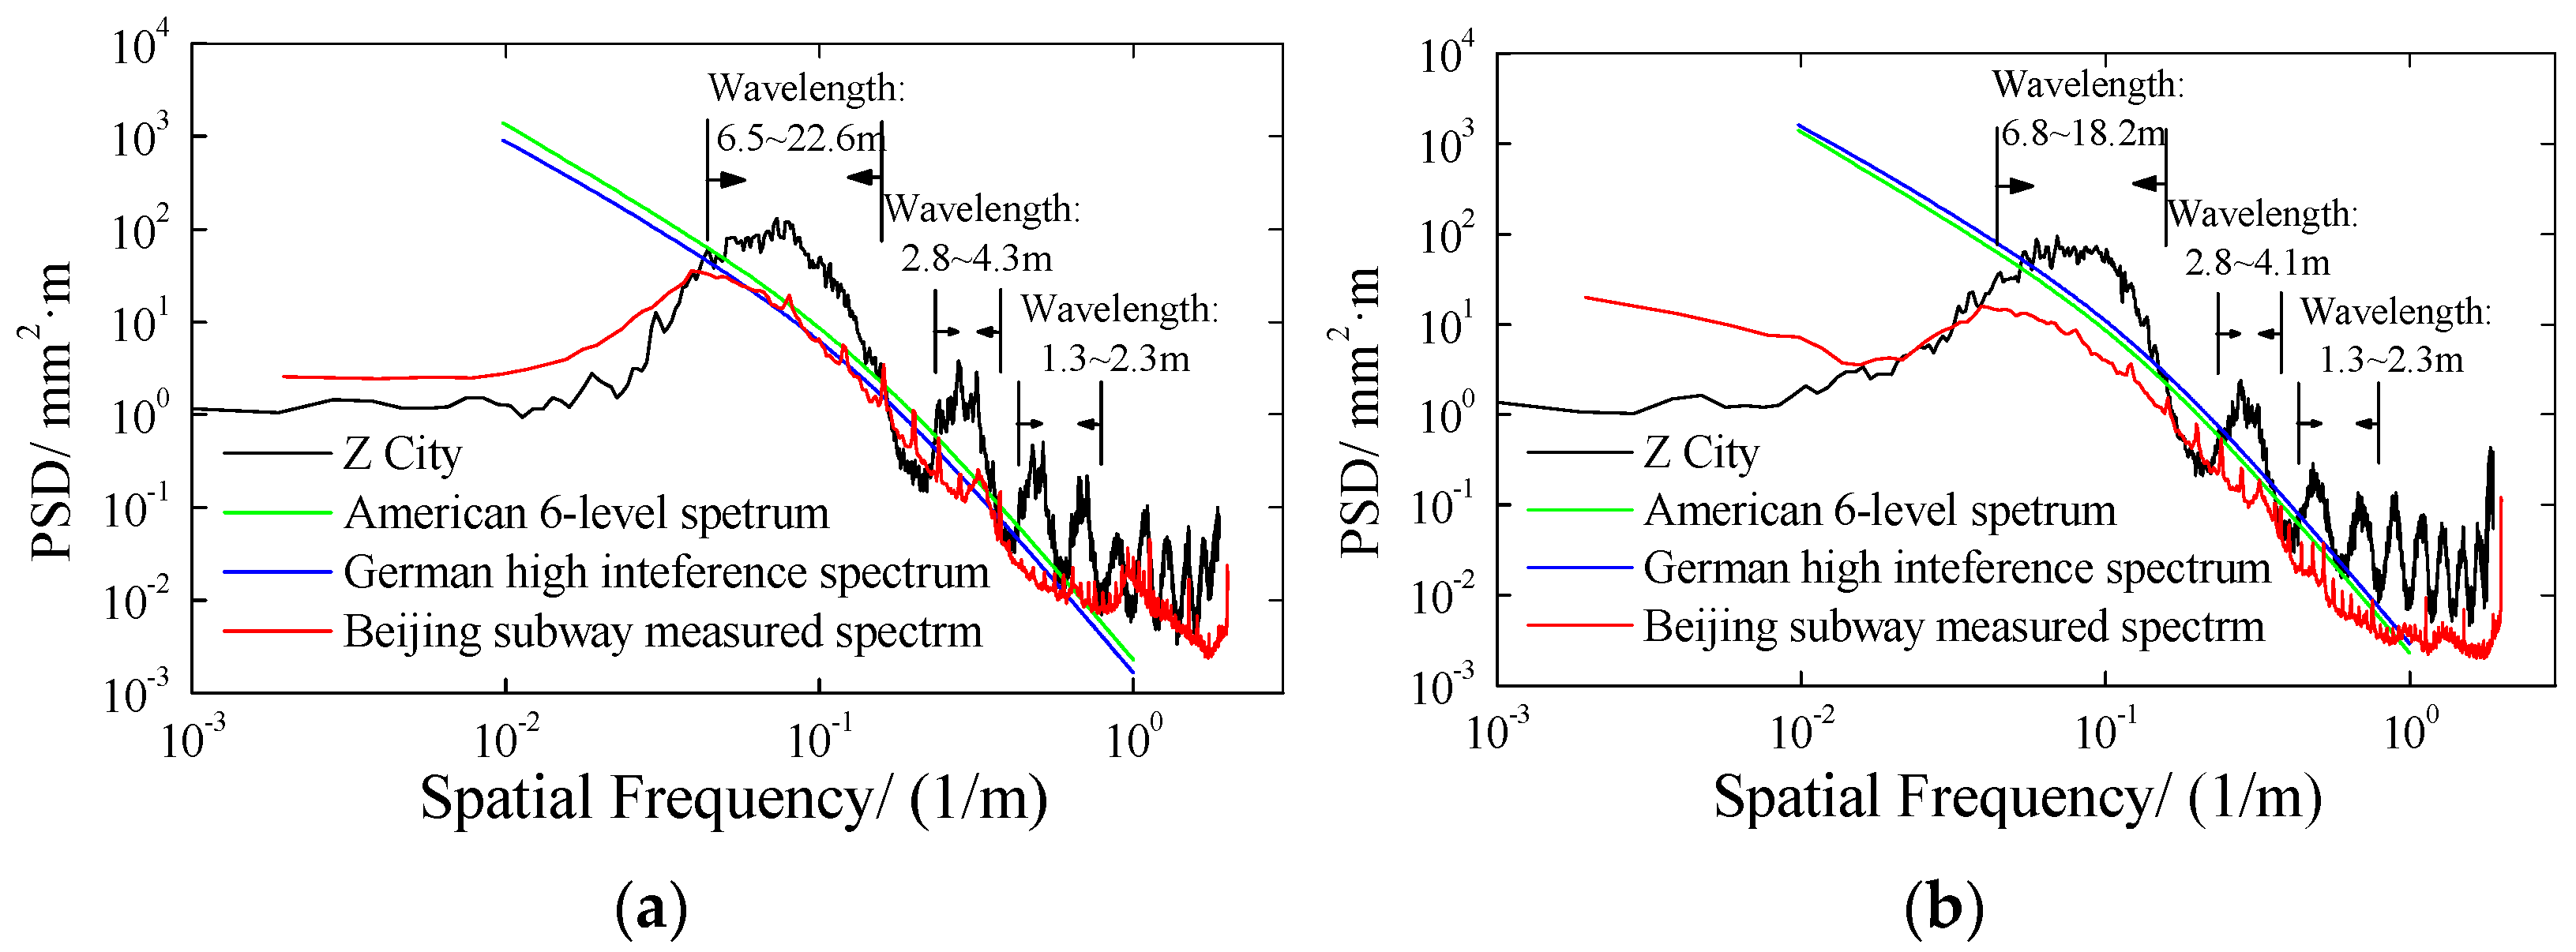
The track irregularity spectrum of Metro Line 1 in Z City is compared with other typical irregularity spectra, as shown in Figure 3, including the American 6-level spectrum [24], German high-interference spectrum [25], and the measured irregularity spectrum of the Beijing subway.
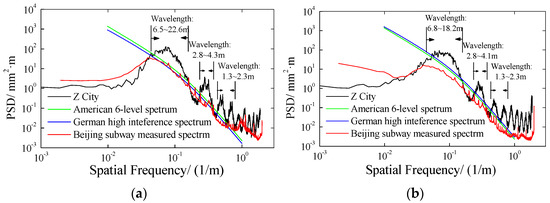
Figure 3.
Comparison of track irregularity spectra: (a) the comparison of the PSD of the level irregularity; (b) the comparison of the PSD of the alignment irregularity.
The values of the track irregularity spectrum of Metro Line 1 in Z City are significantly higher than others, indicating that the overall track smoothness is poor. The positions where the larger spectral values exist are mainly the broadband peaks, which are also the reason for the deterioration in the smoothness of Metro Line 1 in Z City.
Taking the measured irregularity spectrum of the Beijing subway as the comparison target, the deterioration wavelength range can be obtained: 6.5~18 m, 2.8~4 m, and 1.7~2.5 m. These medium- and long-wavelength irregularities may have a greater impact on vehicle vibration, leading to the vibration and wear increase of the pantograph. To verify the influence and determine the influencing degree of these abnormal irregularities, this manuscript establishes a pantograph–vehicle–track coupled dynamic model to study the influence of the measured irregularities on the vibration of vehicle and pantograph.
3. Establishment and Validation of the Analysis Model
3.1. Numerical Model
The vehicles operating on Z City Metro line 1 are metro type B vehicles with a maximum running speed of 80 km/h, designed by CRRC Zhuzhou Locomotive CO., Ltd. (Zhuzhou, China). A two-stage suspension system is used in the vehicle, in which the rotating-arm positioning measure is used in the wheelset, and the rotating arm and the double springs form the primary suspension system, which provides the vertical stiffness and the longitudinal and lateral stiffness required to ensure the running stability of the vehicle. In addition, the primary suspension also includes vertical hydraulic dampers to absorb the vertical vibration. The secondary suspension is mainly composed of air springs, lateral hydraulic dampers, vertical hydraulic dampers, etc. Moreover, in order to control the rolling motion of the car body, an anti-roll torsion bar is also installed between the car body and the bogie.
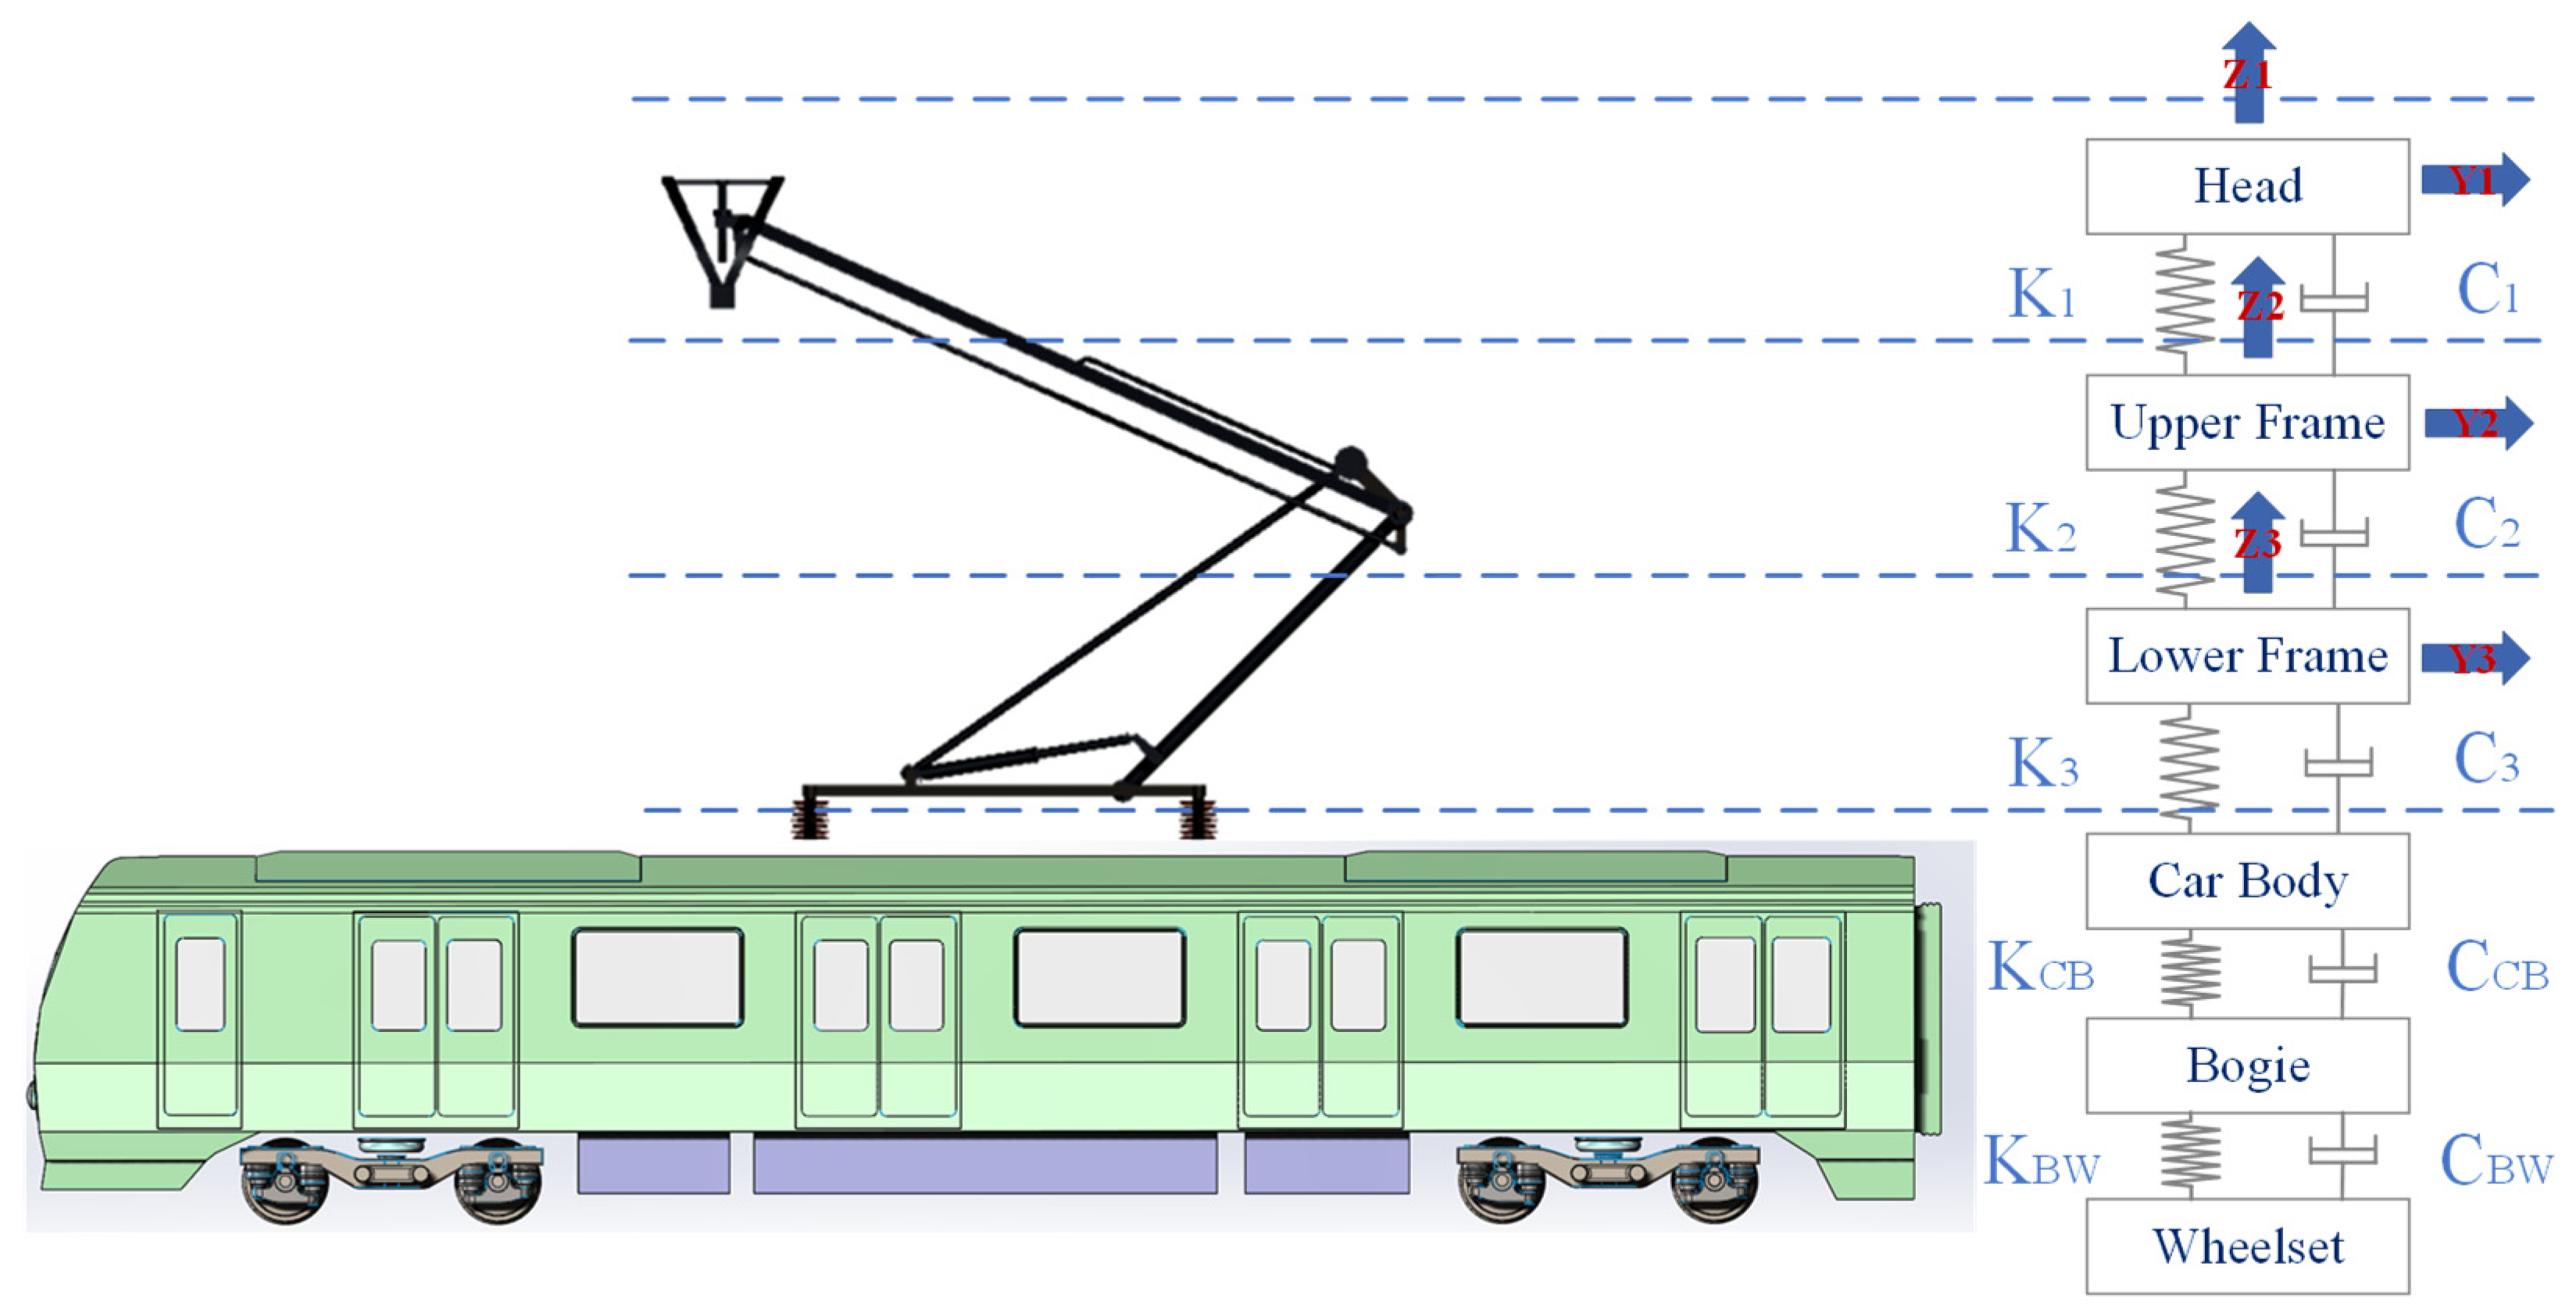
Based on the structural parameters of the B-type metro vehicle and the bogie ZMC080, a vehicle dynamic model is established by using the multibody dynamics method (shown in Figure 4). The pantograph strip, upper frame, lower frame, car body, bogie, and wheelset are included in the model, connected by spring-damping systems. This manuscript focuses on the lateral and vertical vibrations of the pantograph, so the lateral and vertical degrees of freedom are considered. The car body, bogie, and wheelset are rigid bodies with 6 degrees of freedom [26]. The wheelset and the bogie are connected by the primary suspension, and the bogie and the vehicle body are connected by the secondary suspension. The vehicle dynamics model expression is as follows:
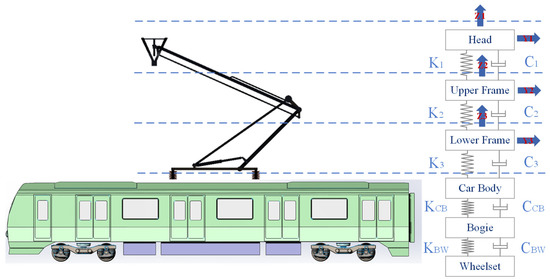
Figure 4.
Vehicle dynamic model.
The mass matrix can be expressed as:
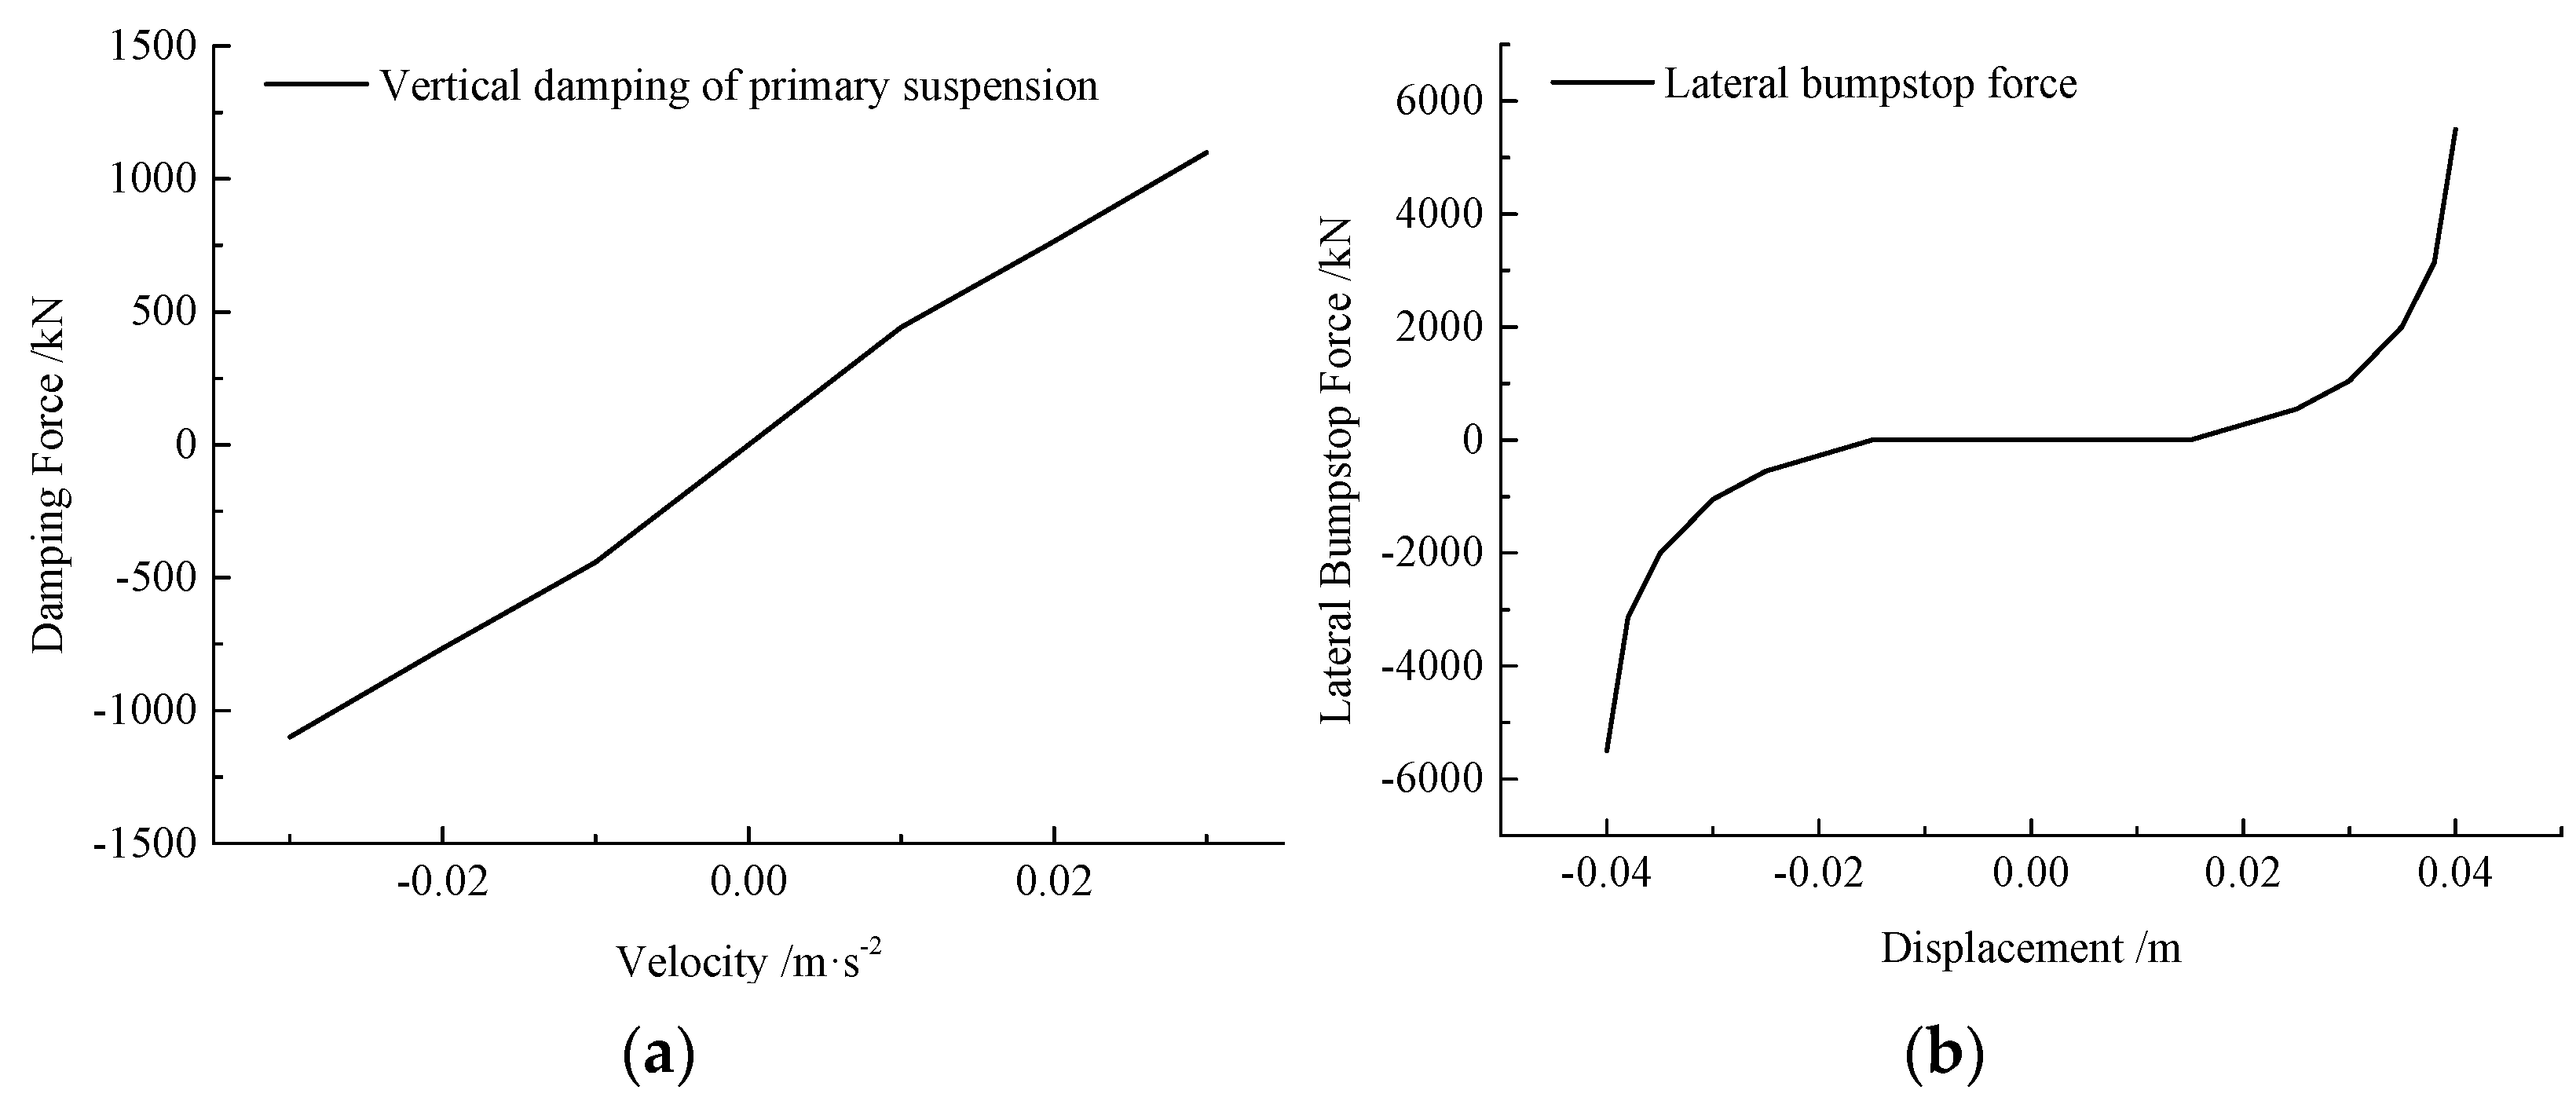
The components of the vehicle are connected by a two-stage suspension system containing springs and dampers. The nonlinear behavior of the lateral stops and lateral vibration absorber is considered. In the manuscript, the nonlinear characteristic curves of the primary vertical damping and secondary lateral damping of the vehicle are given in Figure 5. The stiffness and damping matrices can be expressed as:
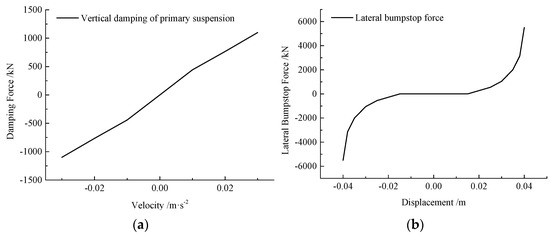
Figure 5.
Nonlinear characteristics of the vehicle suspension system. (a) Nonlinear characteristics of the primary vertical dampers; (b) Nonlinear characteristics of the secondary lateral bumpstop foce.
The subscripts P, C, B, and W in Equation (2) represent the pantograph, the car body, the bogie frame, and the wheelset, respectively. Some parameters are shown in Table 1.

Table 1.
Model parameters of the type B metro vehicle operating on Z City Metro Line 1.
In terms of the wheel–rail contact part, the Hertzian contact algorithm is used to calculate the wheel–rail interaction point and force [27]. The polygonal contact model (PCM) is used to calculate the PC interaction [14].
3.2. Model Validation
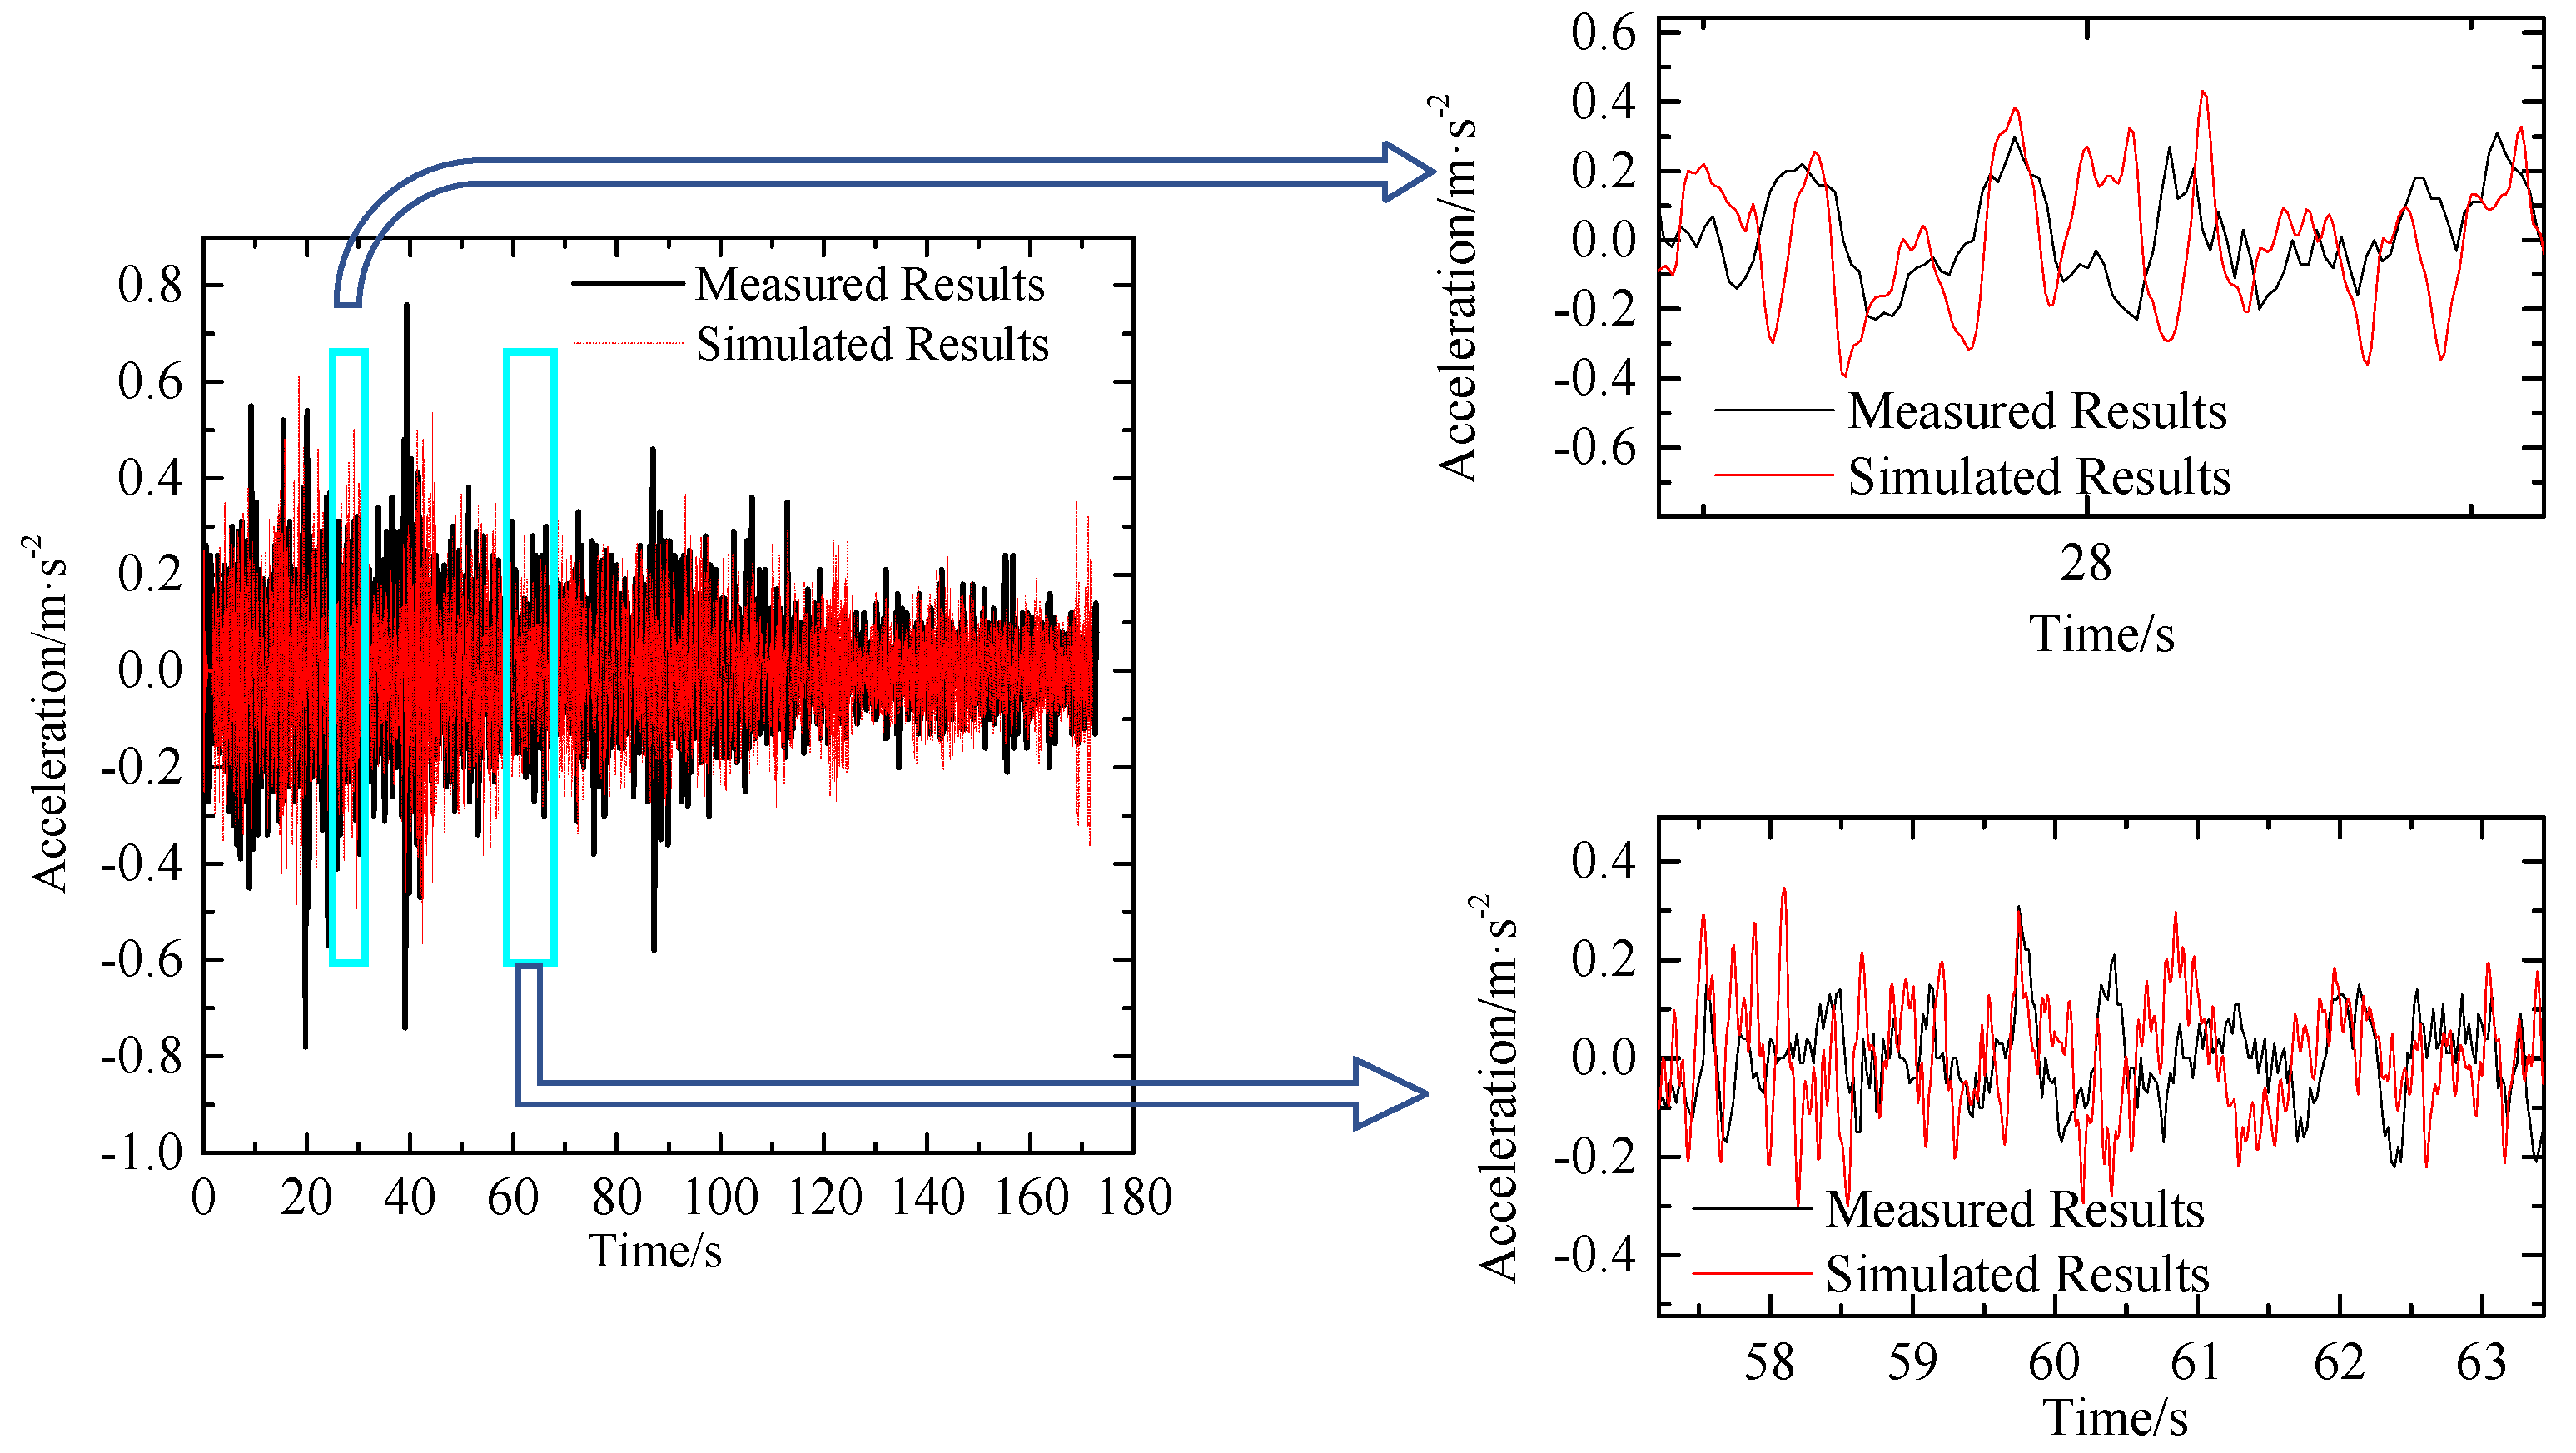
First, to verify the accuracy of the vehicle dynamics model, the track irregularity measured by the inspection vehicle and the actual operating speed were used for simulation calculation. The vertical acceleration of the car body was extracted and compared with the vibration acceleration of the inspection vehicle, as shown in Figure 6.
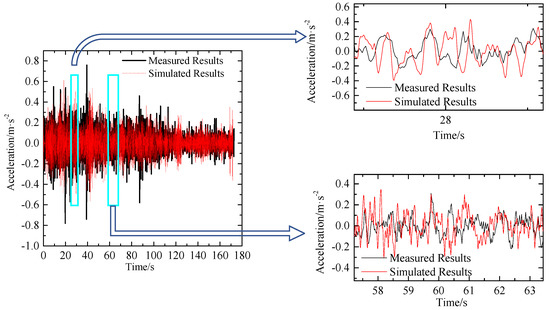
Figure 6.
Validation of the vehicle dynamics model.
As can be seen from Figure 6, the car body acceleration obtained by the simulation is in good agreement with the measured acceleration of the inspection car, and both are in the range of −0.6~0.6 m/s2. It can also be seen from the detailed diagram that the simulated results are consistent with the measured result in the trend and the values of the curve, which indicates that the vehicle dynamics model established in the manuscript is reliable.
Secondly, to verify the accuracy of the model in the calculation of the PC contact, the contact forces during the operation of the vehicle were extracted, as shown in Figure 7. It can be observed that the contact normal forces are basically around 100 N, and the maximum value is around 200 N. The statistical analysis was carried out, and the results were compared with the on-site test data, as shown in Table 2.
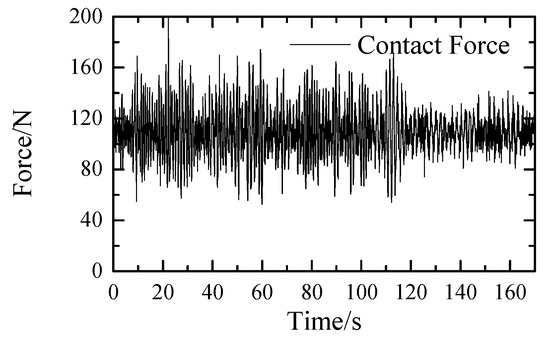
Figure 7.
PC contact force.
Table 2.
PC contact force validation [28].
It can be observed from Table 2 that the model established in the manuscript is close to the field test results. The deviation is basically within 5%, especially in the average, standard deviation, and maximum contact force of PC.
The model validation part shows that the pantograph–vehicle–track coupling dynamics model established in the manuscript has high accuracy in the calculation of vehicle dynamics and PC contact, which can provide a basis for subsequent theoretical calculations and analysis.
In summary, the track–vehicle–pantograph–catenary contact dynamics model was established based on the wheel–rail, vehicle, and pantograph–catenary parameters of the actual vehicle running on Z City Metro Line 1. The nonlinear characteristics of the suspension system were fully considered in the model, and the measured data of the line were used for verification, which can accurately reflect the relationship between the track irregularity, vehicle response, and pantograph–catenary interaction.
4. Result and Analysis
To determine the reason for the fast wear of the pantograph strip, the relationship between the measured track irregularity and the PC contact is studied in this section. A section of field-measured track irregularity (K3.53~K5.29) with a large amplitude was selected as the excitation input, and the average speed of 42 km/h and a higher speed of 53 km/h were selected as the model running speed. The reflection of the track irregularity periodic characteristics on the vehicle system from the perspective of the vibration responses is analyzed in Section 4.1. The contact force of the PC is analyzed in Section 4.2 to determine its relationship with the track irregularity. The comparison of the track irregularity spectrum of Z City and the Beijing Metro, as well as PC contact force, is carried out in Section 4.3, to determine the influence of the abnormal track irregularity on PC contact.
4.1. Vibration Responses of the Vehicle System
The vibration responses of the vehicle system and the pantograph are extracted, and the vibration transfer characteristics are analyzed from the frequency domain.
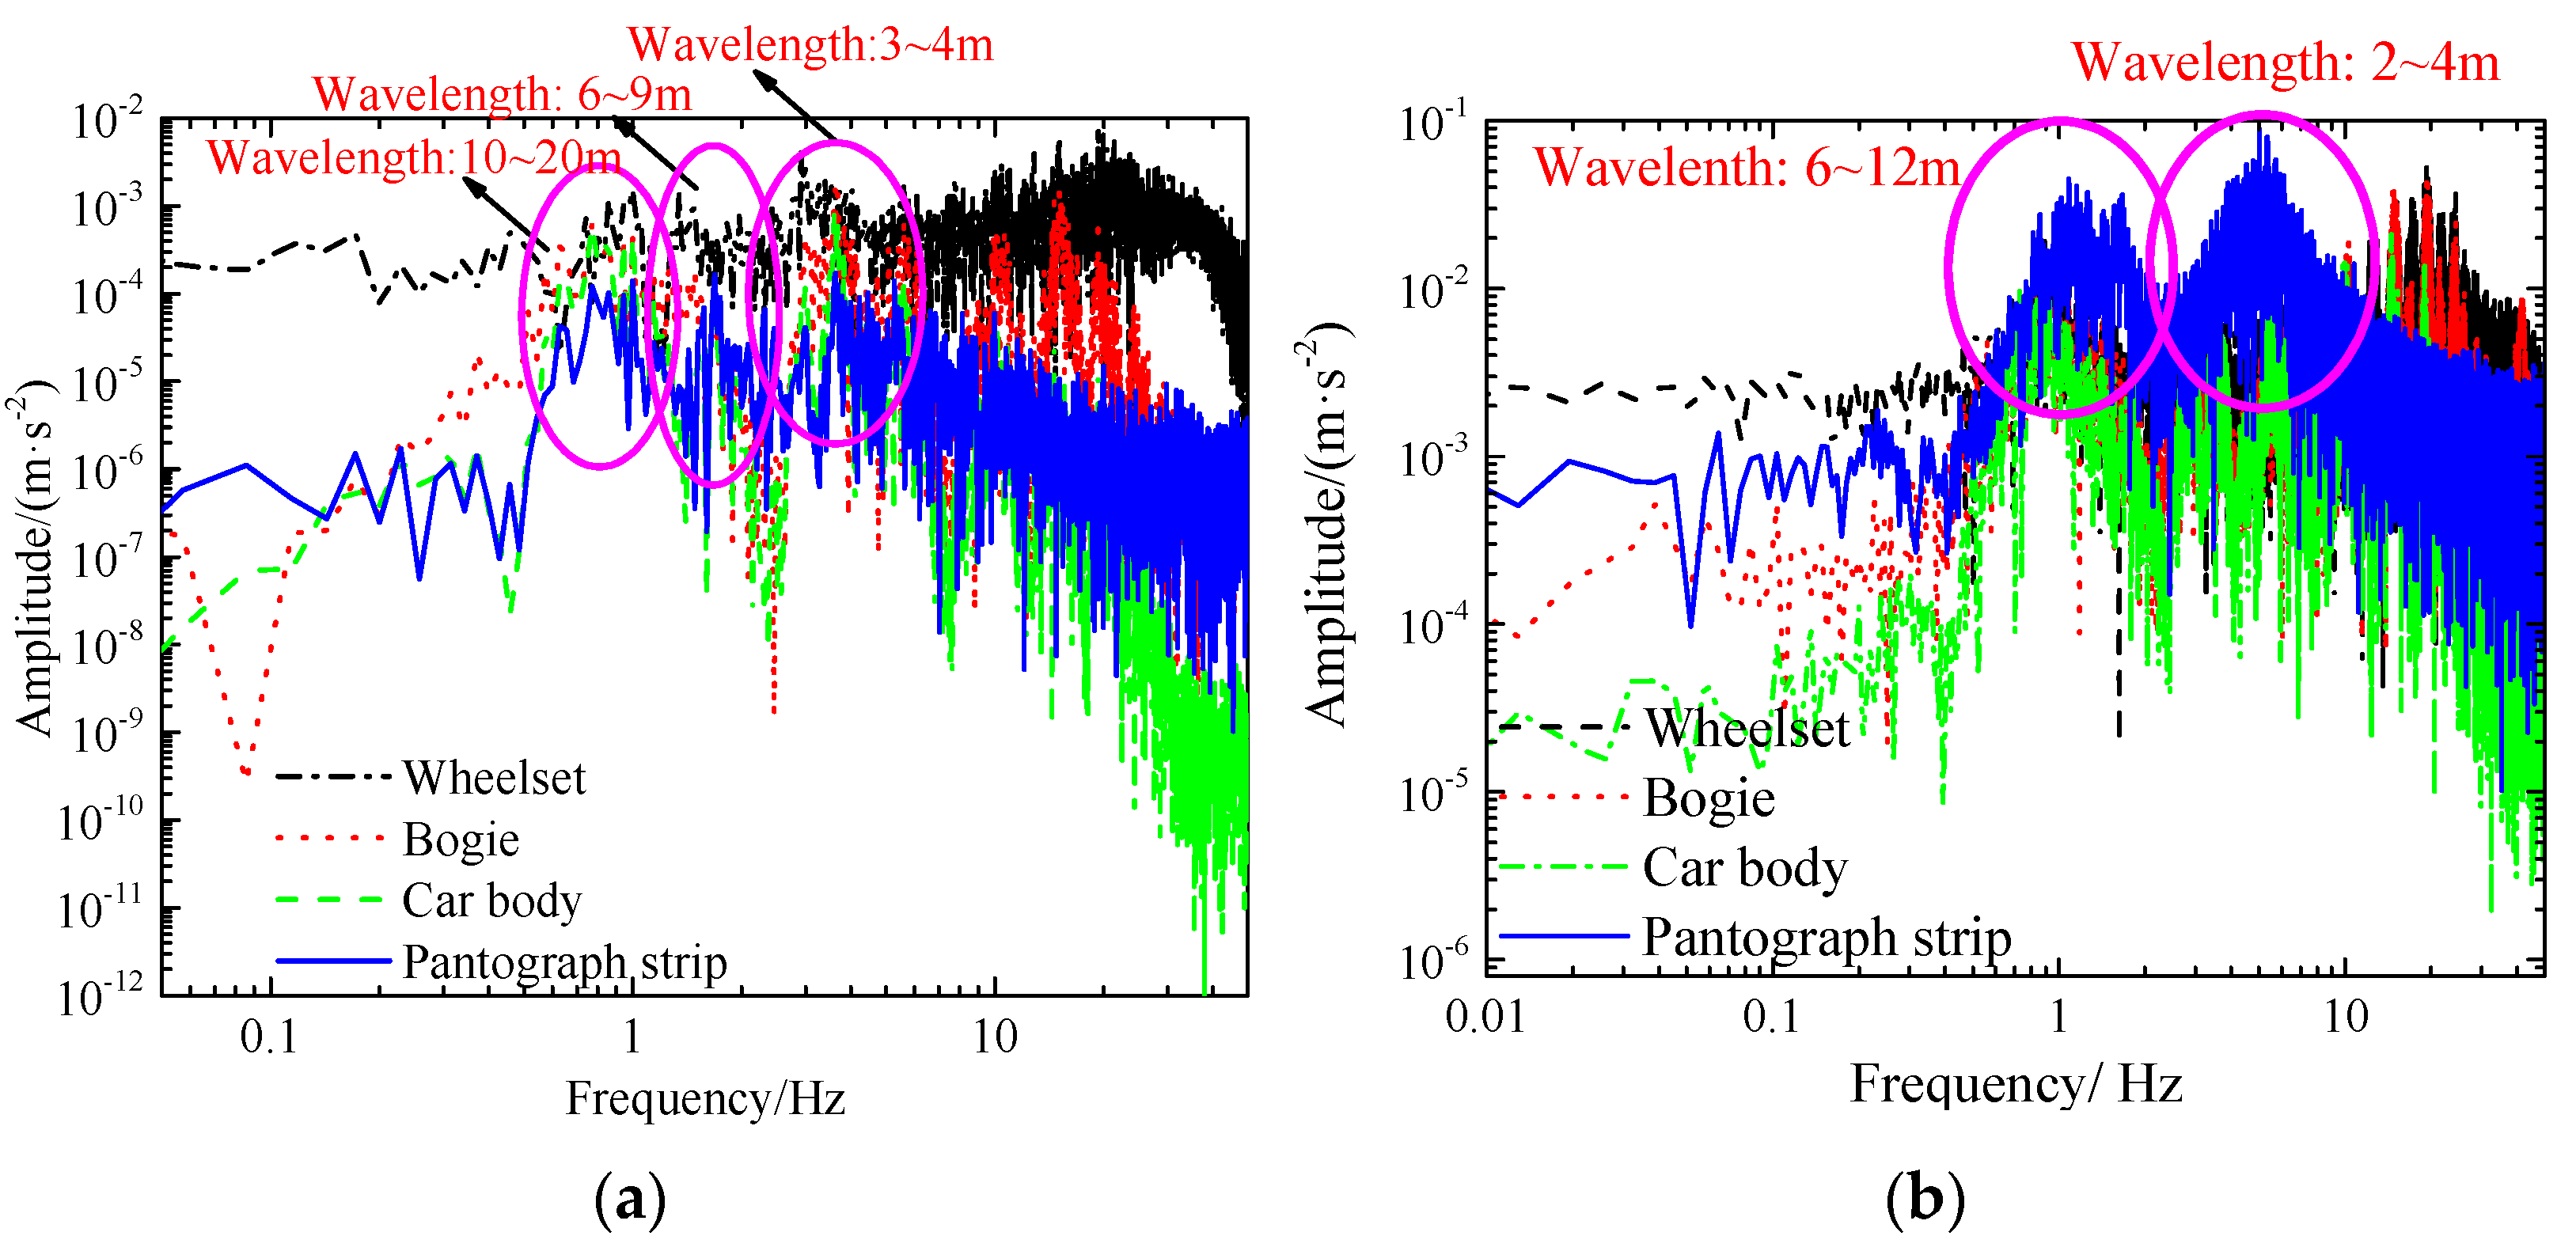
Comparing the vertical vibration amplitude–frequency responses of the wheelset, bogie, car body, and the pantograph strip (shown as Figure 8a), it can be seen that there are three typical peak values, which are around 0.96 Hz, 1.6 Hz, and 4 Hz, respectively. The wavelength range corresponding to the first peak is 10~20 m. The vibration energy is the largest, and the transmission attenuation from the wheelset to the pantograph is small. The wavelength ranges corresponding to the second and the third peaks are 6~9 m and 3~4 m, respectively. In these two ranges, the attenuation of vertical vibration gradually increases, but the pantograph still has large peak values. Moreover, at higher frequency ranges, although there is larger vibration in the wheelset and bogie, the car body and the pantograph are not affected. The results show that through the energy dissipation of the primary and secondary suspension systems, vibration higher than 5 Hz (corresponding to the wavelength of 2 m) can be significantly attenuated, but the vibrations with the wavelengths of 10~20 m, 6~9 m, and 3~4 m are still prominent in the pantograph. According to Figure 8b, it can be seen that there are two peaks whose wavelengths are 6~12 m and 2~4 m, respectively, in the lateral vibration of the pantograph, corresponding to the first and the third peak of the vertical vibration.

Figure 8.
Vibration responses of the vehicle system at 42 km/h: (a) vertical responses; (b) lateral responses.
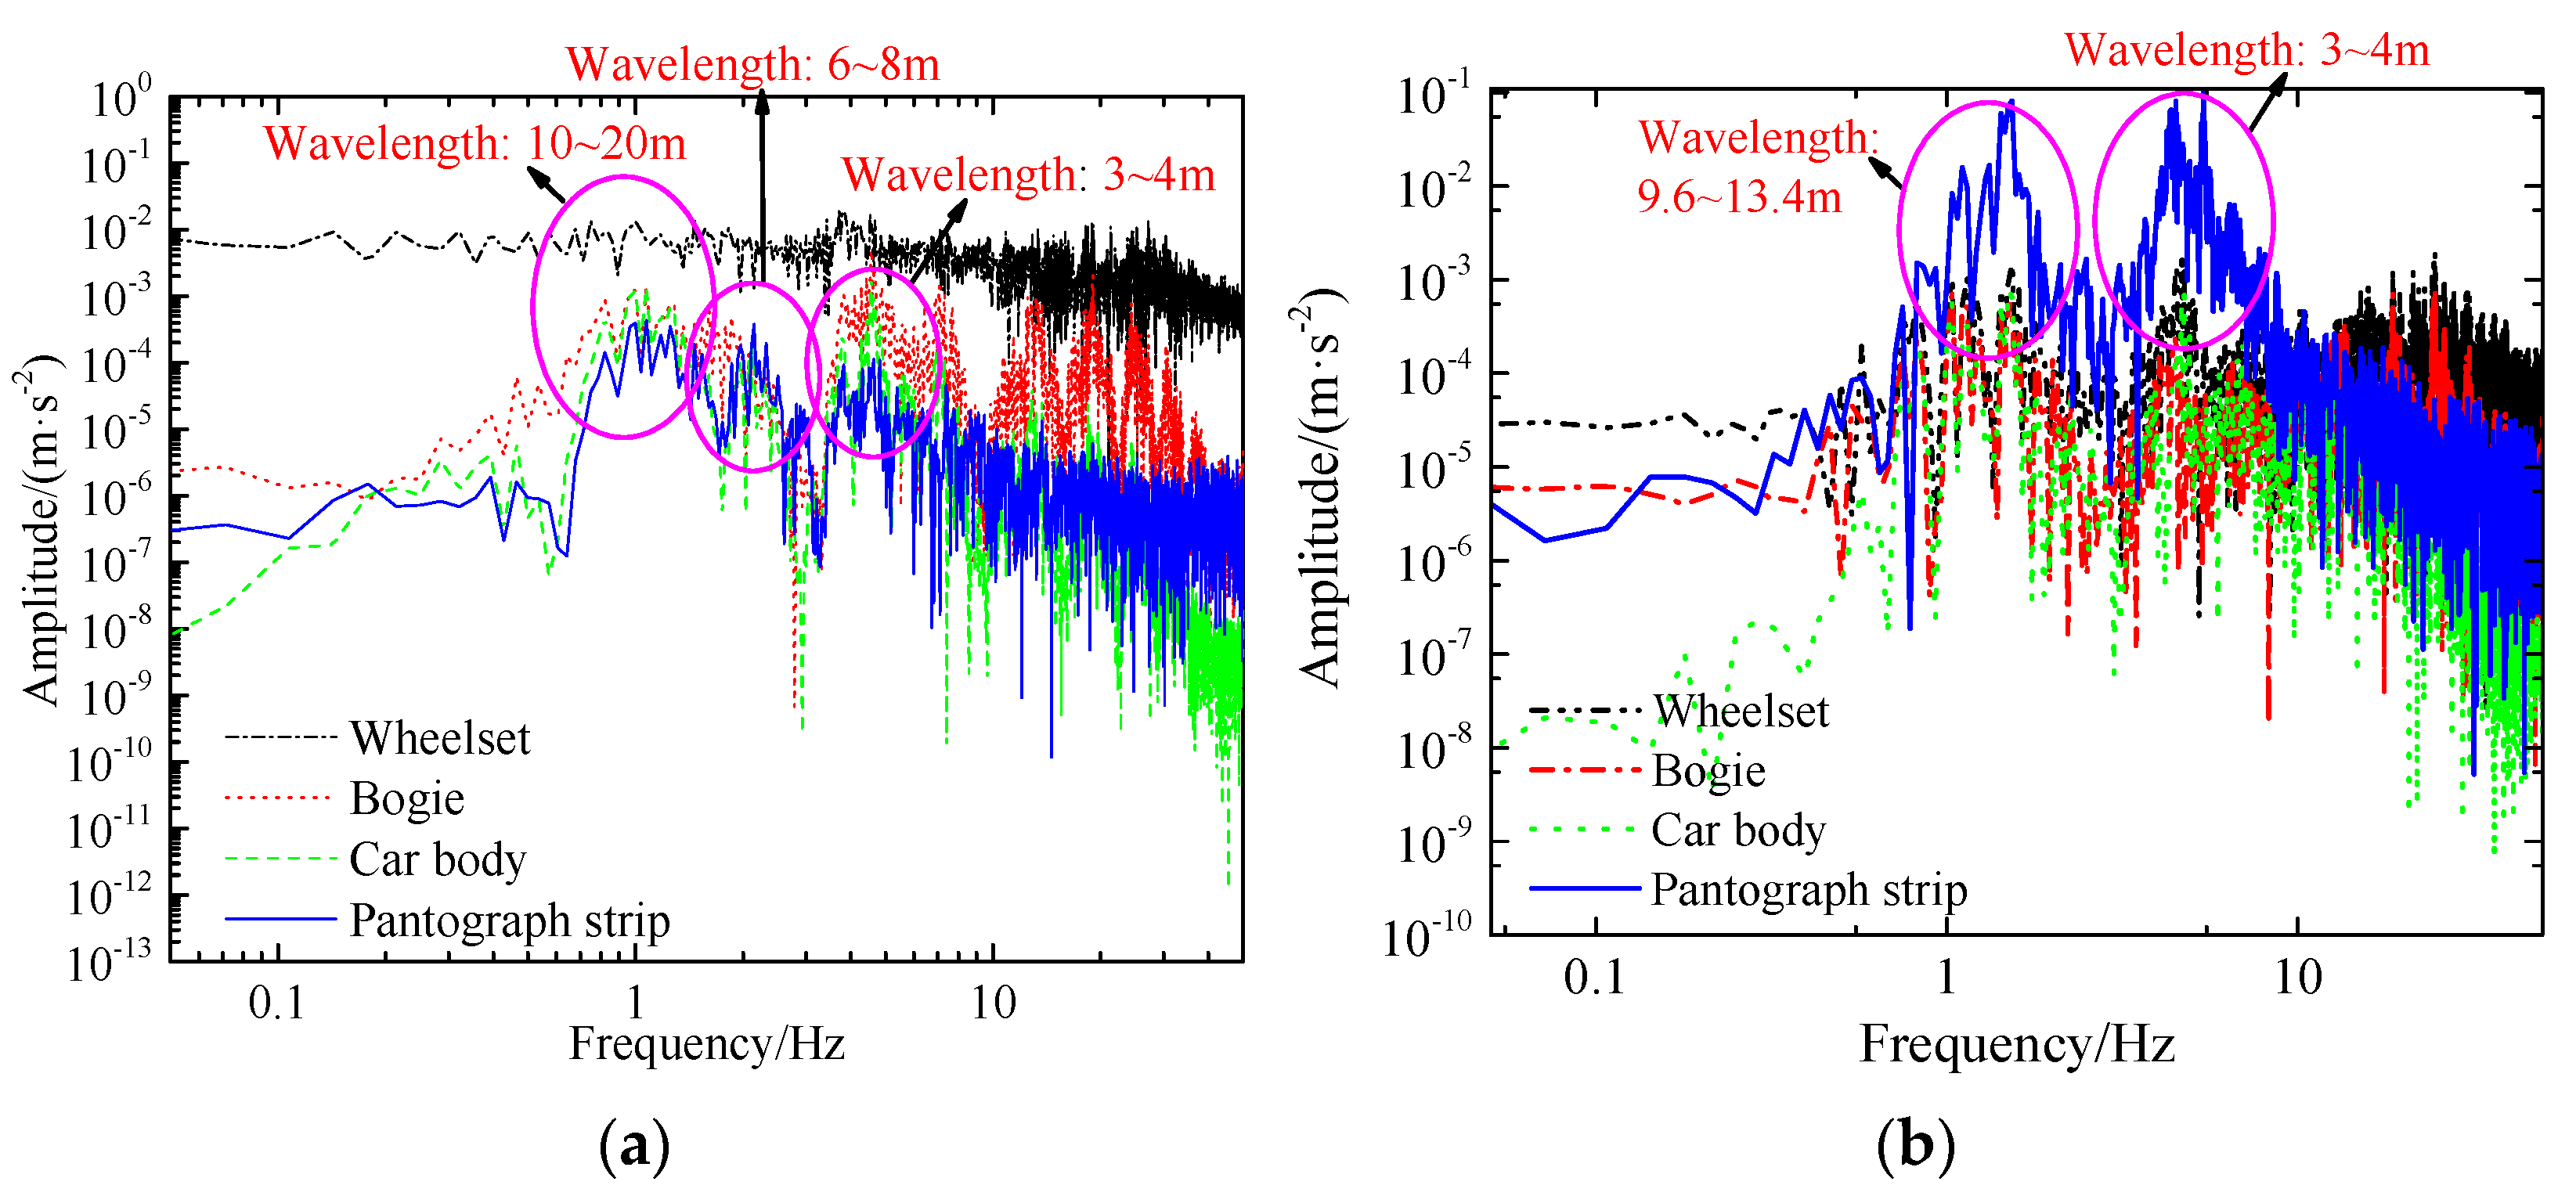
The dynamic responses when the vehicle runs at 53 km/h were extracted, as shown in Figure 9.
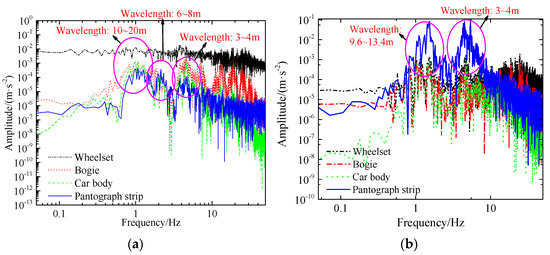
Figure 9.
Vibration responses of the vehicle system at 53 km/h: (a) vertical responses; (b) lateral responses.
It can be seen that with the increase in the operating speed, the dynamic responses of the vehicle system increase, and the peak frequency of the vibration also increases. However, for vertical vibration, the wavelengths corresponding to the vibration peaks of the pantograph are still 10~20 m, 6~8 m, and 3~4 m, respectively, which are exactly the same as those at 42 km/h. In terms of lateral vibration, it can be seen that the vibration of the pantograph has increased significantly, and the peaks are concentrated in the two frequency ranges of 9.6~13.4 m and 3~4 m.
According to the measured track geometry irregularity, it can be inferred that its two broadband peaks at 10~20 m and 3~4 m have a great influence on the vibration of the vehicle system, especially the pantograph strip.
4.2. PC Contact Forces
The PC normal force and lateral friction force at speeds of 42 km/h and 53 km/h were extracted and transferred to the frequency domain. The results are shown in Figure 10.
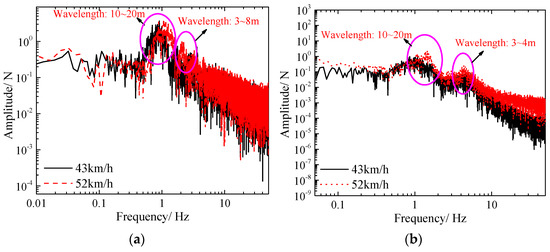
Figure 10.
PC contact force under two speeds: (a) normal force; (b) friction force.
It can be observed from Figure 10 that there are two peaks on the amplitude–frequency curves of PC contact forces. When the operating speed increases, the amplitude of contact forces increases significantly in the entire frequency domain, and the peak frequencies also increase, but the corresponding vibration wavelengths remain unchanged. Among them, the main peaks of the normal force and lateral friction force are located in the wavelength range of 10~20 m. The secondary peak of the normal force is relatively wide, and the corresponding vibration wavelength range is 3~8 m, while that of the lateral friction force corresponds to a narrow vibration wavelength of 3~4 m.
For the normal force, the two peaks correspond exactly to the three main peaks in the measured track irregularity spectrum. For the lateral friction force, the two peaks correspond to the first and the third peaks in the measured track irregularity spectrum. The results show that the multiple broadband spectral peaks existing in the track irregularity of Metro Line 1 in Z City not only aggravate the vibration of the vehicle but also increase the vibration and the friction of the pantograph.
4.3. Comparison with the Measured Irregularity of Beijing Metro
The influences of the measured irregularity on Metro Line 1 in Z City were analyzed in Section 4.1 and Section 4.2, and two broadband peaks in the irregularity spectrum are preliminarily associated with the serious wear of the pantograph strip. In this part, to more accurately determine the relationship between the large vibration and rapid wear of the pantograph strip of Z City Metro Line 1 and its track irregularity, the measured irregularity of the Beijing Metro is compared. The comparison of the track irregularity spectrum of the two lines is shown in Figure 11 and the PC contact normal force and the friction work are shown in Figure 12.
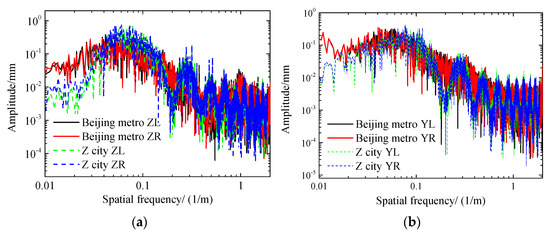
Figure 11.
Comparison of the measured irregularity in Z City Metro and Beijing Metro: (a) vertical irregularity; (b) lateral irregularity.
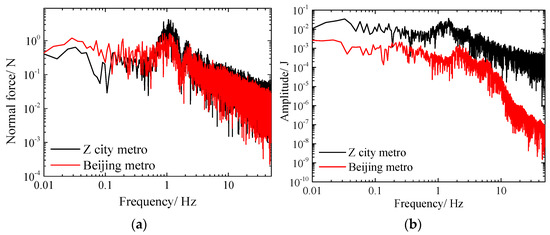
Figure 12.
Comparison of the PC contact: (a) normal force; (b) frictional work.
Due to the short operation time of Z City Metro Line 1, its long-wave irregularity (with a wavelength longer than 20 m) is significantly lower than that of the Beijing Metro. The amplitude of the level irregularity is higher in the wavelengths of 10~20 m and 3~4 m. Dynamic calculation results show that below 0.8 Hz, the PC contact force of the Z City Metro is smaller, but at the peak around 1 Hz, it is larger than that of the Beijing Metro. In terms of friction work, the PC friction work of Z City Metro Line 1 is much larger than that of the Beijing Metro in the whole frequency band.
These results and comparisons further confirm that there is an inevitable relationship between the large vibration and rapid wear of the pantograph strip in the Z City Metro and the excessive amplitude of the track irregularity with the two wavelengths.
5. Optimization Suggestions
Based on the above calculation and analysis, there are many broadband spectral peaks in the track irregularity of Metro Line 1 in Z City. However, the short-wave irregularity cannot lead to the abnormal vibration and the contact force of PC, so it can be considered that these abnormal vibrations and forces are related to the medium- and long-wavelength irregularity. After a comprehensive analysis, it can be considered that the track irregularity with wavelengths of 2~4 m and 9~16 m plays an important role. Especially for Z City Metro Line 1, the amplitude of the irregularities in the two wavelengths is too large compared with other typical metro line irregularity spectra, which aggravates the vehicle vibration and strengthens the PC interaction. Therefore, the target object in the manuscript is whether the PC interaction can be reduced by decreasing the amplitude of the track irregularities in the two wavelength regions.
The irregularity with the wavelength of 2~4 m was mainly caused by the rail straightening operation. The amplitude of the irregularity can be reduced by grinding the rail, replacing the rail, or improving the rail straightening operation technology. The irregularity with the wavelength of 9~16 m may be caused by the rail straightening operation, the welded joint, or the periodic structure irregularity of the base. Irregularities within the wavelength should be determined according to field investigation, and maintenance measures such as rail grinding, replacement with longer rails, and the repair of the periodic settlement of the base and the foundation can be taken.
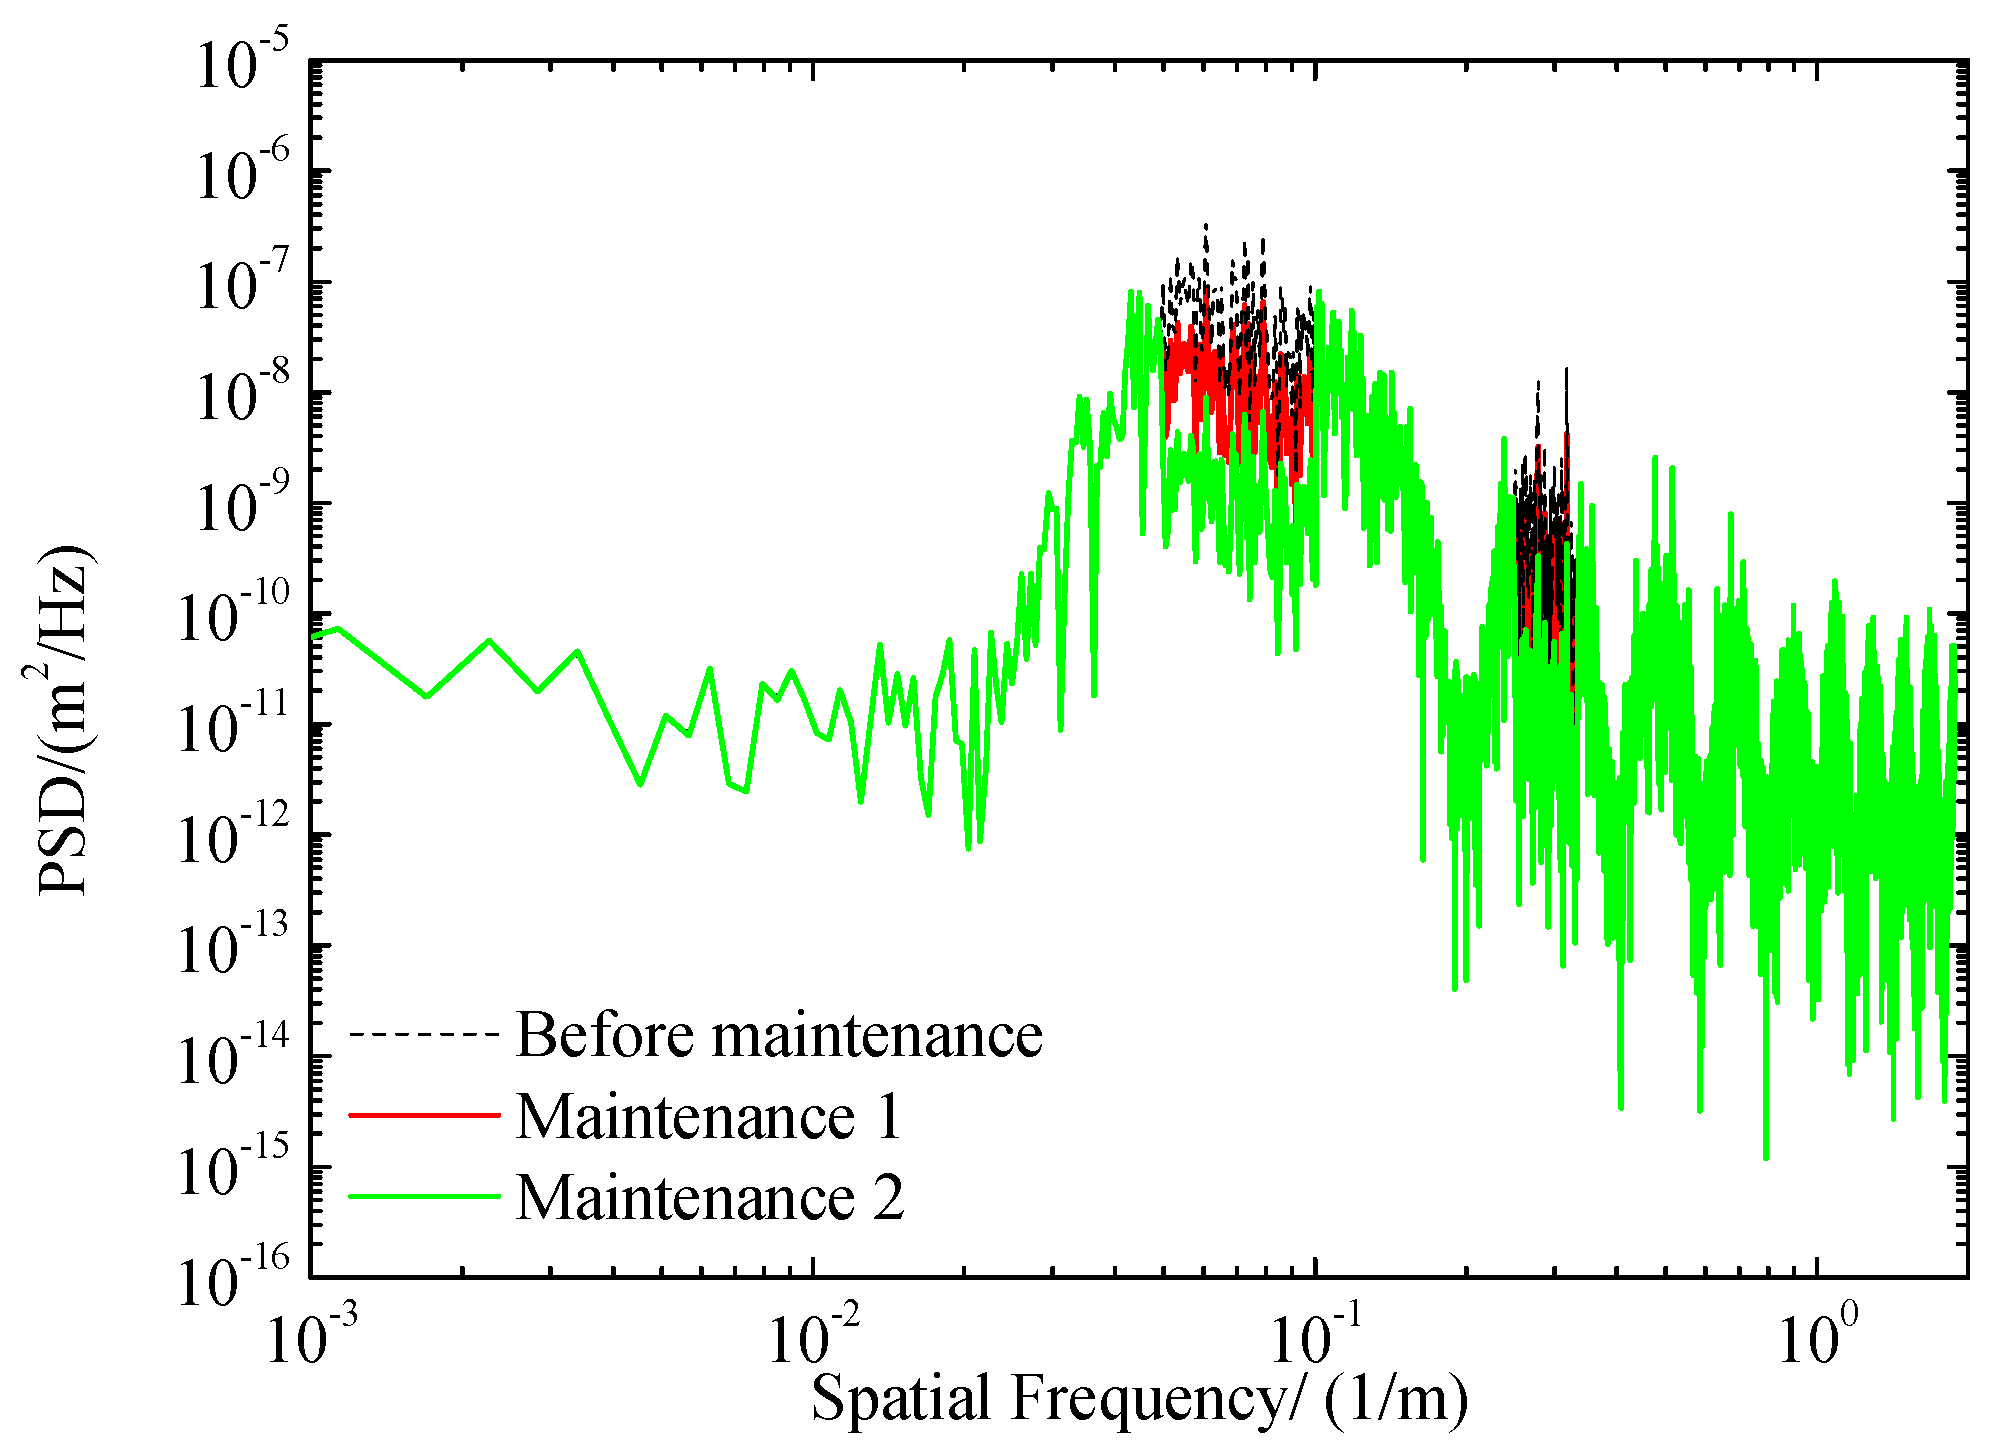
To verify the effectiveness of the above suggestions, the manuscript simulates the on-site maintenance, and the irregularities of the two wavelengths of 2~4 m and 9~16 m are filtered by 30% and 60%, respectively (as shown in Figure 13), and then the dynamic calculation is carried out to verify the reasonableness of the suggestions. Among them, maintenance 1 means that the amplitude of 2~4 m and 9~16 m wavelength irregularities is reduced by 30%, and maintenance 2 means that the amplitude of these two wavelength irregularities is reduced by 60%. The purpose of setting these two calculation conditions is to fully illustrate the effect of reducing the amplitude of the two-wavelength part on controlling the pantograph–catenary interaction.
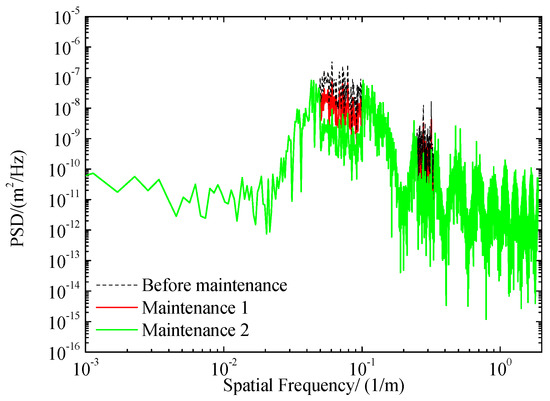
Figure 13.
The two maintenance suggestions.
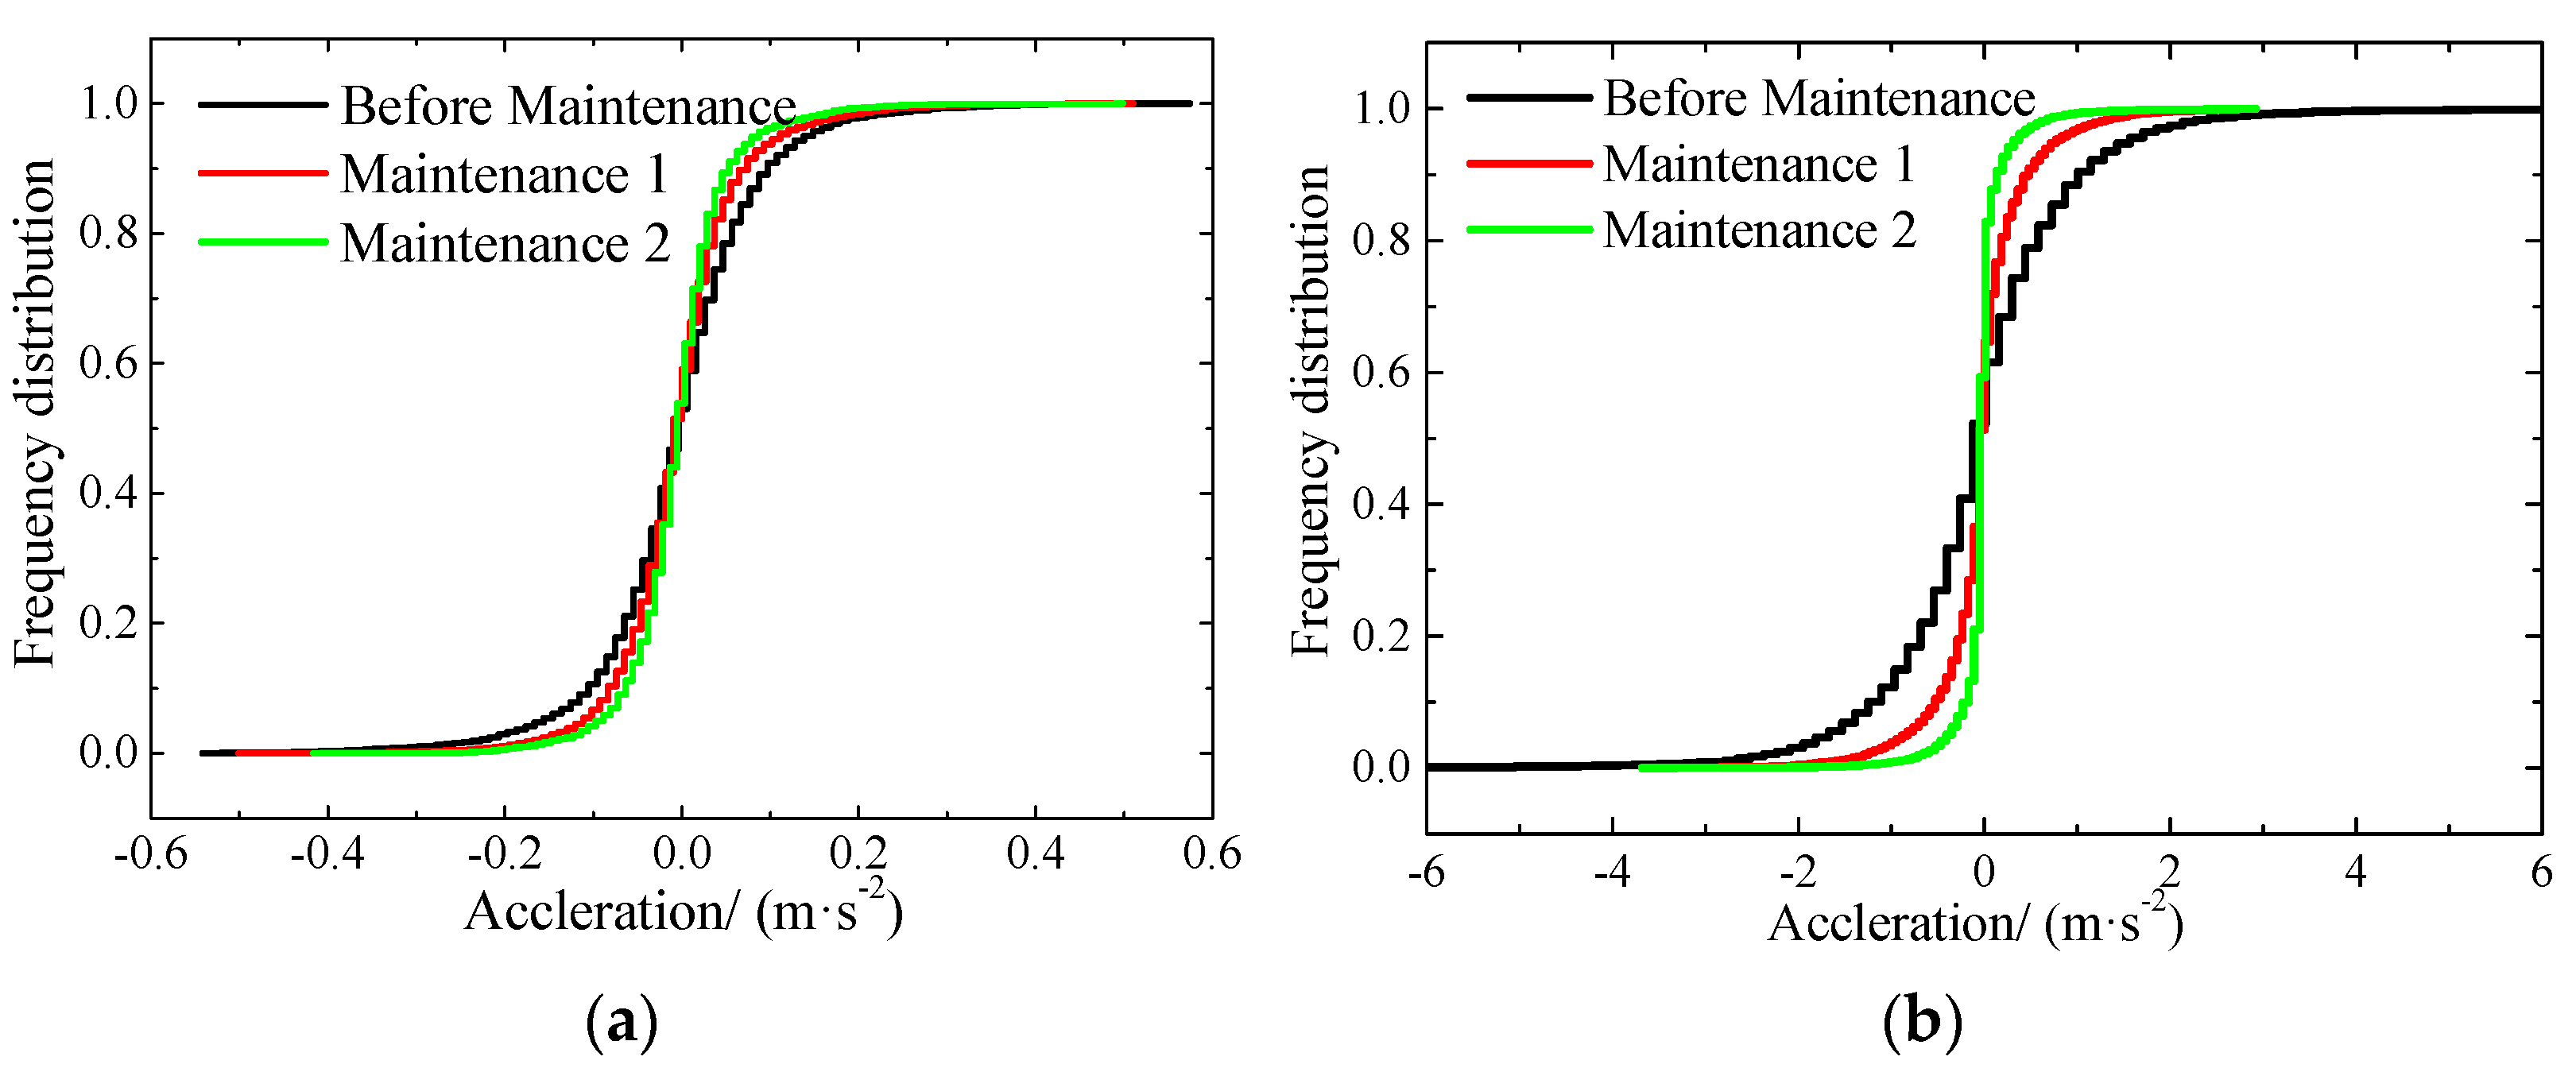
The track irregularity after filtering is substituted into the dynamic model for calculation, and the results are statistically analyzed and compared with the original responses. The vertical and lateral accelerations of the pantograph strip are shown in Figure 14 and the statistical values of the acceleration are shown in Table 3.
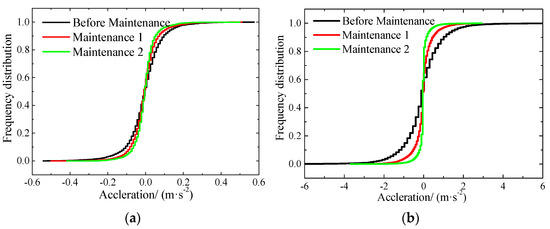
Figure 14.
The effect of the maintenance suggestions (on vibration): (a) vertical vibration; (b) lateral vibration.
Table 3.
Statistical values of the acceleration of pantograph strip.
According to Figure 14, the vibration responses of the pantograph strip are significantly reduced after adopting the suggestions proposed in the manuscript, especially in the lateral vibration, where the overall frequency distribution is closer to the axis x = 0.
It can be calculated from Table 3 that the maximum lateral acceleration of the pantograph strip decreases by approximately 62% and the effective value drops by approximately 50% under the condition of maintenance 1, while the maximum value decreases by approximately 63%, and the effective value drops by approximately 74% under the condition of maintenance 2. The significant reduction in the lateral vibration indicates that it is necessary to control the 9~16 m and 2~4 m wavelength track irregularities in Z City Metro Line 1.
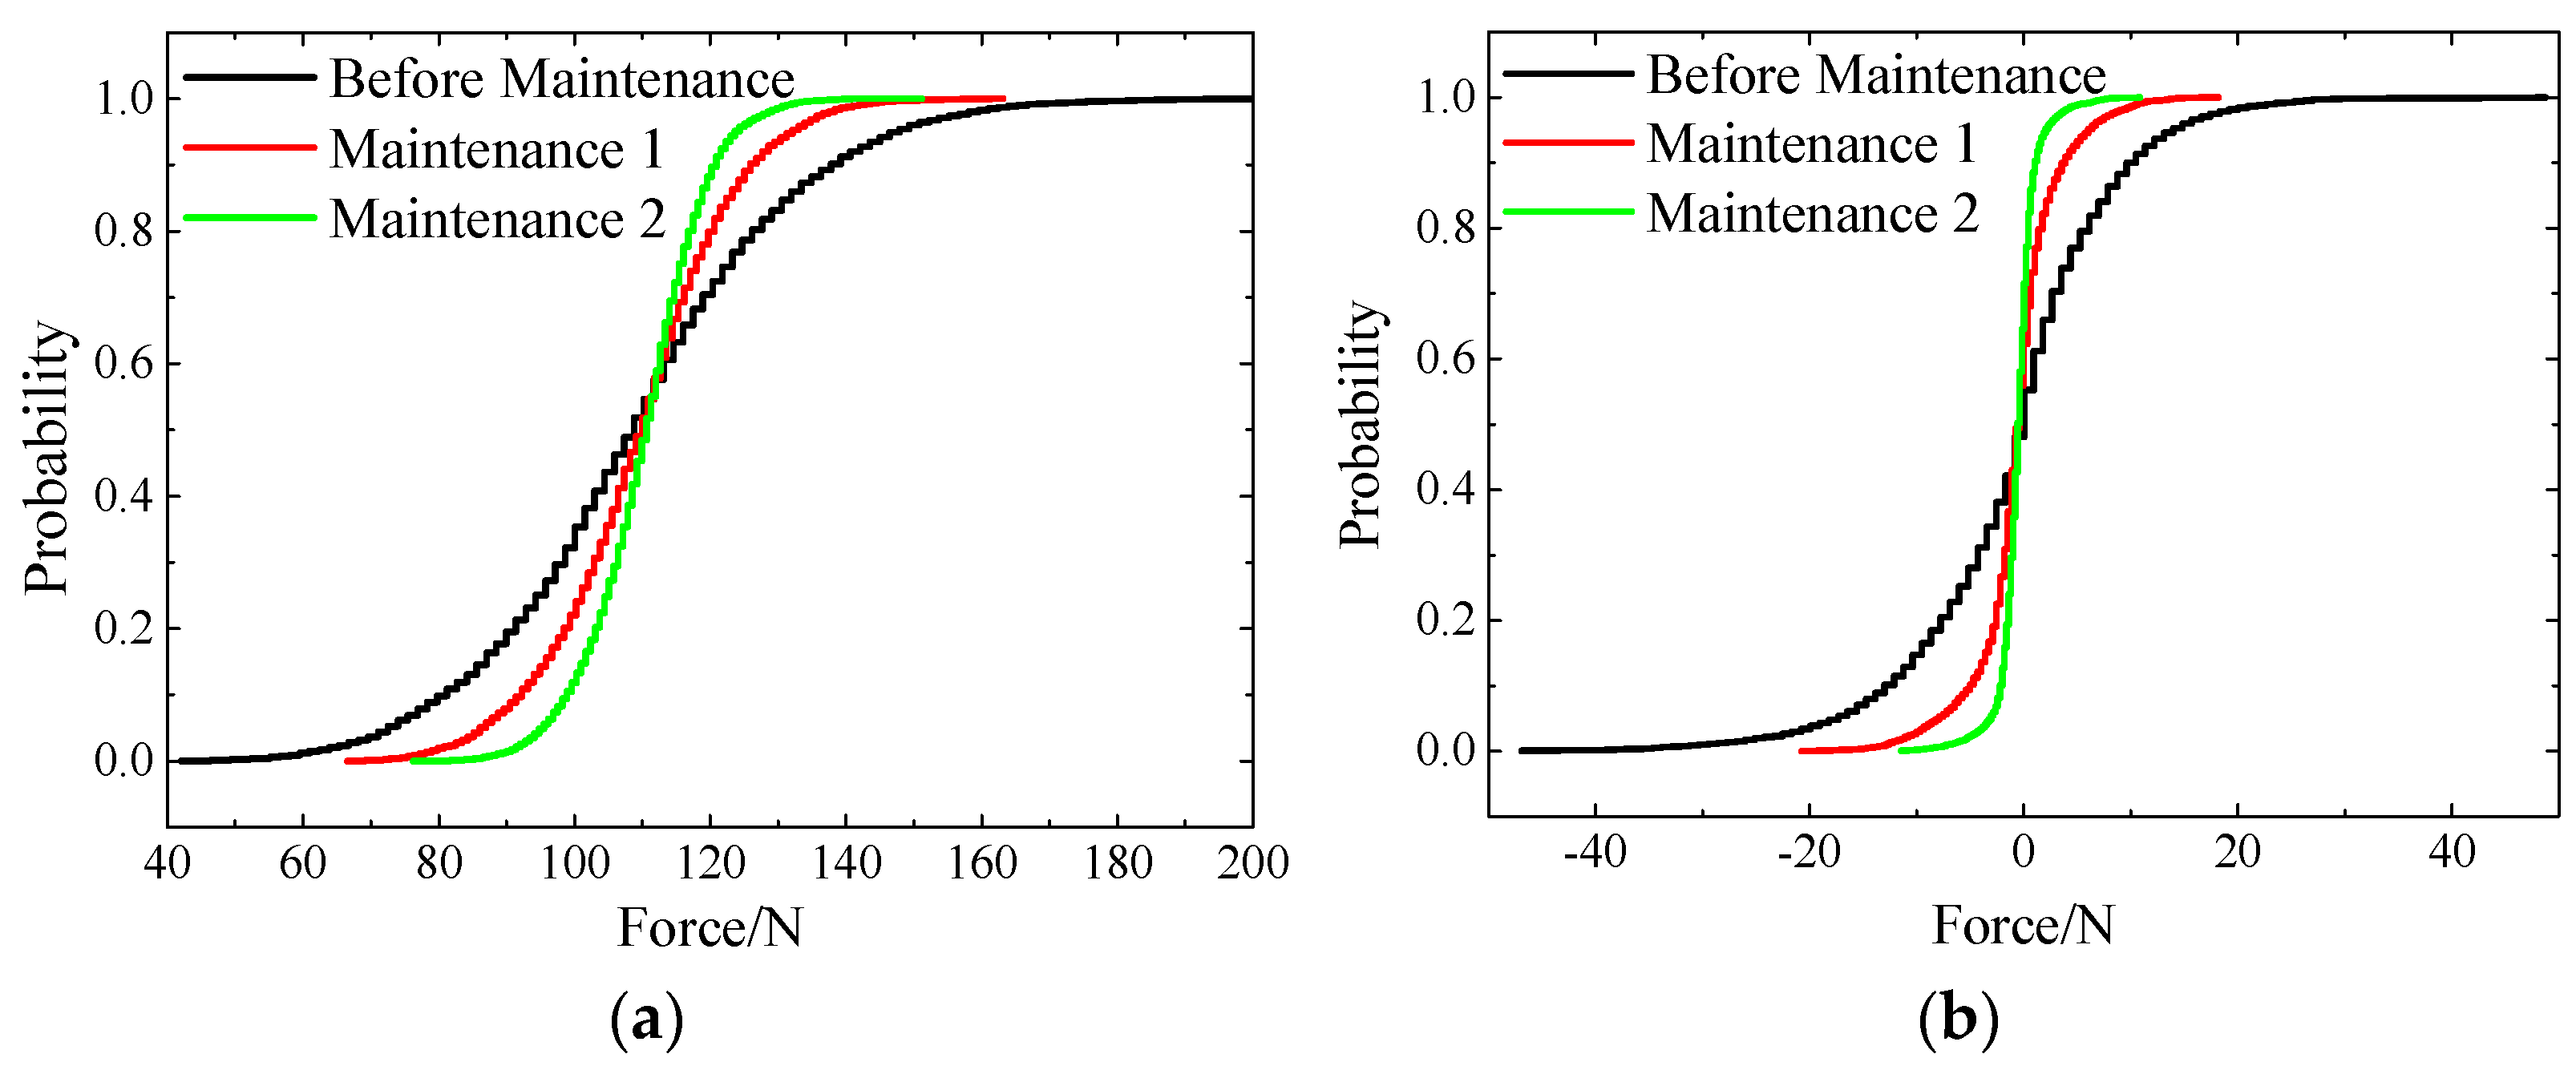
The comparison of the PC contact force is shown in Figure 15, and the statistical characteristic values are shown in Table 4.
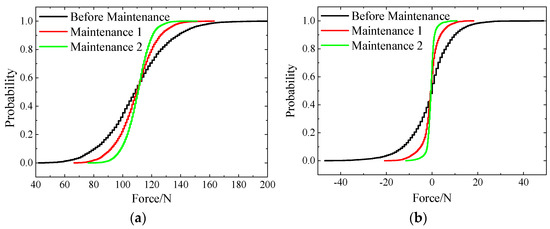
Figure 15.
The effect of the maintenance suggestions (on contact force): (a) normal contact force; (b) friction force.
Table 4.
Statistical values of the acceleration of pantograph strip.
It can be observed from Figure 15 that after controlling the irregularity with specific wavelengths, the PC normal contact forces are more concentrated at their mean value of 110 N, and the lateral forces are more concentrated at 0. The maximum and minimum values are both improved, indicating that the PC contact is more stable.
The statistical values in Table 4 show that the maintenance suggestions have a great influence on the PC lateral friction. In the case of maintenance 1, the maximum lateral friction force can be reduced by 57%, the effective value can be reduced by 58%, and the standard deviation can be reduced by 62%.
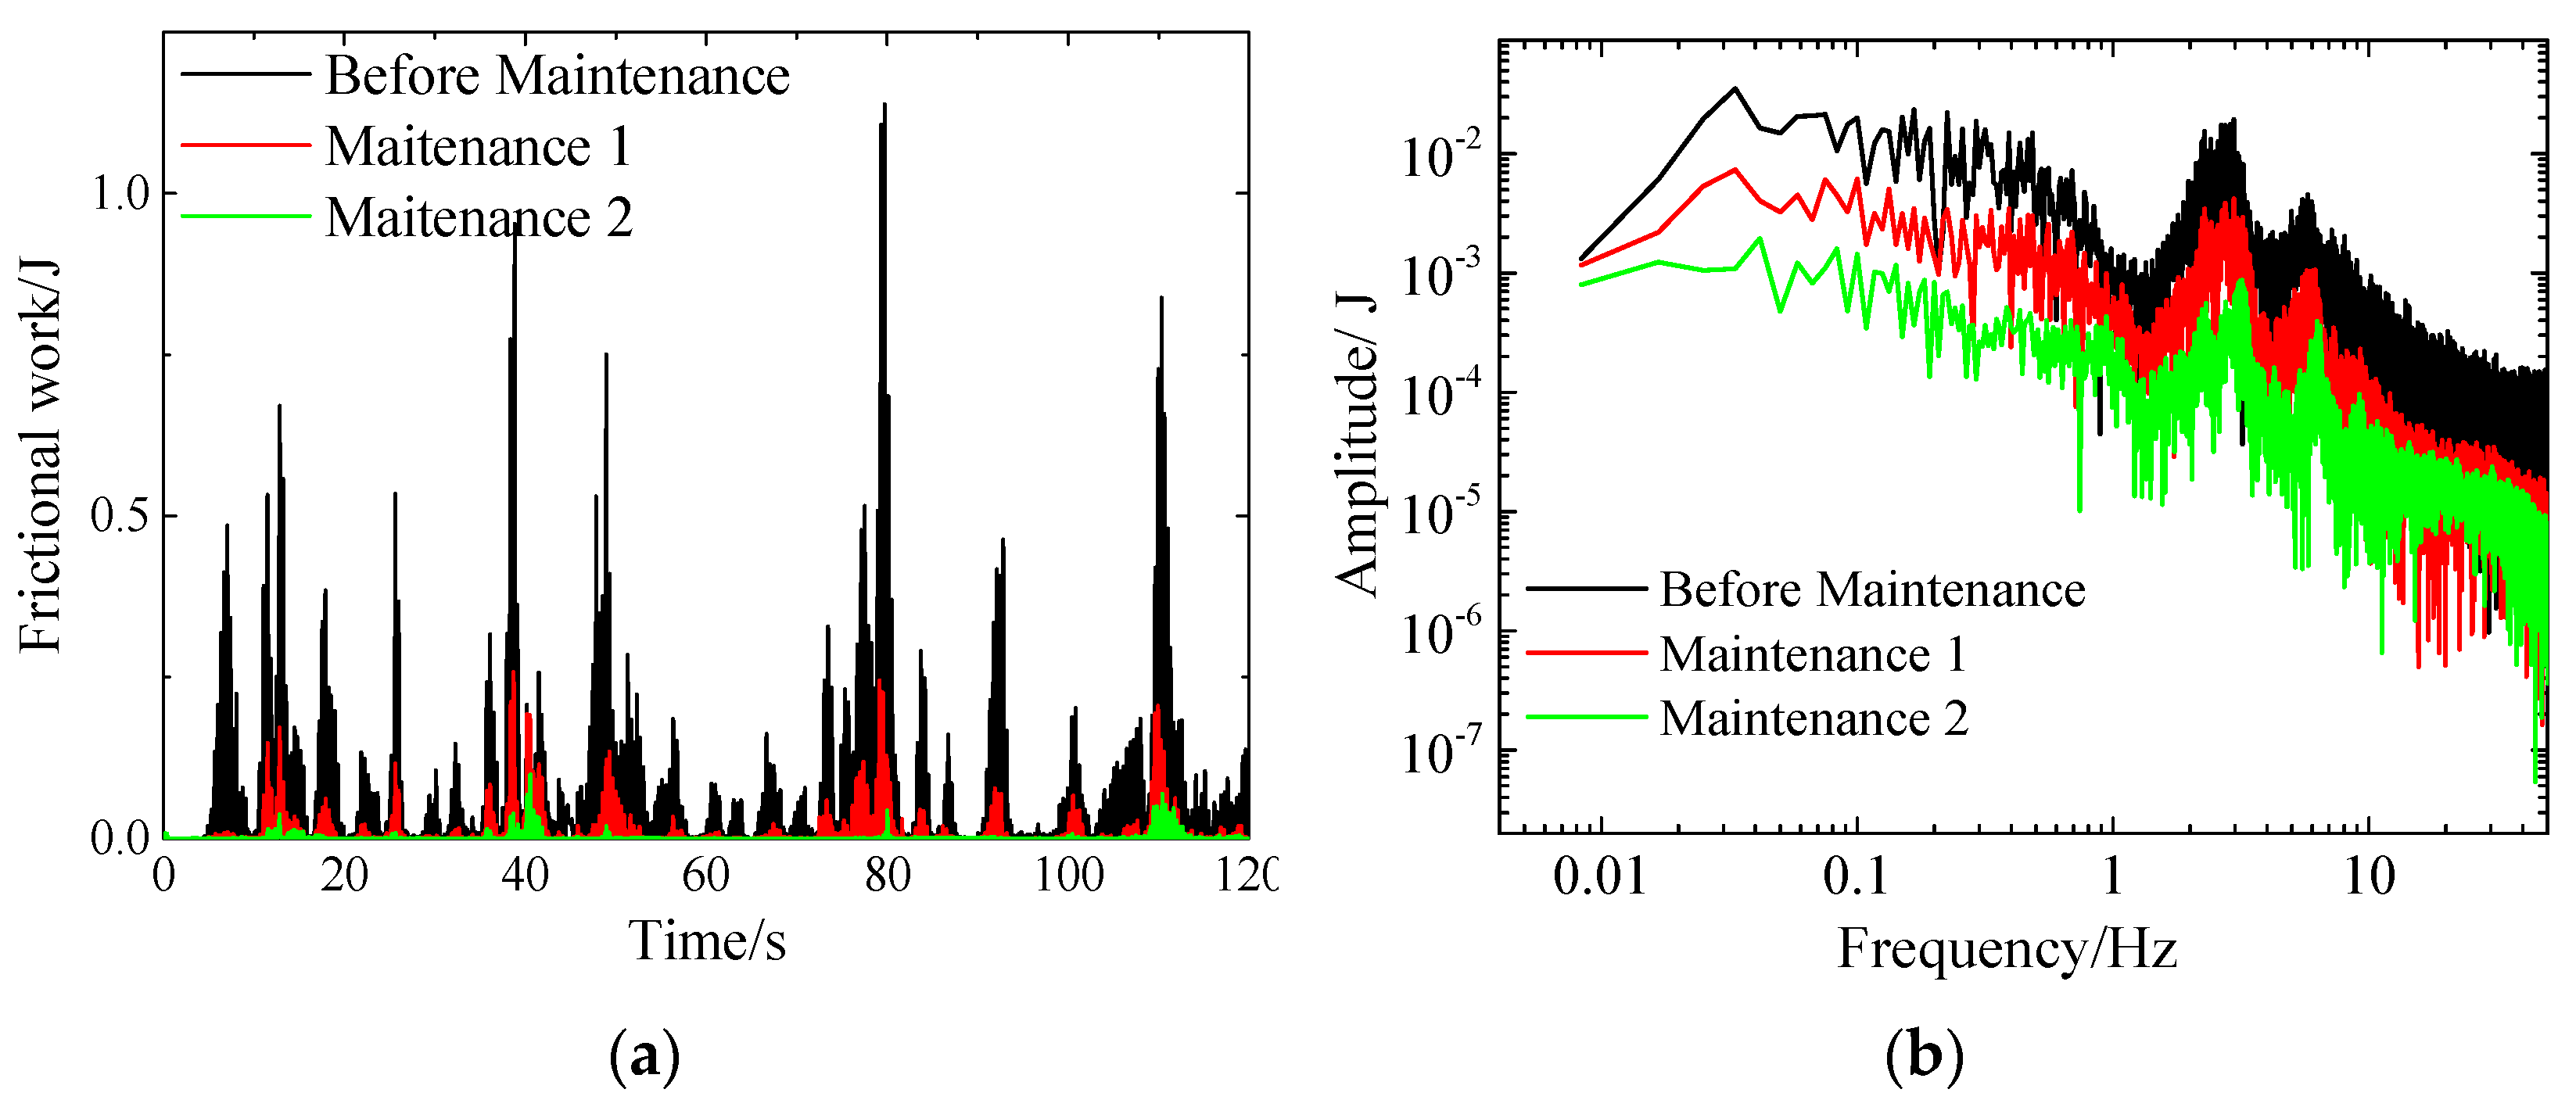
Considering that the operation problem is the rapid wear of the pantograph strip, the friction work is used to approximate the wear of the pantograph in the manuscript. The PC friction work of the whole section under the three calculation conditions is compared, as shown in Figure 16.
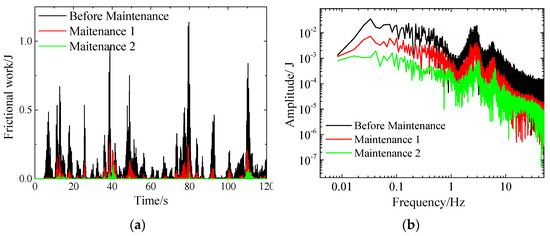
Figure 16.
The effect of the maintenance suggestions (frictional work). (a) In time domain; (b) In frequency domain.
According to Figure 16a, it can be seen that under the initial condition, the friction work has many sharp peaks; however, these peaks are significantly reduced under the maintenance conditions. For example, when t = 79 s, the friction work is 1.14 J under the initial condition, while that under the maintenance 1 and 2 conditions is 0.26 J and 0.10 J, respectively. It can be observed from Figure 16b that under the maintenance conditions, the friction work decreases in the whole frequency domain, especially at the two peaks.
The statistical values of friction work are shown in Table 5.
Table 5.
Statistical values of the acceleration of pantograph strip.
The PC friction work can be reduced to the degree of 90% or more in the parameter of maximum value and the mean value under the maintenance condition, and the overall value of the friction work is closer to 0, indicating that the suggestions proposed in this paper can have a positive effect on the friction control of the pantograph strip.
6. Conclusions
In this manuscript, aiming at the problem of rapid wear of the pantograph strip in Z City, a vehicle–track–pantograph coupling dynamic model was established to carry out the dynamic calculation and simulation, and the transmission of the vibration in the track irregularity–vehicle vibration–pantograph sequence was studied and analyzed. Then, optimization suggestions for the maintenance of the track irregularity were put forward. Finally, by evaluating the optimization suggestions, their rationality and effectiveness were confirmed. The main conclusions are as follows:
- The track spectrum values of Metro Line 1 in Z City are significantly higher than those of the American level 6 spectra, the German high-interference spectrum, and the Beijing Metro spectrum, indicating that the overall track smoothness is poor. There are multiple broadband peaks in the irregularity, such as three wavelengths of 3~4 m, 6~8 m, and 9~16 m, indicating that the irregularities of the specific wavelengths are the main reasons for the deterioration of the track geometry.
- The two-stage suspension system of the vehicle can attenuate the vibration caused by some short-wavelength irregularities, but the irregularities of the 3~4 m and 9~16 m wavelengths can have a significant impact on the vehicle, aggravating pantograph vibration and PC contact force.
- The vertical and lateral contact force of the pantograph and catenary is larger in the three wavelength ranges of 3~4 m, 6~8 m, and 9~16 m, and the track irregularity is larger in the two wavelength ranges of 3~4 m and 9~16 m. There is a direct mapping relationship between the spectra.
- Comparing the spectral characteristics and pantograph contact force under the irregularities of Z City Metro Line 1 and the Beijing Metro, it is further determined that the vibration and friction of the pantograph are exacerbated due to the excessive amplitudes of the wavelengths of 3~4 m and 9~16 m.
- Optimization suggestions for controlling the irregularity in the wavelengths of 3~4 m and 9~16 m were proposed, and the dynamic calculation was carried out. The results show that the PC contact force and friction work can be significantly reduced by using the optimization measures, which can contribute to the reduction in the wear of the pantograph strip.
Author Contributions
B.A.: conceptualization, software, methodology, writing—original draft preparation, validation; P.W.: conceptualization, writing—review and editing; S.M.: investigation, formal analysis; Z.M.: software, formal analysis, investigation; Y.Z.: supervision, writing—review and editing; W.Z.: validation, investigation. All authors have read and agreed to the published version of the manuscript.
Funding
This research was funded by the National Key Research and Development Project 2021YFB2601000, the National Natural Science Foundation of China, grant number 51878661, 51908031, and the Science and Technology Program of ZheJiang Communications Investment Group Co., Ltd. (202102).
Institutional Review Board Statement
Not applicable.
Informed Consent Statement
Not applicable.
Data Availability Statement
Data are contained within the article.
Conflicts of Interest
The authors declare no conflict of interest.
References
- Poetsch, G.; Evans, J.; Meisinger, R.; Kortüm, W.; Baldauf, W.; Veitl, A.; Wallaschek, J. Pantograph/Catenary Dynamics and Control. Veh. Syst. Dyn. 1997, 28, 159–195. [Google Scholar] [CrossRef]
- Song, Y.; Liu, Z.; Rxnnquist, A.; Navik, P.; Liu, Z. Contact Wire Irregularity Stochastics and Effect on High-speed Railway Pantograph-Catenary Interactions. IEEE Trans. Instrum. Meas. 2020, 69, 8196–8206. [Google Scholar] [CrossRef]
- Bucca, G.; Collina, A. A procedure for the wear prediction of collector strip and contact wire in pantograph–catenary system. Wear 2009, 266, 46–59. [Google Scholar] [CrossRef]
- Gao, L.; An, B.; Xin, T.; Wang, J.; Wang, P. Measurement, analysis, and model updating based on the modal parameters of high-speed railway ballastless track. Measurement 2020, 161, 107891. [Google Scholar] [CrossRef]
- An, B.; Gao, L.; Xin, T.; Xiang, G.; Wang, J. A Novel Approach of Identifying Railway Track Rail’s Modal Frequency from Wheel-Rail Excitation and Its Application in High-Speed Railway Monitoring. IEEE Access 2019, 7, 180986–180997. [Google Scholar] [CrossRef]
- Park, T.; Han, C.; Jang, J. Dynamic sensitivity analysis for the pantograph of a high-speed rail vehicle. J. Sound Vib. 2003, 266, 235–260. [Google Scholar] [CrossRef]
- Shing, A.W.C.; Wong, P.P.L. Wear of pantograph collector strips. Proc. Inst. Mech. Eng. Part F J. Rail Rapid Transit 2008, 222, 169–176. [Google Scholar] [CrossRef]
- Ding, T.; Chen, G.X.; Bu, J.; Zhang, W.H. Effect of temperature and arc discharge on friction and wear behaviours of carbon strip/copper contact wire in pantograph–catenary systems. Wear 2011, 271, 1629–1636. [Google Scholar] [CrossRef]
- Wei, X.K.; Meng, H.F.; He, J.H.; Jia, L.M.; Li, Z.G. Wear analysis and prediction of rigid catenary contact wire and pantograph strip for railway system. Wear 2020, 442–443, 203118. [Google Scholar] [CrossRef]
- Mei, G. Tribological performance of rigid overhead lines against pantograph sliders under DC passage. Tribol. Int. 2020, 151, 106538. [Google Scholar] [CrossRef]
- Daocharoenporn, S.; Mongkolwongrojn, M.; Kulkarni, S.; Shabana, A.A. Prediction of the Pantograph/Catenary Wear Using Nonlinear Multibody System Dynamic Algorithms. J. Tribol. 2019, 141, 051603. [Google Scholar] [CrossRef]
- Derosa, S.; Nåvik, P.; Collina, A.; Bucca, G.; Rønnquist, A. A heuristic wear model for the contact strip and contact wire in pantograph—Catenary interaction for railway operations under 15 kV 16.67 Hz AC systems. Wear 2020, 456–457, 203401. [Google Scholar] [CrossRef]
- Yi, C.; Wang, D.; Zhou, L.; Lin, J. A simulation investigation on the influence of pantograph crack defect on graphite contact strip wear. Eng. Fail. Anal. 2022, 131, 105889. [Google Scholar] [CrossRef]
- Wang, H.; Núez, A.; Liu, Z.; Song, Y.; Duan, F.; Dollevoet, R. Analysis of the evolvement of contact wire wear irregularity in railway catenary based on historical data. Veh. Syst. Dyn. 2018, 56, 1207–1232. [Google Scholar] [CrossRef]
- Zhang, Y.Y.; Zhang, Y.Z.; Du, S.M.; Song, C.F.; Yang, Z.H.; Shangguan, B. Tribological properties of pure carbon strip affected by dynamic contact force during current-carrying sliding. Tribol. Int. 2018, 123, 256–265. [Google Scholar] [CrossRef]
- Yao, Y.; Zou, D.; Zhou, N.; Mei, G.; Wang, J.; Zhang, W. A study on the mechanism of vehicle body vibration affecting the dynamic interaction in the pantograph-catenary system. Veh. Syst. Dyn. 2021, 59, 1335–1354. [Google Scholar] [CrossRef]
- Carnicero, A.; Jimenez-Octavio, J.R.; Ramos, A.; Such, M. Influence of Track Irregularities in the Catenary-Pantograph Dynamic Interaction. J. Comput. Nonlin. Dyn. 2012, 7, 041015. [Google Scholar] [CrossRef]
- Song, Y.; Wang, Z.; Liu, Z.; Wang, R. A spatial coupling model to study dynamic performance of pantograph-catenary with vehicle-track excitation. Mech. Syst. Signal Processing 2021, 151, 107336. [Google Scholar] [CrossRef]
- Jian, F.; Songliang, L.; Xiaoyan, L.; Linya, L. Investigation of Wen-fu Passenger Dedicated Line ballast track irregularities characteristics. In Proceedings of the 3rd International Conference on Transportation Information and Safety, Wuhan, China, 25–28 June 2015. [Google Scholar]
- Nielsen, J.C.O.; Li, X. Railway track geometry degradation due to differential settlement of ballast/subgrade—Numerical prediction by an iterative procedure. J. Sound Vib. 2018, 412, 441–456. [Google Scholar] [CrossRef]
- Chen, Z.; Zhai, W.; Cai, C.; Sun, Y. Safety threshold of high-speed railway pier settlement based on train-track-bridge dynamic interaction. Sci. China Technol. Sci. 2015, 58, 202–210. [Google Scholar] [CrossRef]
- Zhang, D.; Xu, P.; Zhai, W.; Zhang, X. Long-term evolution mechanism of the rail weld irregularity in metro lines based on the wear theory. Wear 2020, 444–445, 203160. [Google Scholar] [CrossRef]
- Xu, J.; Wang, P.; Gao, Y.; Chen, J.; Chen, R. Geometry evolution of rail weld irregularity and the effect on wheel-rail dynamic interaction in heavy haul railways. Eng. Fail. Anal. 2017, 81, 31–44. [Google Scholar] [CrossRef]
- Zhai, W. Vehicle-Track Coupling Dynamics, Volume 1; China Science Publishing: Beijing, China, 2015; p. 272. [Google Scholar]
- Vijay, K.; Rao, V. Dynamics of Railway Vehicle Systems; Academic Press: New York, NY, USA, 1984; p. 407. [Google Scholar]
- An, B.; Gao, L.; Xin, T.; Lin, J. An approach to evaluate wheel-rail match properties considering the flexibility of ballastless track: Comparison of rigid and flexible track models in wheel-rail profile matching. Int. J. COMADEM 2019, 22, 5–13. [Google Scholar]
- Kalker, J.J. Three-Dimensional Elastic Bodies in Rolling Contact; Kluwer Academic Publishers: Dordrecht, The Netherland, 1990; p. 314. [Google Scholar]
- Jinfa, G. Study on Dynamic Interaction between Pantograph and Overhead Conductor Rail. Ph.D. Thesis, Southwest Jiaotong University, Chengdu, China, 2016. [Google Scholar]


Publisher’s Note: MDPI stays neutral with regard to jurisdictional claims in published maps and institutional affiliations. |
© 2022 by the authors. Licensee MDPI, Basel, Switzerland. This article is an open access article distributed under the terms and conditions of the Creative Commons Attribution (CC BY) license (https://creativecommons.org/licenses/by/4.0/).