Article

Modernization of Heavy Loaded Tram Radial Effect on Noise and Vibration

1
Department of Structural Mechanics and Applied Mathematics, Faculty of Civil Engineering, University of Zilina, Univerzitna 8215/1, 010 26 Zilina, Slovakia
2
Department of Railway Engineering and Track Management, Faculty of Civil Engineering, University of Zilina, Univerzitna 8215/1, 010 26 Zilina, Slovakia
*
Author to whom correspondence should be addressed.
Appl. Sci. 2022, 12(14), 6947; https://doi.org/10.3390/app12146947
Submission received: 21 March 2022 / Revised: 27 June 2022 / Accepted: 5 July 2022 / Published: 8 July 2022
(This article belongs to the Special Issue Design of Track System and Railway Vehicle Dynamics Analysis)

Abstract

:
The noise and vibration that cause deterioration of comfort at specific locations can be reduced by modernisation of tram lines in some large cities where dense development surrounds tram lines. The paper deals with the impact of noise and vibration produced by tram traffic. Its aim was to verify whether the modernisation of one of the busiest tram lines in the capital of Slovakia had an impact on the reduction of noise and vibration emissions arising in its surroundings. The paper analysed experimental measurements conducted at the busiest locations of the studied tram line, focusing on the parameters LAeq and vrms. The methodology for reducing the adverse effects of noise and vibration is based on the modernisation of the tramway line, characterised in detail in the paper. The presentation and analysis of the measurement results are followed by conclusions that underline the importance of reducing noise and vibration emissions generated by tram traffic by modernising the tram line network.

1. Introduction

Growing urbanisation and the associated increase in the urban population substantially affect transport demands. Ideally, the growing transport should occupy as little expensive urban land as possible and at the same time be energy-efficient and environmentally friendly. Rail transport, in particular urban rail transport, fulfils these conditions, as it requires less space, consumes less energy, and produces considerably less environmental pollution than car transport. In view of these facts, urban rail as an environmentally friendly transport mode has since the 1960s played an indispensable role in solving the complex traffic and transport relations in all large cities, including the city of Bratislava.
In the context of the sustainable urban environment, modernisation and, in many cases, e.g., in French and American cities, the reintroduction of trams into the public transport system, it is necessary to pay increased attention to the noise and vibrations emitted by rail transport. In the past, the issue of the impact of noise and vibration from rail transport was not addressed sufficiently, despite the fact that their negative effects on the quality of human health and the durability of buildings in the vicinity of railways have been commonly accepted. In 2008, the EU Environmental Noise Directive [1] was modified to assess the noise and vibration to which people are exposed, especially in densely built-up urban areas and agglomerations. This document created the preconditions for a relevant assessment of the negative impacts of environmental noise and vibration on environmental quality.
The directive [1], as well as other national and international legislative documents [2,3,4,5,6,7,8,9,10], consider noise and vibration as separate factors. Currently, many foreign experts prefer to combine noise and vibration into one vibroacoustic stimulus since they commonly occur simultaneously [11,12,13,14,15,16,17,18,19,20]. Therefore, in a vibroacoustic study of the modernised line, our department did not only monitor the noise emitted by the tram traffic but also the vibration in order to create a comprehensive picture of the environmental burden from the operation of a modernised section of the Bratislava tram line.
Prior to the modernisation, several measurements were carried out on the basis of an order from the Bratislava City Council. The aim of these studies was to map the state of noise and vibrations and to estimate the trend of their increase. The results of the analyses were also intended to point out the critical points in terms of absolute intensities and the increasing trend. It was these locations that were to be addressed with state-of-the-art design solutions in terms of soundproofing and vibration reduction due to tram traffic. These sites are currently included among those to be monitored. The measurements are used in conjunction with periodic diagnostics of the structural condition of the line as part of an intradisciplinary research on the impact of the upgrade of the structure on the improvement of the environmental load of noise and vibration. Previous measurements and any analysis have been published in the papers and studies [21,22,23].

2. Characteristics of Infrastructure and Modernised Tram Line in Bratislava

Tram transport has long been an indispensable part of the transport service of the city of Bratislava and is one of the oldest worldwide, with its origins dating back to 1895 [24]. In Bratislava, the tram service has been operating without any significant interruption. In many European and world cities, the so-called street tram was gradually replaced by automobile transport (bus and individual car transport) in the 1960s, or in some cases in American cities (before World War II) and European cities (after World War II), it was cancelled completely. In contrast, in Bratislava, tram transport has continuously formed the backbone of the city’s transport service system.

2.1. History of Tram Transport Infrastructure

The first public tram ride in Bratislava took place in 1895. The first line ran from the Danube embankment, through today’s Hviezdoslav Square, SNP Square, Suché Mýto, Štefánik Street, and was later extended to Hlavná Stanica (Main Station). In 1895, five electric carriages ran on the line at 10-minute intervals, making Bratislava ahead of Amsterdam, Manchester, and Tokyo. The line also included the first permanent bridge in Bratislava that from 1891 provided train transport to Vienna. In the past, the bridge name changed several times, from the original Franz Josef Bridge, to Štefánik Bridge after WWI, to the Red Army Bridge after WWII, to the present Old Bridge.
In 1951, trams crossed the Danube for the first time, and the Old Bridge was used for tram transport to the Petržalka side. However, operation on this route lasted approximately 10 years, as the technical parameters of the bridge were unsatisfactory. In the 1990s, the new economic conditions caused stagnation of public transport in Bratislava and, on the contrary, a significant development of motorisation, which caused many difficult-to-solve problems, including smog, traffic congestion, parking problems, and noise. The solution to mitigating these problems in Bratislava may be the gradual modernisation of the tram network, which at its current scale can be considered medium-sized, with 42 km of tram lines [24].

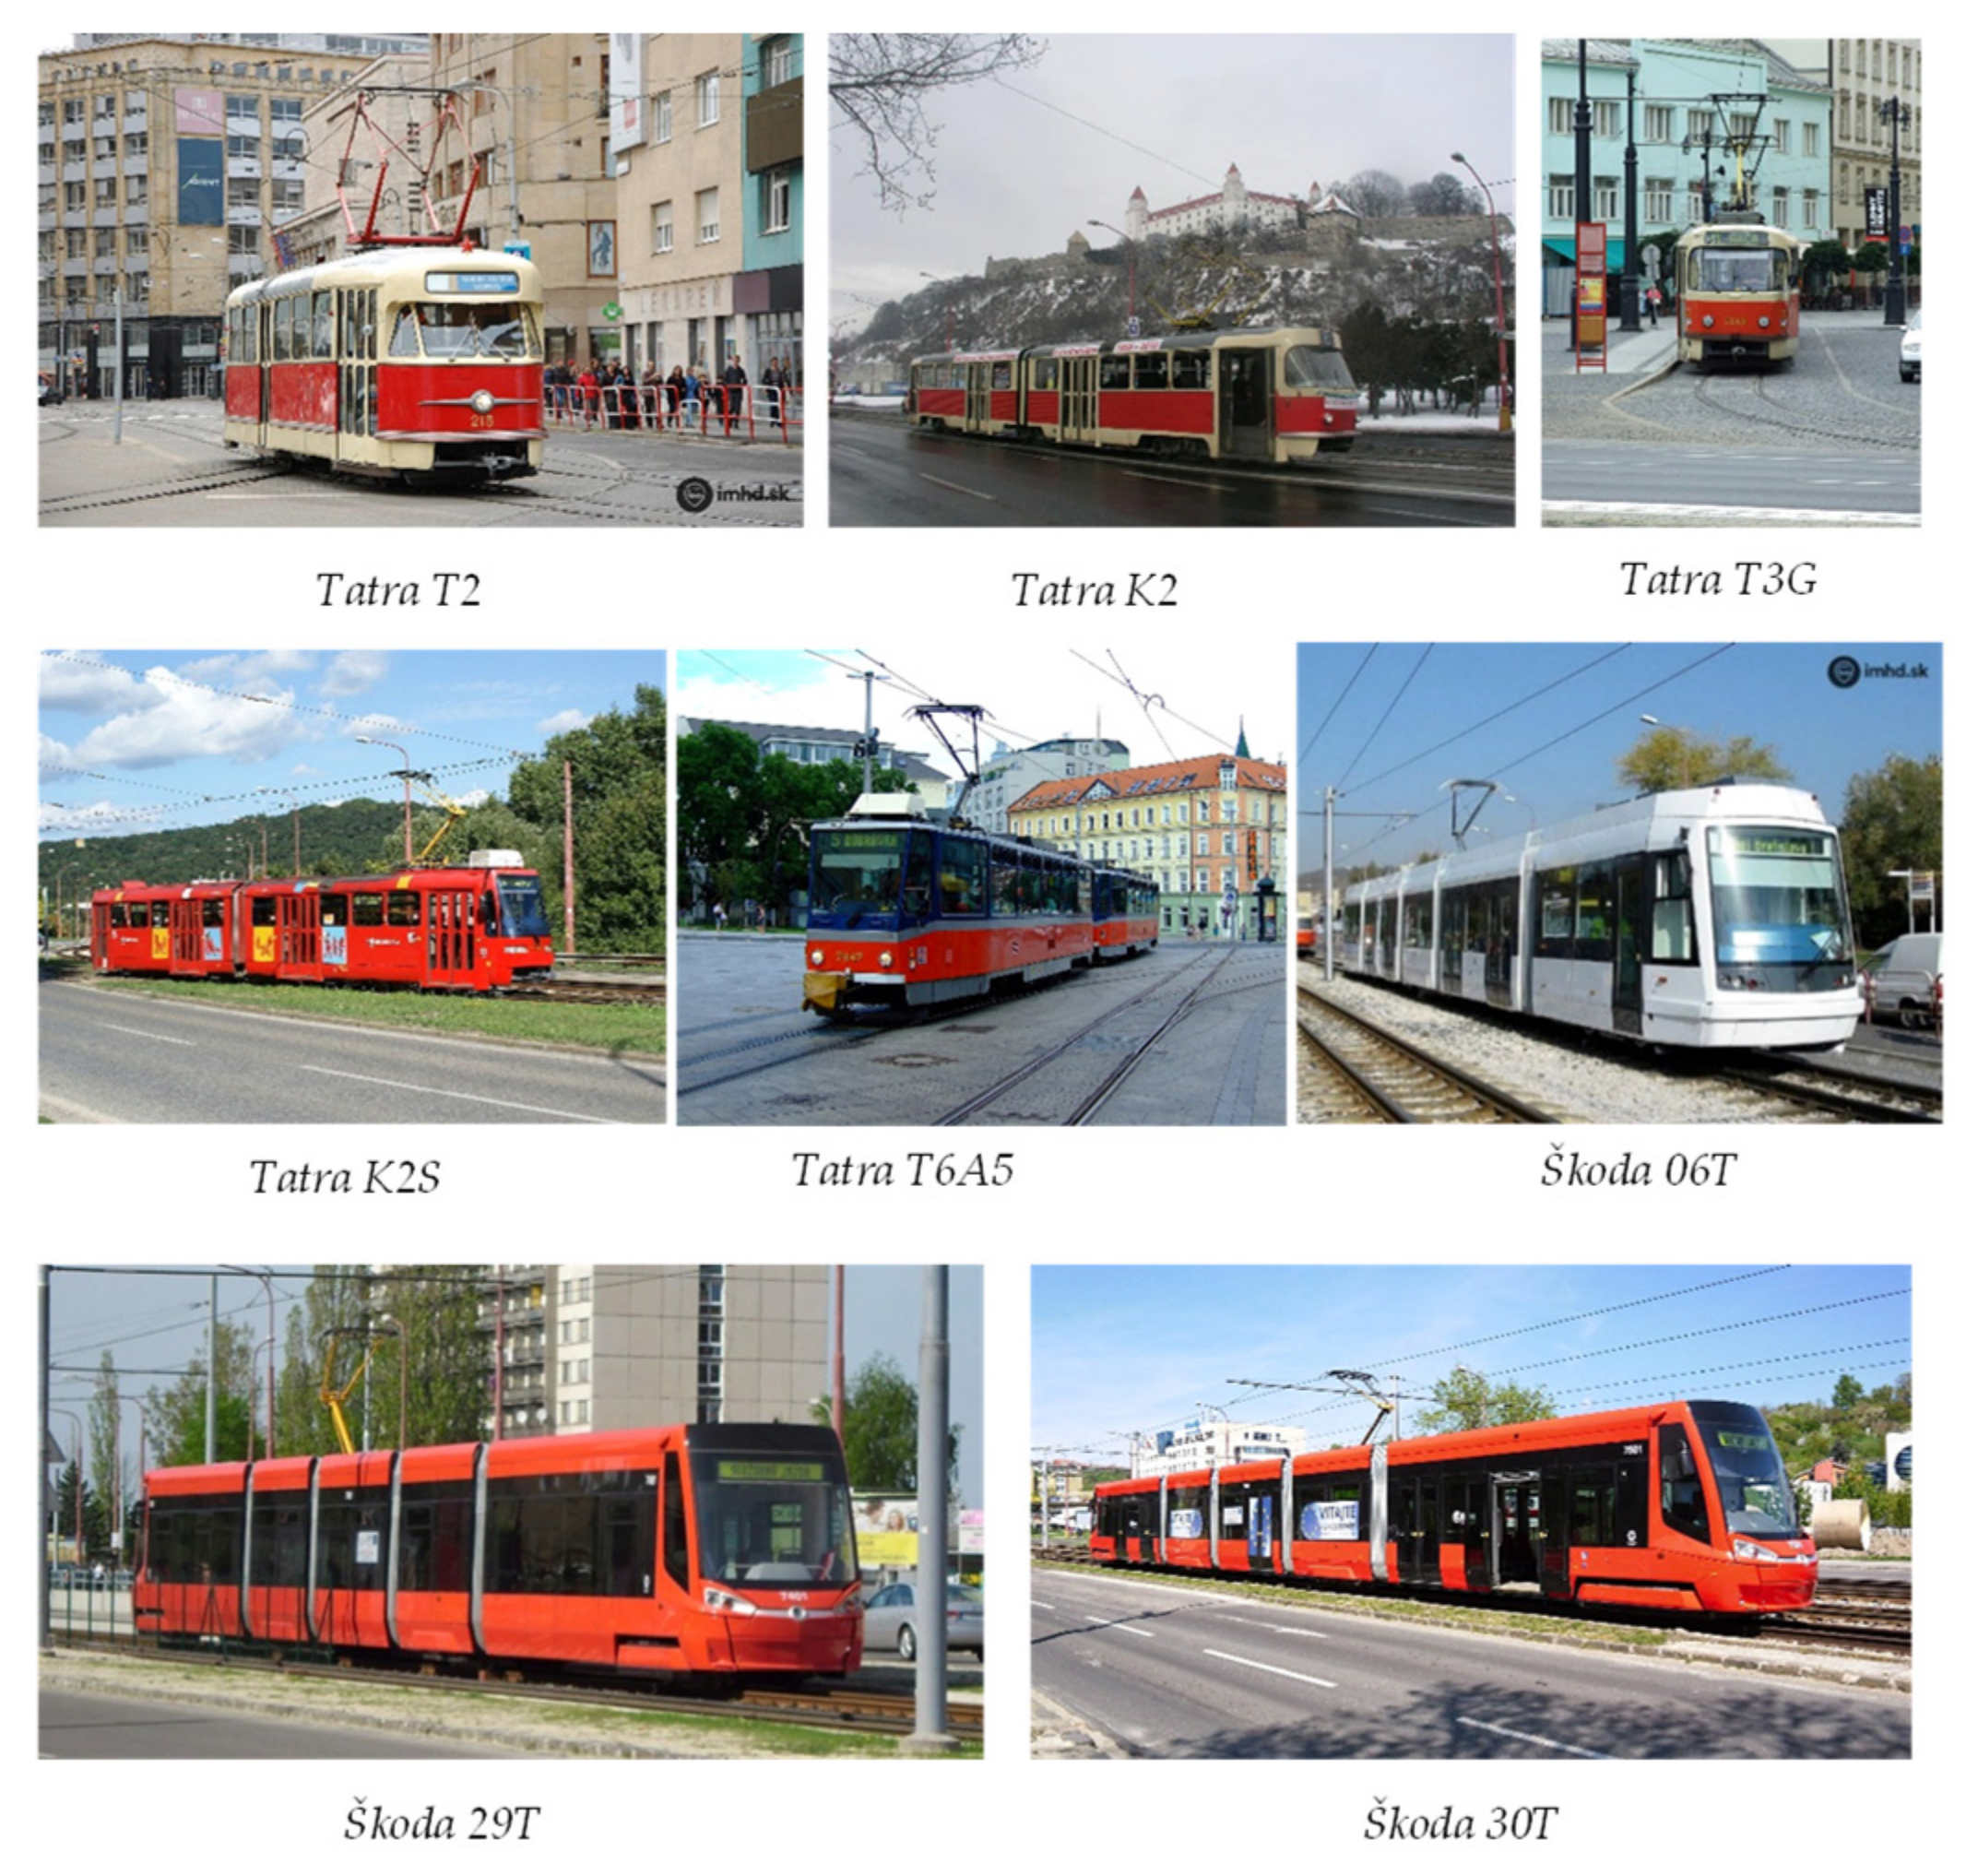
2.2. A Brief History of the Tram Network and the Composition of the Current Tram Fleet in Bratislava

The tram network of the city of Bratislava is operated in a gauge of 1000 mm. As the possibility of switching to standard gauge of 1435 mm, including the railway tracks in the city’s public transport track system, has been addressed in Bratislava for a long time, line sections have been reconstructed and equipped with a dual gauge. The tram vehicle fleet had to adapt to this possibility. At the end of the 1980s, the operation of Tatra T2 trams was terminated, and fast-rail tram lines were opened to the newly built housing estates. The 1990s were also characterised by fleet modernisation, introducing of K2S, T3G, T3Mod, and Tatra T6A5 trams.
At the beginning of the 21st century, preparations began for building a fast-rail or the so-called fast tramway. In connection with this construction in Bratislava, testing the Škoda 06 T type fast tram began, and its chassis was modified from the original 960 mm to 1000 mm. In 2007 the Capital City Council presented the intention to implement a dual gauge (Bratislava tram 1000 mm and standard railway 1435 mm) where the line could be used equally by trains and trams. In the same year, the idea of developing tram lines to several city districts was also introduced. A turning point in the need to modernise the tram lines in the Slovak capital came in 2011 and 2012 when the line providing transport to the Main Station was found to be in a state of disrepair. Moreover, a crack of considerable extent was detected in the lining of the tram tunnel under the Bratislava Castle. These issues led to the reorganisation of tram lines, reducing their number from 14 to 8 and condensing the new line intervals.
The first stage of the modernisation of the city’s public transport system in Bratislava started in 2013. At the end of this year, a work contract was signed for the reconstruction of the Old Bridge and the construction of a tram line to Petržalka. At the end of 2014, a prototype of the Škoda 30 T type two-way tram was delivered and put into operation in 2015. In 2015, a one-way tram type Škoda 29 T was also put into service. Test runs were performed on the Bratislava tram gauge (1000 mm) with a Škoda 30 T tram with a set of Tatra T6 vehicles and on the standard gauge (1435 mm) with a Tatra T3 tram (specially modified for this purpose) [25]. Figure 1 demonstrates tram types that are currently operated on tram lines in Bratislava.

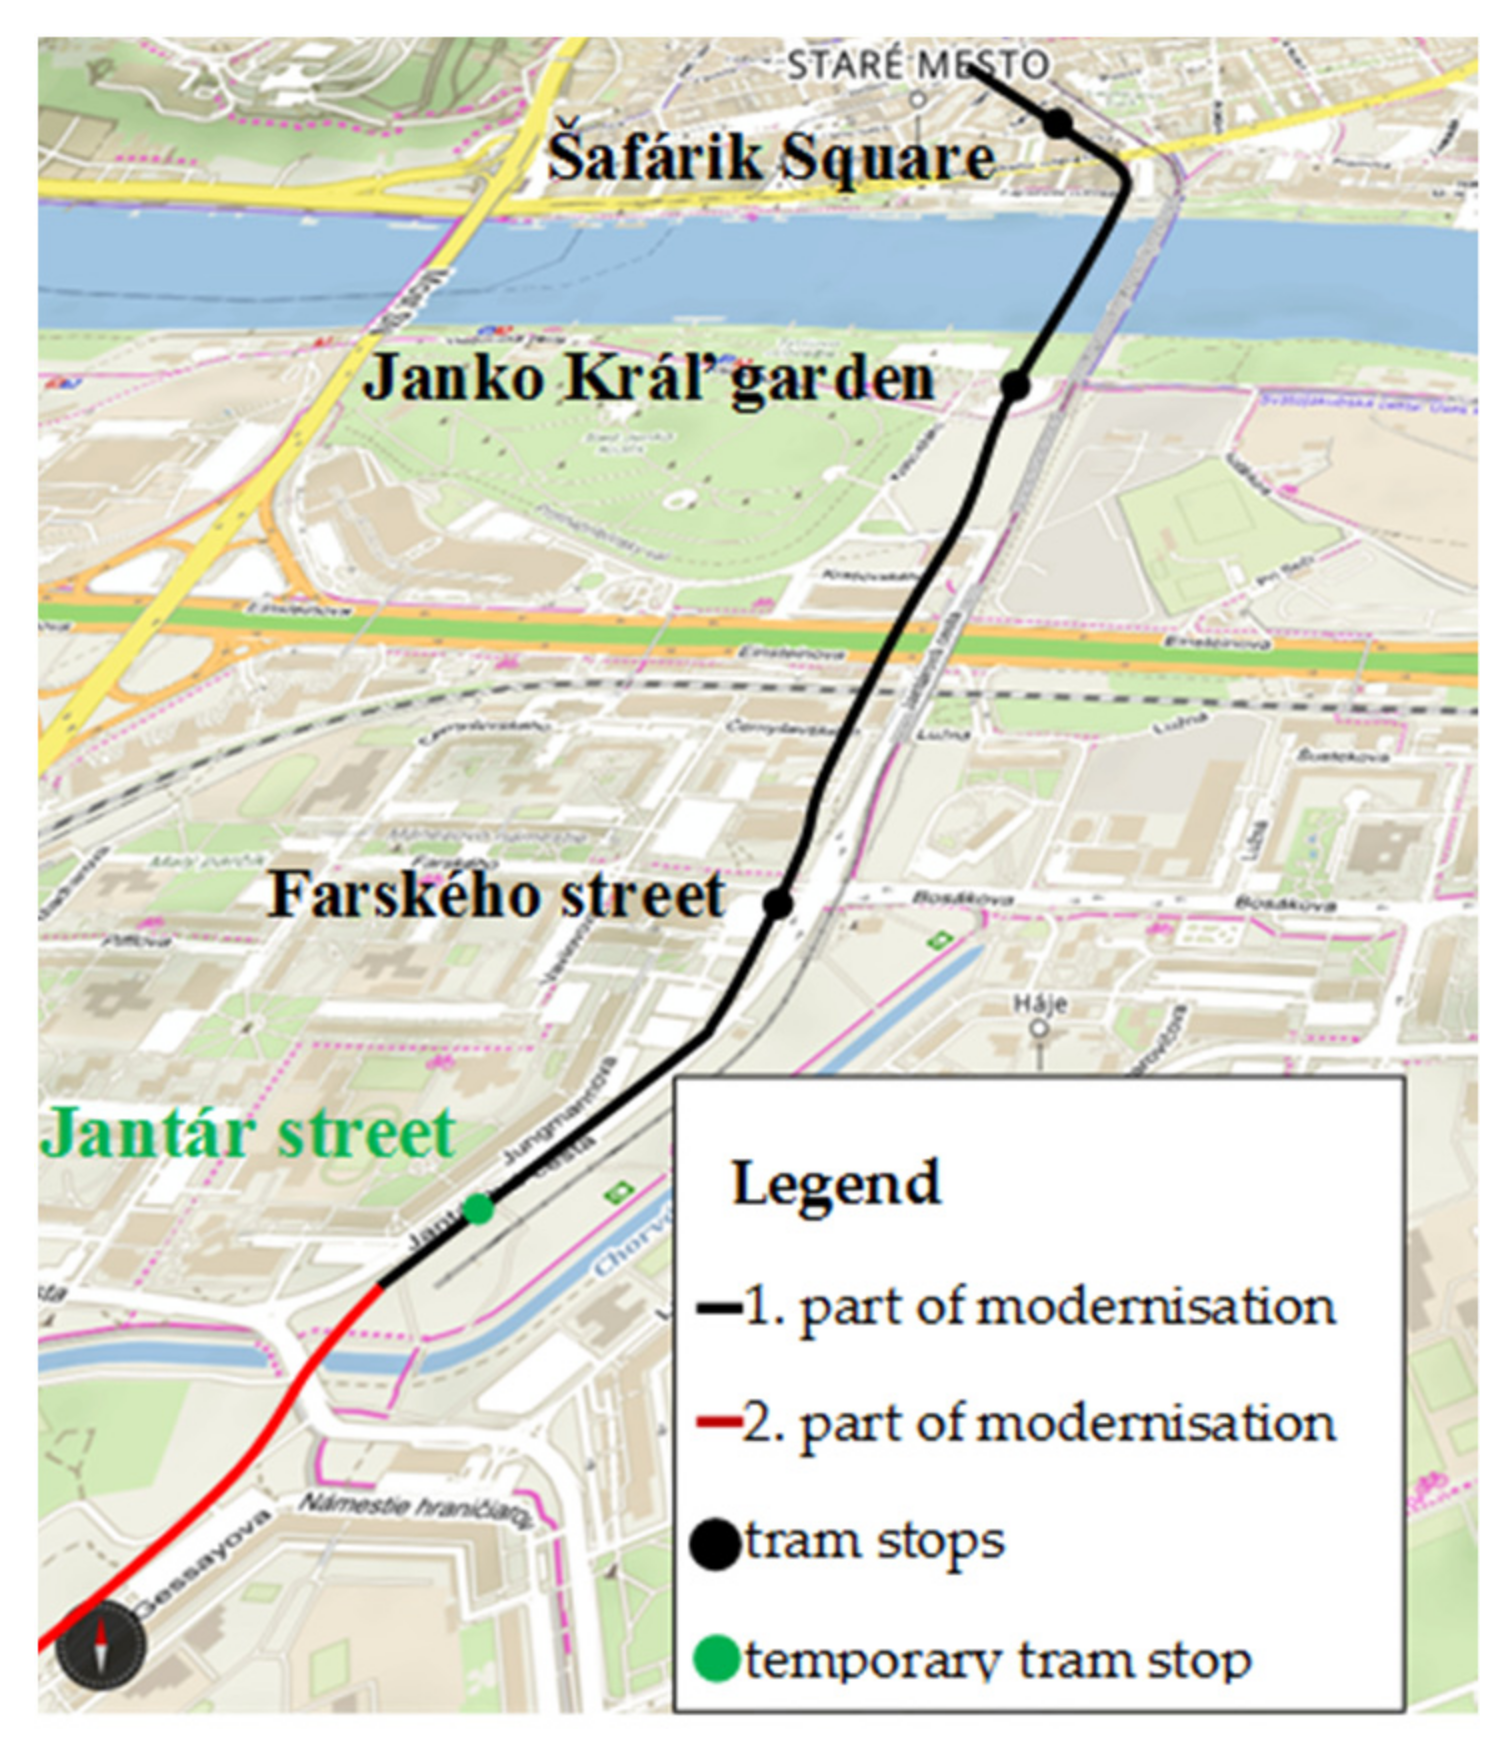
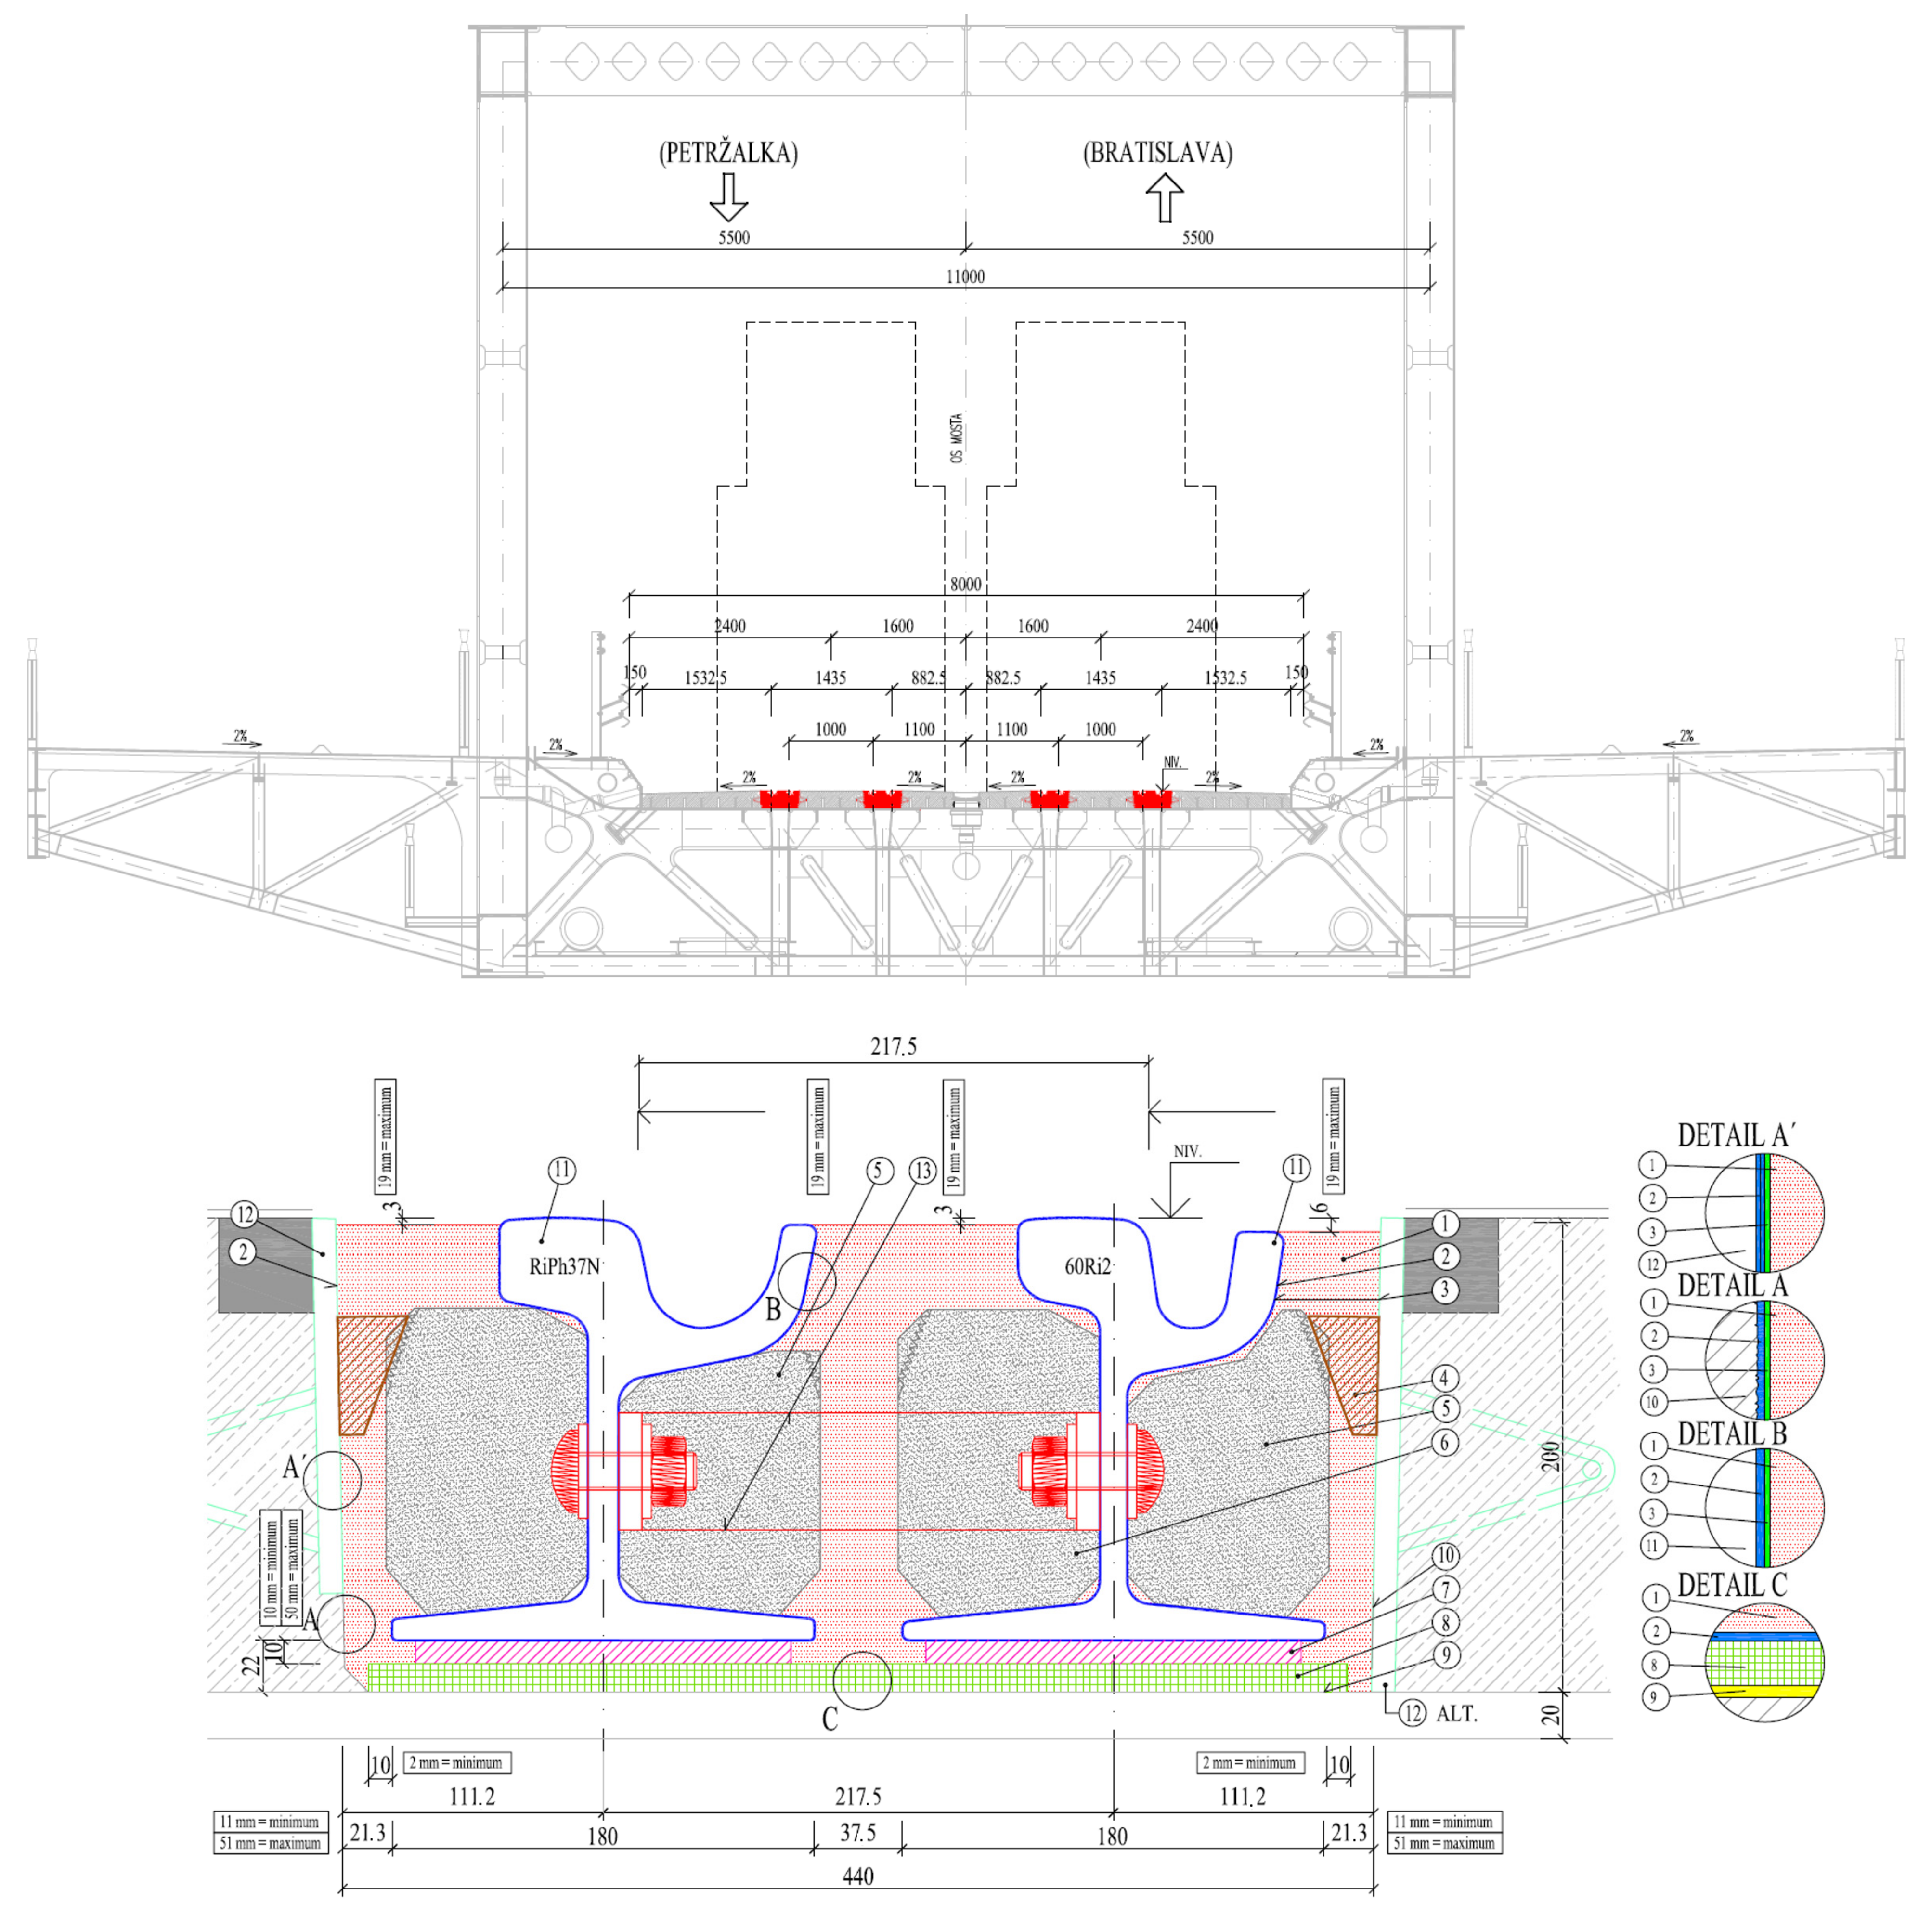
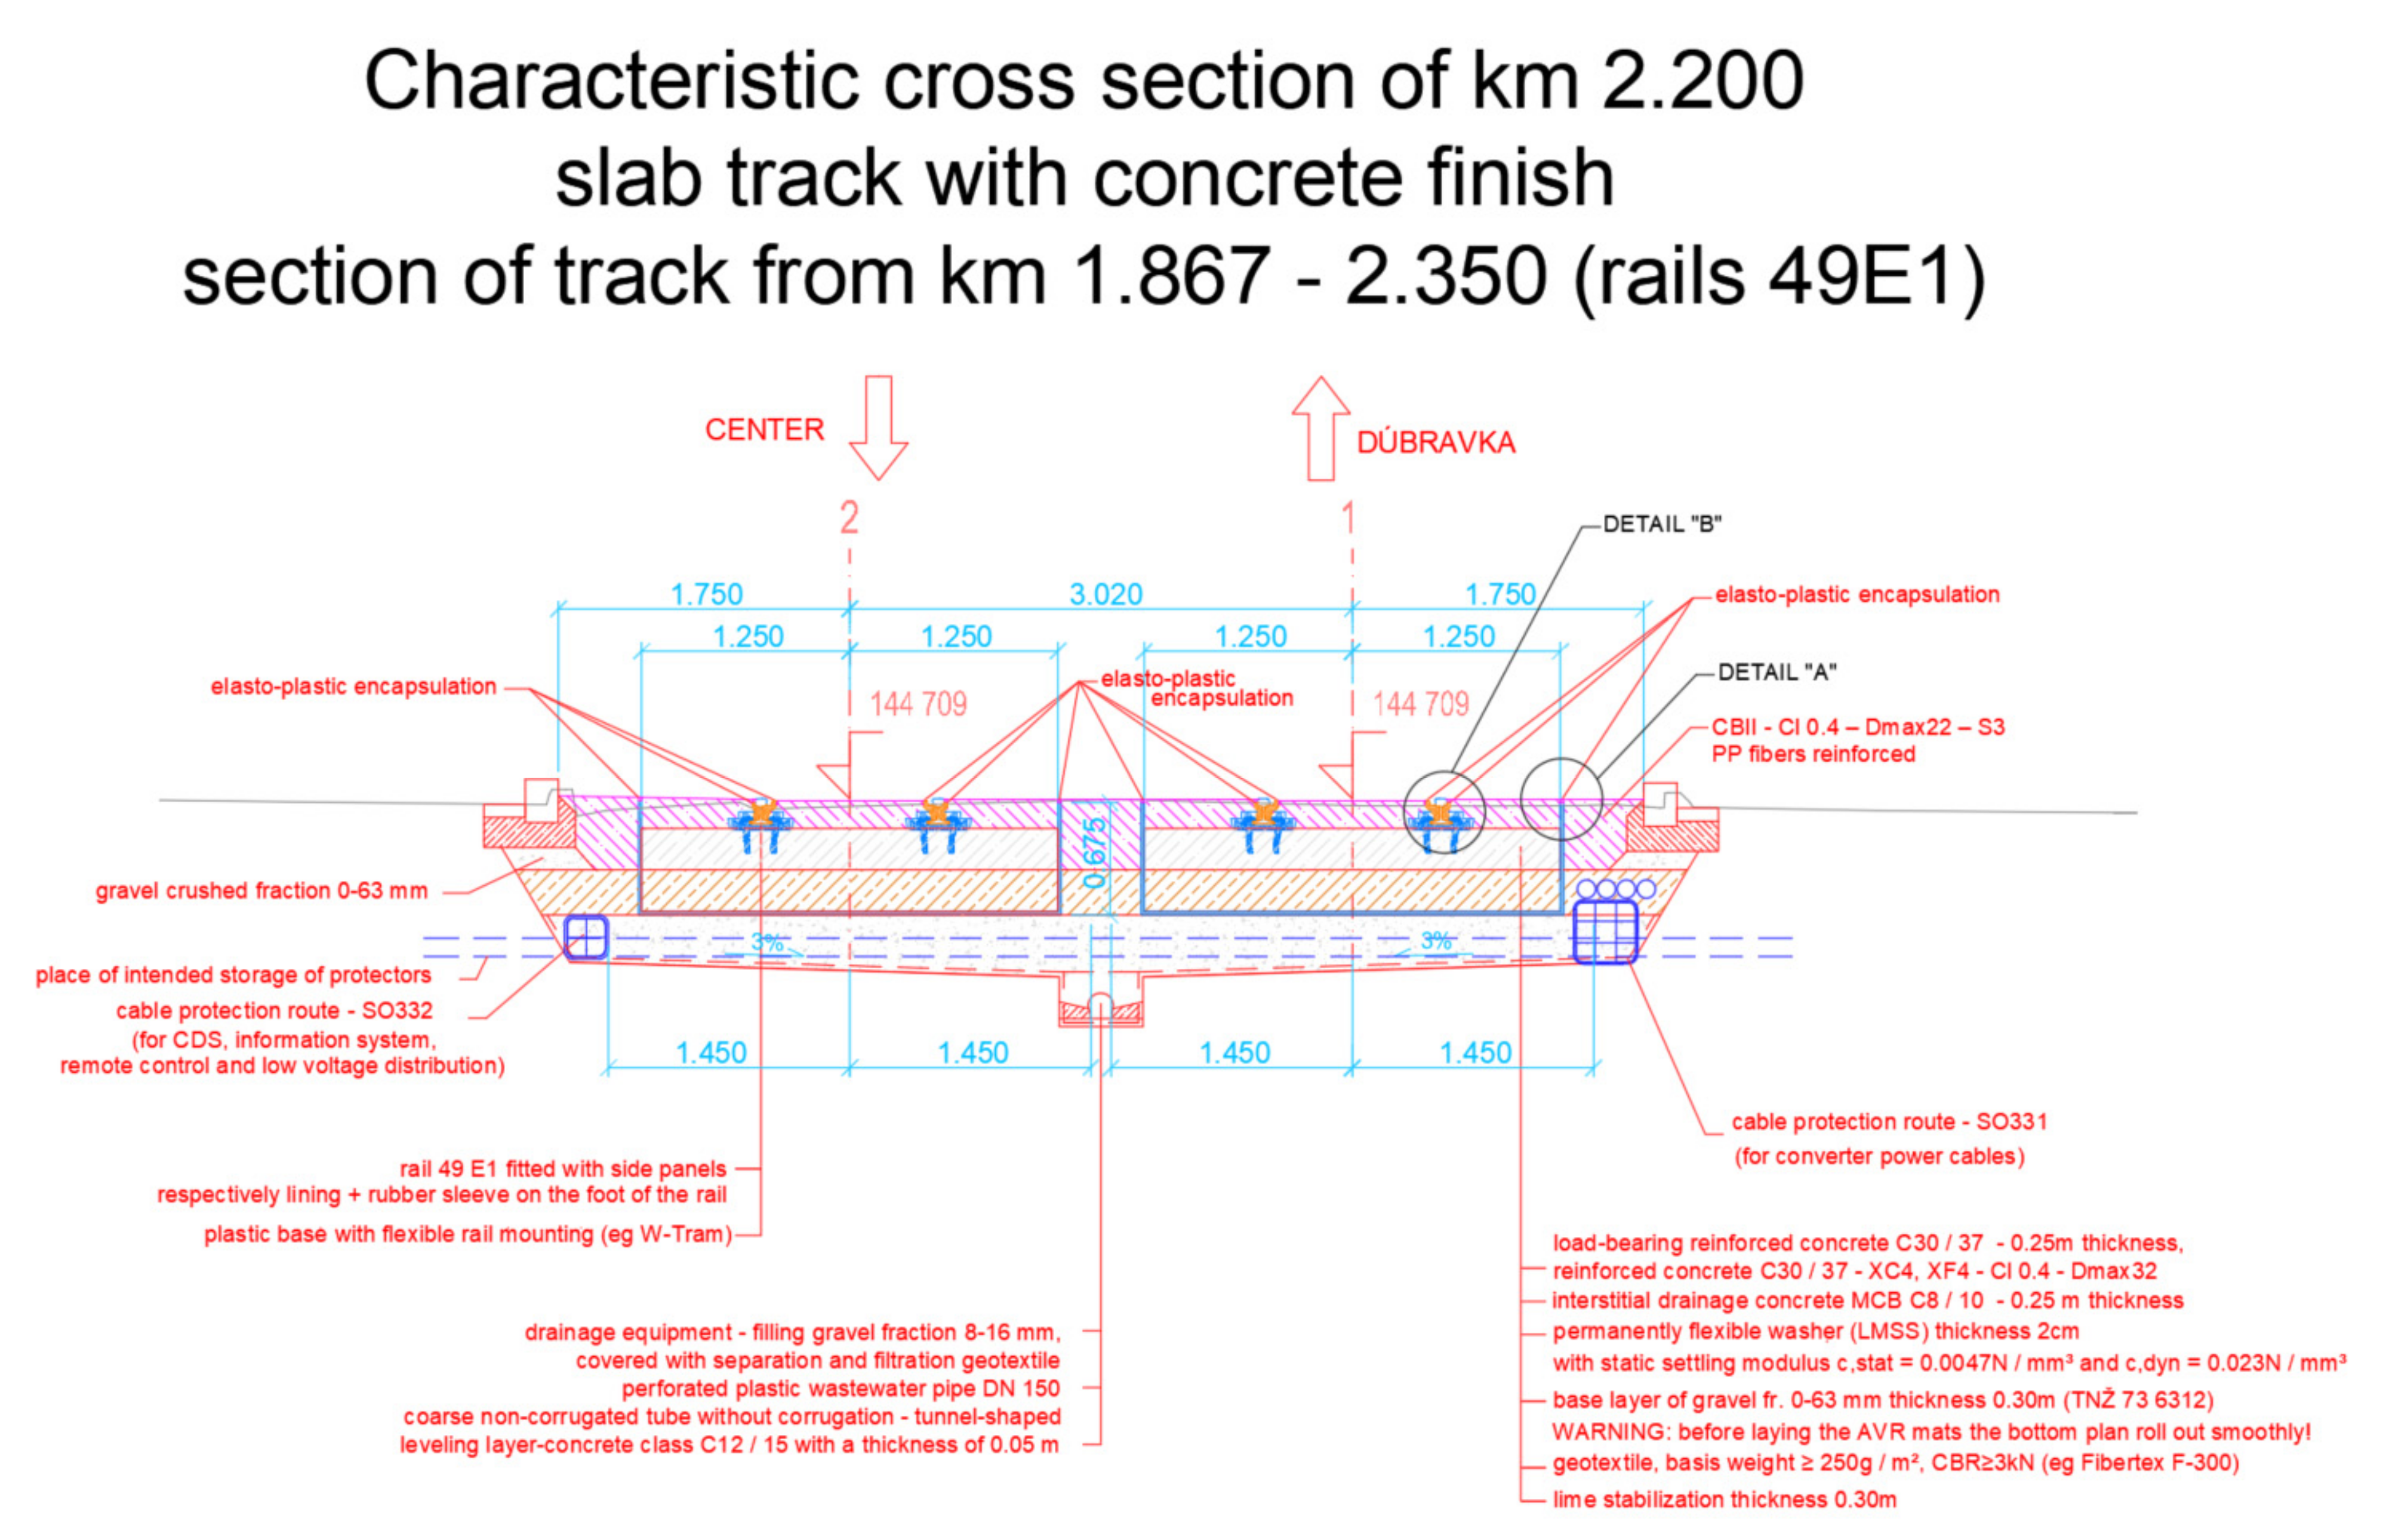
2.3. Modernisation of the So-Called Petržalka Radial—Characteristics of the Tram Line Construction

The modernisation of the tram line in question is based on the concept of the gradual renewal of the railway infrastructure in Bratislava. It aims to increase the performance of urban public transport and improve the comfort and satisfaction of passengers. A turning point occurred in 2003 when the heavy metro project, which started in the 1980s, was rejected. The alternative is a system of “fast trams”—tram rapid transit—running across the Danube from the historic core of the city to the end of the largest residential area in Bratislava—Petržalka—along the route of the originally envisaged metro and connecting it to the existing tram network. The requirement for modernisation resulted mainly from the technically obsolete and thus unsatisfactory condition of the tram line and the signalling elements on the line and the negative impact of the line on the environment (especially in the area of noise and vibration). In connection with the considered combination of the tram line with the TEN-T train transport (construction of a dual gauge line—1000 mm and 1435 mm), the first part of the modernisation of the so-called Petržalka radial was proposed in 2013. The first part of the construction works included the modernisation of the Old Bridge (replacement with a new bridge structure) and the construction of a double-track line in the length of 2.4 km (from the crossing of Štúr and Jesenský Street to the crossing of Jantár Street and Rusovce Road). The second part of the modernisation considers the extension of the tram line to the Petržalka District. Figure 2 demonstrates the modernisation of the tram line section in question [29].
The Old Bridge dates back to the 19th century. After several repairs, it was operated until 2013, when it was closed due to an emergency. As the bridge did not meet the minimum navigable corridor on the Danube River, the original steel structure was replaced by a new one. The new steel construction features a higher bearing on the pillars and a larger span of the main middle field. The tram line is located in the middle of the bridge in a reinforced concrete carriageway and is used exclusively for tram transport and rescue services.
The request for the modernisation of the tram line in question is based primarily on its technically outdated and currently unsatisfactory condition. Structurally, the track consists of 49E1-shaped rails placed on concrete sleepers in an open track bed. In the section of the line from the Karlova Ves turnaround to the Dolné Krčace stop and in the area of the crossings with a cast surface finish, the track superstructure consists of TV rails. NT1 placed on concrete panels on a gravel bed or sleepers in an open rail bed. The section of the line from the intersection of Líščie údolie–Botanická streets to the Molecova stop is the TV rails. NT1 stored on VUIS panels have already been extensively destroyed. In particular, the track sections set up on the panel structures due to their technical condition were a source of high levels of noise and vibration, creating a significant noise load in the areas through which the tram line is led. The effort to modernise the Dúbravsko–Karloveská radial section follows on from the concept of gradual renewal of the railway infrastructure of the Capital City of the Slovak Republic, Bratislava. The main purpose of the construction was to modernise the technical infrastructure of the line to achieve the following requirements:
  • increase in line speed;
  • increase in spatial permeability;
  • increase in the bearing capacity of the track bottom;
  • increase in operational safety;
  • increasing passenger safety;
  • increase the culture, comfort, and fluidity of travel;
  • reduction of negative impacts of rail traffic on the population;
  • improving and upgrading the environment.
The designed technical solutions for the reduction of specific noise and vibration due to operation of trams consisted of
  • the replacement of worn-out tramway structures;
  • the establishment of an open tram superstructure in the section Hanulova–turnaround Karlova Ves with the possibility of covering with absorption panels, which will reduce the conditions for the propagation of noise emissions from tram crossings;
  • the establishment of a fixed carriageway in the section of Karlova Ves with grassing of the track between the associated stops;
  • the considering in curves of smaller radii with the installation of equipment for rail lubrication;
  • the new construction of the Karlova Ves turntable with the removal of tonal noise.
The first part of the modernisation included a complete replacement of the tram substructure, superstructure, and drainage. These modifications were intended to increase passenger comfort and at the same time minimise the negative effects of tram operation (noise and vibration) on the surrounding urban area. There are four barrier-free stops on the route, built as part of the modernisation. In crucial traffic nodes, the stops were designed as integrated combined stops to ensure a minimum collision crossing over parallel roads. The structural elements that most limited the track speed and caused increased noise emissions and vibration were obsolete turnout structures and curves of small radii. Therefore, during the modernisation, new electrically controlled and heated switch constructions, which also allow higher line speed, were built into the track.
The construction of the tram line was implemented uniformly along its entire length as a ballastless track (slab track). Under the layer of drainage concrete, a sub-ballast layer of crushed aggregate fr. 0/63 mm, thickness 0.30 m was placed. Due to the poor support and the unsatisfactory material composition of the subgrade surface, its lime stabilisation with a thickness of 0.30 m was implemented. Fibertex F300 nonwoven PP geotextile was applied to the stabilised subgrade surface.
The track superstructure, designed as a ballastless track, consists of rails of shape 49E1 (S49) or grooved rails (60Ri2), covered with rubber rail dumper to limit the propagation of noise and vibration, also enclosing switch structures.
In the construction of the track superstructure, there are always two adjacent rail strings that allow a dual track of 1000 mm and 1435 mm, i.e., with four rails in each direction. Switch structures are made of 60Ri2 groove rails, while the turning radius in interchanges is R = 50 m. All switches are also mounted on the ballastless track structure.
Water from the rail grooves is drained by point drains (in the case of concrete surfaces with a groove rail, water is drained by combined drains—both the groove of the rail and the surface of the carriageway).
Rainwater from the tram line drained by the drainage system into sewerages or infiltration shafts does not need to be additionally treated with an oil separator (ENT), as only electrically driven units will be operated on the tram line, and there is no risk of oil leakage.
The rails are fixed on plastic W-TRAM baseplates with a flexible clamp Sk121 on a reinforced concrete slab made of reinforced concrete C30/37 (ballastless track) and are thermite welded to each other into long rail strings. The reinforced concrete slab is 0.25 m thick and 2.5 m wide, having a separate structure under each track. The support plate is reinforced with steel reinforcement except in areas where track circuits are applied to control the switches. These areas are reinforced with fibreglass reinforcement. Under the load-bearing reinforced concrete slab, there is a permanently flexible pad PURASYS MSS P 2020, 20 mm thick (material—mixed cellular polyurethane elastomer). The reinforced concrete slab of the ballastless track is placed on a layer of interstitial drainage concrete MCB C8/10 with a thickness of 0.25 m. L-shaped prefabricated parts were installed at a distance of 1.75 m from the axis of the adjacent track to separate the tram cover and the adjacent terrain.
The track layout and construction of the tram lines are depicted in Figure 3 and Figure 4.
Rail lubrication devices were installed in small radius curves. Moreover, to eliminate noise and vibrations on the track, the 49E1-shaped rails (on NT1-type crossings) were fastened to concrete sleepers equipped with sub-sleepers with elastic-plastic properties using a flexible fastening of the VOSSLOH Skl type 14, welded to a contactless rail. To capture secondary vibrations from the operation of the tram line more efficiently, a sub-ballast damping mat was placed directly under the ballast bed. In the sections of the track, where the space conditions allowed it, the areas between the tram line and the parallel roads were covered with grass, which was also a measure to reduce noise emissions.
The tram line in the modernised section (except for the section led on the Old Bridge) is run on a separate substructure and permanent way parallel to the city roads. Therefore, in addition to tram crossings, road traffic also becomes a source of noise and vibration in the affected area. However, car traffic in the modernised section is of low intensity and consists mainly of passenger cars, the dynamic effects of which are negligible compared to tram traffic. Noise from car traffic depends on the car speed and the degree of utilisation of its engine, which can increase the overall noise levels. For this reason, noise from tram transport is considered in combination with noise generated by road traffic. The assessment of the noise situation in the external area of the area of interest was performed in accordance with the Act on the Protection, Support and Development of Public Health of the National Council of the Slovak Republic no. 355/2007 and Decree of the Ministry of Health of the Slovak Republic no. 237/2009 Coll. [2] (Supplements the Decree of the Ministry of Health of the Slovak Republic No. 549/2007 Coll.) that establish the permissible values of noise, infrasound, and vibration in the environment. The assessment of the discussed section of the modernised tram line for noise and vibration is the subject of another part of the article [32].

3. Noise and Vibration Effects of Modernisation

In connection with the tram line modernisation in Bratislava, a vibroacoustic study was prepared in designated localities. It contains the results of measured noise and vibration levels caused by the dynamic effects of vehicles running on tram lines in the Slovak capital. It also includes an analysis of all experimentally obtained results. These measurements were performed in two selected localities along the tram line route on Štúr Street and the Old Bridge over the Danube in Bratislava.

3.1. Experimental Measurement on Štúr Street

At the time of the experiment, the temperature from 24 to 26 °C and the northwest, variable wind 2 to 5 m/s were recorded. The choice of this location was related to the reconstruction of a double-track tram line with a gauge of 1000 mm, run in a separate substructure and permanent way in parallel with the city road (Figure 5).
The dominant noise effects in the location are caused by tram and road traffic. The intensity of car traffic is low and the resulting dynamic effects are negligible, while the passage of trams has a more significant effect. At the time of the measurement, several types of trams were operated on the line. Older noisier construction types Tatra—T3G, K2, and T6A5 were supplemented by more modern types, Škoda—29T and 30T ForCity Plus (Figure 1). Noise from their passage is significantly affected by several factors:
  • technical condition of the tramway (overall track layout and geometry, quality of rail joints, corrugation of rails, stability, and overall condition of track switches);
  • track substructure.
In the case of the carriageway imperfections, various dynamic impacts occur during the driving at the wheel-rail contact, while the noise level is also affected by its routing in the terrain in the traffic area. Concrete slabs, for example, cause the membrane effect of its radiation, and this phenomenon is also associated with the formation of vibrations. The resulting vibrations propagate through the material half-space as surface and shear waves from the source and their character is stochastic, with variable power in time and space. In addition to noise levels, it is, therefore, necessary to determine the intensity and frequency spectrum of the vibrations of the tram line subsoil and the adjacent geological environment. From this space, the vibrations spread to the foundations of the tram line buildings.

3.1.1. Objectives of Experimental Measurements

The first objective of the experimental measurements was to determine the current noise situation by measuring the noise in the location and defining its levels from the passage of individual tram sets. The measuring points were determined objectively regarding the monitored surrounding buildings.
For each measurement, especially the level parameters as defined in the following apply:
  • LAeq—A-weighted continuous sound level for continuous sound signals;
  • LAFmax—maximum sound pressure level during the measurement interval.
The time-averaged sound pressure level (equivalent continuous sound pressure level) is obtained using (1).
L e q = 10 log 1 T 0 T p t 2 d t p 0 2
where
  • Leq—the time-averaged sound pressure level (equivalent continuous sound pressure level) in dB;
  • p(t)—the sound pressure in Pa;
  • p0—the reference sound pressure;
  • T—the averaging time in s3
The second objective was to measure vibrations in the vicinity of the foundation structures of a residential building in a given urban and geological location. Specifically, the following quantities were surveyed:
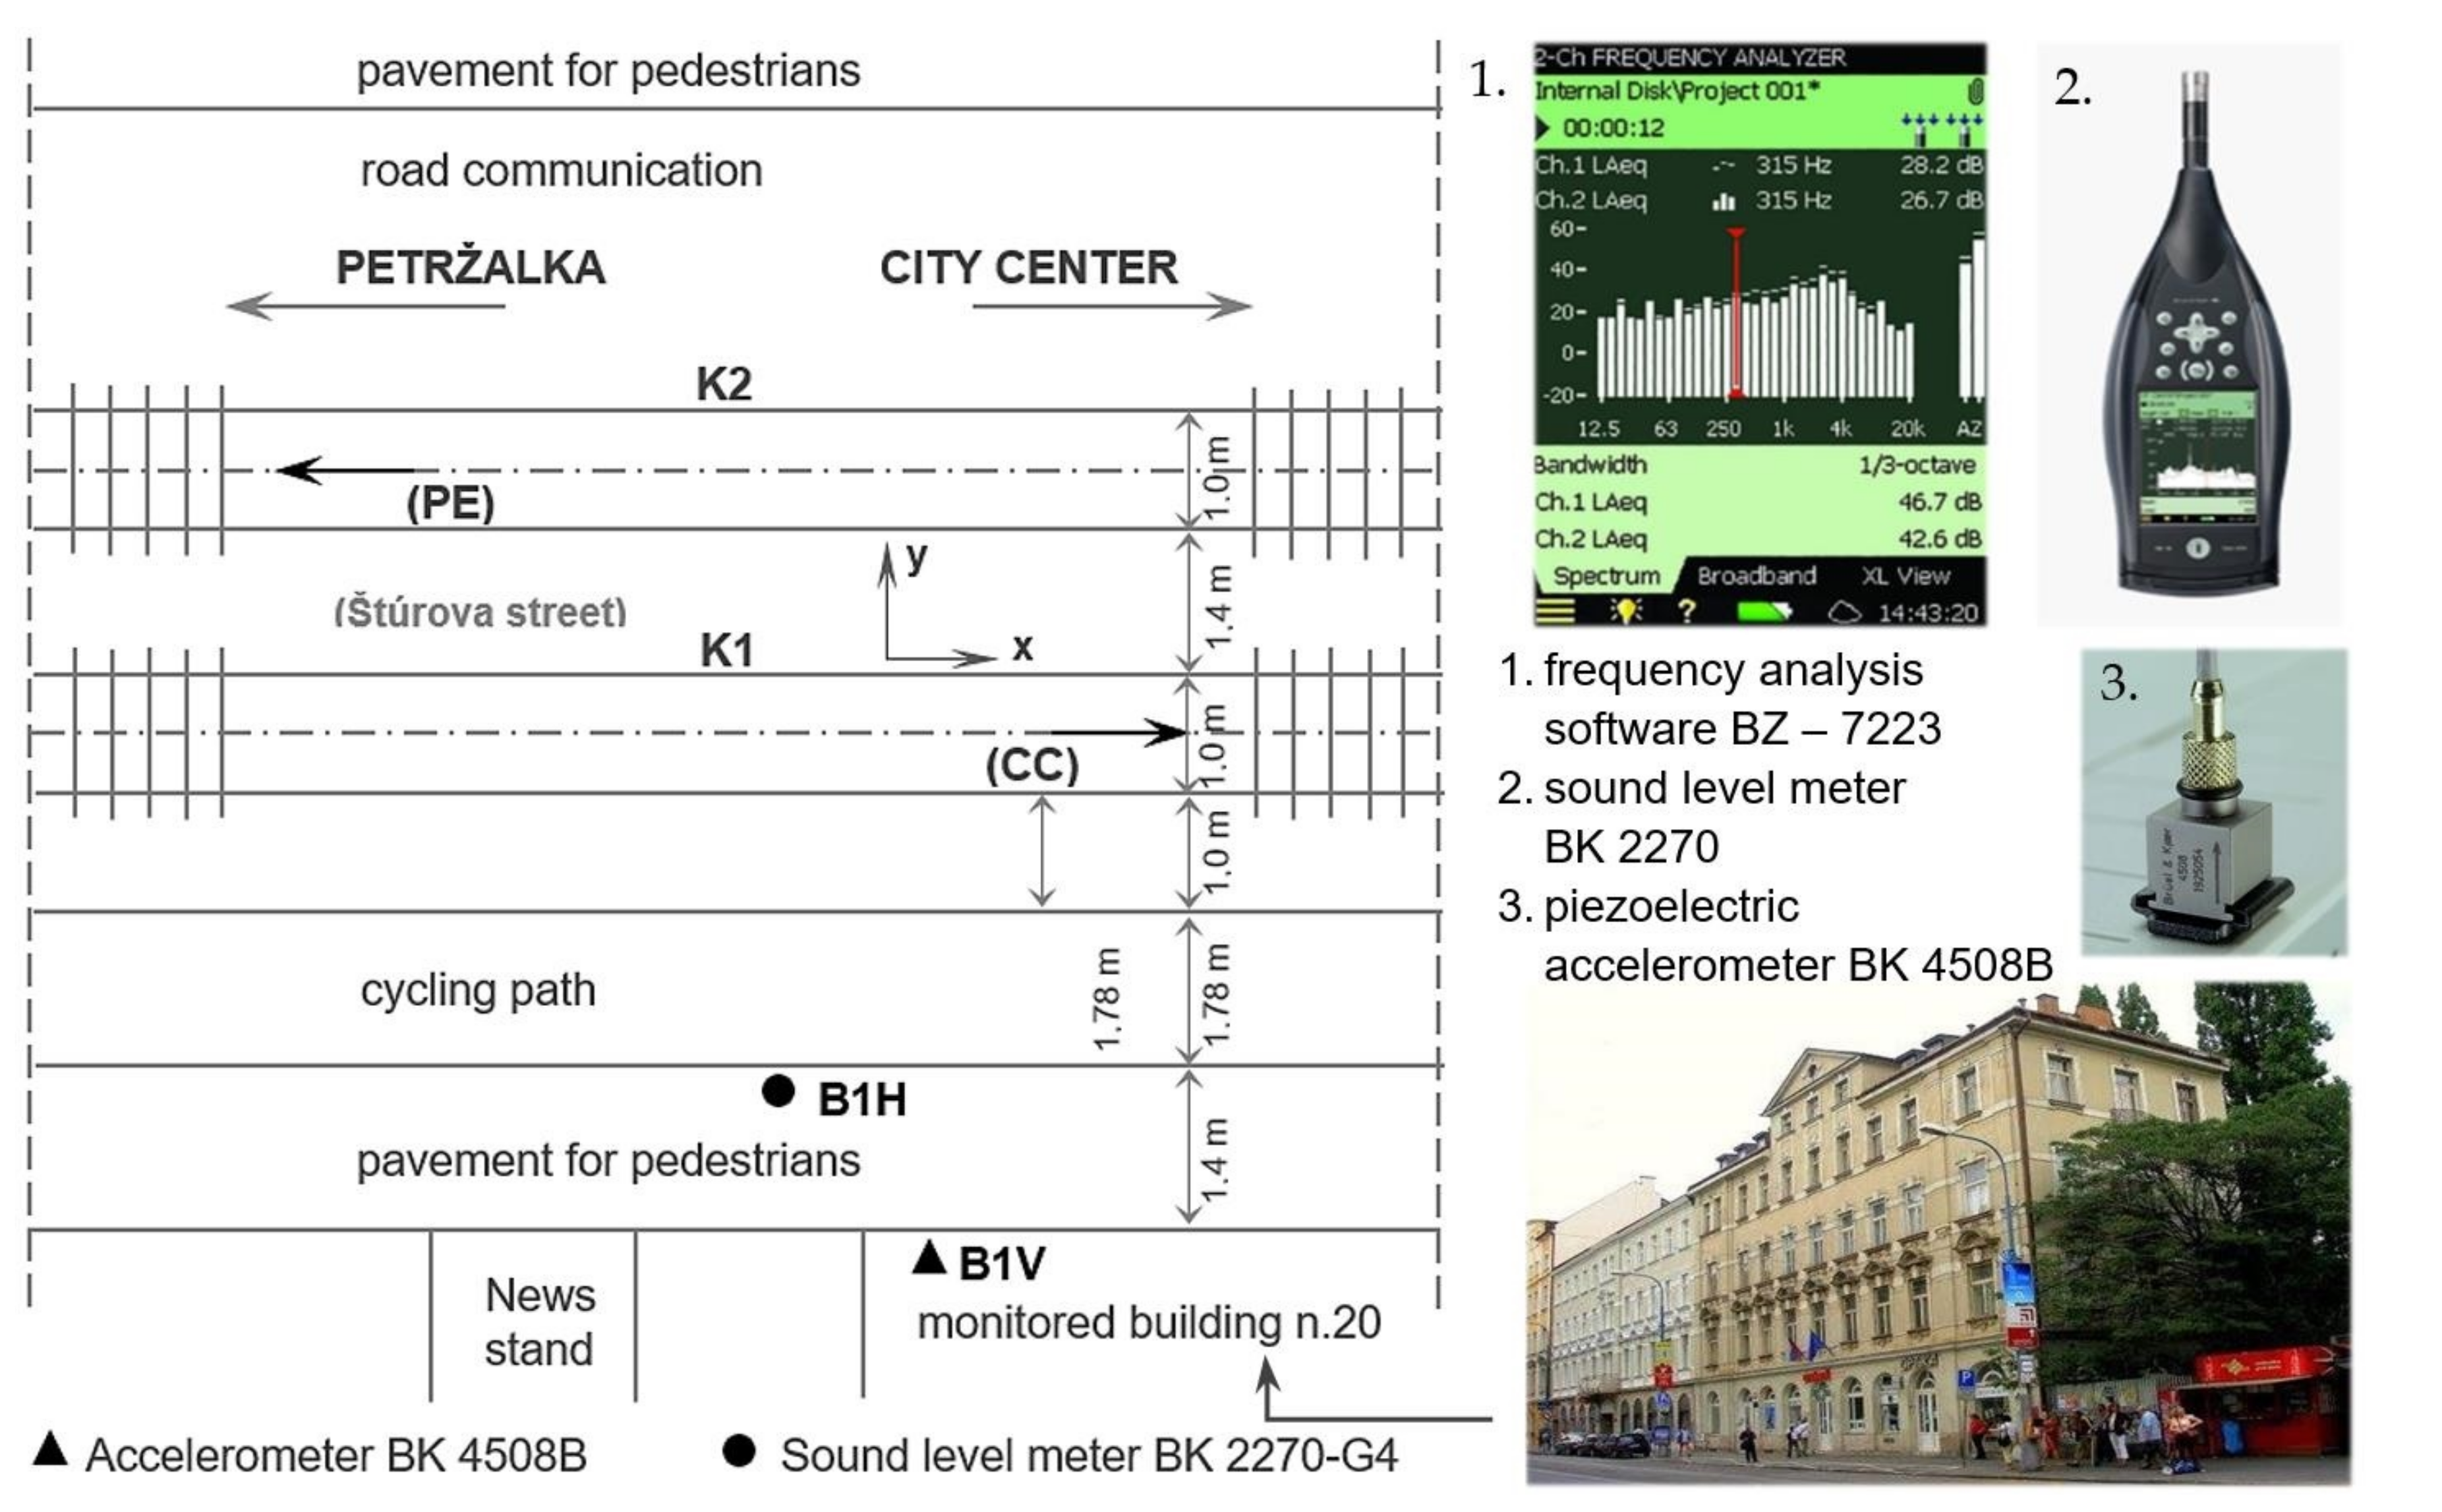
  • vibration levels on the foundation structure of building no. 20 (Police of the Slovak Republic), and the results were evaluated by methods of statistical analysis;
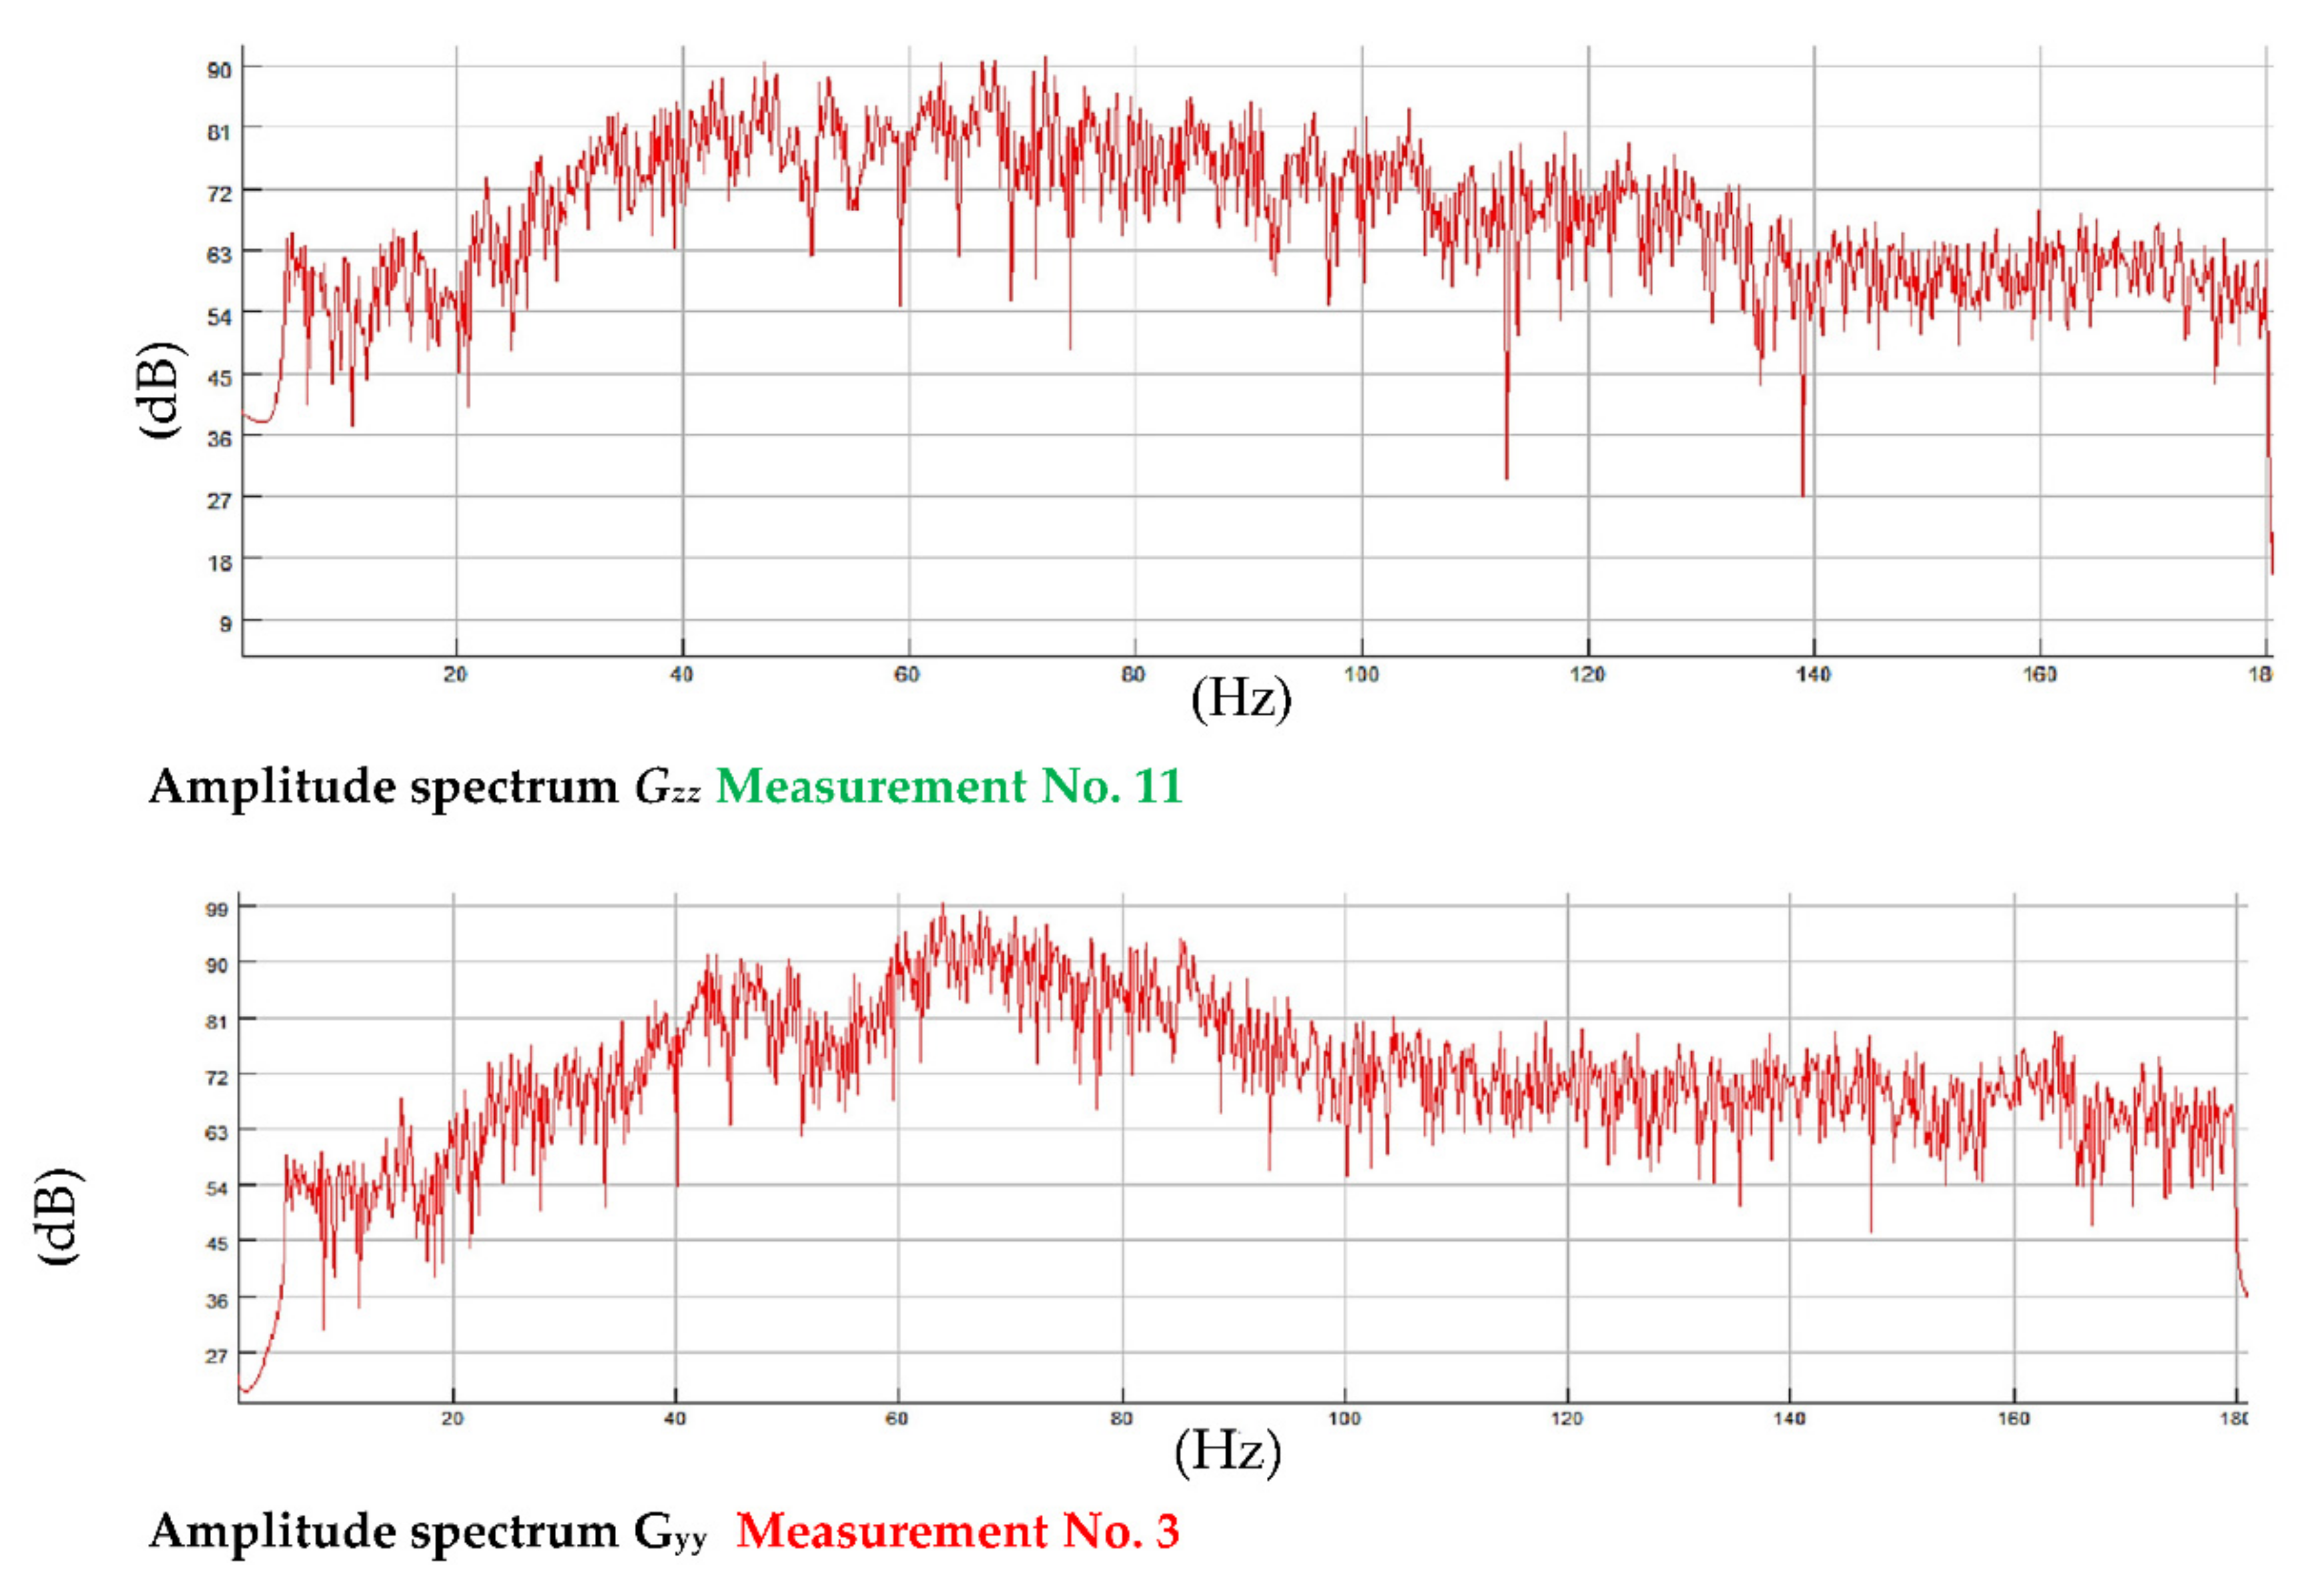
  • frequency characteristics of vibration amplitudes at point B1V on the selected building (to determine the frequency spectrum of the vibration of the subsoil generated by the tram passage—application of spectral analysis);
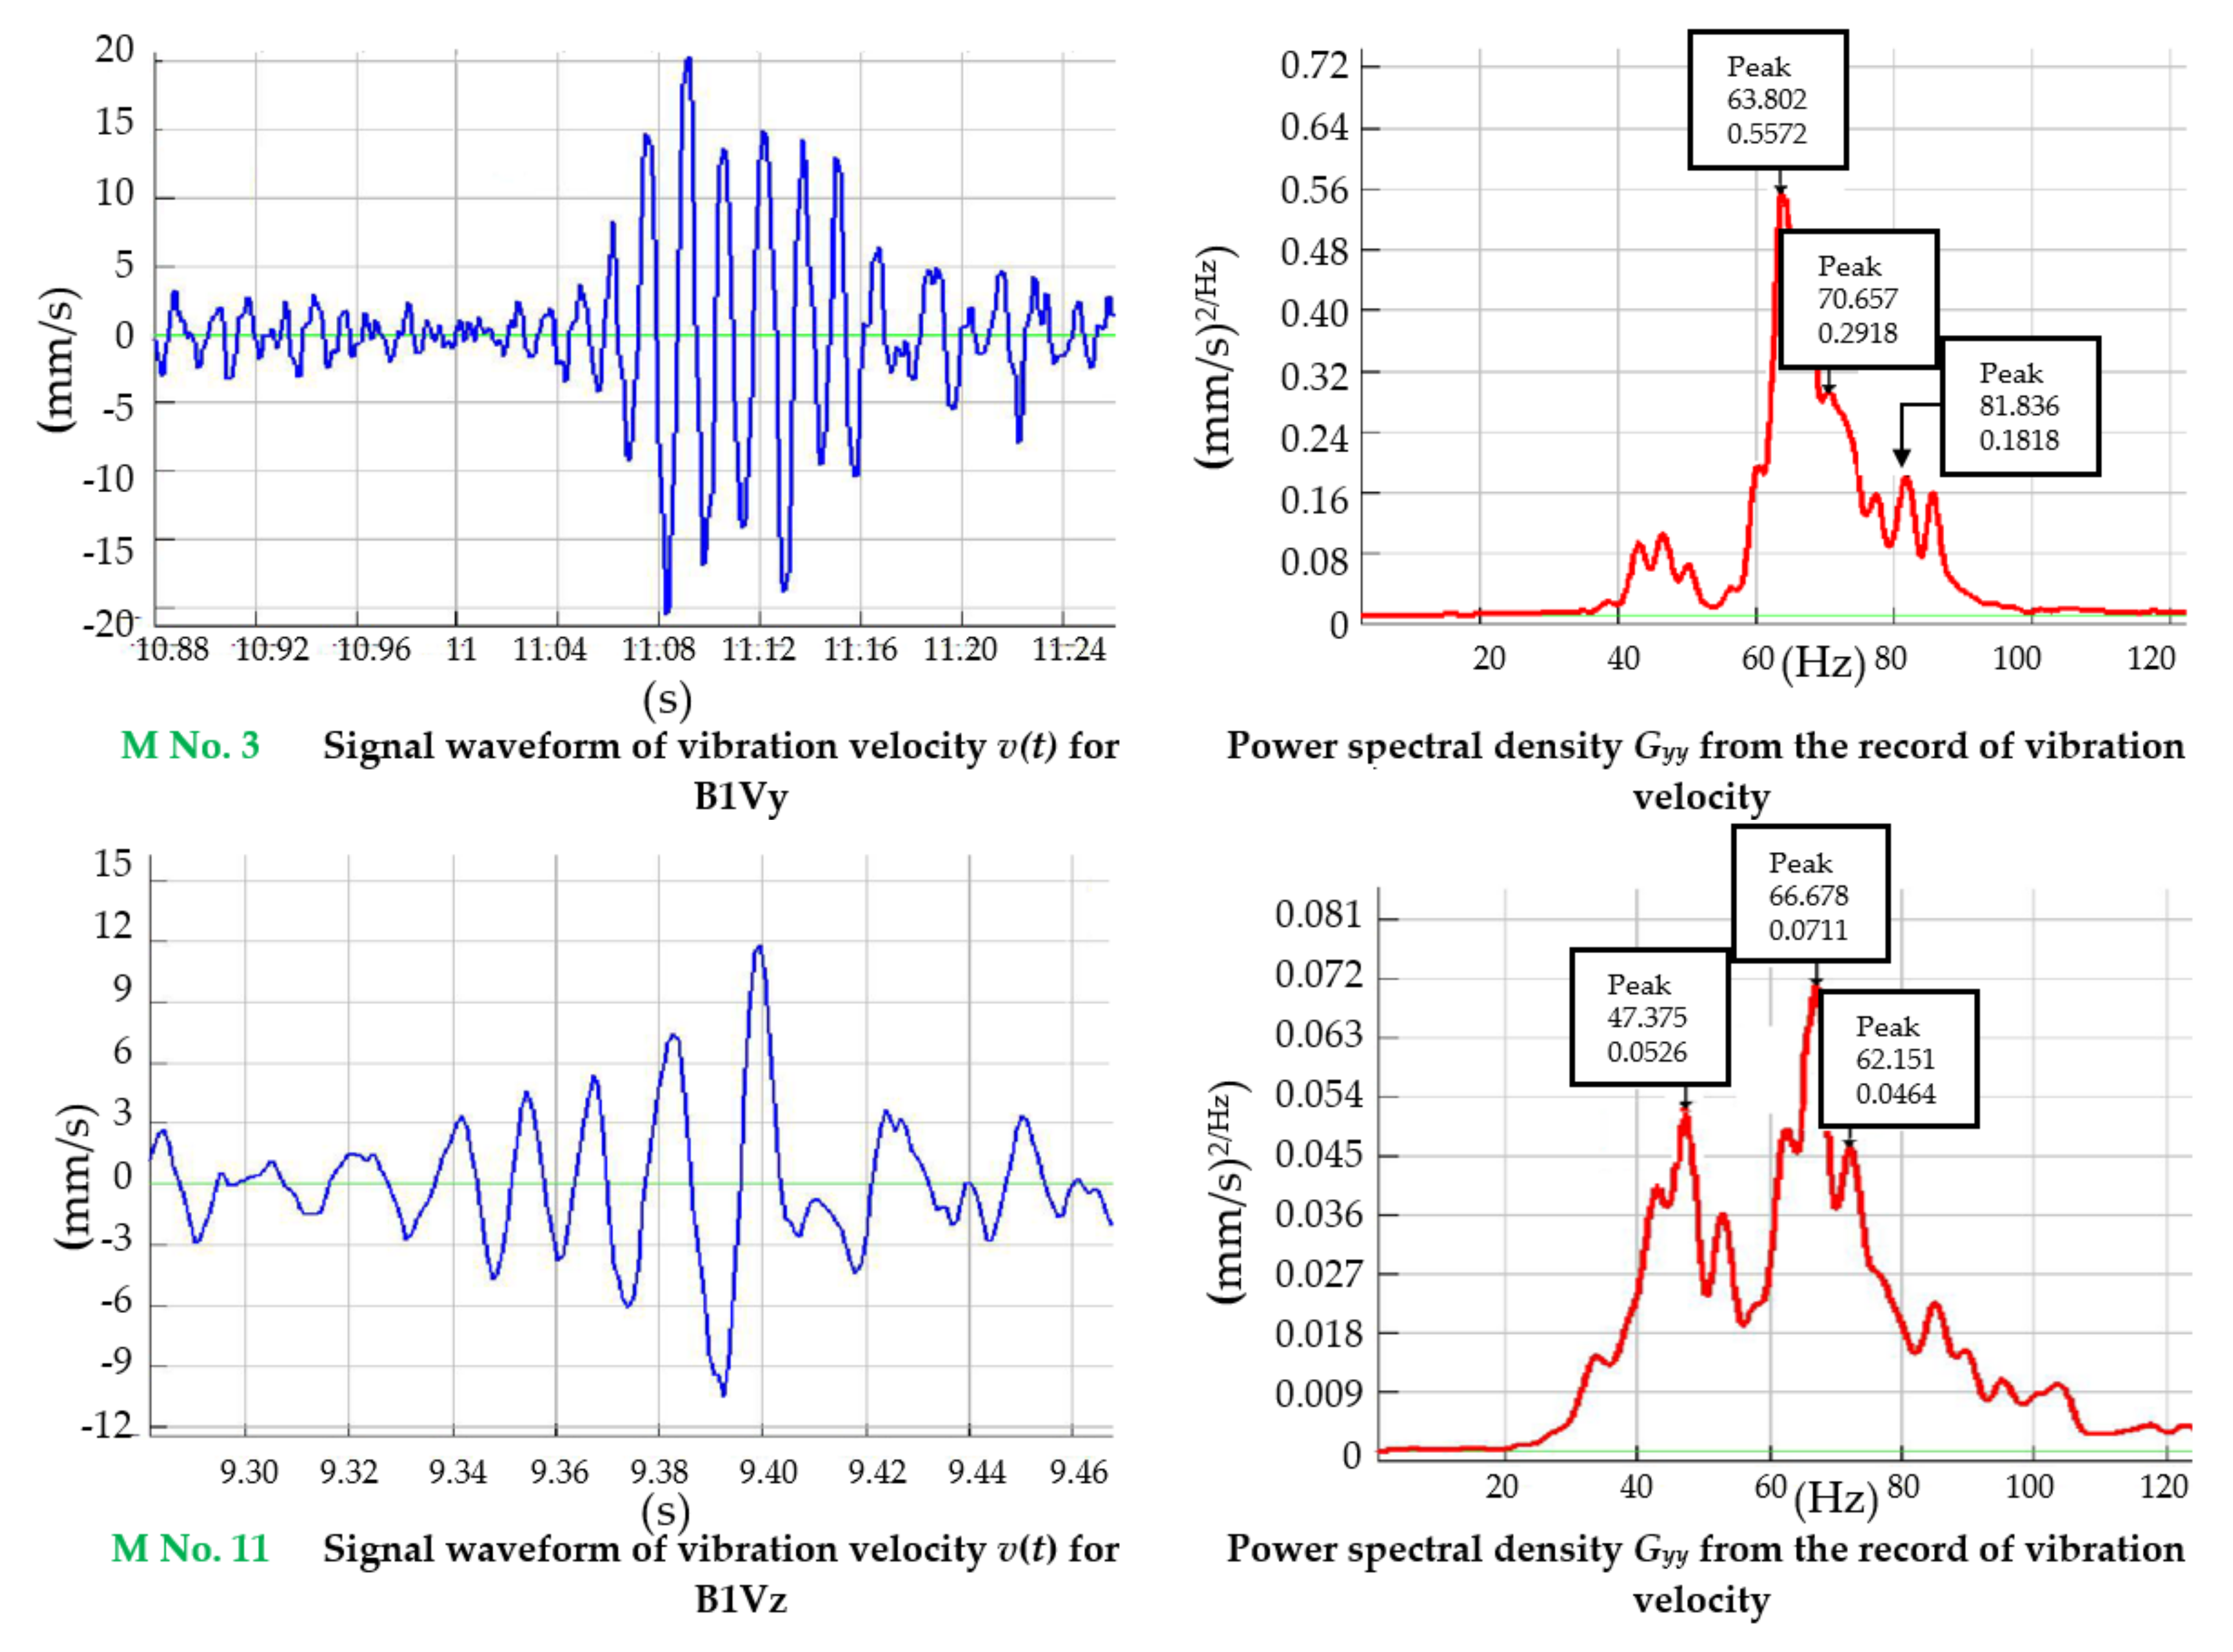
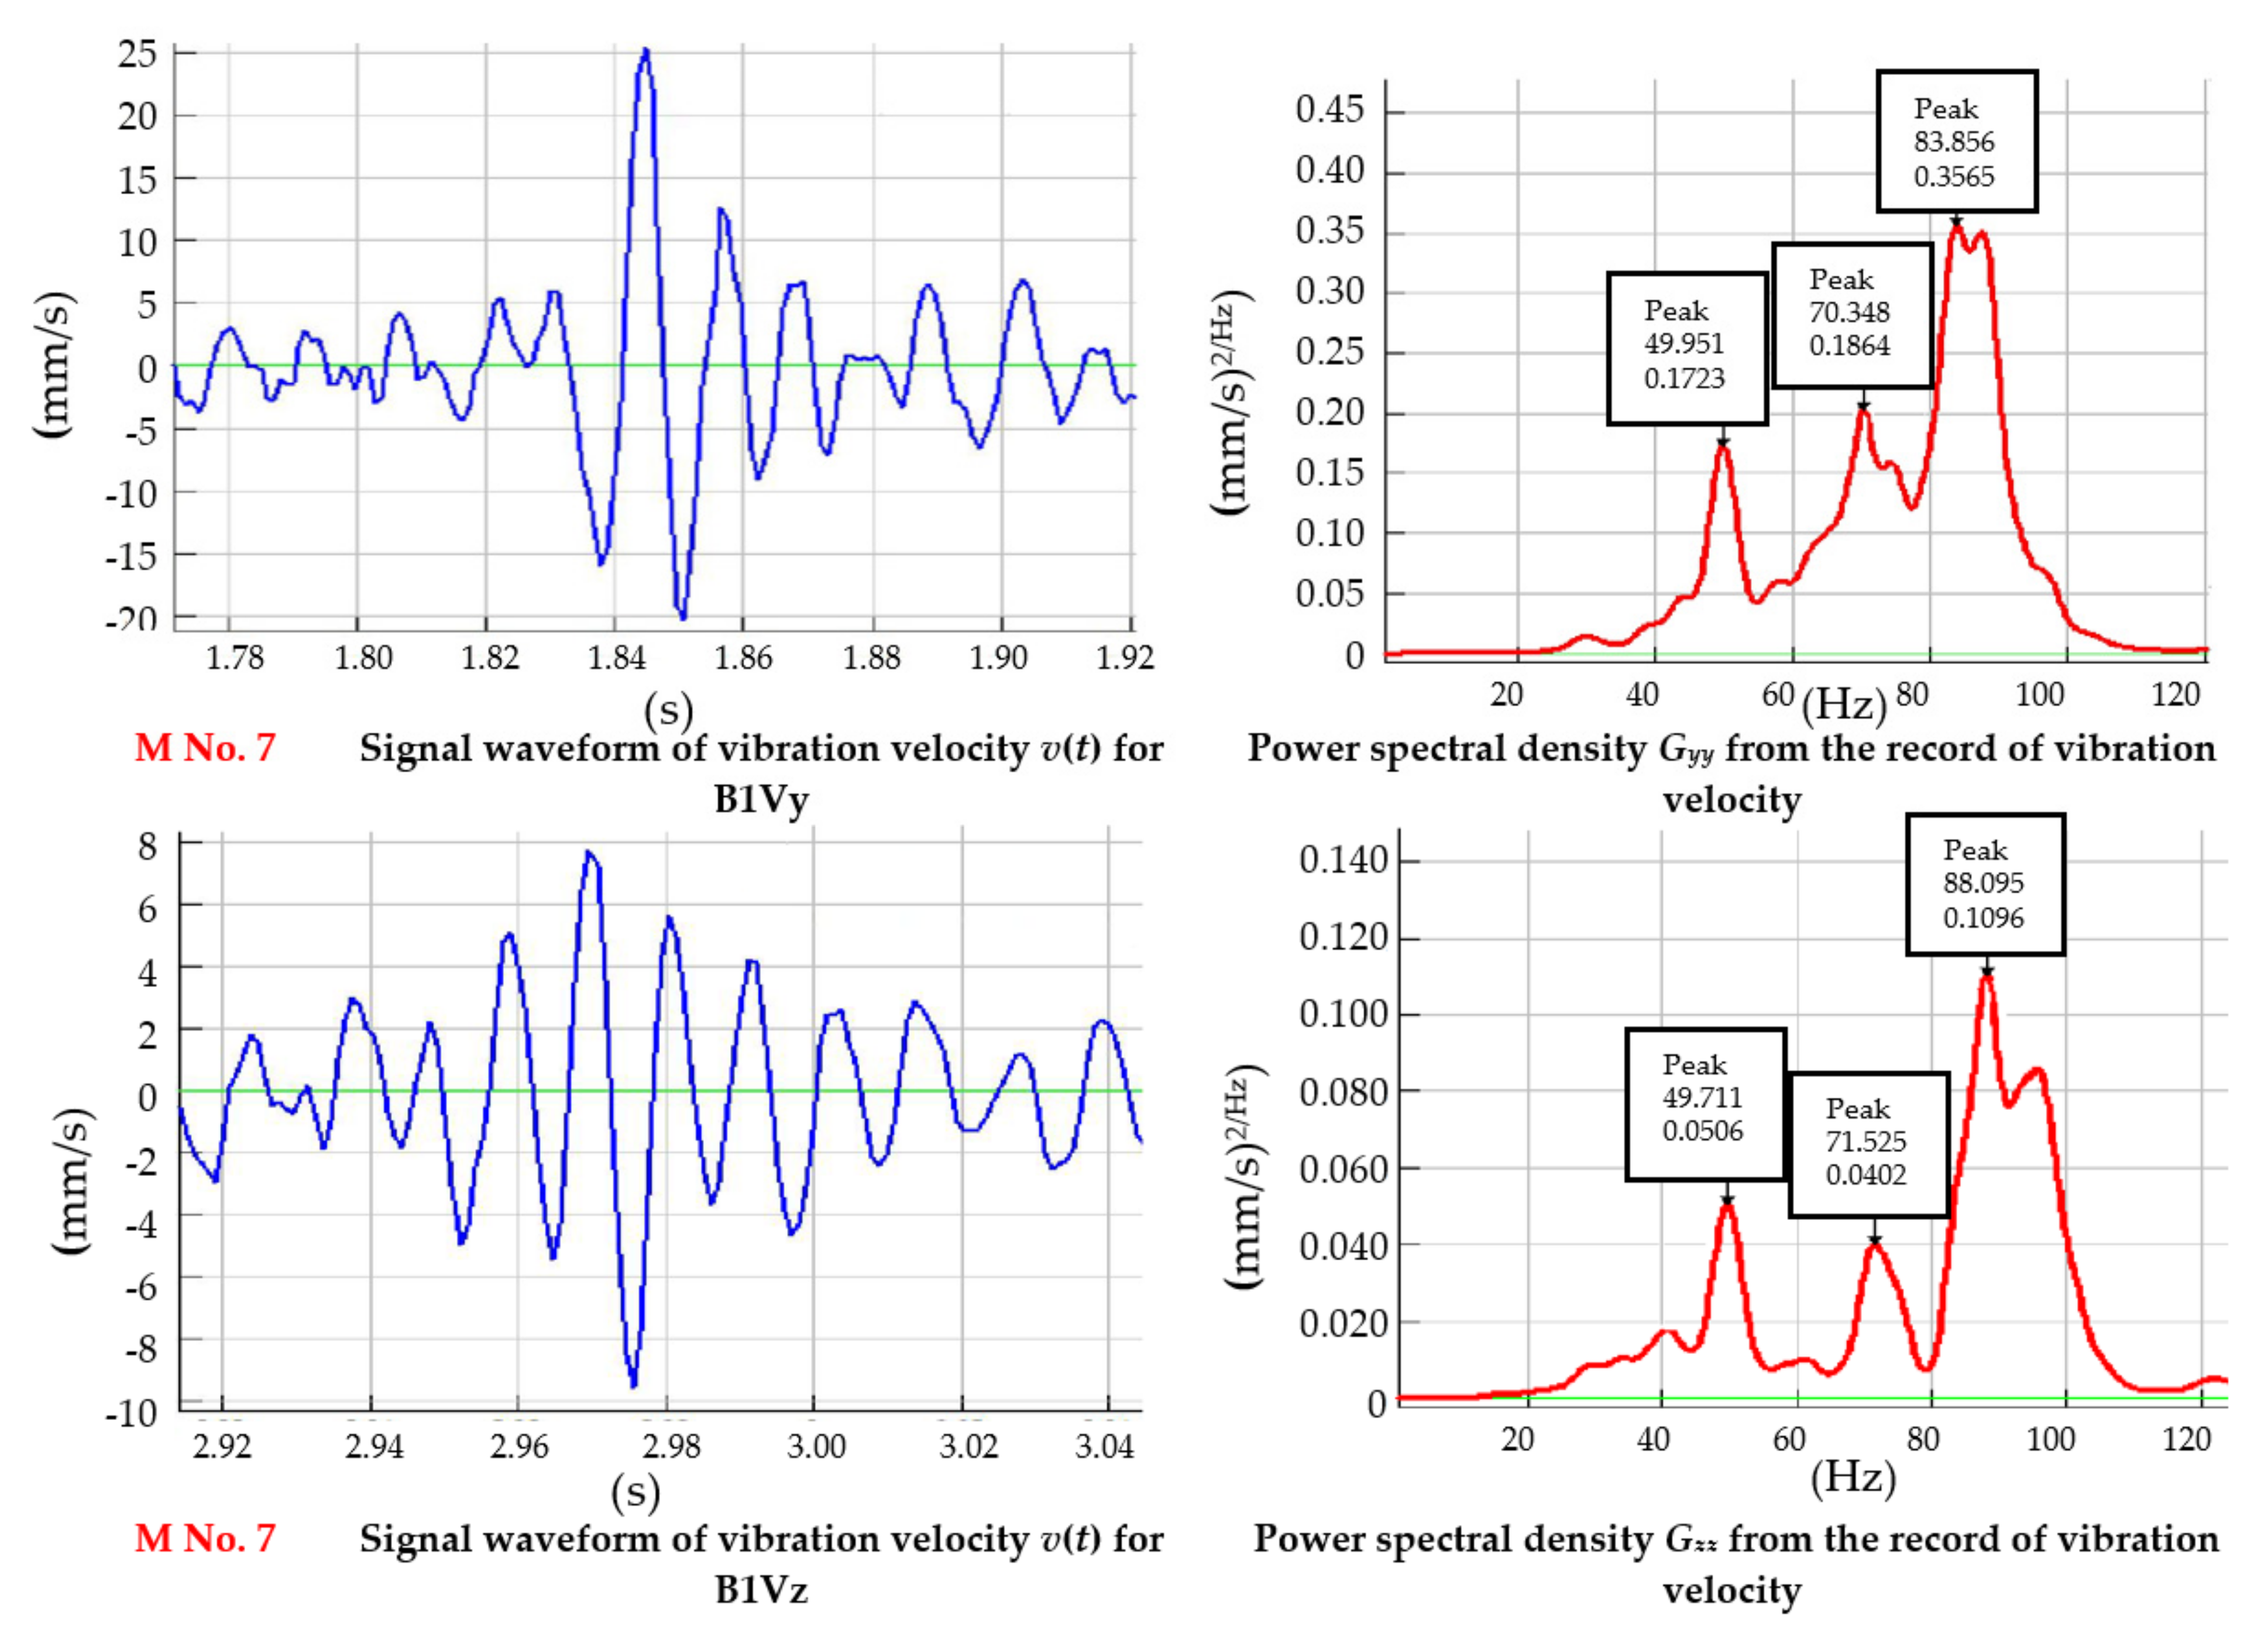
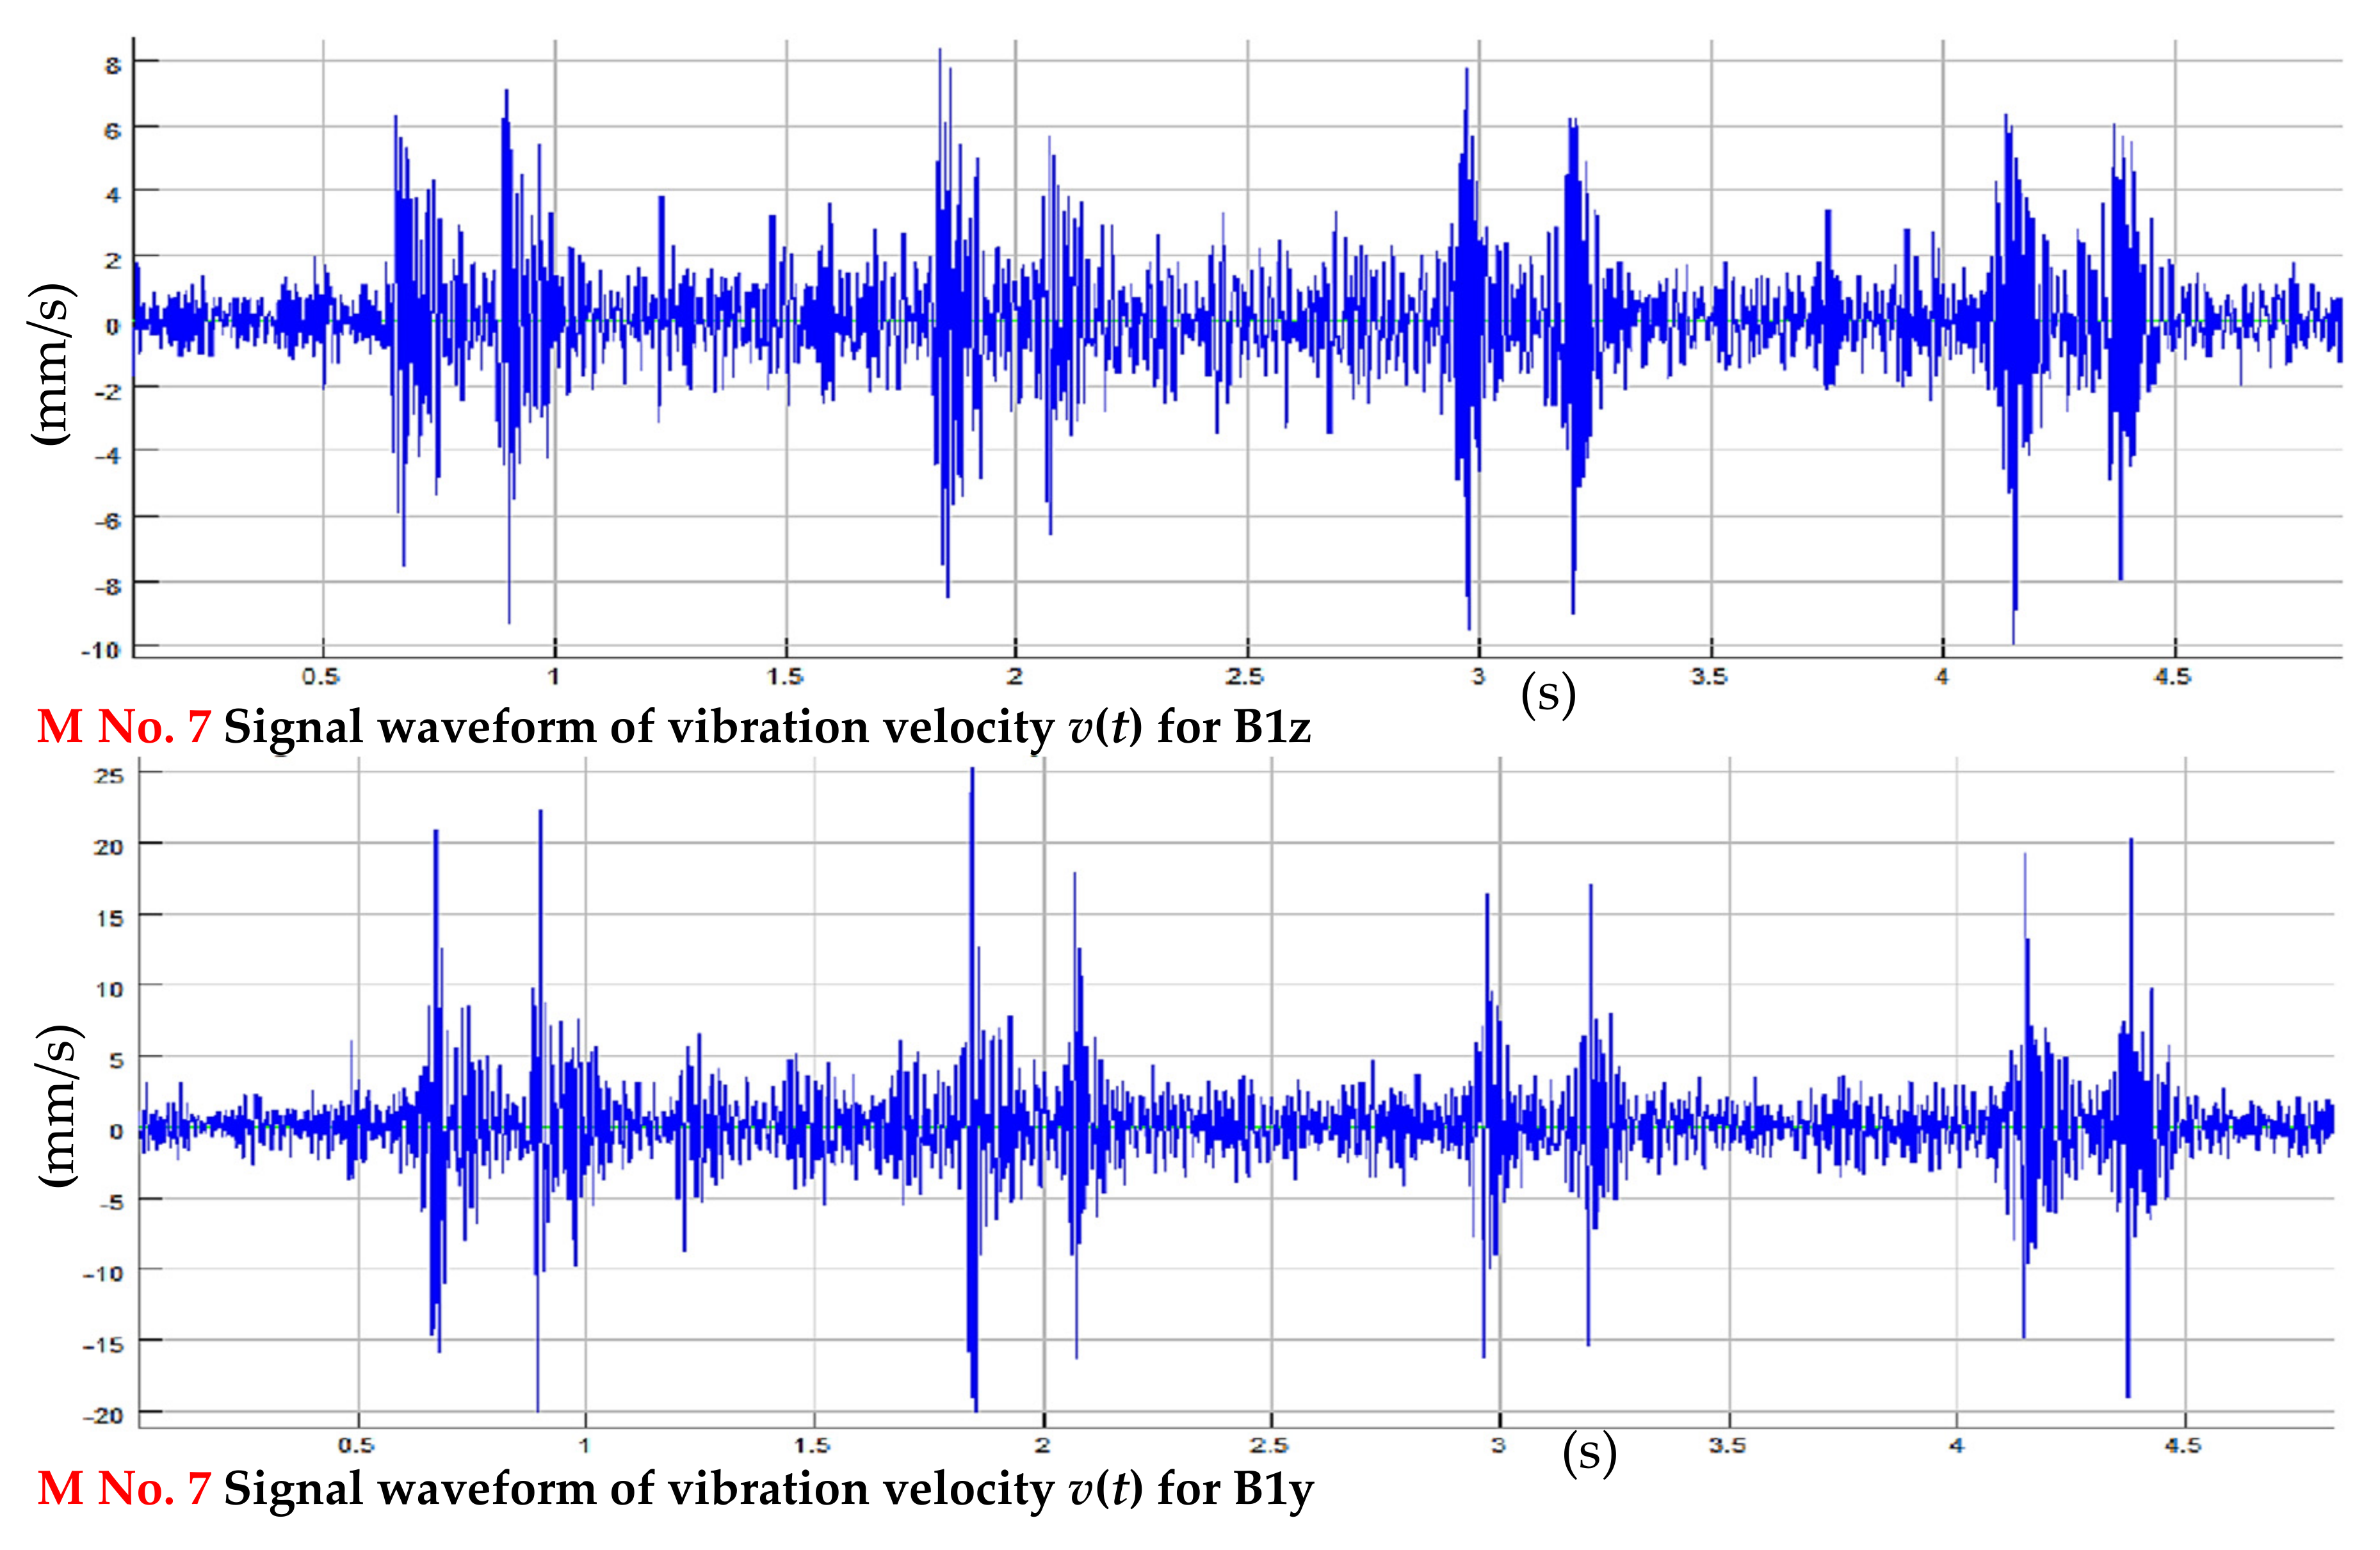
  • vibration time histories in (t), recorded by a set of accelerometers in the vertical direction z and horizontal direction y perpendicular to the axis of the tramway (sensors marked B1Vz, B1Vy).
Measurement functions vrms and vmax are a means of expressing vibration in absolute value on the basis of measured waveforms. The root mean square value of the instantaneous values over a period of time refers to the power of the wave. The vrms value of the velocity is one of the important factors for diagnosis. This value of the vibration velocity is obtained by using (2).
v r m s = 1 T t 1 t 2 v t 2 d t
where
  • vrms—root mean square value of the instantaneous values over a period of time;
  • v(t)—the vibration speed;
  • T—the averaging time.
Peak amplitude vPEAK is a peak value in a certain time duration. It is used to measure shocks or waves which are rather stable (3).
v P E A K = m a x v t
The following mathematical Formula (4) is used to calculate the PSD (power spectral density) of the vibration velocity. It is a standard equation based on the Fourier transform.
G x x = 0 v t e i 2 π f t d t 2
Since the processing of the results deals with digital data, all the above formulas are used in discrete form. That is, integrals are converted into sums and continuous functions into data sets in time samples with sampling frequency.

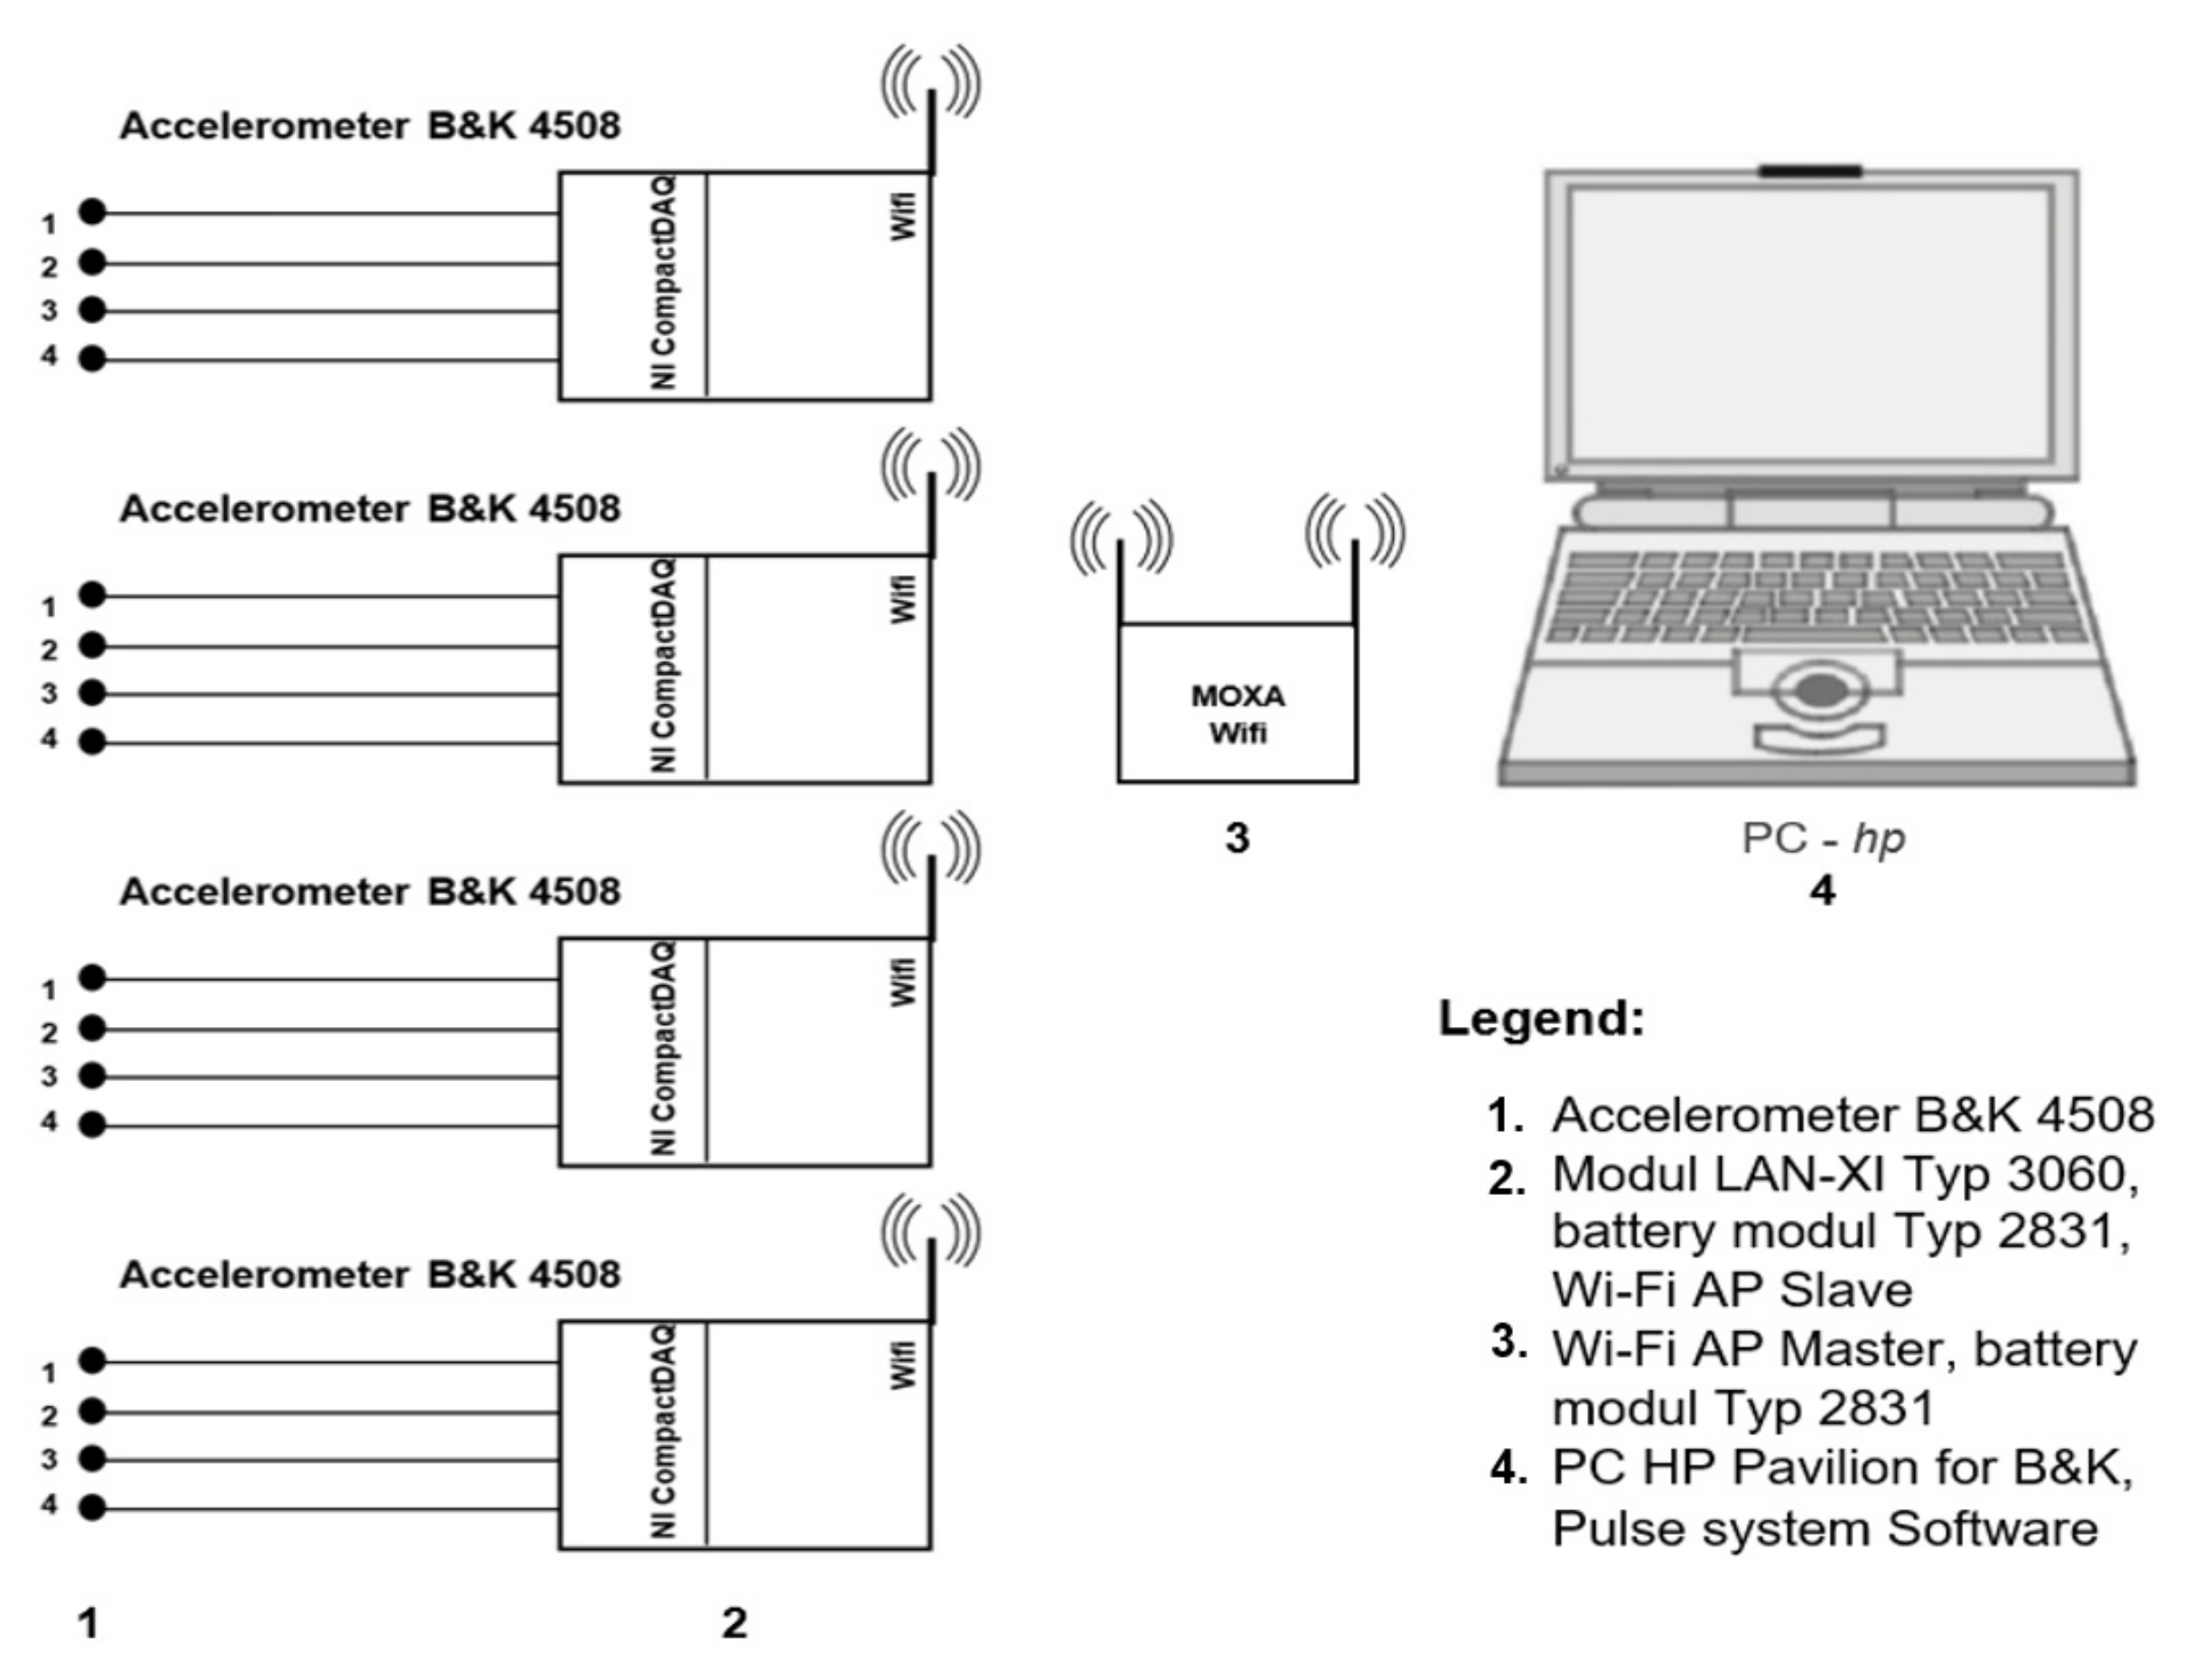
3.1.2. Measurement Methodology and Measuring Line

All measurements were performed in the first stage of measuring accuracy with an automatic measuring apparatus. The selected methodology complied with the set conditions of the relevant legislative documents [7,8,9].
Figure 5 schematically demonstrates the position of the two measuring points B1H and B1V. Two independent measurement sets were applied. An assembly with a precise integrating sound level meter for measuring the noise situation was placed in place B1H. The system uses verified acoustic software by Brüel and Kjær (BK) [34,35]. Its distance from the nearest tram line track (K1) in the direction of Petržalka-Centre is about 3.0 m. The track of the K2 tram line in the direction of Centre-Petržalka is about 5.4 m away from point B1H. The set for measuring noise effects included a BK sound meter type 2270-G4 with modules for sound level meter BZ—7111, octave frequency analysis BZ—7223, and time recording BZ—7224; measuring microphone BK, type 4189; and acoustic calibrator BK, type 4231.
In order to obtain objective dynamic results, a specific measurement and evaluation line was set up at the B1V point. The set for measuring dynamic effects included the BK 4508 B accelerometer, LAN-XI module type 3060, battery module Type 2831, Wi-Fi AP Slave, Wi-Fi AP Master, battery module type 2831, and PC HP Pavilion for B&K (Figure 6). The accelerometer for measuring the level of vibrations from the operation of the tram line was located on the foundation structure of the building at pavement level. Its distance from the nearest track ET (K1) is approximately 4.2 m, and the track K2 is approximately 6.6 m from B1V.

3.1.3. Results of Experimental Noise Measurements

From the above-mentioned acoustic sources, trams, in addition to the results of direct measurement in situ, the relevant acoustic quantities were processed numerically by computer. Their designation is provided by the Brüel and Kjær software.
  • LAFmax—maximum achieved weighted noise level in the measured interval in dB (A);
  • LAFmin—minimum achieved noise level in the measured interval in dB (A);
  • LCpeak—max. peak noise level reached in dB in the recording interval at the weighted C sound level meter function;
  • LAeq—equivalent continuous noise level in dB at weighted function A;
LZFmax, LZSmax, LZFmin, LZSmin, LZeq—spectral characteristics based on complete spectral statistics of time histories of noise levels at the weighted frequency function Z (A, B, C).
A series of 12 noise level measurements were performed at the site with various combinations of tram operation on the K1 and K2 tracks. In one case, it was also a combination with traffic on the city road. Table 1 demonstrates the characteristics of individual measurements. The resulting measurement uncertainty for the applied measurement chain was considered to be ubp = 0.767 dB.
The location on Štúr Street is built-up on both sides by multi-storey buildings. As a result, a characteristic diffuse (multi-reflective) acoustic field is created in its space. Humans subjectively perceive this phenomenon as the amplification of sound (noise). Achieved tram speeds were recorded in the range from 25 to 50 km/h. The resulting acoustic situation is also partially affected by the road operation in parallel with tram transport. The results of all relevant recorded noise measurements at point B1H are depicted in Table 2, which contains, in addition to the time data of the measurements, also an overview of the resulting above-mentioned values of acoustic quantities from the whole time records.
Figure 7 and Figure 8 demonstrate the time histories of the values of the noise levels LAeq and the frequency spectra of the values of the noise levels of the selected measurements. These are measurements in which extreme values of LAeq noise levels (measurements no. 10 and 12—Figure 9) were found on tracks K1 and K2 for new and older types of trams. The values of the noise level values in the 1/3 octave frequency spectrum band are specified in Table 3.
The extreme values of the noise levels LAeq measured in this location can be identified by the track that the trams moved on and by the older or a new type of tram.
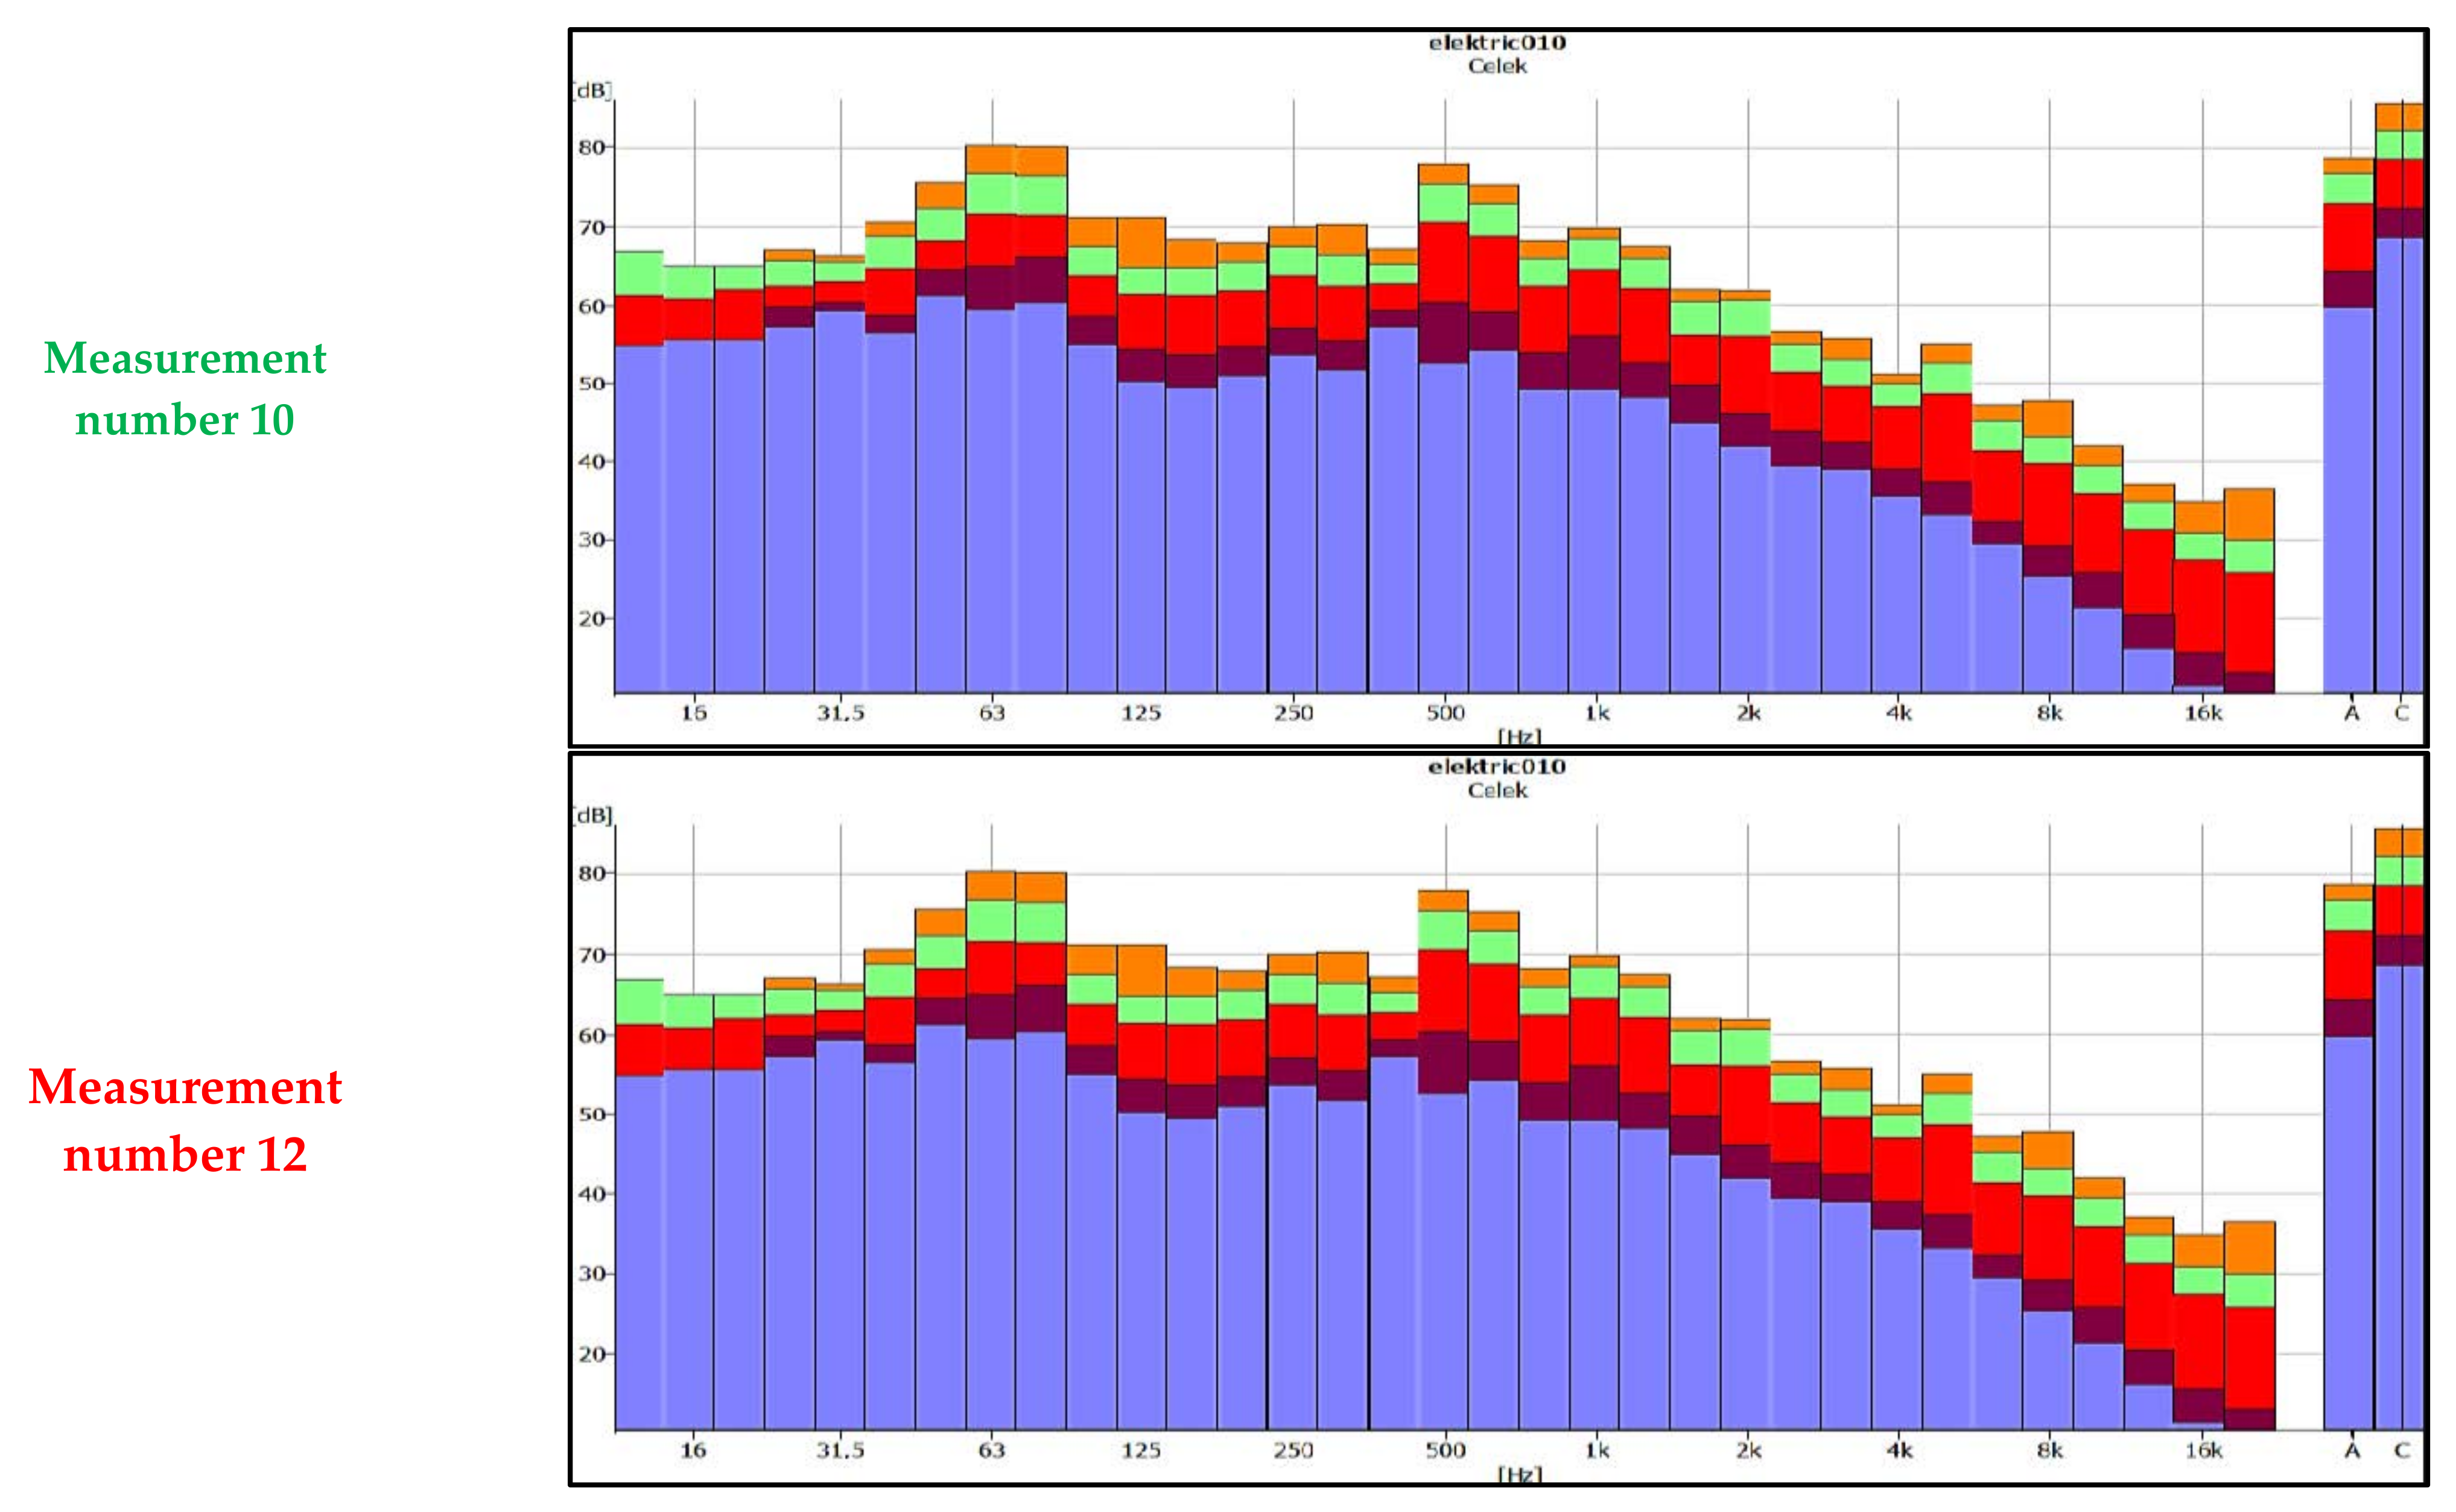
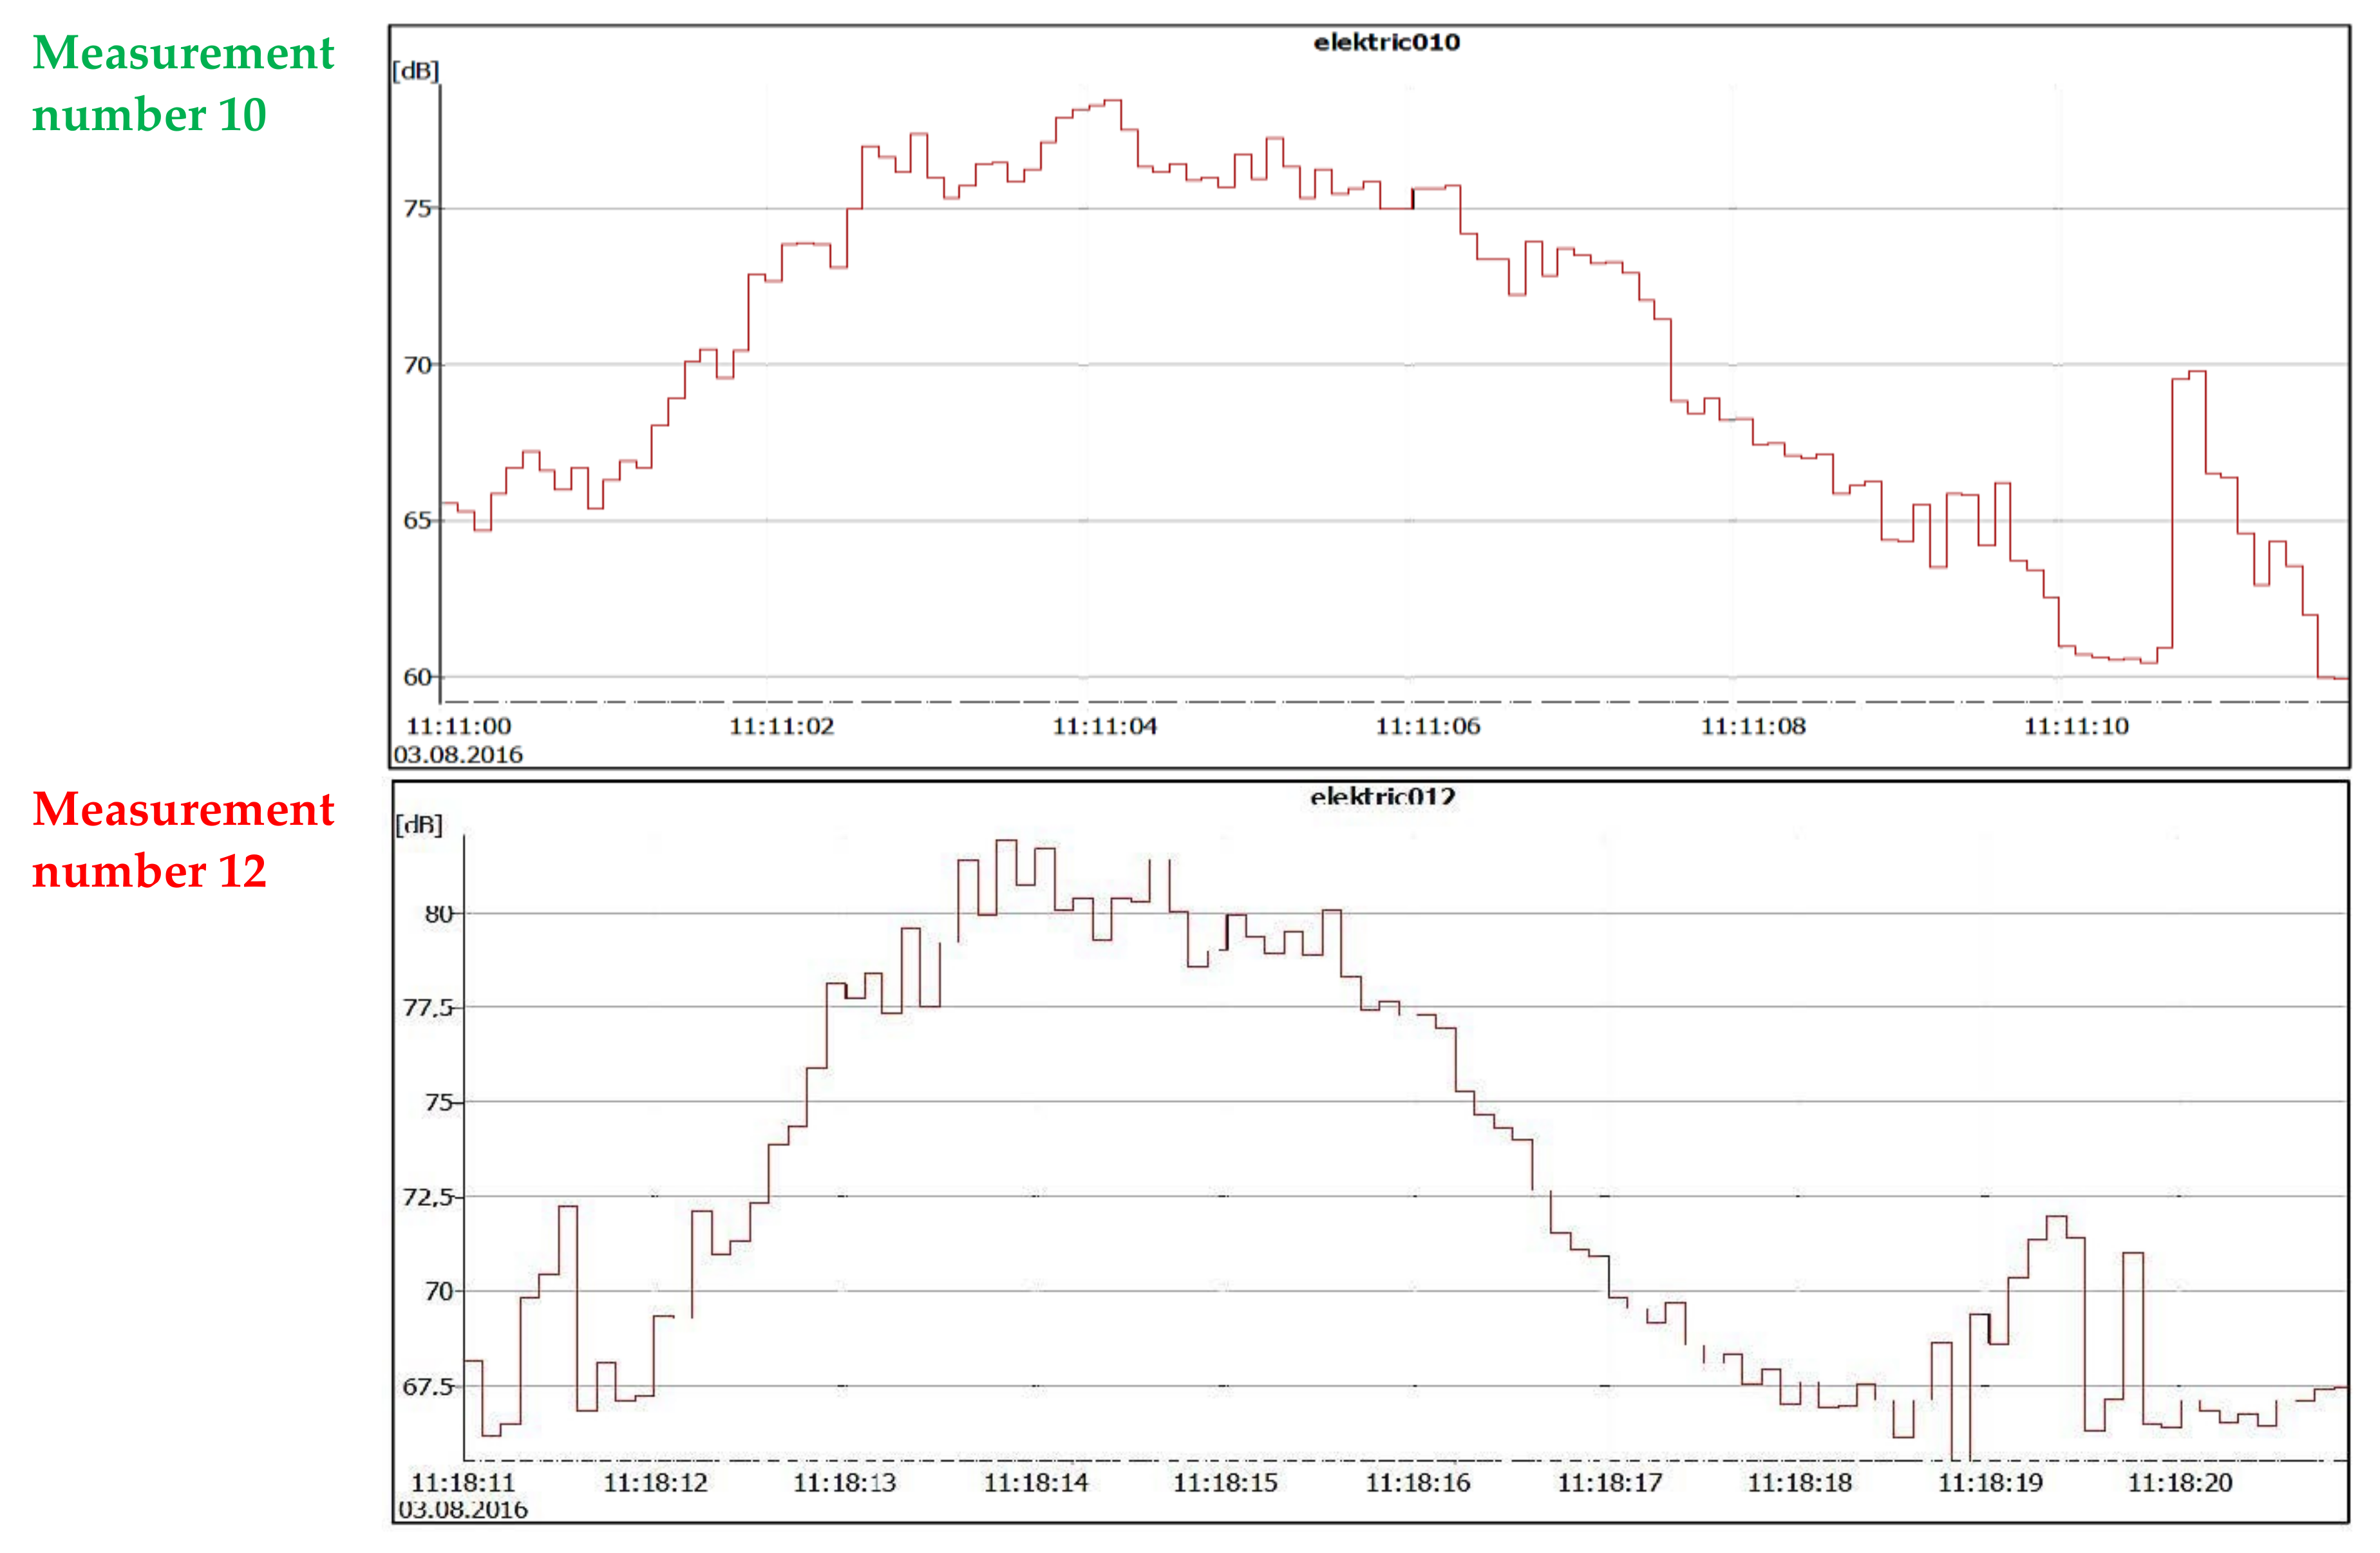
  • track K1 (≈3 m from point B1H) in the case of older types of trams, the highest value of the noise level was measured in measurement no. 12—LAeq = 75.56 dB (red colour in Table 2).
  • track K1 (≈3 m from point B1H) in the case of newer types of trams, the highest value of the noise level was measured in measurement no. 1—LAeq = 74.15 dB (red colour in Table 2).
  • track K2 (≈5.2 m from B1H) in the case of older types of trams, the highest value of the noise level was measured in measurement no. 8—LAeq = 72.24 dB (green colour in Table 2).
  • track K2 (≈5.2 m from B1H) in the case of newer types of trams, the highest value of the noise level was measured in measurement no. 10—LAeq = 72.90 dB (green colour in Table 2).

3.1.4. Results of Experimental Vibration Measurements

The application of analytical and numerical procedures, for the established dynamic characteristics of the geological environment, allows us to calculate further the necessary parameters of the criteria for assessing the state of vibration with respect to the requirements of relevant standards and regulations. It is also possible to calculate the expected level of vibrations in the rocks in the road vicinity in the form of a power spectrum of acceleration amplitudes and velocities vibration at a certain point in the space (near the building). Such a spectrum then serves as an input spectrum for calculating the dynamic response of a building structure to traffic on transport routes (railways, roads, trams, etc.). The results can be divided into amplitude and spectral analyses.
The amplitude analysis revealed the basic characteristics of the time histories of the amplitudes of the vibration velocity of the subsoil—v(t) at the monitored points
  • vrms—effective value of the amplitude of the subsoil vibration velocity;
  • vmax—maximum amplitude of the subsoil vibration velocity;
  • vmin—minimum amplitude of the subsoil vibration velocity;
  • |vmax| + |vmin|—maximum range.
These characteristics suitably describe the vibration intensity in the form of parameters of the subsoil vibration velocities. Specific results were obtained using the evaluation line of the University of Žilina from the 12 above-mentioned experimental measurements in two directions, on two channels of measuring and recording apparatus. Statistical amplitude analysis allowed for the obtaining of 12 × 4 × 9 = 432 statistical data to determine the levels of vibration at the monitored points of the site. Table 4 is therefore supplemented by the values of the quantities vmax, vmin and the effective values of the amplitudes of the vibration velocity vrms at the measured points (Table 2).
The dominant frequencies of the dynamic response at the measured points were determined by spectral analysis. The program “Spectra—FFT” provided 12 × 2 × 2 = 48 autospectras FFT—Sii(f). At the same time, spectral analysis was performed using PULSE BK software that was applied to calculate 48 power spectral densities Gii(f). Figure 10 and Figure 11 demonstrate examples of the time histories of the vibration amplitudes in (t) with the results of the spectral analysis Gii(f). These are cases of tram rides when extreme values of vrms vibration velocity amplitudes were reached at points B1Vy and B1Vz (in Table 4 marked in red for track K1—old type of tram and green for track K1—new type of tram).
The whole time history of the vibration velocity of one measurement for B1y and B1z is demonstrated in Figure 11.
As an example, the amplitude spectra Gzz(f) and Gyy(f) are shown in Figure 12 on a logarithmic scale from the vibration velocity record from measurements no. 3 and no. 1.

3.2. Experimental Measurements on the Old Bridge

Measurement of noise conditions and vibration levels on the Old Bridge was implemented in partly cloudy weather and at a temperature of 24–28 °C and the southern, variable, 5–12 m/s wind. The first part of the Petržalka tram project (Figure 13) included a proposal for building a 2.4 km long double-track line from the intersection of Štúr and Jesenský Streets, through Šafárik Square and Old Bridge to the intersection of Jantár and Rusovce Roads. Part of this project was also the reconstruction of the Old Bridge, including the replacement of the original bridge structure with a new load-bearing steel horizontal structure. On the bridge in question, the track was designed with a dual gauge of 1000 and 1435 mm with four rails in each direction. Both gauges are available along their entire length with the symmetrical track layout. The exception is switches that allow passage and turning only for a gauge of 1000 mm.
The new load-bearing steel structure of the bridge is a welded truss rhombic system. Unlike the original bridge structure, the sidewalks for pedestrians and cyclists were widened to 4.5 m on both sides of the bridge. Above pillars no. 4 and no. 5, viewing platforms were designed (Figure 14). The middle part of the bridge with a railway track placed in a concrete roadway is used exclusively for tram transport and rescue and safety units. The tram superstructure on the bridge is designed as a ballastless track with contactless rails, using Ri60R2 (for 1000 mm gauge) and Ri67R1 (for 1435 mm gauge) groove rails, equipped with a simple, flexible compensated catenary. Engineering networks (water supply, gas pipeline, high-voltage cables, and optical cables) are led in the space under the construction of the tram line. As part of the bridge reconstruction, two original pillars were demolished at the same time, and one new pillar was built in their place outside the fairway profile.

3.2.1. Objectives of Experimental Measurements

The first objective was, similarly to the measurements mentioned in Section 3.1.3, to determine the current noise situation on the reconstructed bridge and the new carriageway caused by the tram passage. There is no car traffic on the bridge structure, and therefore the only relevant source of noise is the trams, which are the two-way Škoda 30T trams (Figure 1). These vehicles are 32.5 m long and reach a maximum design speed of 65 km/h (in standard traffic approximately 50 km/h, as they operate in the urban area of the city). The assessed double-track section of the tram line is placed on a reinforced concrete supporting structure—a ballastless track with contactless rails. This type of construction of the tram surface as well as the position of the measuring points is specified in Figure 3 and Figure 14.
The second objective of the experimental measurements was to determine the intensity of vibrations caused by the dynamic effects of moving tram vehicles on the track in question located on the bridge structure. During their movement, as mentioned in Section 3.1.3, the trams cause dynamic effects that propagate through the material environment of the supporting structure of the bridge and its non-bearing elements in the form of deformation waves of a random character. Numerical analysis of the dynamic response of the measured point of the bridge structure can be expressed in the form of power spectral densities of vibration amplitudes and the course of vibration amplitudes in the time domain (kinematic quantities). Their intensity again depends on several factors (position of the examined point from the source of vibrations—tramway track, level of errors in the track geometry, wear of rail tracks, dynamic characteristics of tram vehicles, dynamic parameters of bridge construction, etc.).
The following quantities were specified:
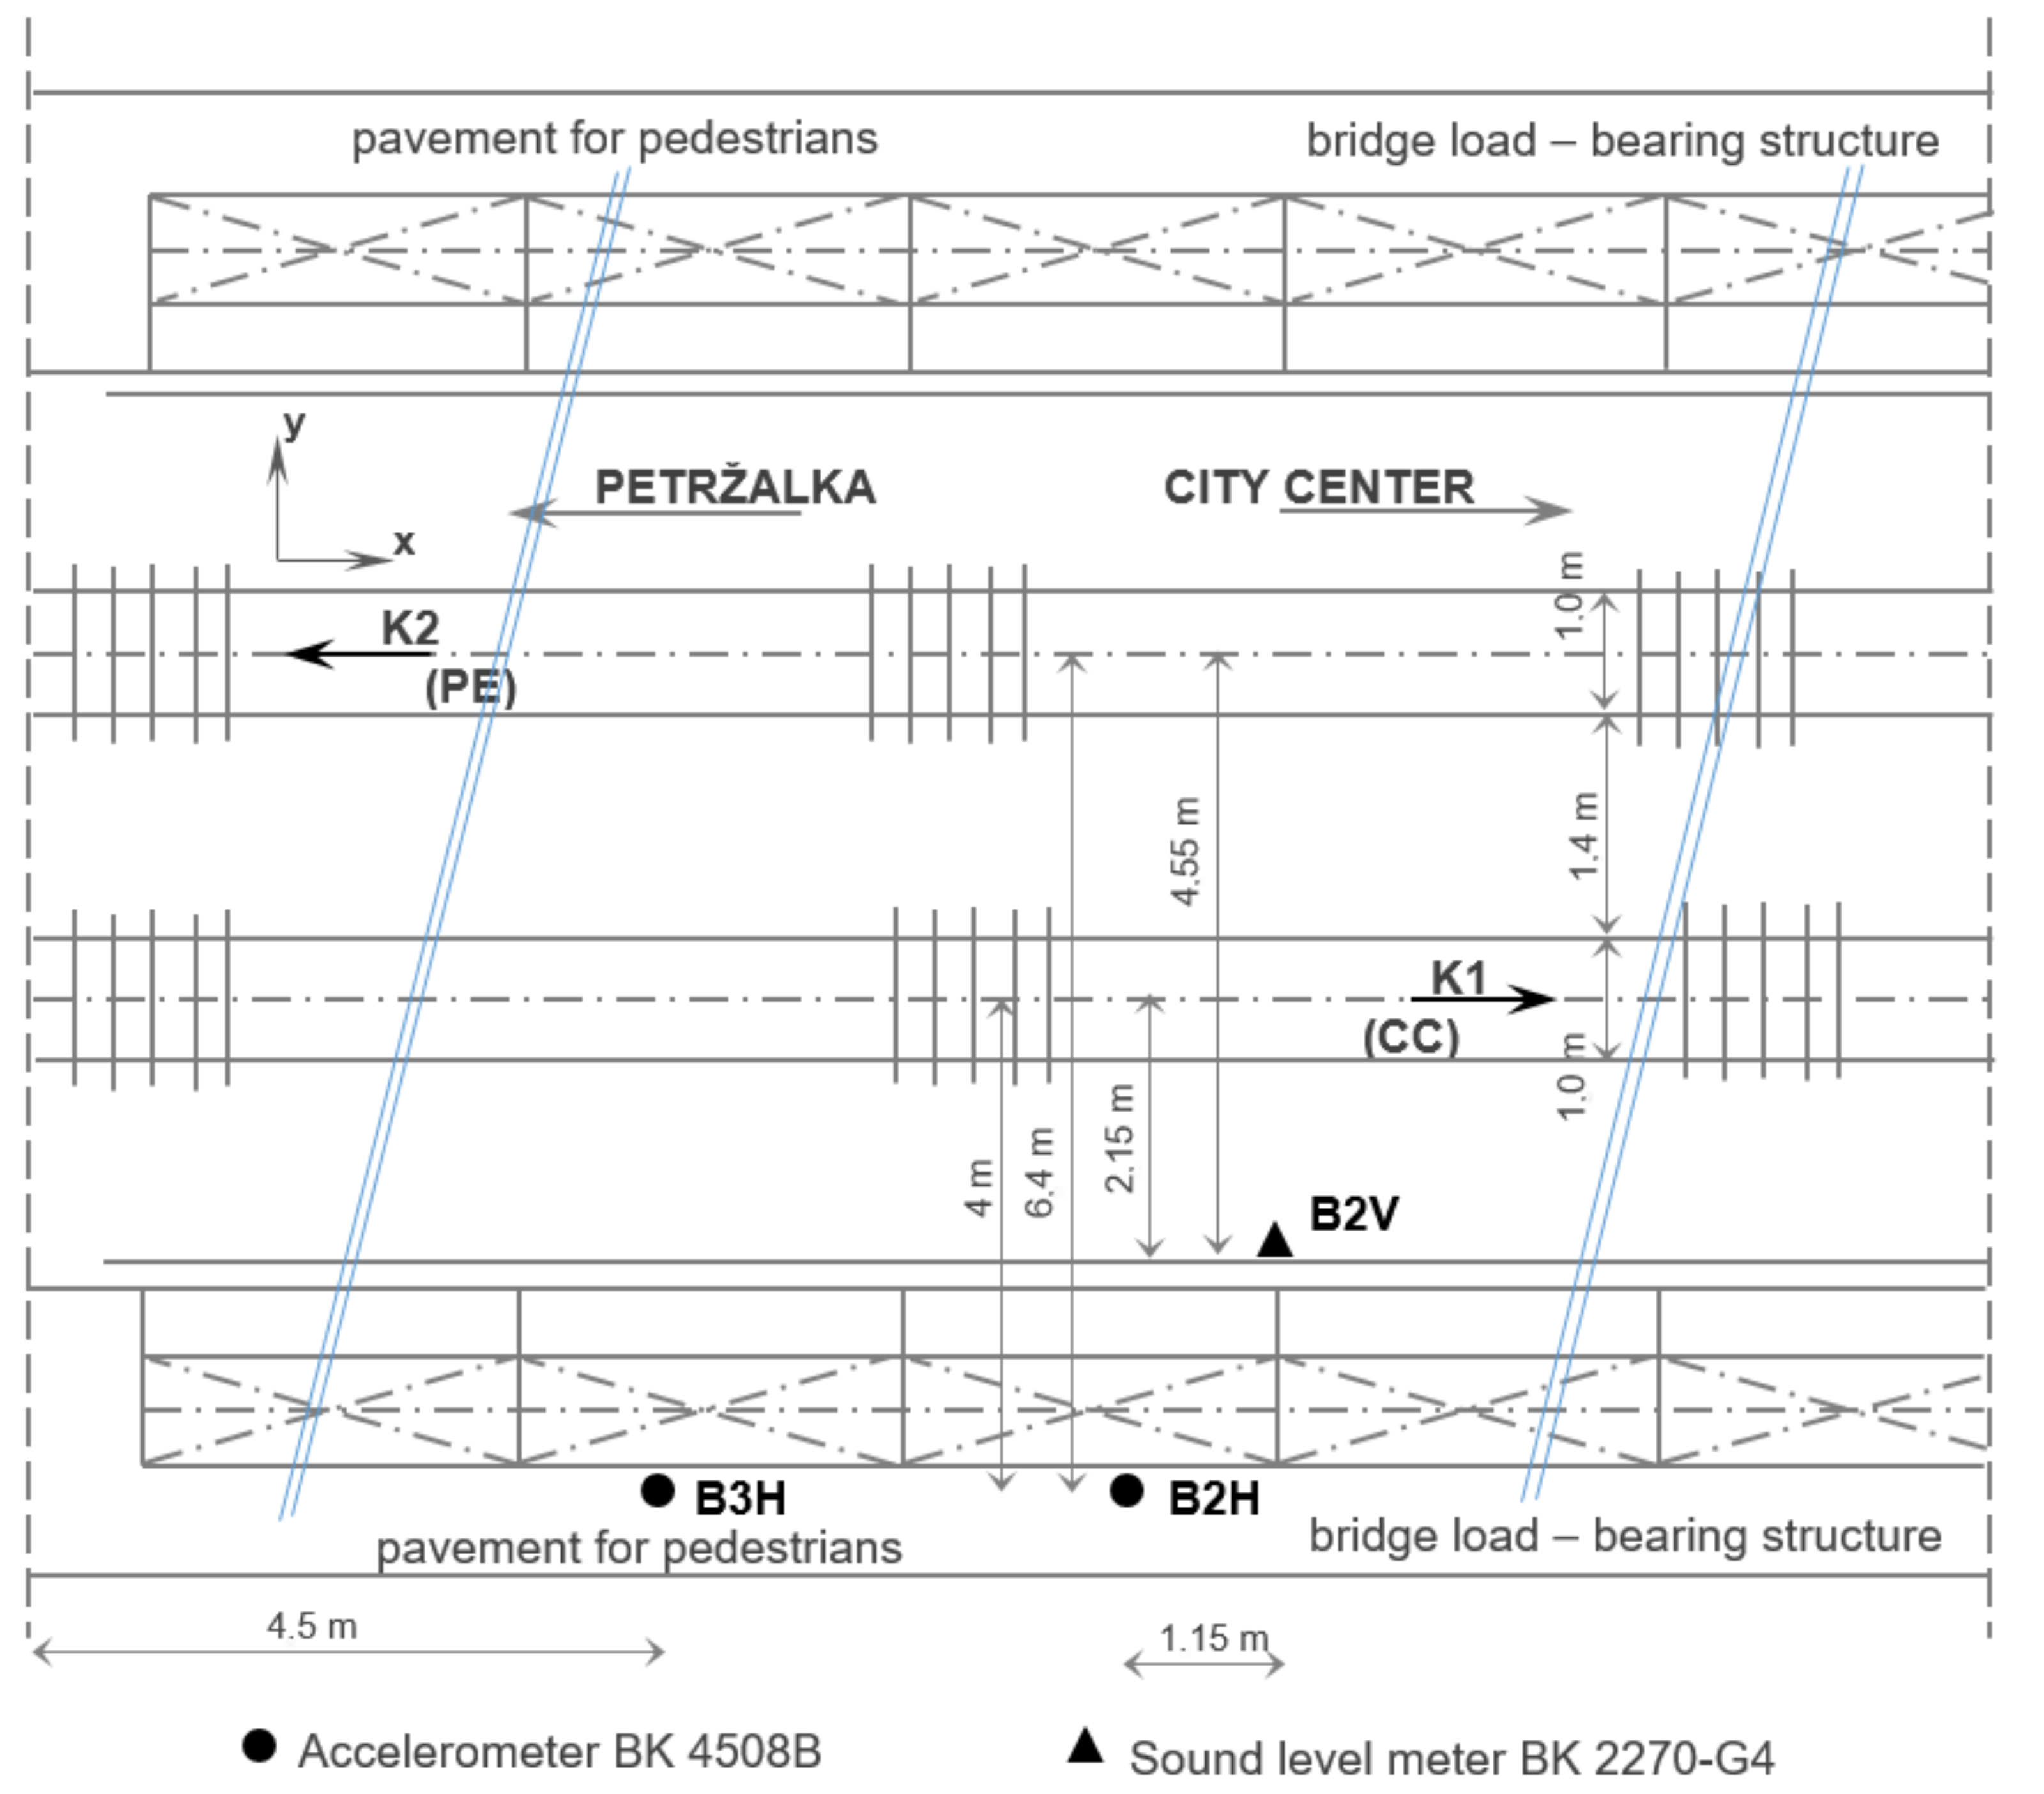
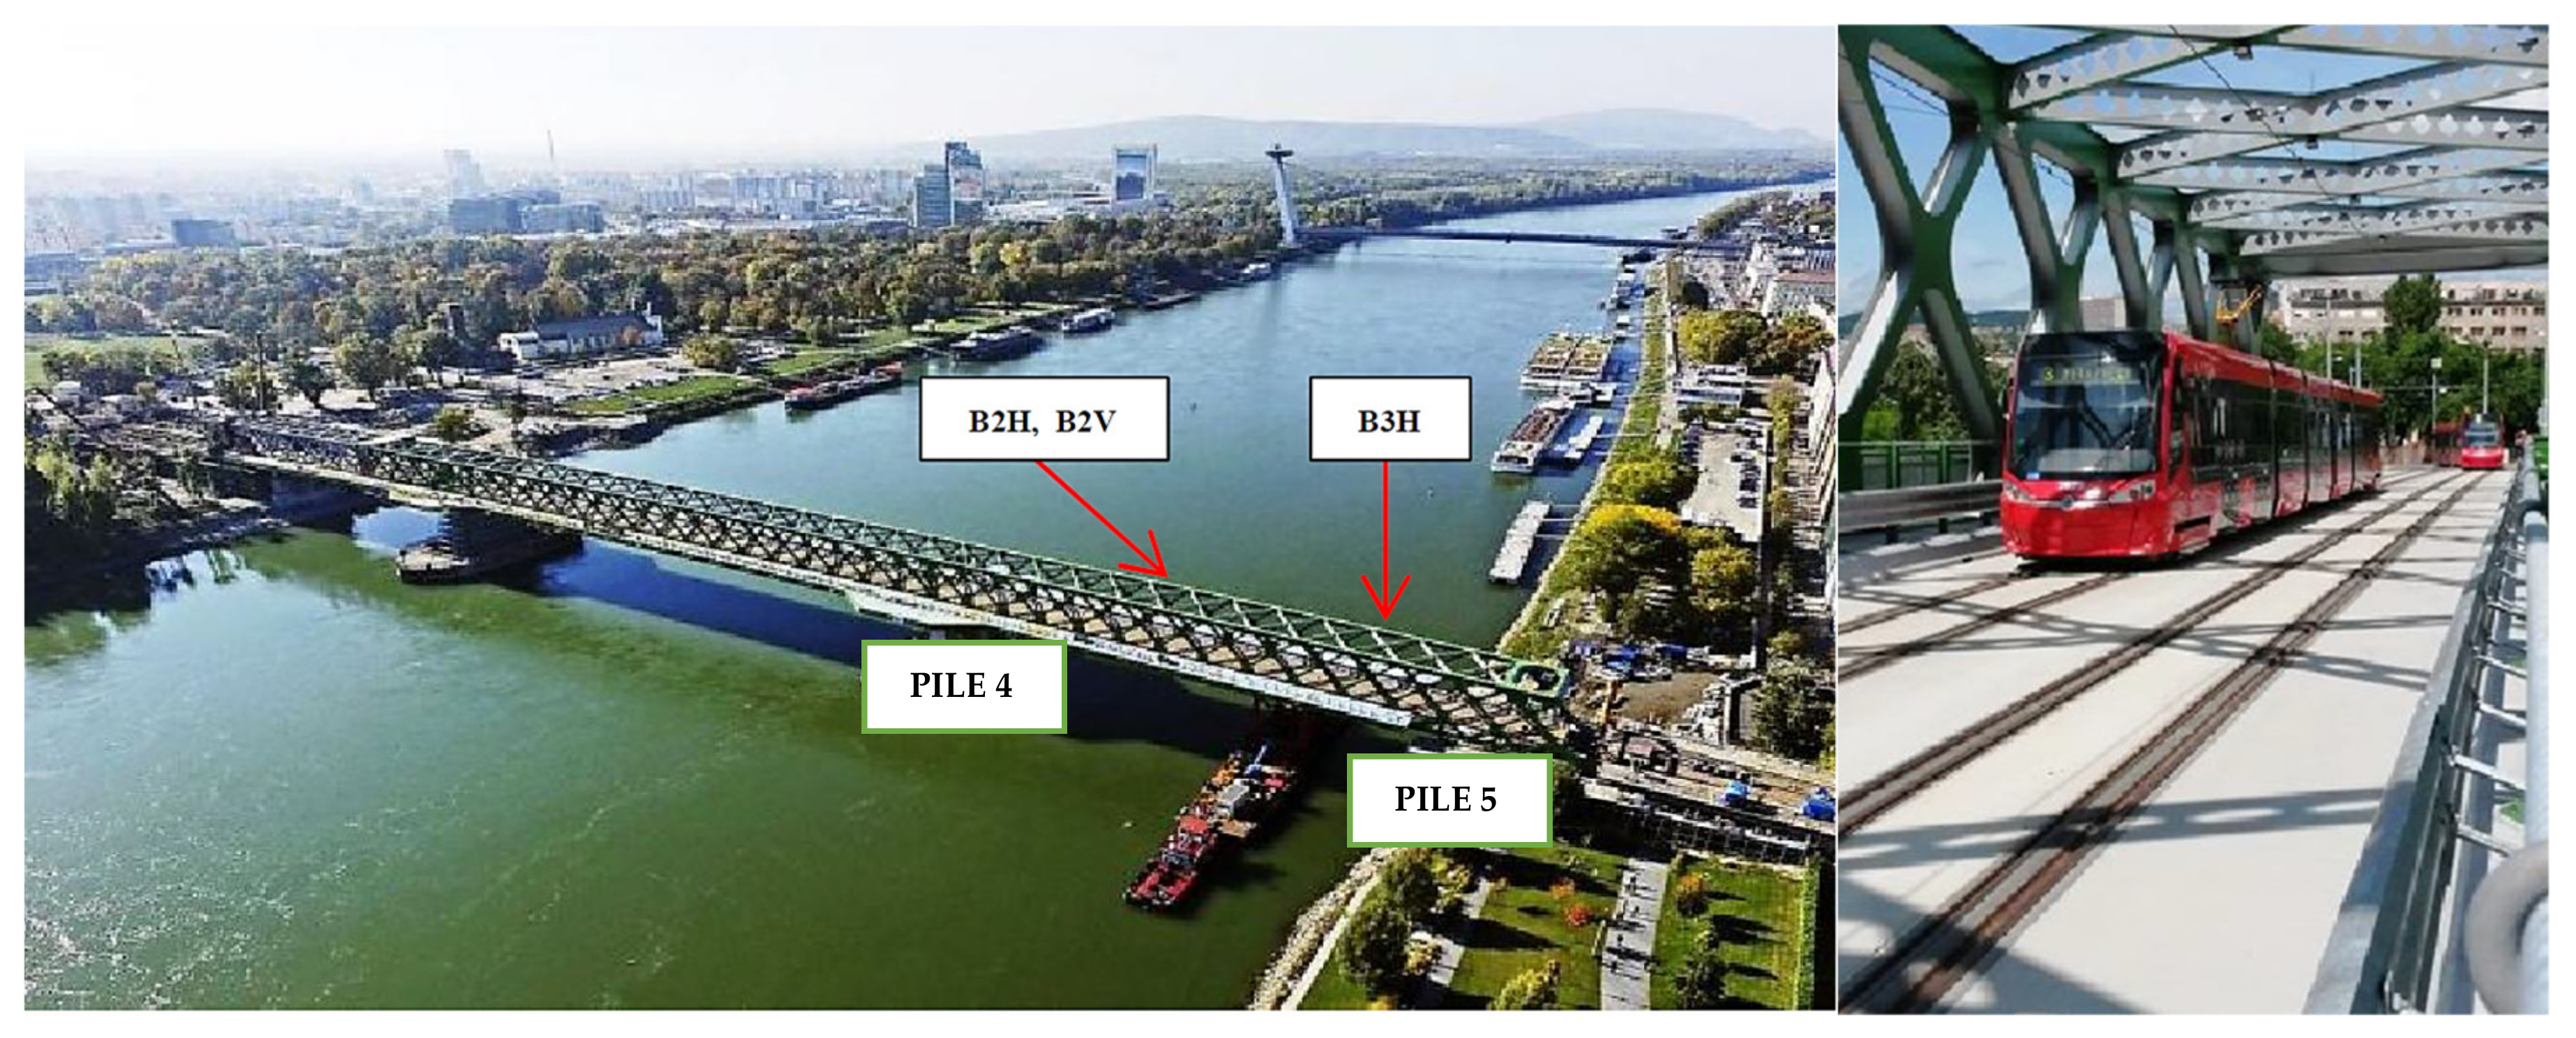
  • vibration levels at the tram line at a distance of 1.65 m from the K1 track at the bridge deck level (B2V)—evaluation by statistical analysis methods (amplitude analysis);
  • frequency characteristics of the vibration amplitudes of the bridge structure in the vicinity of the tram line in order to determine the frequency spectrum of the bridge vibration by individual types of trams by applying correlation and spectral analysis;
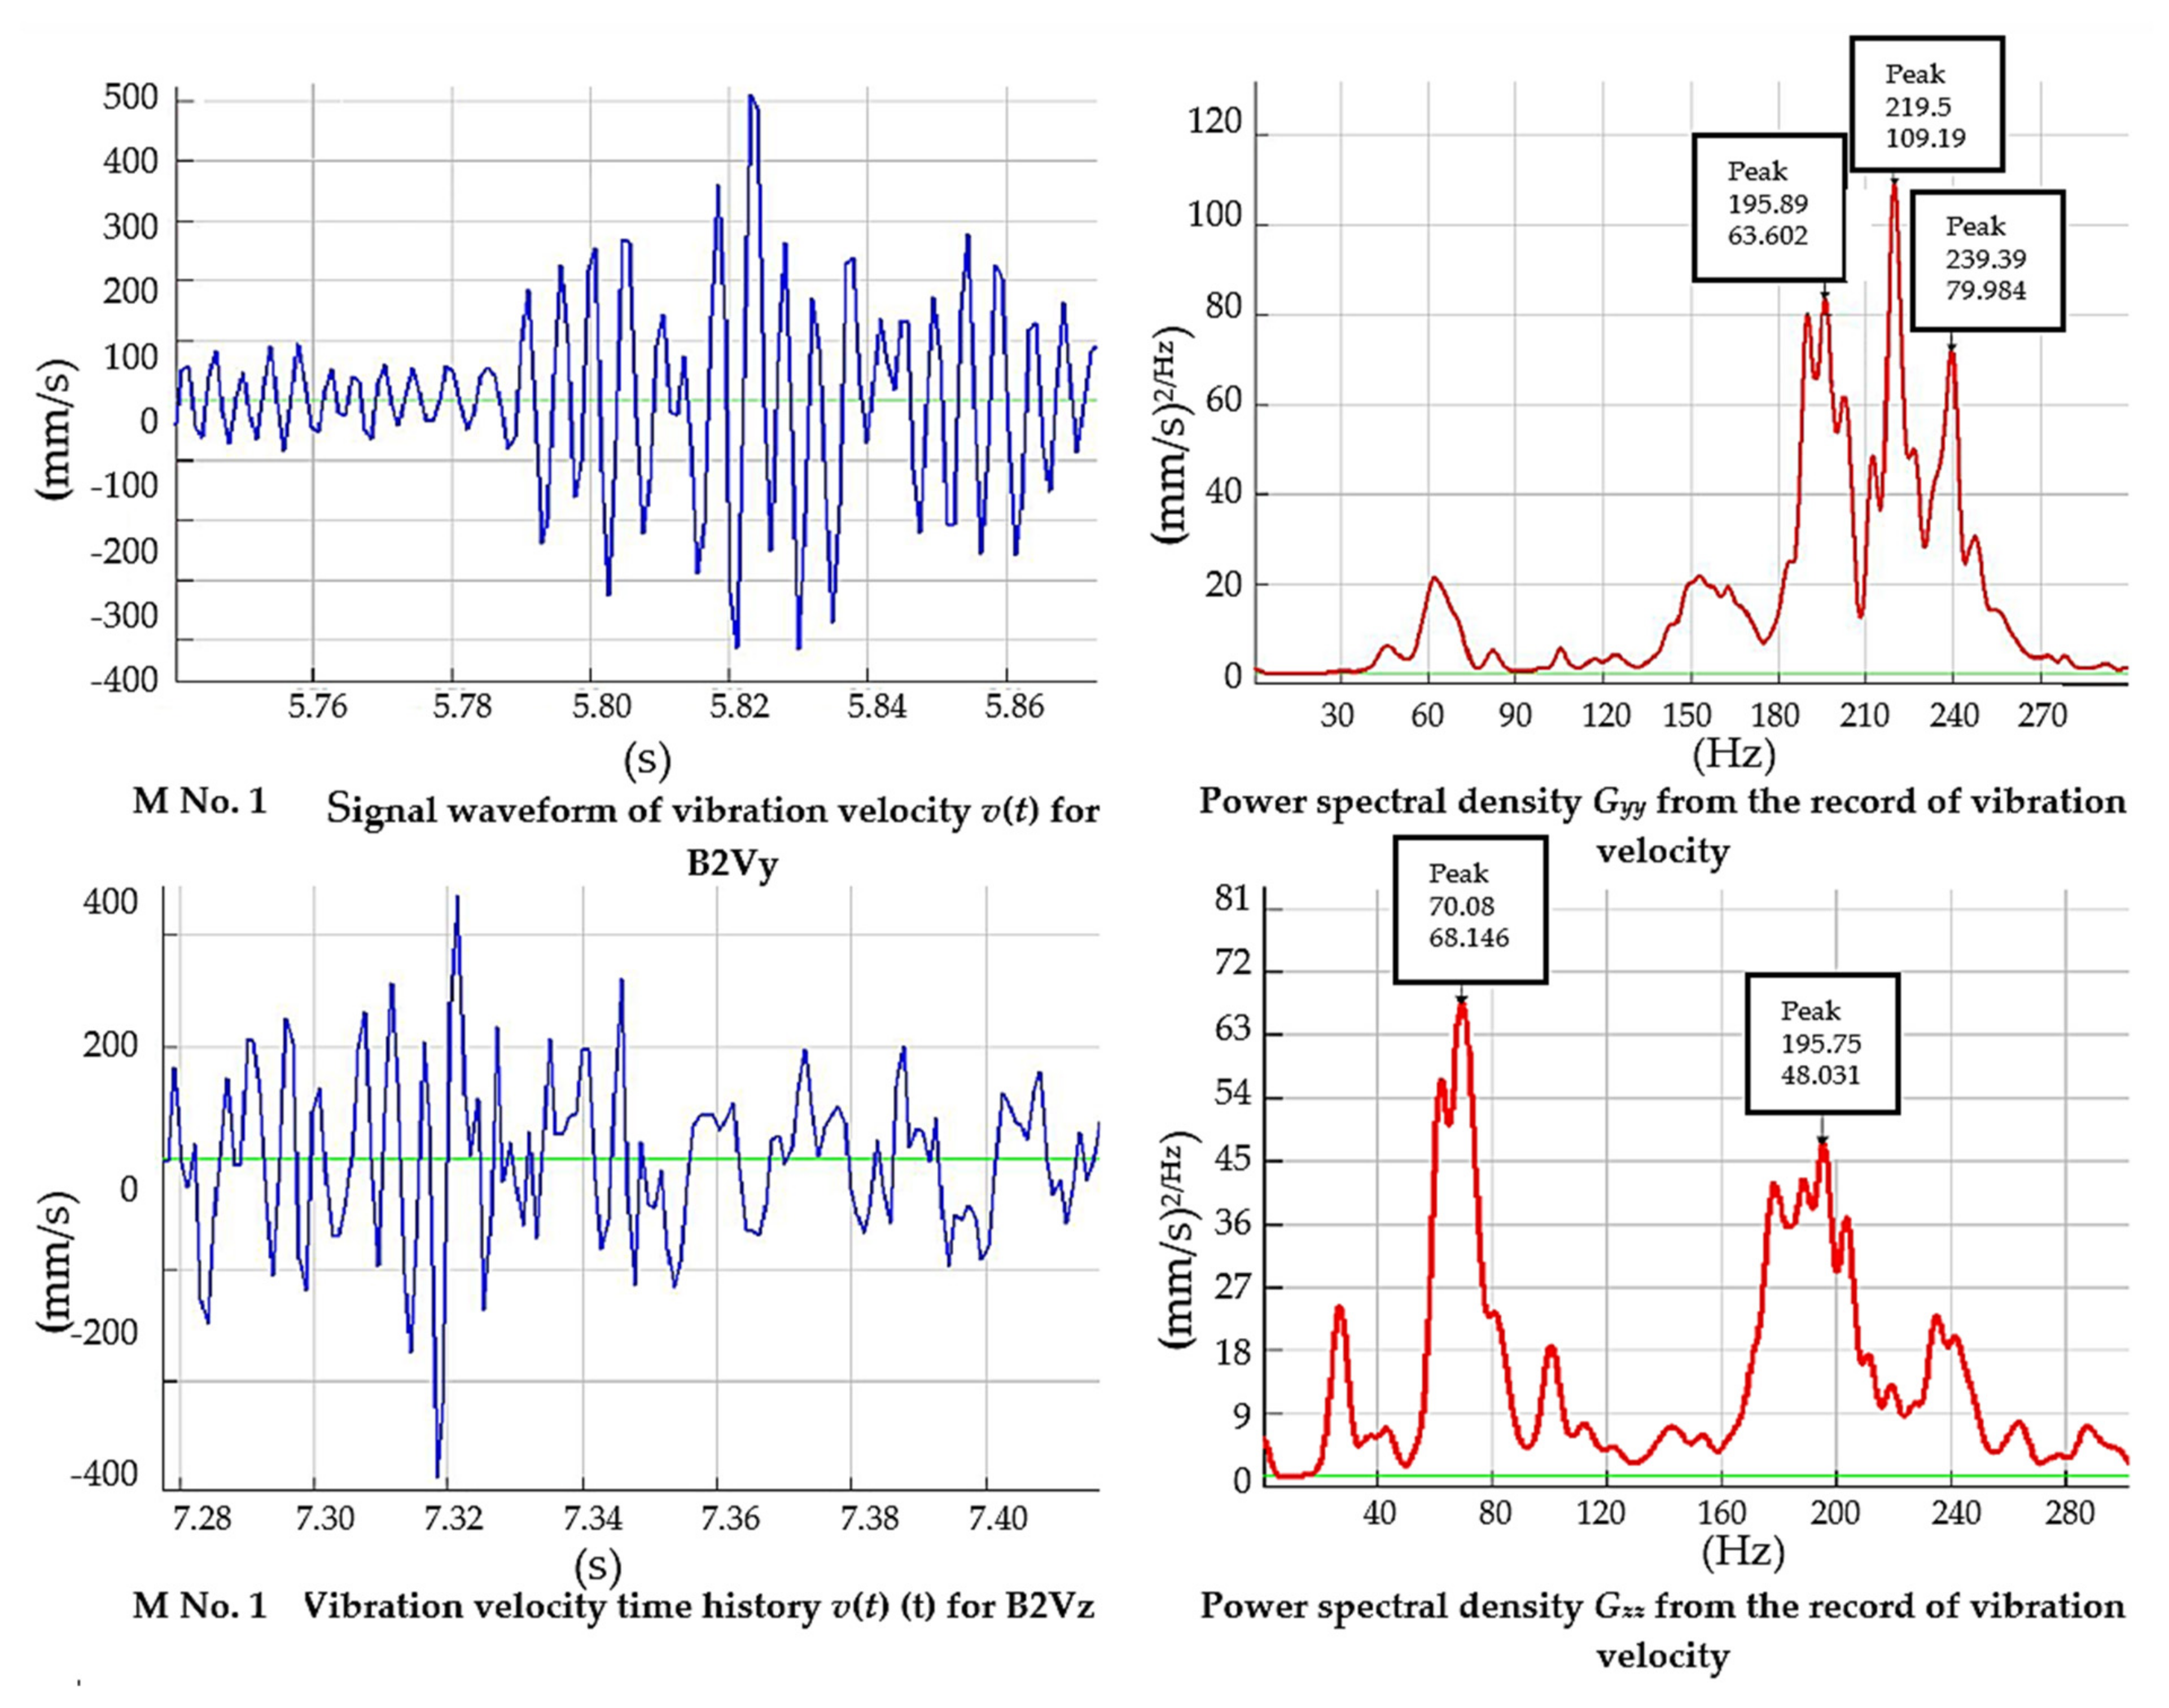
  • vibration time histories v(t), which are recorded by a set of accelerometers in the vertical direction z and horizontal y perpendicular to the axis of the tramline (sensors marked B2Vz, B2Vy). The position of the measuring points can be observed in Figure 14.

3.2.2. Measurement Methodology and Measuring Line

The locations B2H and B3H for measuring noise were determined to be able to objectively assess the current noise situation in the characteristic section of the tram line on the Old Bridge. It is a measurement of the intensity of vibrations of the main source of vibration of the tram line and its local effects in the vicinity of the track gutter, placed in a composite reinforced concrete bridge deck. The distance of B2H point on the bridge from the axis of the nearest track of the tram line K1 (direction CE–PE) is about 4.0 m, and track K2 (direction PE–CE) is about 6.4 m from the point B2H. Figure 15 schematically demonstrates the position of the measured points and the tramway tracks. The set for measuring noise effects by Brüel and Kjær is the same as for the measurements presented in Section 3.1.2.
Figure 15 also depicts the position of the B2V point for experimental determination of the vibration intensity from the effects of electric operation and its frequency spectrum. The specific measuring and evaluation line at the B2V site is identical as in the case of vibration measurements on Štúr Street.

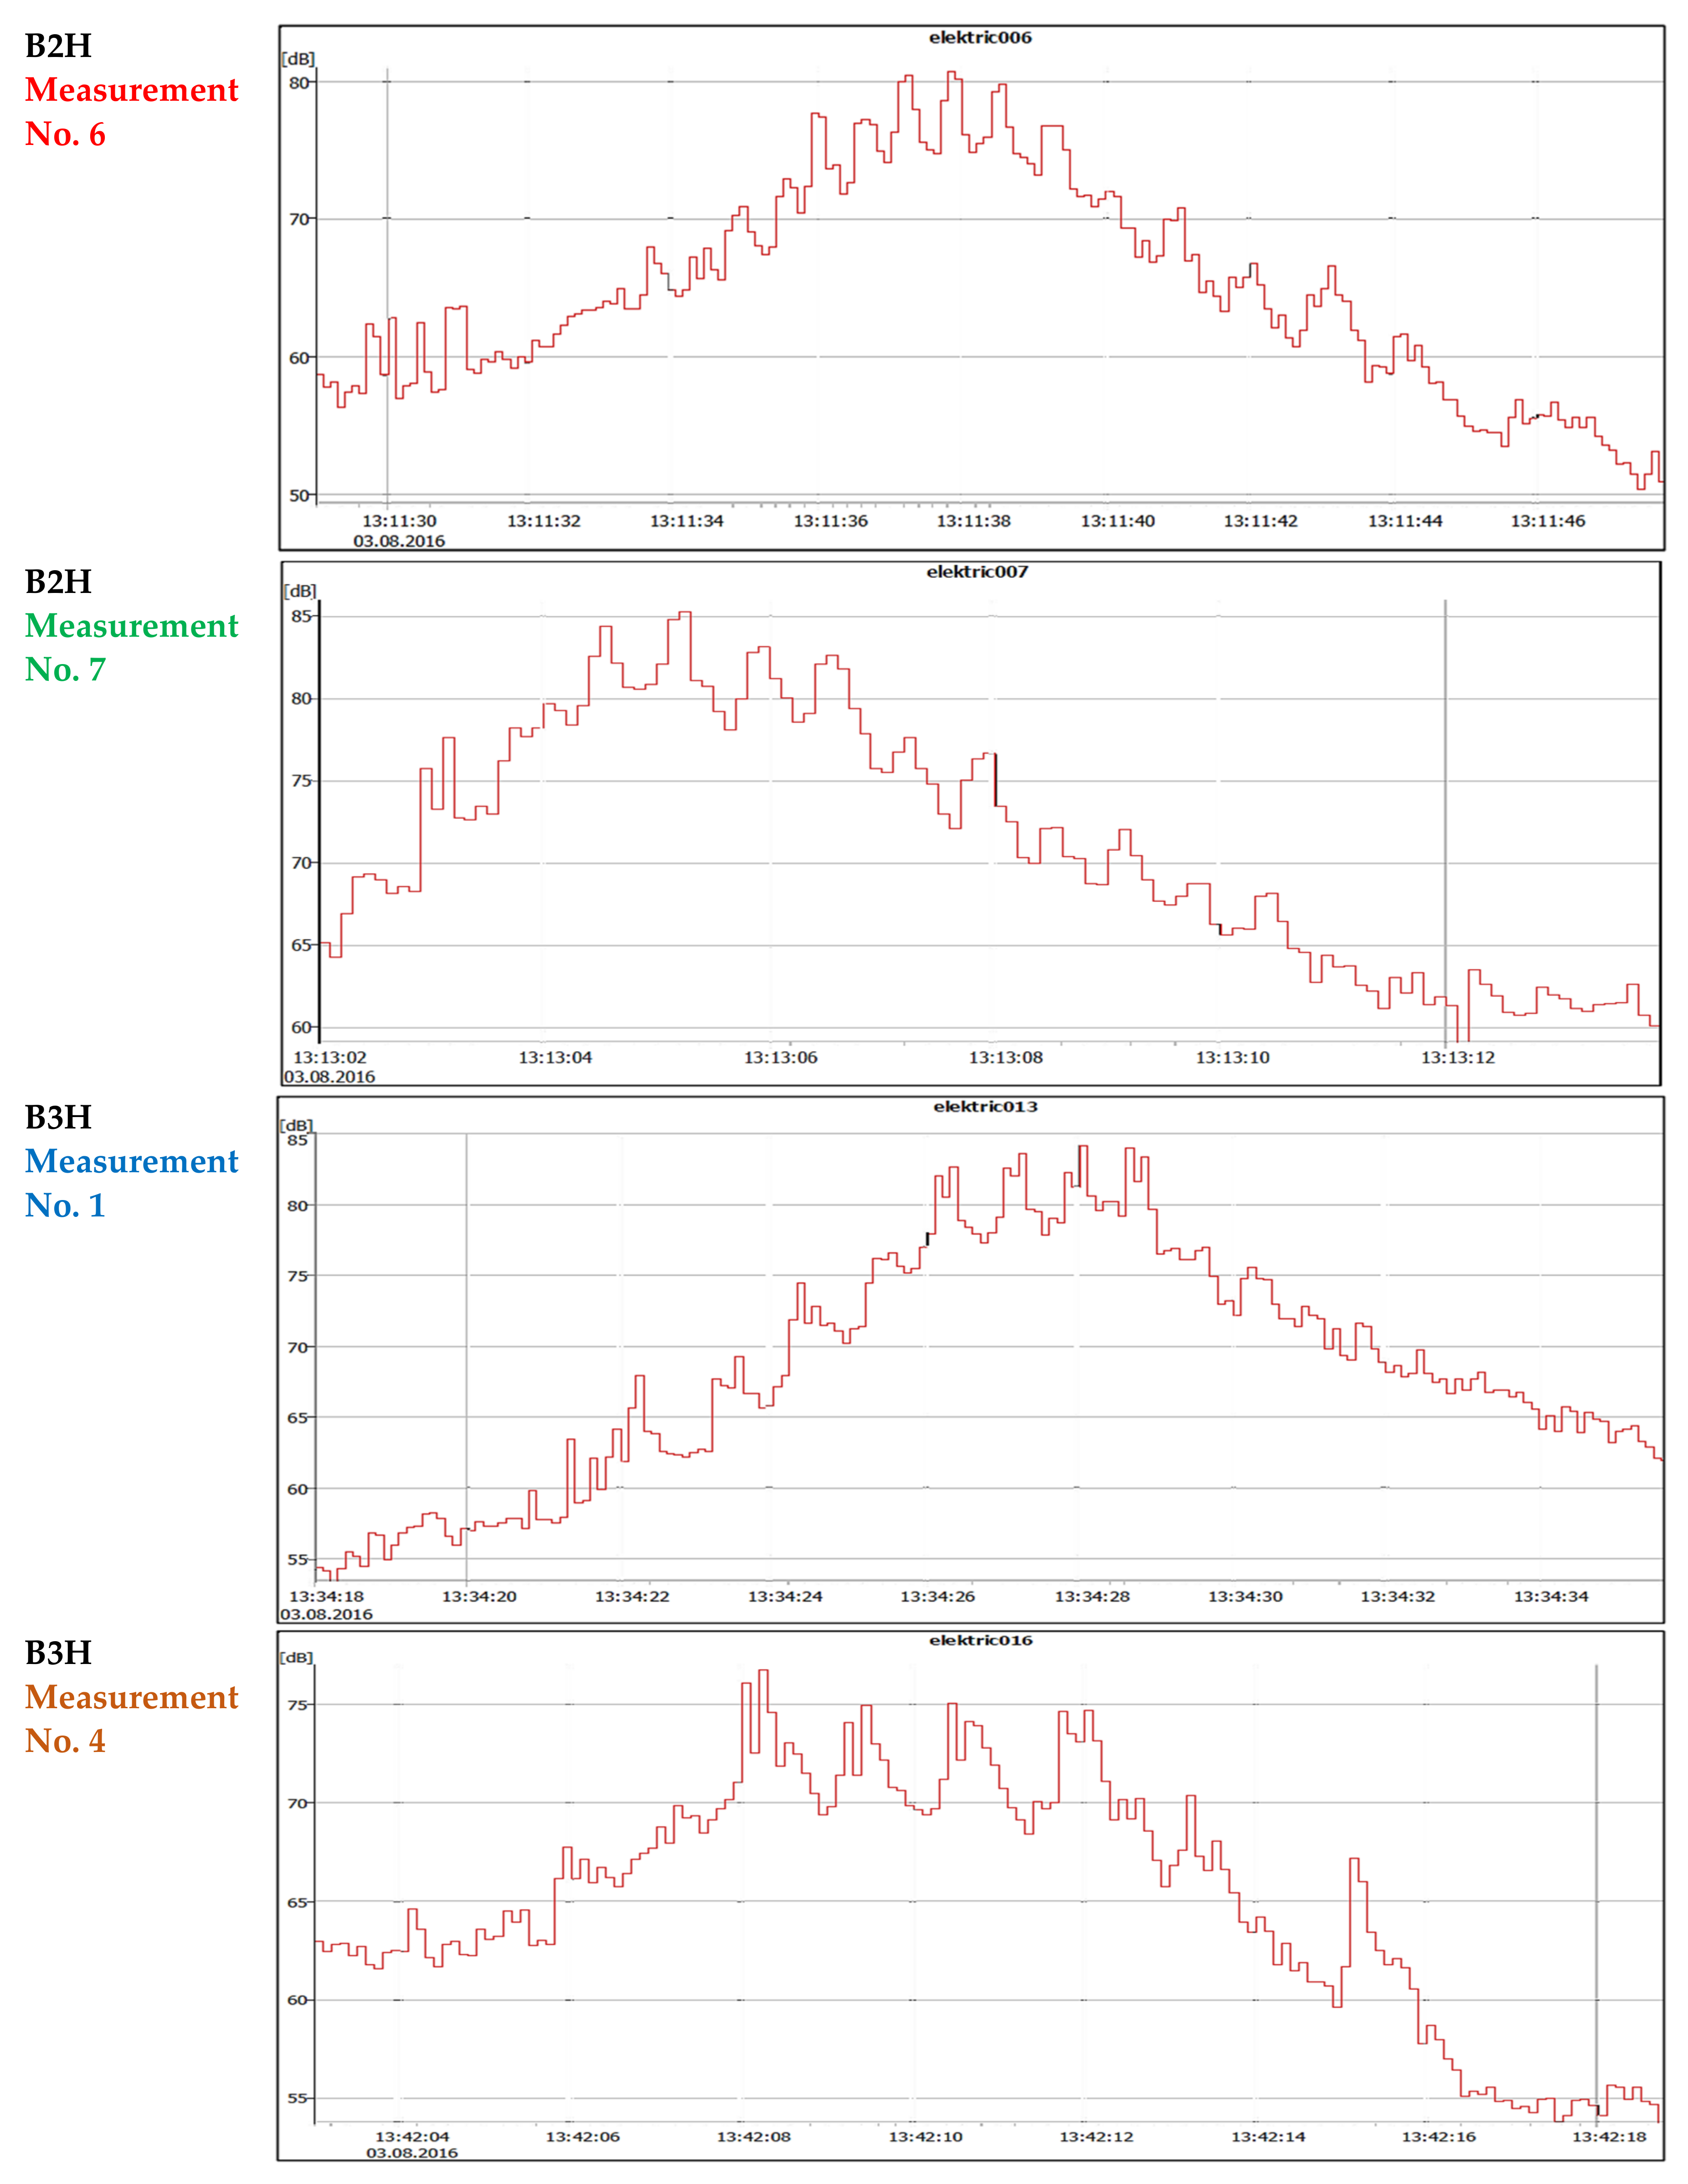
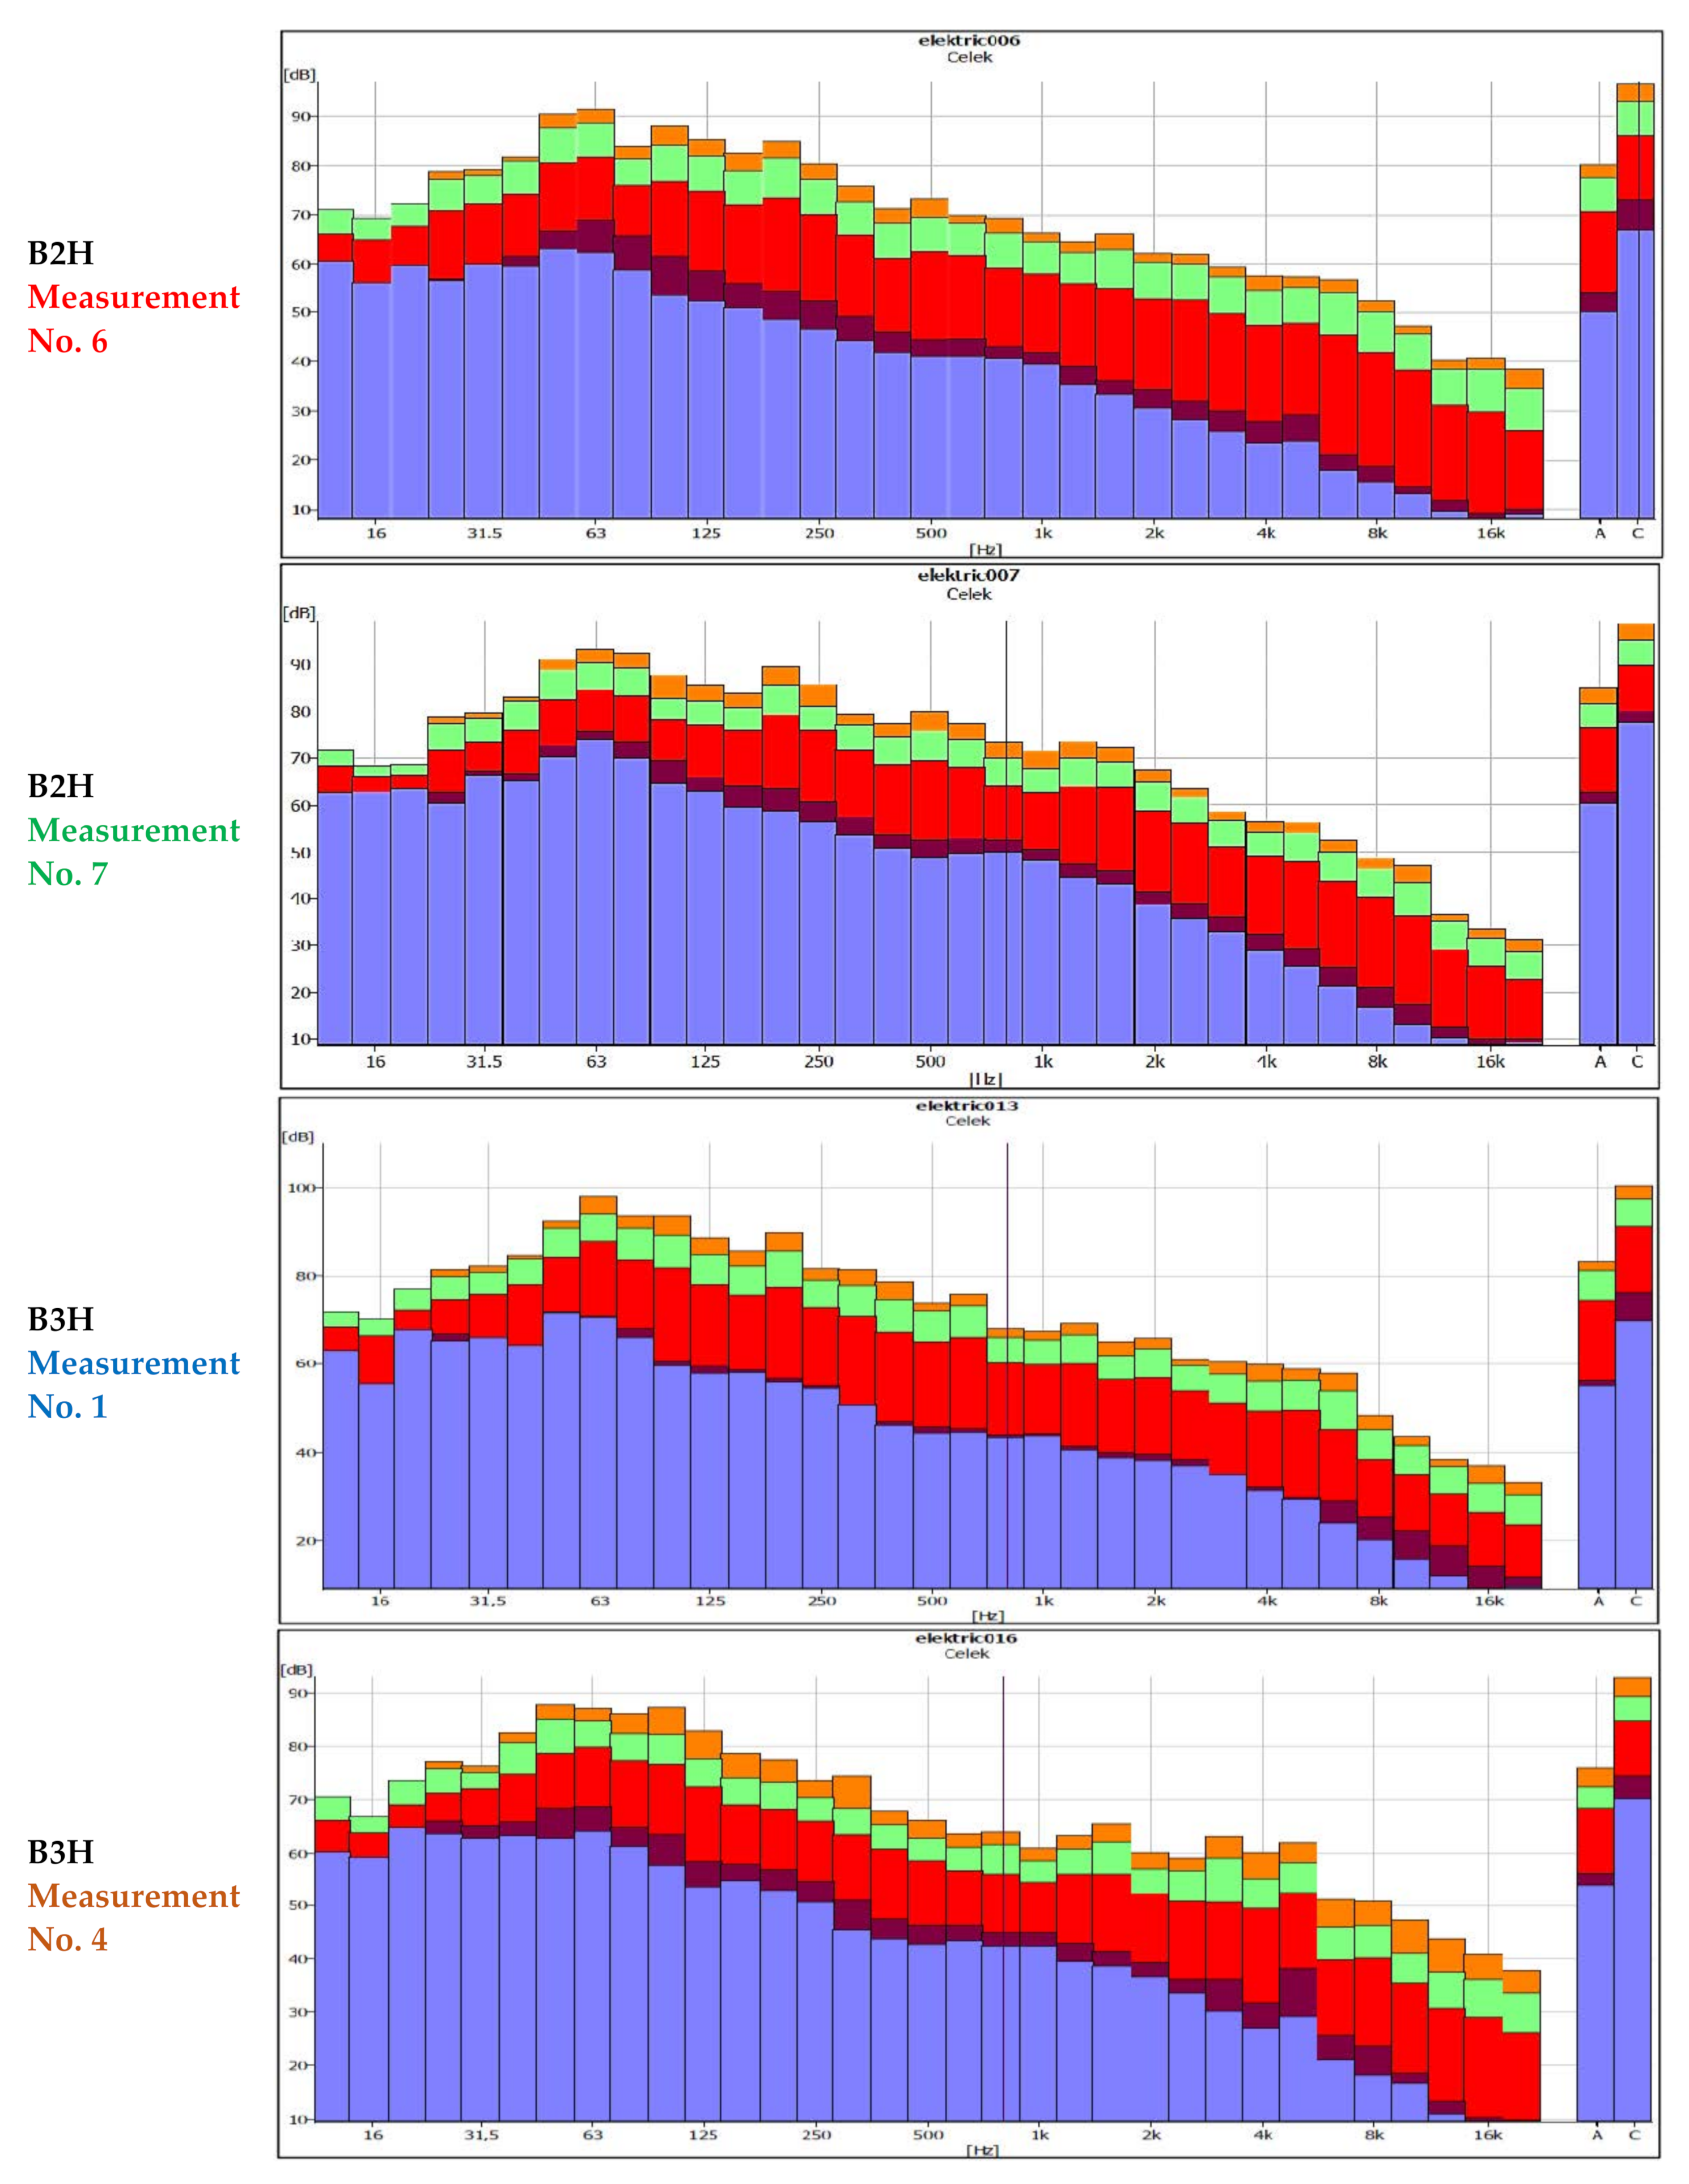
3.2.3. Results of Experimental Noise Measurements on the Old Bridge

Experimental procedures for measuring noise levels and the measured acoustic quantities and their designations are characterised in Section 3.1.3. In the location on the Old Bridge B2 → B2H, a series of 12 measurements of noise levels were implemented with various combinations of tram operation on the K1 and K2 tracks. Table 5 provides basic descriptions of particular measurements. This table also contains measurements in the first field of the bridge at the B3H site, where four tram passages were recorded. Table 6 presents the results of all relevant noise measurements in the B2H and B3H localities, including time data of individual measurements and an overview of the resulting values of measured quantities from time records in the given location—LAeq, LCpeak, LAFmax, LAFmin.
Locations B2 and B3 are characterised by a complex acoustic situation, as the bridge structure itself is essentially a noise pipeline during the duration of tram passages. At the same time, its shape in open space creates a characteristic diffuse (multi-reflective) acoustic field that people subjectively perceive as an amplification of noise. Trams on the bridge structure reach speeds from 30 to 55 km/h. The only efficient damping element is the flexible mounting of the rails and partly also the reinforced concrete composite slab or its placement.
Figure 16 and Figure 17 demonstrate the time histories of the values of the noise levels LAeq and the frequency spectra of the values of the noise levels of the selected measurements. These measurements determined the noise levels LAeq (measurements no. 6 and 7 for point B2H, and measurements no. 1 and 4 for point B3H) from the extreme values. The values of noise levels in the 1/3 octave frequency spectrum band are specified in Table 7.

3.2.4. Results of Experimental Vibration Measurements

On the basis of the analysis types, the results of vibration measurements can be divided into amplitude and spectral analyses.
Amplitude analysis of the recorded signals was performed in the Statistics programme. The basic amplitude characteristics of the time histories of the amplitudes of the subsoil vibration velocity v(t) at the monitored points (vrms, vmax, vmin,|vmax| + |vmin|) were determined. A total of 12 experimental measurements were statistically evaluated in two directions and on two channels of the measuring and recording equipment. Statistical amplitude analysis enabled the obtaining of 432 statistical data points for determining the levels of vibration at the monitored points of the site.
Table 8 specifies the values of the quantities vmax, vmin and the effective values of the amplitudes of the vibration velocity vrms at the measured points. The highest values of vrms for the passage on the track K1 and K2 are marked in colour, while in the case of the track K1, the values were significantly higher. The highest of them had a value of 41.37 mm/s for measurement no. 1, direction Petržalka, and speed of 45 km/h—red colour. On track K2, the highest value was recorded in the case of measurements no. 6, wherein the direction to the Centre and the speed of the passage were identical, 45 km/h—green colour and vrms = 20.04 mm/s.
Spectral analysis provided results in the form of 48 Sii(f) autospectres, from which the dominant frequencies of the dynamic response at the measured points were determined. At the same time, spectral analysis was performed using PULSE BK software. The result was 48 power spectral densities Gii(f). Figure 18 demonstrates the time history of the vibration amplitudes v(t) with the results of the spectral analysis Gii(f) for measurement no. 1 with extreme values of amplitudes of vibration velocity vrms at points B2Vy and B2Vz during excitation on track K1.

4. Conclusions

The reduction of noise and vibration is based on reducing the factors of their origin. In the case of tram transport, noise from the source (tram line) spreads through its natural environment, which is a very complex environment in urban built-up areas. In the process of noise propagation, many reflections, interferences, absorption, and especially dispersion attenuation occur. For this reason, the affected subject comes in the form of a random behaviour of the sound pressure. In the case of vibration propagation, it is a very similar issue, where the mechanical vibration from the source of vibrations moves through the geological environment. This process of vibration propagation is called technical seismicity caused by traffic [36,37].
Since the geological environment is not homogeneous and many physical phenomena occur in the transmission of vibration, similar to noise propagation, the resulting signal arrives at the affected system in the form of random vibrations. The task of evaluating the reduction of noise and vibration generated by tram transport is therefore based on the assessment of the integral parameters of discrete random variables. In terms of effects on the population, these parameters are LAeq and veqv. These are the so-called weighted equivalent values, where the individual weighting coefficients respect the sensitivity of the human body to the stimuli of noise and vibration depending on the frequency or the frequency band. Last but not least, it is necessary to focus on the influence of technical seismicity on structures. In this way, they are degraded in the event of excessive vibrations, and thus the quality of the environment is reduced. Therefore, due to the legislative limits of the study, it contains other integral parameters of random vibration vrms, vmax, and vmin. In the case of tram transport, there is an especially enormous increase in intensity during the day. Due to this, key measurements were implemented at peak times. They are described in detail in the focus chapter of the article—Chapter 3. The most significant factors generating noise and vibration emissions are the conditions of the electric vehicles and tramways.
The Bratislava vehicle fleet is being modernised, and thus the unfavourable noise-vibration emissions are gradually reduced. However, this process is slow and needs to be accelerated due to its efficiency over time. Replacing all vehicles is very costly and unecological. Therefore, it is necessary to address the second influencing factor, and that is the technical condition of the tram line. The modernisation of the line presented in the experimental part of the paper is implemented not only due to the reduction of noise-vibration emissions but also due to the degradation of materials of the tram line components. Specific results in terms of the above-evaluated parameters are provided below.

5. Findings from Experimental Noise Measurements

The main objective of experimental noise measurements in localities B1, B2, and B3 was to determine noise levels generated by standard operation in the modernised sections. In the location on Štúr Street, in the densely built-up zone of the city, noise levels were measured in the vicinity of building no. 20 (building of the Police of the Slovak Republic) during standard operation on the tram line and local road in the given section, at point B1H (approx. 1.4 m from the building). As a relevant comparative noise parameter, the values of the equivalent continuous noise level LAeq in (dB) at weighted function A were applied. In measurements in the location on Štúr Street, it was possible to measure noise levels in various acoustic and traffic conditions (diffuse noise field at maximum tram speeds, acceleration, and retardation of trams from distant stops).
On the basis of the findings, the following can be stated:
  • The results of experimental noise measurements at the measuring points on Štúr Street were achieved for trams with speeds from 20 to 50 km/h in the given sections. To define the noise conditions for a given number of performed measurements, it was possible to select the passages of trams on the K1 and K2 tracks with extreme values of noise levels. Extreme values of noise levels LAeq in location B1H were achieved during tram passages on track K1 (approximately 3 m from point B1H), where in cases of older types of trams, the value max LAeq = 75.56 dB was reached (no. 12). In the case of new types of trams, the value max LAeq = 74.15 dB (no. 1). For the tram passage on track K2 (approximately 5.2 m from B1H), the value max LAeq = 72.24 dB (no. 8) was reached for older tram types and the value max LAeq = 72.90 dB (no. 10) for new tram types.
  • Extreme values of noise levels LAeq in B2H location (bridge approximately 4.0 m from track K1) were achieved during the passages of a new type of trams on track K1, where the value of max LAeq = 76.39 dB (No. 7), and during the passage of these trams on track K2 (approximately 6.0 m from B2H), the value max LAeq = 70.77 dB was reached (no. 6).
Extreme values of noise levels LAeq in B3H location (bridge—approximately 4.0 m from track K1) were achieved for passage of a new type of trams on track K1 in the value max LAeq = 74.56 dB (no. 1) and during the passage of these trams on track K2 (approximately 6.0 m from B2H) value max LAeq = 68.41dB (no. 4).
Vibration and noise events are strongly correlated and influence each other. When the track oscillates while the tram is running on a geometrically and structurally poor-quality track, the noise from rolling the wheel on the track becomes the dominant source of the noise. Therefore, the correct and modern design of tram lines with anti-vibration elements in the subsoil significantly reduces the emission of noise into their surroundings.

6. Findings from the Vibration Measurements

The main objective of experimental vibration measurements in B1 and B2 sites was to determine the levels of vibration generated by the standard operation on the tram track in the modernised sections. In the tram zone on Štúr Street, in the densely built-up area of the city, vibration levels were measured on the cellar wall of building no. 20 (building of the Police of the Slovak Republic) at point B1V and in the third field on the bridge structure at points B2V, during the standard traffic operation in the given line section. As a relevant comparison parameter of vibration levels, the effective value of the amplitudes of the vibration velocity vrms (mm/s) is considered in the given case. On the basis of the findings, the following can be stated:
  • The results of experimental vibration measurements in the location on Štúr Street were obtained from measurements of vibration levels in different traffic conditions, creating multi-source excitation vibration fields with random characteristics—during different tram speeds, their acceleration and retardation from distant tram stops, etc. (trams in the given sections moved at speeds from 20 to 50 km/h). For the number of measurements performed at point B1V (in the x and z directions), in order to determine the vibration conditions in this location, it was possible to select the relevant characteristic passages of trams on tracks K1 and K2. Extreme values of vrmsvibration amplitudes in the B1V location were achieved by the vibration of foundation structures in the vertical direction (B1Vz), during tram passages on the K1 track (approximately 4.2 m from B1V). In the cases of older types of trams, the achieved value of vrms = 1.76 mm/s, and in the case of new types of trams, the value max vrms = 2.29 mm/s.
  • During the tram passages on the track K2 (approximately 6.6 m from B1V), the value max vrms = 1.73 mm/s was reached on the older track. In the new track cases, the value max vrms = 1.90 mm/s was achieved. Extreme values of amplitudes of vibrations vrms in the B1V location were achieved by the vibration of foundation structures in the horizontal direction y (B1Vy), during the passage of trams on the track K1 (approximately 4.2 m from B1V), where in the case of older types of trams, the value max vrms = 3.31 mm/s was reached. In cases of new types of trams, the value max vrms = 3.43 mm/s was achieved. During the tram passages on the K2 track (approximately 6.6 m from the B1V), the value of max vrms = 3.26 mm/s was reached for the new tram types. The absolute extreme value of the amplitude of the vibration velocity during all measurements was achieved in the case of a passage of a new type of tram on K2, namely, max v(t) = 26.24 mm/s. The results of the spectral analysis at the B1V point pointed to the fact that the maximum values of vibration levels at the building foundations in the case of older types of trams occurred mostly in the band of dominant frequencies fD = 60 to 80 Hz. In the case of new types of trams, it was in the band of dominant frequencies fD = 75 to 100 Hz.
  • The results of experimental vibration measurements on the Old Bridge in the location of the tram line B2 were obtained from the vibration levels on the steel–concrete bridge deck at point B2V (approximately 1.5 m from K1), generated by the standard tram line operation (tram speeds in the given sections ranged from 30 to 50 km/h). For the performed number of measurements at the measuring point B2V, it was possible, in order to determine the vibration conditions, to select suitable passages of trams on the track K1 and K2. The effective value of the vibration velocity amplitudes vrms (mm/s) is considered to be the relevant noise comparison parameter in the given case. Extreme values of vrms vibration amplitudes in the B2V location were achieved by bridge deck oscillating in the vertical direction z and the horizontal y (B2V) during tram passages on the K1 track (approximately 1.65 m from B2V). Here, the max vrms value was reached for the vibration direction z = 41.37 mm/s and the max value vrms = 46.71 mm/s for the y direction. During the passage of trams on the track K2 (approximately 4.05 m from B2V), the value max vrms = 20.04 mm/s was reached for the direction of vibration z and the value max vrms = 21.07 mm/s for the direction y. The results of the spectral analysis at point B2V pointed to the fact that the maximum values of vibration levels at the foundations of the building occurred mostly in the band of dominant frequencies fD1 = 55 to 70 Hz (fD2 = 170 to 220 Hz).
The detected frequency bands exclude the occurrence of resonant phenomena during the vibration of buildings on Štúr Street, as the values of their basic natural frequencies f0i are considerably below (f0i << 20 Hz) these detected excitation frequency bands. The mentioned frequency bands exclude the occurrence of resonant phenomena during the vibration of the Old Bridge generated by the tram operation on the modernised line, as the values of the fundamental natural frequencies f0i are considerably below (f0i << 10 Hz) these detected excitation frequency bands.
Periodic monitoring of noise and vibration is necessary to reduce the environmental impact of tram traffic. Baseline or initiation measurements must be performed just after the construction of the traffic route. It is also necessary to make measurements after major modifications to the track. Major structural modifications of the tramway include the upgrading of individual sections. In Bratislava, the most loaded radial of the tramway transport system has been modernised due to its unsatisfactory structural and technical condition. A gradual increase in the noise and vibration effects of the tram line in poor condition also contributed to the modernisation. The measurements showing this increase were essential for the decision of the city council to upgrade this radial. A large number of reports of experimental measurements are in the electronic resource [27]. The last measurements before the reconstruction [38] carried out in different sections of the tramway transport system of Bratislava led to the following findings:
  • The noise from tram operation is primarily generated by two sources—the construction of the tram track and the tram vehicles.
  • Noise from the rolling motion of the wheels of the vehicles on the rails is dominant. At standard tram speeds in urban areas, rolling noise represents 80–90% of the total noise emitted.
  • A substantial reduction in noise levels on the modernised sections of track can be expected compared to the current situation (before modernisation).
Reference noise values resulting from measurements before the radial modernisation were in the range of LAeq = 87 to 92 dB [38]. The results of the measurements after the retrofit, reported in Chapter 3 and in the summary section of the conclusions, reported values of LAeq = 68 to 76 dB. However, even with the track modernisation, the reduction of noise levels below the LAeq = 70 dB value reported in the national legislation was not achieved [38]. Faster upgrading of tram vehicles will contribute to the reduction of levels. Monitoring measurements are currently in progress confirming these assumptions (decrease on average to LAeq = 6 dB).
In the aspect of vibrations, the measurements before the modernisation in the monitored locations reached the values of the parameter vrms = 5–15 mm/s. The results of the measurements after the modernisation, presented in Chapter 3 and in the summary section of the conclusions, reached values of vrms = 1–3.5 mm/s. This fact confirms the absolutely significant effects of modernisation on the effects of vibrations on structures in the sense of the current national legislation [39]. This standard defines the necessity to deal with vibration effects for the category of structures close to the track only after the value vrms = 6 mm/s has been exceeded. The vibration measurements on the Old Bridge reached higher values of vrms = 20–47 mm/s even after the retrofitting, but since it is not a residential building, it cannot be assessed in terms of health regulations. However, the measurements at these points are very useful as an initiation for the purpose of monitoring the structural and technical condition of the tramway.
In general, the results of the modernisation of the most loaded tram line in the capital of Slovakia, Bratislava, specifically at its most critical places, revealed a declining trend in the intangible emissions of noise and vibration. This statement is based on the measured and evaluated values of LAeq and vrms. However, it should be emphasised that the monitoring of these parameters must be performed at regular intervals due to the degradative properties of construction materials of building structures and electric vehicles. Overall, the impact of modernising the monitored localities contributed significantly to the increased quality of the environment and indirectly improved the living conditions of people in this location in Bratislava.
The research focused to similar scientific subject as the research presented in this paper can be found in the following references: [40,41,42,43].

Author Contributions

D.P. realised the measurements and made basic evaluation. Z.P. processed the main part of evaluation of measurements. L.I. and P.D. contribution was to made basic description of trams situation in modernised Bratislava tramway presented in paper. All authors have read and agreed to the published version of the manuscript.

Funding

This research received no external funding.

Conflicts of Interest

The authors declare no conflict of interest.

References

  1. European Parliament and the Council. Concerning Integrated Pollution Prevention and Control; European Parliament and the Council: Brussels, Belgium, 2008. [Google Scholar]
  2. Ministry of Health of the Slovak Republic. Decree of the Ministry of Health of the Slovak Republic; No. 237/2009 Coll; Ministry of Health of the Slovak Republic: Bratislava, Slovakia, 2009. [Google Scholar]
  3. British Standards Institution. Guide to Evaluation of Human Exposure to Vibration in Buildings, Vibration Sources Other than Blasting; British Standards Institution: London, UK, 2008. [Google Scholar]
  4. British Standards Institution. Guide to Measurement and Evaluation of Human Exposure to Wholebody Mechanical Vibration and Repeated Shock; British Standards Institution: London, UK, 1999. [Google Scholar]
  5. ISO. Guidance on Sound Insulation and Noise Reduction for Buildings; ISO: Geneva, Switzerland, 1978. [Google Scholar]
  6. ISO. Mechanical Vibration—Ground-Borne Noise and Vibration Arising from Rail Systems; ISO: Geneva, Switzerland, 2005. [Google Scholar]
  7. ISO. Acoustics—Field Measurement of Sound Insulation in Buildings and of Building—Part 3: Façade Sound Insulation; ISO: Geneva, Switzerland, 2016. [Google Scholar]
  8. ISO. Guide for the Evaluation of Human Exposure to Whole Body Vibration; ISO: Geneva, Switzerland, 1978. [Google Scholar]
  9. ISO. Evaluation of Human Exposure to Whole-Body Vibration—Part 2: Continuous and Shock-Induced Vibration in Buildings; ISO: Geneva, Switzerland, 1989. [Google Scholar]
  10. ISO. Acoustics—Measurement of Room Acoustic Parameters—Part 2: Reverberation Time in Ordinary Rooms; ISO: Geneva, Switzerland, 2008. [Google Scholar]
  11. Howarth, H.V.; Griffin, M.J. The annoyance caused by simultaneous noise and vibration from railways. J. Acoust. Soc. Am. 1991, 89, 2317–2323. [Google Scholar] [CrossRef]
  12. Kwok, K.C.; Hitchcock, P.A.; Burton, M.D. Perception of vibration and occupant comfort in wind-excited tall buildings. J. Wind Eng. Ind. Aerodyn. 2009, 97, 368–380. [Google Scholar] [CrossRef]
  13. Sanayei, M.; Maurya, P.; Moore, J.A. Measurement of building foundation and ground-borne vibrations due to surface trains and subways. Eng. Struct. 2013, 53, 102–111. [Google Scholar] [CrossRef]
  14. Gaetano, L.; Luca, F.; Davide, P.; Maria, A.V. Annoyance evaluation due to overall railway noise and vibration in Pisa urban areas. Sci. Total Environ. 2016, 568, 1315–1325. [Google Scholar]
  15. Yokoshima, S.; Morihara, T.; Sato, T.; Yano, T. Combined Effects of High-Speed Railway Noise and Ground Vibrations on Annoyance. Int. J. Environ. Res. Public Health 2017, 14, 845. [Google Scholar] [CrossRef] [PubMed]
  16. Ögren, M.; Gidlöf-Gunnarsson, A.; Smith, M.; Gustavsson, S.; Persson Waye, K. Comparison of Annoyance from Railway Noise and Railway Vibration. Int. J. Environ. Res. Public Health 2017, 14, 805. [Google Scholar] [CrossRef] [PubMed] [Green Version]
  17. Nari, F.; Kim, Y.K.; Kang, S.H.; Park, E.-C.; Jang, S.-I. Association between Occupational Noise and Vibration Exposure and Insomnia among Workers in Korea. Life 2020, 10, 46. [Google Scholar] [CrossRef] [PubMed]
  18. Zou, C.; Zhu, R.; Tao, Z.; Ouyang, D.; Chen, Y. Evaluation of Building Construction-Induced Noise and Vibration Impact on Residents. Sustainability 2020, 12, 1579. [Google Scholar] [CrossRef] [Green Version]
  19. Griffin, M.J. Handbook of Human Vibration; Academic Press: Cambridge, MA, USA, 1990; ISBN 0-12-303040-4. [Google Scholar]
  20. Fiala, P.; Degrande, G.; Augusztinovicz, F. Numerical modelling of ground-borne noise and vibration in buildings due to surface rail traffic. J. Sound Vib. 2007, 301, 718–738. [Google Scholar] [CrossRef]
  21. Benčat, J. Tram vibration assessment in urban areas. In Proceedings of the 15th International Conference on Civil, Structural and Environmental Engineering Computing, Prague, Czech Republic, 30–31 March 2016; Civil–Computer Press: Stirlingshire, Scotland, 2016. [Google Scholar]
  22. Benčat, J.; Papán, D. Soil Dynamic Parameters Determination by Waves Spectral and Correlation Analysis. Procedia Eng. 2017, 190, 334–344. [Google Scholar] [CrossRef]
  23. Hluková Záťaž Obyvateľstva. Available online: https://www.enviroportal.sk/indicator/detail?id=521 (accessed on 13 February 2022).
  24. Spojenaba.sk. Available online: https://www.spojenaba.sk/bratislavske-elektricky-jazdili-medzi-prvymi-na-svete/ (accessed on 12 October 2021).
  25. Imhd.sk. Available online: https://imhd.sk/ba/galeria/2/Elektri%C4%8Dky (accessed on 12 October 2021).
  26. Imhd.sk. Available online: https://imhd.sk/ba/galeria-media/20/%C4%8CKD-Tatra-T2/217424/Tatra-T2-215-v-centre-mesta?ref=ba%2Fgaleria%2F20%2F%25C4%258CKD-Tatra-T2 (accessed on 12 October 2021).
  27. Jex.cz. Available online: https://historickevozidla.jex.cz/thema/historicke-elektricky/ckd-tatra-k2-317 (accessed on 12 October 2021).
  28. Imhd.sk. Available online: https://imhd.sk/pd/galeria-media/601/skusobna-elektricka-skoda-06-t/18870/Skusobna-elektricka-Skoda-06-T-mieri-do-Dubravky?&ref=pd%25252Fgaleria%25252F601%25252Fskoda-06t-elektra.html%25253F (accessed on 12 October 2021).
  29. Asb.sk. Available online: https://www.asb.sk/stavebnictvo/inzinierske-stavby/mosty/rekonstrukcia-stareho-mosta-v-bratislave-specialne-zakladanie (accessed on 12 October 2021).
  30. Imhd.sk. Available online: https://imhd.sk/ba/doc/sk/12874/Petrzalska-elektricka-1-cast-usek-Sturova-Stary-most-Bosakova?dfpi=335 (accessed on 12 October 2021).
  31. Mapy.cz. Available online: https://sk.mapy.cz/turisticka?x=17.1301711&y=48.1285008&z=16&m3d=1&height=1843&yaw=0&pitch=-45&l=0 (accessed on 12 October 2021).
  32. REMING Consult a.s. Tram Line in the Radial Road Dúbravka-Karlova Ves; Technical Report; REMING Consult a.s: Bratislava, Slovakia, 2019. [Google Scholar]
  33. REMING Consult a.s. Tram Line in the Radial Road Dúbravka-Karlova Ves; Characteristic Cross-Sections; REMING Consult a.s: Bratislava, Slovakia, 2020. [Google Scholar]
  34. Yunseon, R. The Acoustic Impedance Measurement System Using Two Microphones; Brüel & Kjær, Sound & Vibration Measurement A/S Denmark: Naerum, Denmark, 2003; Available online: http://www.sea-acustica.es/fileadmin/publicaciones/Sevilla02_phagen035.pdf. (accessed on 13 February 2022).
  35. Valašková, V.; Vlček, J.; Papán, D. Determination of the Small-Scale Physical Model Parameters of Pavement Structure. Sustainability 2020, 12, 9637. [Google Scholar] [CrossRef]
  36. Cik, M.; Lienhart, M.; Lercher, P. Analysis of Psychoacoustic and Vibration-Related Parameters to Track the Reasons for Health Complaints after the Introduction of New Tramways. Appl. Sci. 2016, 6, 398. [Google Scholar] [CrossRef]
  37. Mandula, J.; Salaiová, B.; Kovalaková, M. Prediction of noise from trams. Appl. Acoust. 2002, 63, 373–389. [Google Scholar] [CrossRef]
  38. Benčat, J. Technical Report. 2015. Available online: https://www.enviroportal.sk/eia/dokument/230134 (accessed on 13 February 2022).
  39. STN EN 1998-1:2005/NA/Z2; Design of Structures for Earthquake Resistance-Part 1: General Rules, Seismic Actions and Rules for Buildings, Technical Seismicity. The European Union: Maastricht, The Netherlands, 2005.
  40. Morihara, T.; Yokoshima, S.; Matsumoto, Y. Effects of Noise and Vibration Due to the Hokuriku Shinkansen Railway on the Living Environment: A Socio-Acoustic Survey One Year after the Opening. Int. J. Environ. Res. Public Health 2021, 18, 7794. [Google Scholar] [CrossRef] [PubMed]
  41. Maclachlan, L.; Ögren, M.; Van Kempen, E.; Hussain-Alkhateeb, L.; Persson Waye, K. Annoyance in Response to Vibrations from Railways. Int. J. Environ. Res. Public Health 2018, 15, 1887. [Google Scholar] [CrossRef] [PubMed] [Green Version]
  42. Lercher, P.; De Coensel, B.; Dekonink, L.; Botteldooren, D. Community Response to Multiple Sound Sources: Integrating Acoustic and Contextual Approaches in the Analysis. Int. J. Environ. Res. Public Health 2017, 14, 663. [Google Scholar] [CrossRef] [PubMed] [Green Version]
  43. Bao, Y.; Li, Y.; Ding, J. A Case Study of Dynamic Response Analysis and Safety Assessment for a Suspended Monorail System. Int. J. Environ. Res. Public Health 2016, 13, 1121. [Google Scholar] [CrossRef] [PubMed]
Figure 1. Currently operated tram vehicles in Bratislava [26,27,28].
Applsci 12 06947 g001
Figure 2. Modernisation of Petržalka radial [30,31].
Applsci 12 06947 g002
Figure 3. Schematic cross-section of the Old Bridge structure with details of the tram line superstructure, 1—EDILON Corkelast filling material, 2—EDILON Primer U90WB primer, 3—EDILON Primer 21 2K coating, 4—EDILON Cork Wedge K-cork wedge ZKS, 5—EDILON polymer filling block Fillerblock 021, 6—EDILON polymer filling block Fillerblock 020, 7—EDILON polymer washers ZKS, 8—EDILON elastic belt of recessed rail system (ZKS), 9—EDILON Dex-G type 20, 10—concrete gutter, 11—rails, 12—steel profile, 13—steel connecting strap + mounting kit [32].
Applsci 12 06947 g003
Figure 4. Schematic cross-section of the tram line structure outside the bridge structure [33].
Applsci 12 06947 g004
Figure 5. Location of measured points B1H (B1V) used devices and view of the monitored building—Štúr Street.
Applsci 12 06947 g005
Figure 6. Block scheme of the standard connection of the measuring line.
Applsci 12 06947 g006
Figure 7. Frequency spectrum of values of noise levels of selected measurements (from above LZFmax, LZSmax, LZeq, LZSmin, LZFmin).
Applsci 12 06947 g007
Figure 8. Vibration velocity time history v(t) and power spectral density Gii of the vibration velocity recording for measurements for new types of trams.
Applsci 12 06947 g008
Figure 9. Time history of values of noise levels LAeq of selected measurements.
Applsci 12 06947 g009
Figure 10. Vibration velocity time history v(t) and power spectral density Gii of the vibration velocity recording for measurements for old types of trams.
Applsci 12 06947 g010
Figure 11. Total signal waveform of vibration velocity v(t).
Applsci 12 06947 g011
Figure 12. Amplitude spectrum of Gzz (measurement no. 1) and Gyy (measurement no. 3) in logarithmic scale from vibration velocity recording.
Applsci 12 06947 g012
Figure 13. Route of the modernised tram line with the stop locations.
Applsci 12 06947 g013
Figure 14. View of the reconstructed Old Bridge over the Danube in Bratislava and the tram line placed in the concrete roadway and its transverse profile.
Applsci 12 06947 g014
Figure 15. Location of measured points B2H, B3H (B2V) in the location on the Old Bridge.
Applsci 12 06947 g015
Figure 16. Time history of noise level values LAeq of selected measurements.
Applsci 12 06947 g016
Figure 17. The 1/3 octave frequency spectrum band of noise level values of selected measurements (from above LZFmax, LZSmax, LZeq, LZSmin, LZFmin).
Applsci 12 06947 g017
Figure 18. Vibration velocity time history v(t) and power spectral density Gii from vibration velocity record for measurements with achieved extreme values of vibration velocity amplitudes.
Applsci 12 06947 g018
Table 1. Overview of experimental measurement data in Bratislava, Štúr Street.
Bratislava—Štúr Street
Measurement NumberTypeTrackDirectionVelocity
(km/h)
Time
1NK1PE–CE3010:26
2 (+)NK1 + K2Both directions3010:30
3NK1PE–CE3510:33
4NK1PE–CE3010:37
5NK2CE–PE4010:42
6OK1PE–CE3010:48
7OK1PE–CE3510:58
8OK2CE–PE3511:01
9OK1PE–CE3011:07
10NK2CE–PE3511:11
11NK1PE–CE3511:13
12OK1PE–CE3011:18
O, N: old type of tram, new type of tram; PE–CE: direction from Petržalka to Centre; CE–PE: direction from Centre to Petržalka; (+) combination.
Table 2. Time history of measurements and overview of values of measured quantities of the whole record in B1H.
Bratislava—Štúr Street
Measurement Number/TrackDirection/TypeStart of MeasurementElapsed Time (s)LAeq
(dB)
LCpeak
(dB)
LAFmax
(dB)
LAFmin
(dB)
1/K1CE/N10:26:570874.15103.0180.3763.06
2 (+)/K1 + K2CE,PE/O10:30:391172.36100.4877.5160.18
3/K1CE/N10:33:381271.01101.0378.0159.70
4/K1CE/N10:37:291071.60100.8980.1660.96
5/K2PE/N10:42:271372.0096.6577.4662.67
6/K1CE/O10:48:241373.18101.0581.5259.44
7/K1CE/O10:58:171271.3293.9476.1360.62
8/K2PE/O11:01:251072.2495.4476.3962.72
9/K1CE/O11:07:420973.0498.4578.9159.97
10/K2PE/N11:11:001272.9095.1278.6759.82
11/K1CE/N11:13:401173.19100.2479.6960.77
12/K1CE/O11:18:111075.56101.1981.5866.39
O, N: old type of Tram, new type of tram; PE–CE: direction from Petržalka to Centre; CE–PE: direction from Centre to Petržalka; (+) combination.
Table 3. Values of noise levels in the 1/3 octave frequency spectrum band at B1H of selected measurements.
Measurement Number 10Measurement Number 12
Frequency (Hz)LZFmax
(dB)
LZSmax
(dB)
LZFmin
(dB)
LZSmin
(dB)
LZeq
(dB)
LZFmax
(dB)
LZSmax
(dB)
LZFmin
(dB)
LZSmin
(dB)
LZeq
(dB)
12.566.9066.9054.8854.8861.1658.6058.6051.1251.1255.08
16.064.8564.8555.6655.6660.8558.9758.9753.4553.4555.90
31.566.2865.4859.3260.3263.0270.6169.7356.4058.3564.93
63.080.2776.7059.4064.9971.5771.9969.8756.3060.9165.31
125.071.1364.8450.3854.3961.3474.2469.9054.2658.8465.06
500.077.8875.3452.6360.3170.5478.5776.4058.4763.2971.71
100069.8568.4749.1156.1264.5169.5866.8551.3256.3062.30
200061.8860.6441.8445.9656.0166.1862.1247.8352.8257.65
400051.2450.0535.5938.9846.9456.2954.1140.2944.5549.77
800047.7243.0125.3329.2339.6550.2744.1928.1733.8839.93
16.00034.7730.8311.4515.6527.4647.3939.3113.8920.7130.87
20.00036.3830.0110.4113.1325.8039.7231.7511.0215.7324.43
A78.6776.7359.8264.3272.9081.5879.7766.3968.3675.56
C85.5882.2268.6172.3778.5286.5884.4871.8473.4680.03
Table 4. Amplitude characteristics from vibration velocity time records at points B1Vz and B1Vy.
Bratislava—Štúr StreetB1VyB1Vz
Measurement Number/Track/Direction/TypeStart/Elapsed Time (s)vmax
(mm/s)
vmin
(mm/s)
vrms
(mm/s)
vmax
(mm/s)
vmin
(mm/s)
vrms
(mm/s)
1/K1/CE/N10:26/0810.05−9.111.5711.27–10.371.84
2/K1 + K2/CE,PE/N10:30/117.93−7.861.259.67–11.041.91
3/K1/CE/N10:33/1220.31−20.403.438.29−9.821.55
4/K1/CE/N10:37/1017.40−19.563.2113.79−11.101.58
5/K2/PE/N10:42/1323.64−19.853.269.21−12.161.72
6/K1/CE/O10:48/1317.05−18.241.9611.65−12.971.37
7/K1/CE/O10:58/1225.31−20.213.318.33−9.941.76
8/K2/PE/O11:01/1020.97−19.393.148.91−10.801.73
9/K1/CE/O11:07/0910.24−8.341.879.24−8.781.41
10/K2/PE/N11:11/1226.24−20.383.0910.09−10.851.90
11/K1/CE/N11:13/1118.17−18.672.9516.35−11.872.29
12/K1/CE/O11:18 / 108.66−9.961.908.77−8.121.29
O, N: old type of tram, new type of tram; CE: direction to Centre; PE: direction to Petržalka.
Table 5. Overview of noise measurement data on the New Bridge, in the B2H and B3H localities.
Bratislava—New Bridge—B2H
M.N.TypeTrackDirectionVelocity
(km/h)
Time
1NK1CE–PE4512:58
2NK2PE–CE4013:02
3NK1CE–PE4513:03
4NK2PE–CE4013:05
5NK1CE–PE5013:08
6NK2PE–CE4513:11
7NK1CE–PE4513:13
8NK2PE–CE4013:15
9NK1CE–PE4513:19
10NK2PE–CE4013:21
11NK2PE–CE4013:25
12NK1CE–PE4813:28
Bratislava—New Bridge—B3H
1NK1CE–PE4013:34
2NK2PE–CE3013:36
3NK1CE–PE3513:39
4NK2PE–CE3013:42
N: new type of tram; PE–CE: direction from Petržalka to Centre; CE–PE: direction from Centre to Petržalka.
Table 6. Time history of measurements and overview of values of measured quantities of the whole record at B2H and B3H.
Bratislava—New Bridge—B2H
M.N.Direction/TypeStart of MeasurementElapsed Time (s)LAeq
(dB)
LCpeak
(dB)
LAFmax
(dB)
LAFmin
(dB)
1PE/N12:58:471275.83109.2784.2860.80
2CE/N13:02:011770.75106.7579.3053.90
3PE/N13:03:011973.46109.5083.8953.61
4CE/N13:05:442468.98104.3877.8353.61
5PE/N13:08:582173.02109.6682.6552.45
6CE/N13:11:291970.77107.1180.1650.21
7PE/N13:13:021276.39109.9884.9860.41
8CE/N13:15:412368.53104.0777.3449.79
9PE/N13:19:101973.54109.6483.8358.00
10CE/N13:21:492468.07104.0376.8549.24
11CE/N13:25:281970.76106.5679.9450.44
12PE/N13:28:552572.20110.0581.9151.96
Bratislava—City bridge—B3H
1PE/N13:34:361874.56110.1883.2155.10
2CE/N13:36:431668.37102.3475.3451.88
3PE/N13:39:411674.00107.6782.9056.81
4CE/N13:42:191668.41103.2776.0354.00
N: new type of tram; CE: direction to Centre; PE: direction to Petržalka.
Table 7. Values of noise levels in the 1/3 octave frequency spectrum band in B2H and B3H of selected measurements.
Measurement Number 6—B2HMeasurement Number 7—B3H
Frequency (Hz)LZFmax
(dB)
LZSmax
(dB)
LZFmin
(dB)
LZSmin
(dB)
LZeq
(dB)
LZFmax
(dB)
LZSmax
(dB)
LZFmin
(dB)
LZSmin
(dB)
LZeq
(dB)
12.571.1471.1460.6560.6566.2271.7371.7362.5762.5768.37
16.069.3069.3056.3556.3565.0368.4568.4562.8662.8666.04
31.579.2378.0460.0260.0272.2179.4978.4966.3167.1773.27
63.091.4488.7062.3569.0281.7893.0290.3773.8875.5984.43
125.085.3382.0152.3558.7474.8885.3382.1063.0465.9977.20
500.073.1869.4741.0044.3962.5779.8875.6648.8952.5569.49
100066.2564.6539.4941.8658.0271.4567.7948.1550.3562.48
200062.2760.3830.6634.3052.6867.4364.7738.8841.5458.71
400057.6454.6623.4427.8047.3156.4654.3029.0232.5249.06
800052.2850.1515.5618.6841.8948.6146.3816.8721.0240.44
16,00040.6138.478.049.2929.7033.6331.708.7810.1825.46
20,00038.4034.459.119.9626.1031.3328.799.4910.1322.91
A80.1677.5750.2154.2070.7784.9881.5760.4162.4576.39
C96.6092.9567.0073.0686.1698.7295.1277.5080.0589.61
Measurement Number 1—B3HMeasurement Number 4—B3H
Frequency (Hz)LZFmax
(dB)
LZSmax
(dB)
LZFmin
(dB)
LZSmin
(dB)
LZeq
(dB)
LZFmax
(dB)
LZSmax
(dB)
LZFmin
(dB)
LZSmin
(dB)
LZeq
(dB)
12.571.9271.9263.1563.1568.5270.4870.4860.1960.1966.20
16.070.3770.3755.3955.3966.5466.8666.8659.2859.2863.77
31.582.3180.9866.1365.8475.8976.2475.1662.7365.1672.02
63.097.9694.0970.6970.9587.9887.1484.7564.1568.7779.78
125.088.7884.9657.8059.4078.1682.8977.6053.7358.4172.45
500.073.9172.0944.3445.7265.1266.2362.7342.7546.3358.58
100067.5465.5843.7044.0259.7360.8958.6142.4244.8854.54
200065.9063.5238.0639.5156.7560.1157.0436.6639.3352.36
400059.8356.1231.2532.1149.3460.1355.1127.0331.7649.47
800048.3645.1620.1425.3538.3550.7846.1718.2023.6740.10
16,00036.8632.859.1214.2926.2840.7736.089.4110.2229.03
20,00033.1530.279.6411.7923.6637.7633.599.759.6726.07
A83.2181.2955.1056.1874.5676.0372.4754.0056.1568.41
C100.3597.4070.0176.2491.3092.9389.370.1674.4084.73
Table 8. Amplitude characteristics from time records of vibration velocity at points B2Vz and B2Vy.
Bratislava—New BridgeB2VyB2Vz
Measurement Number/Track/Direction/TypeStart/Elapsed time (s)vmax
(mm/s)
vmin
(mm/s)
vrms
(mm/s)
vmax
(mm/s)
vmin
(mm/s)
vrms
(mm/s)
1/K1/PE/N12:58/12511.58−449.5946.71471.65−574.0341.37
2/K2/CE/N13:02/17245.89−244.5917.66236.04−195.3819.58
3/K1/PE/N13:03/19435.83−473.0138.20551.18−516.0323.69
4/K2/CE/N13:05/24154.85−153.8112.62187.62−180.1615.07
5/K1/PE/N13:08/21525.84−477.3632.51437.11−503.3027.81
6/K2/CE/N13:11/19276.38−272.3721.07232.9−205.4520.04
7/K1/PE/N13:13/12543.39−588.0740.39500.03−500.8335.13
8/K2/CE/N13:15/23205.61−177.8713.48200.81−169.2515.61
9/K1/PE/N13:19/19505.84−507.1135.52504.89−542.1831.91
10/K2/CE/N13:21/24191.28−164.6314.23235.72−208.4217.62
11/K2/CE/N13:25/19236.03−256.2317.86236.33−215.4217.56
12/K1/PE/N13:28/25376.16−340.7520.90392.77−429.9921.13
O, N: old type of tram, new type of tram; CE: direction to Centre; PE: direction to Petržalka.
Publisher’s Note: MDPI stays neutral with regard to jurisdictional claims in published maps and institutional affiliations.

