
Chemical Profiling of Limonium vulgare Mill. Using UHPLC-DAD-ESI/MS2 and GC-MS Analysis


Abstract
:Featured Application
Abstract
1. Introduction
2. Materials and Methods
2.1. Chemicals
2.2. Plant Material and Extracts Preparation
2.3. Gas Chromatography—Mass Spectrometry
2.4. Liquid Chromatography—Mass Spectrometry
2.5. Statistical Analysis
3. Results and Discussion
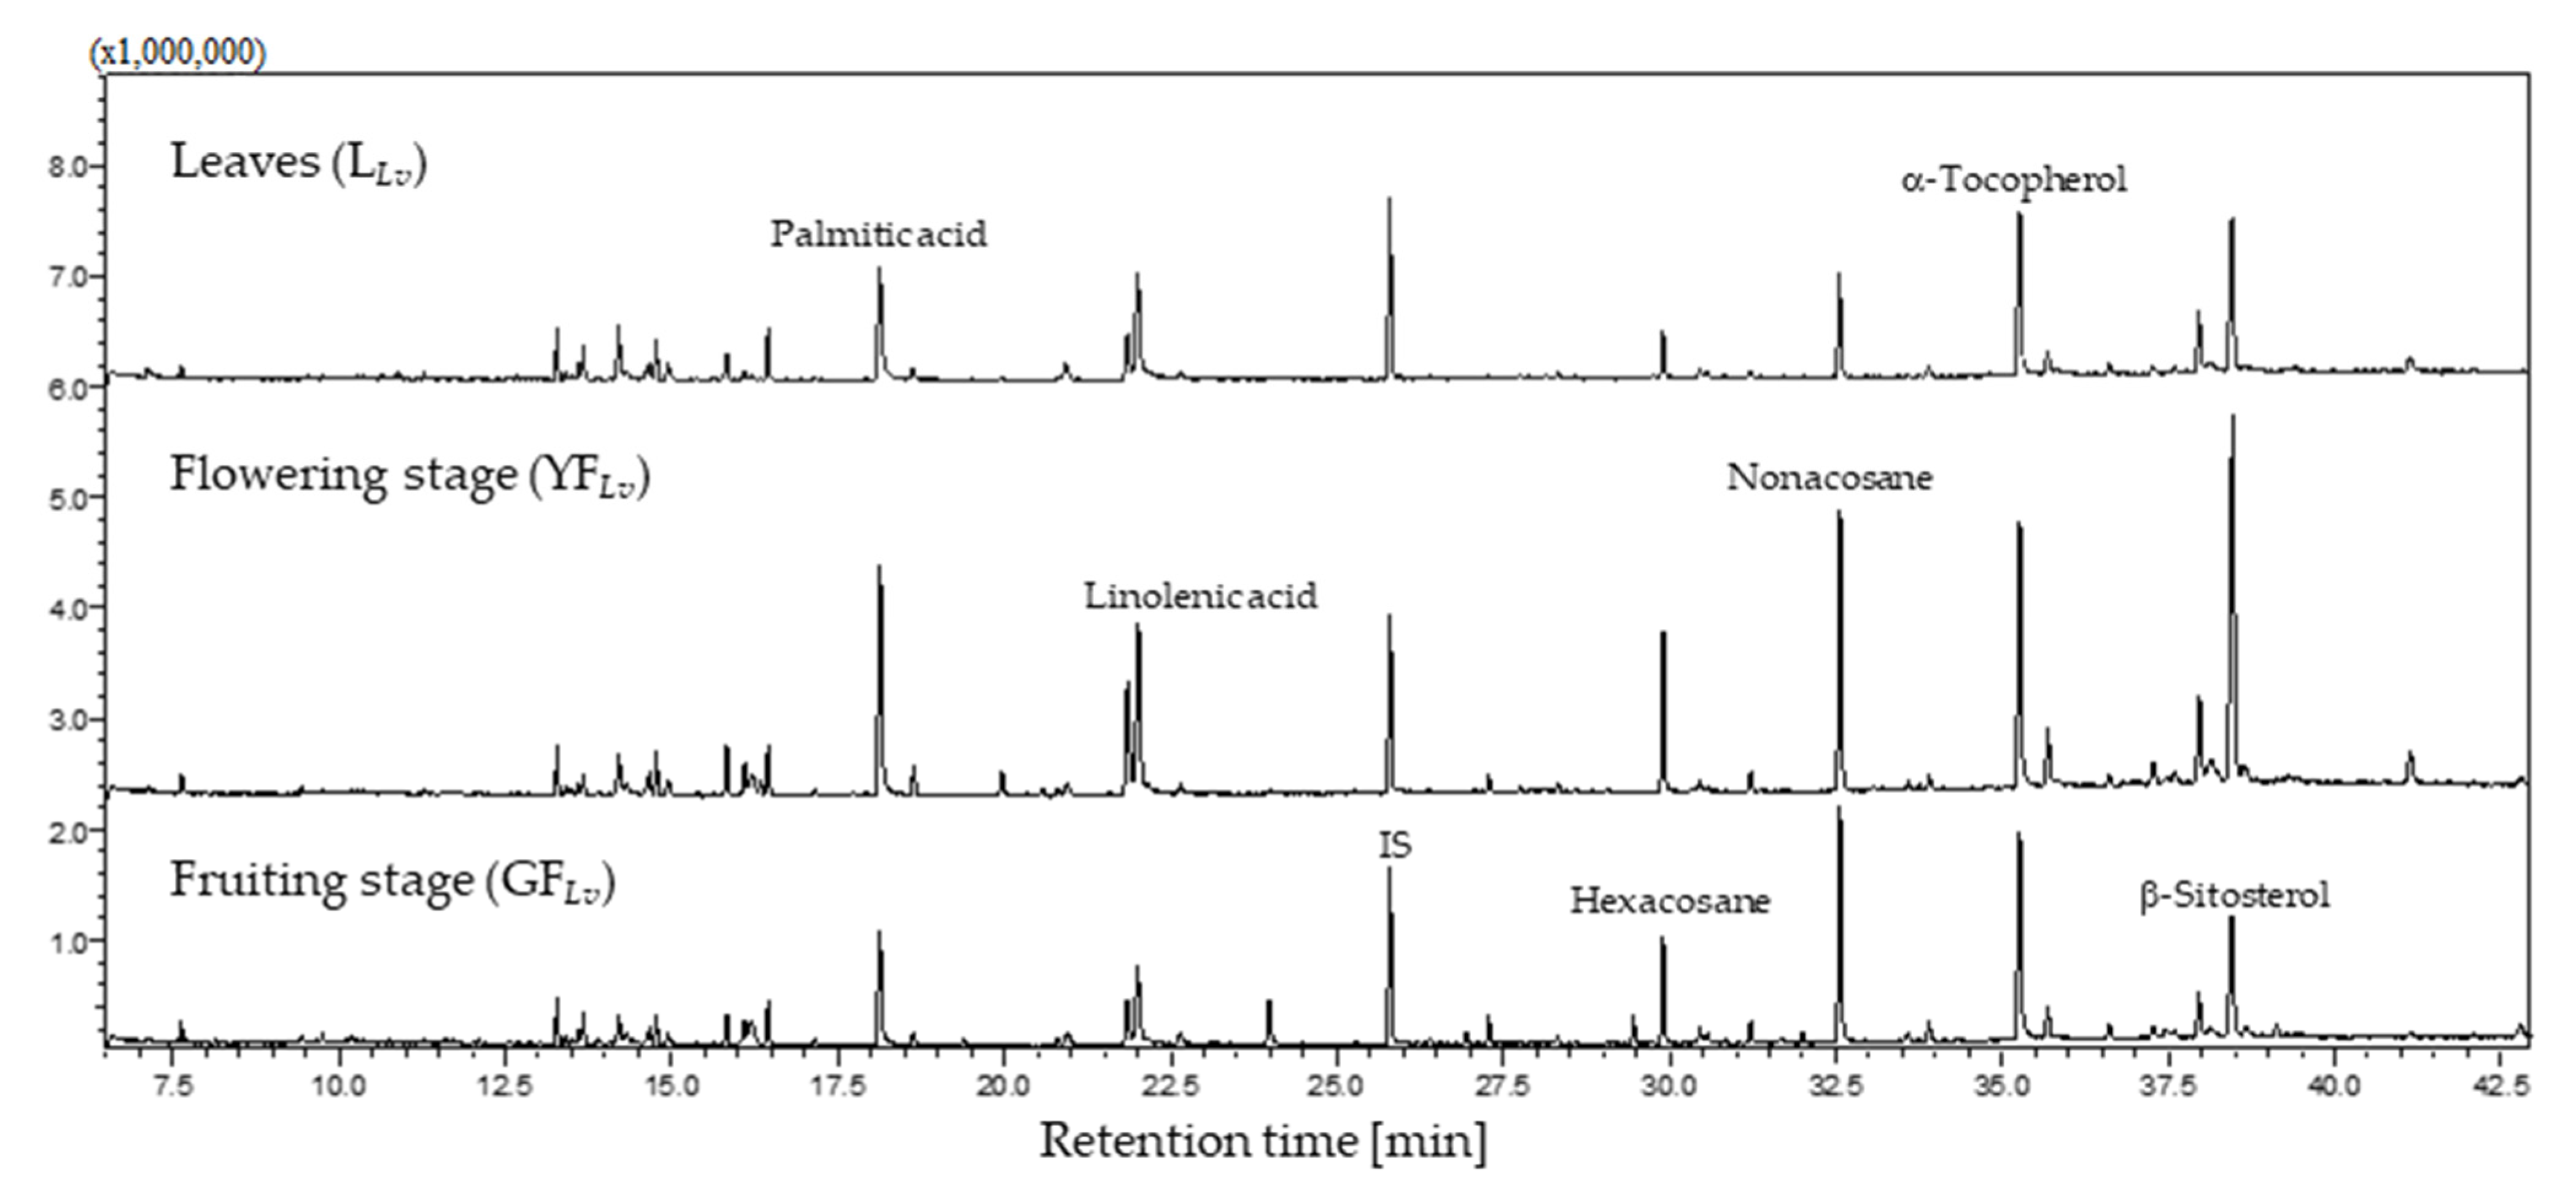
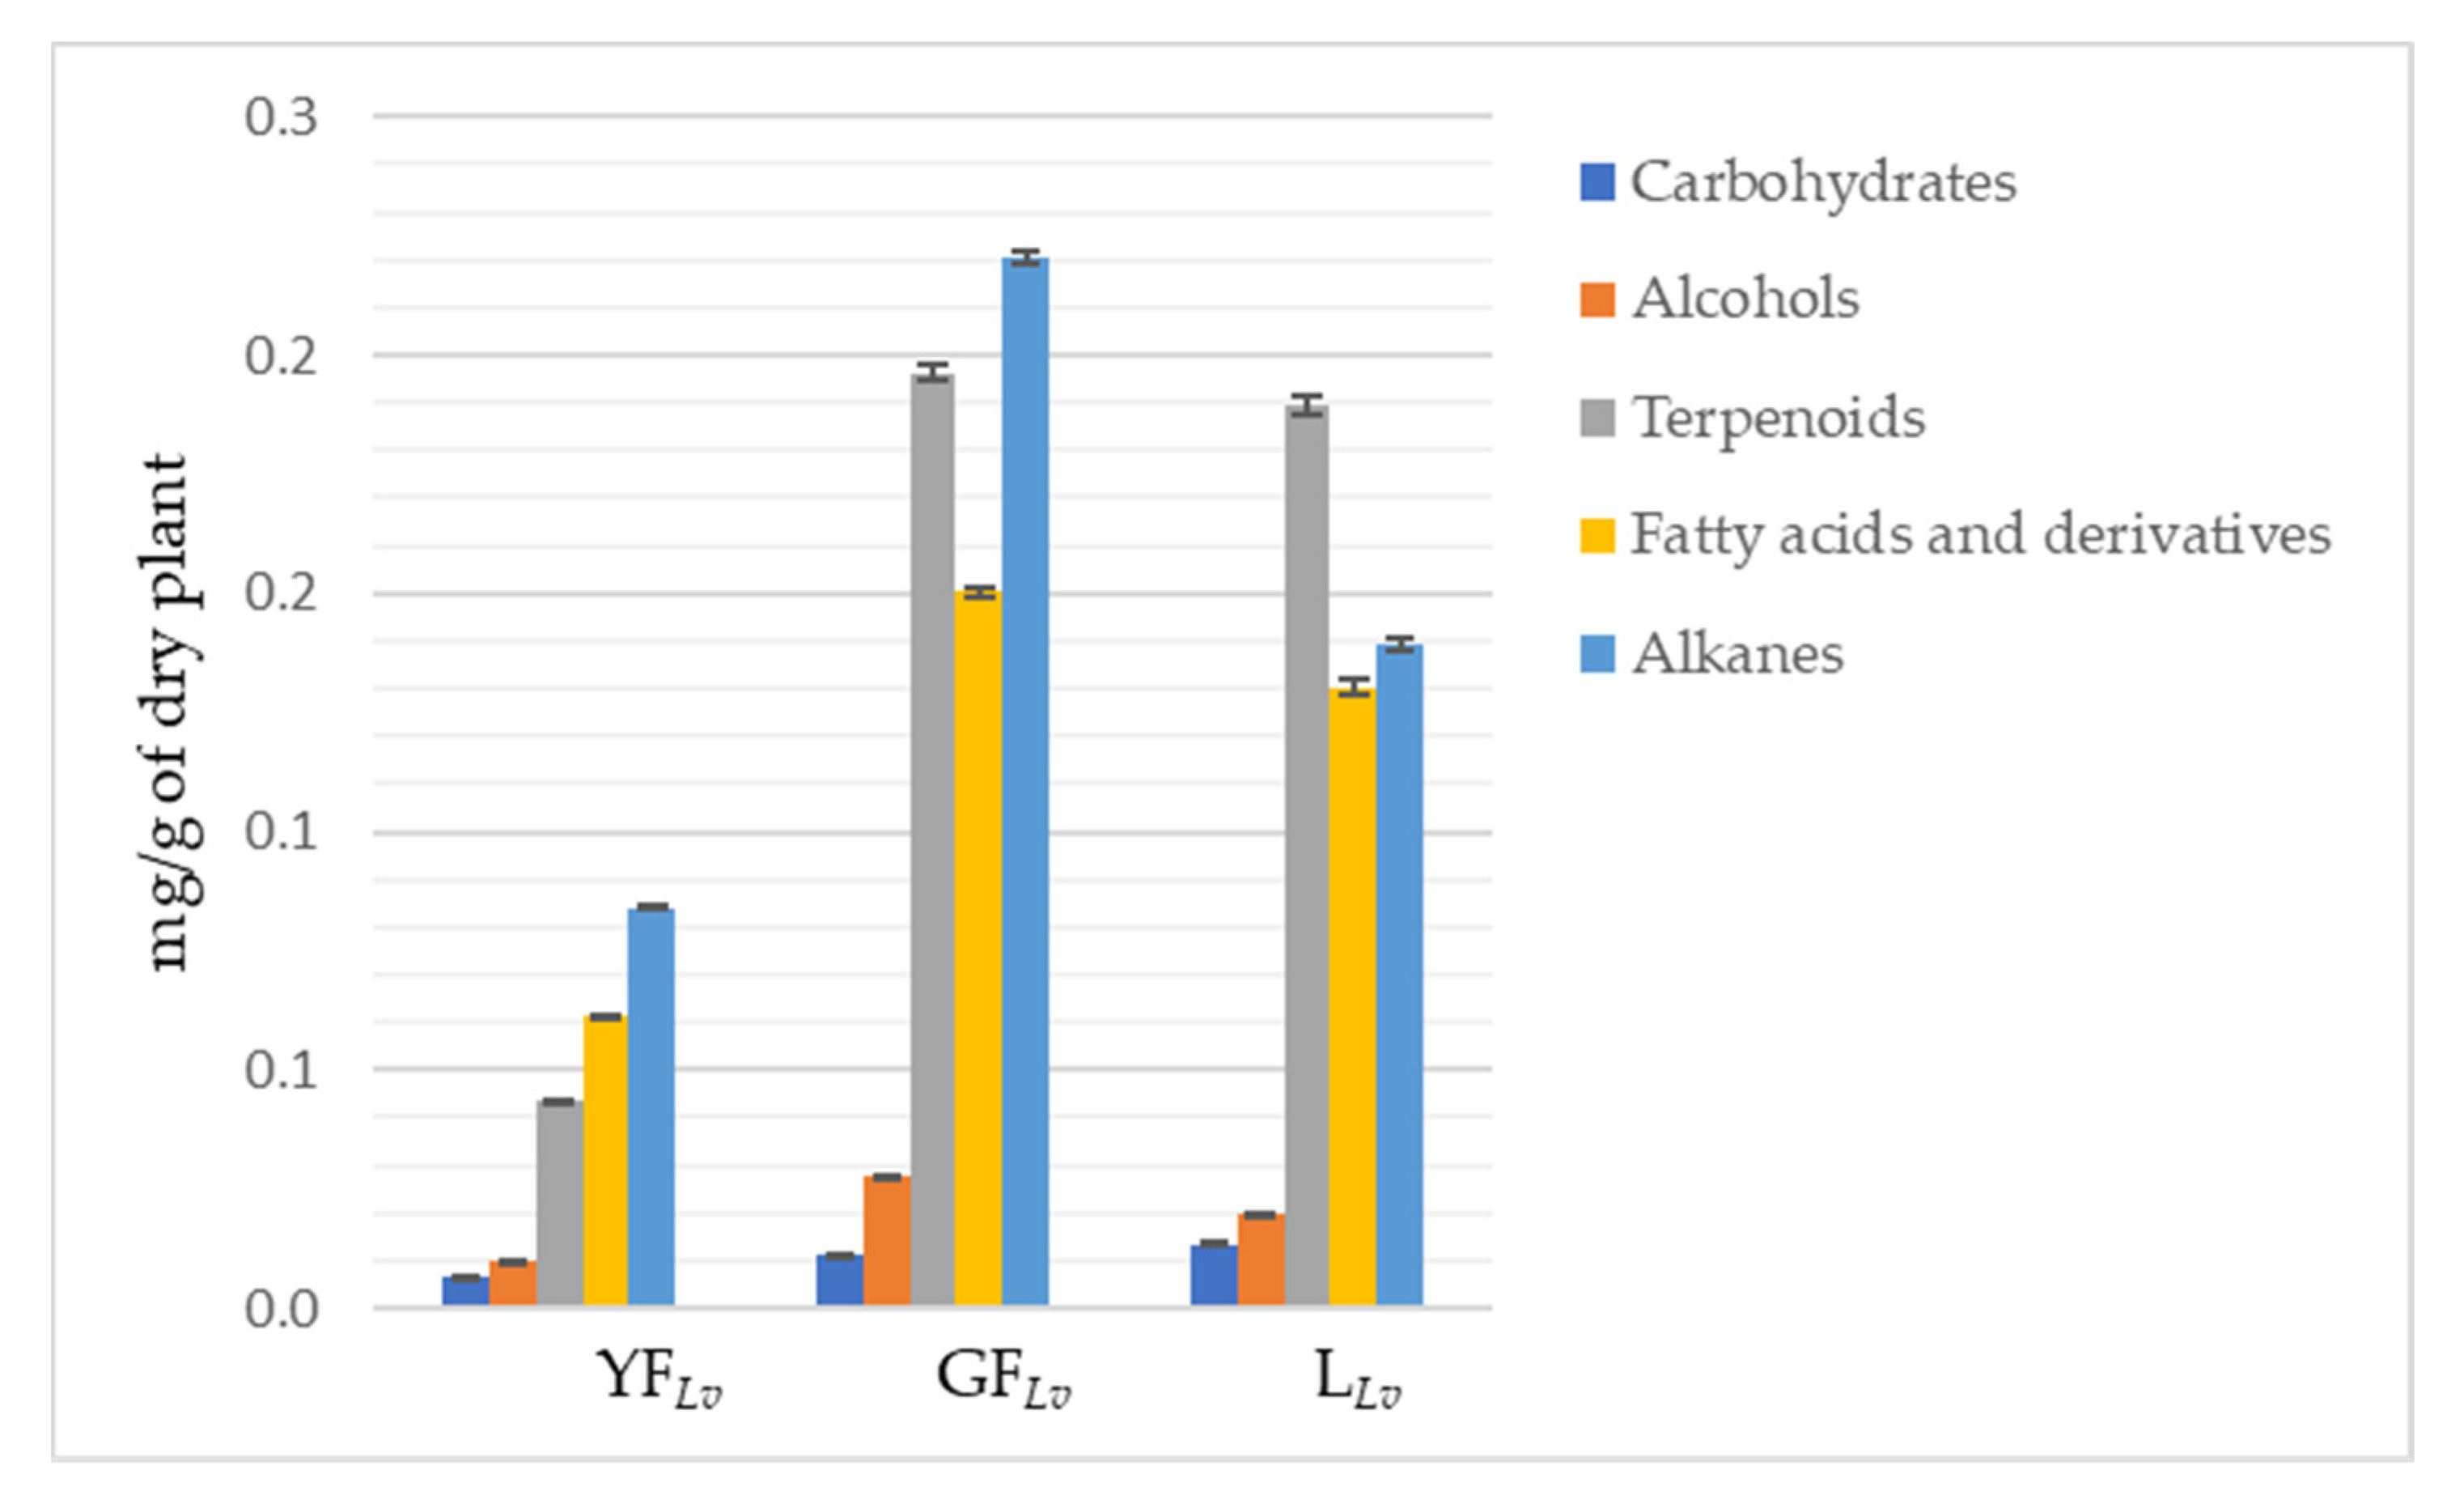
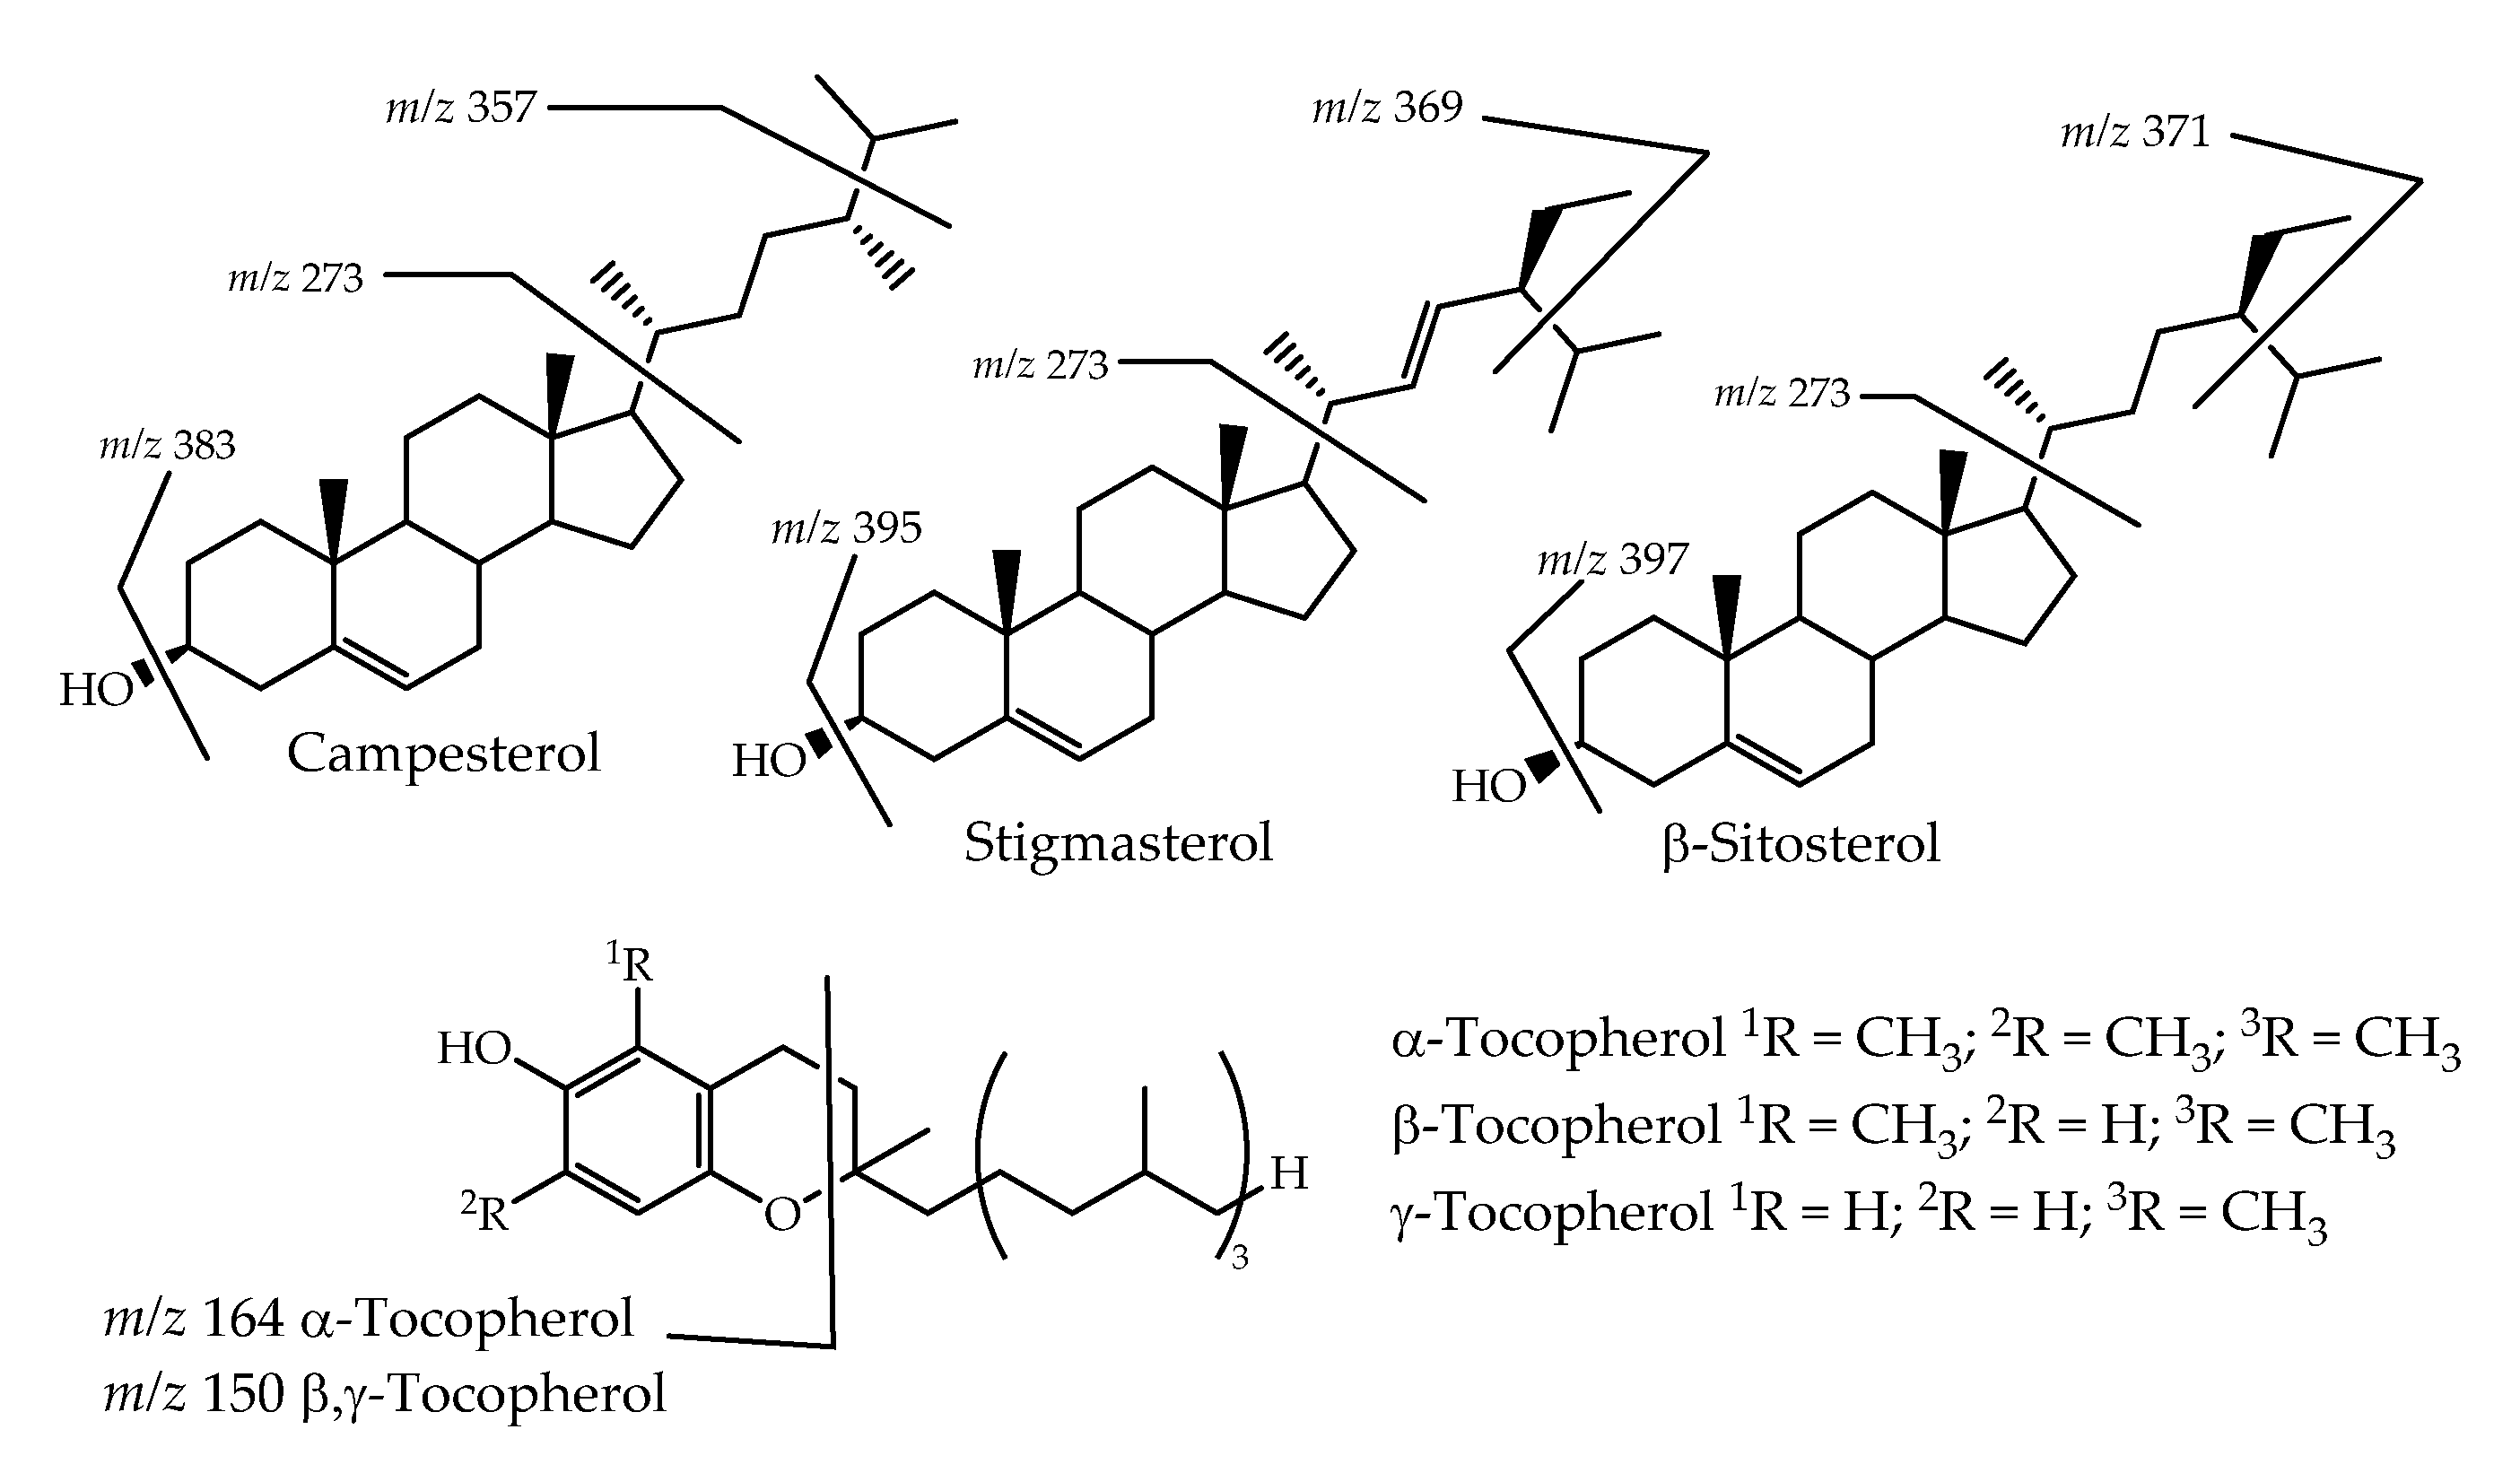
3.1. GC-MS Profile
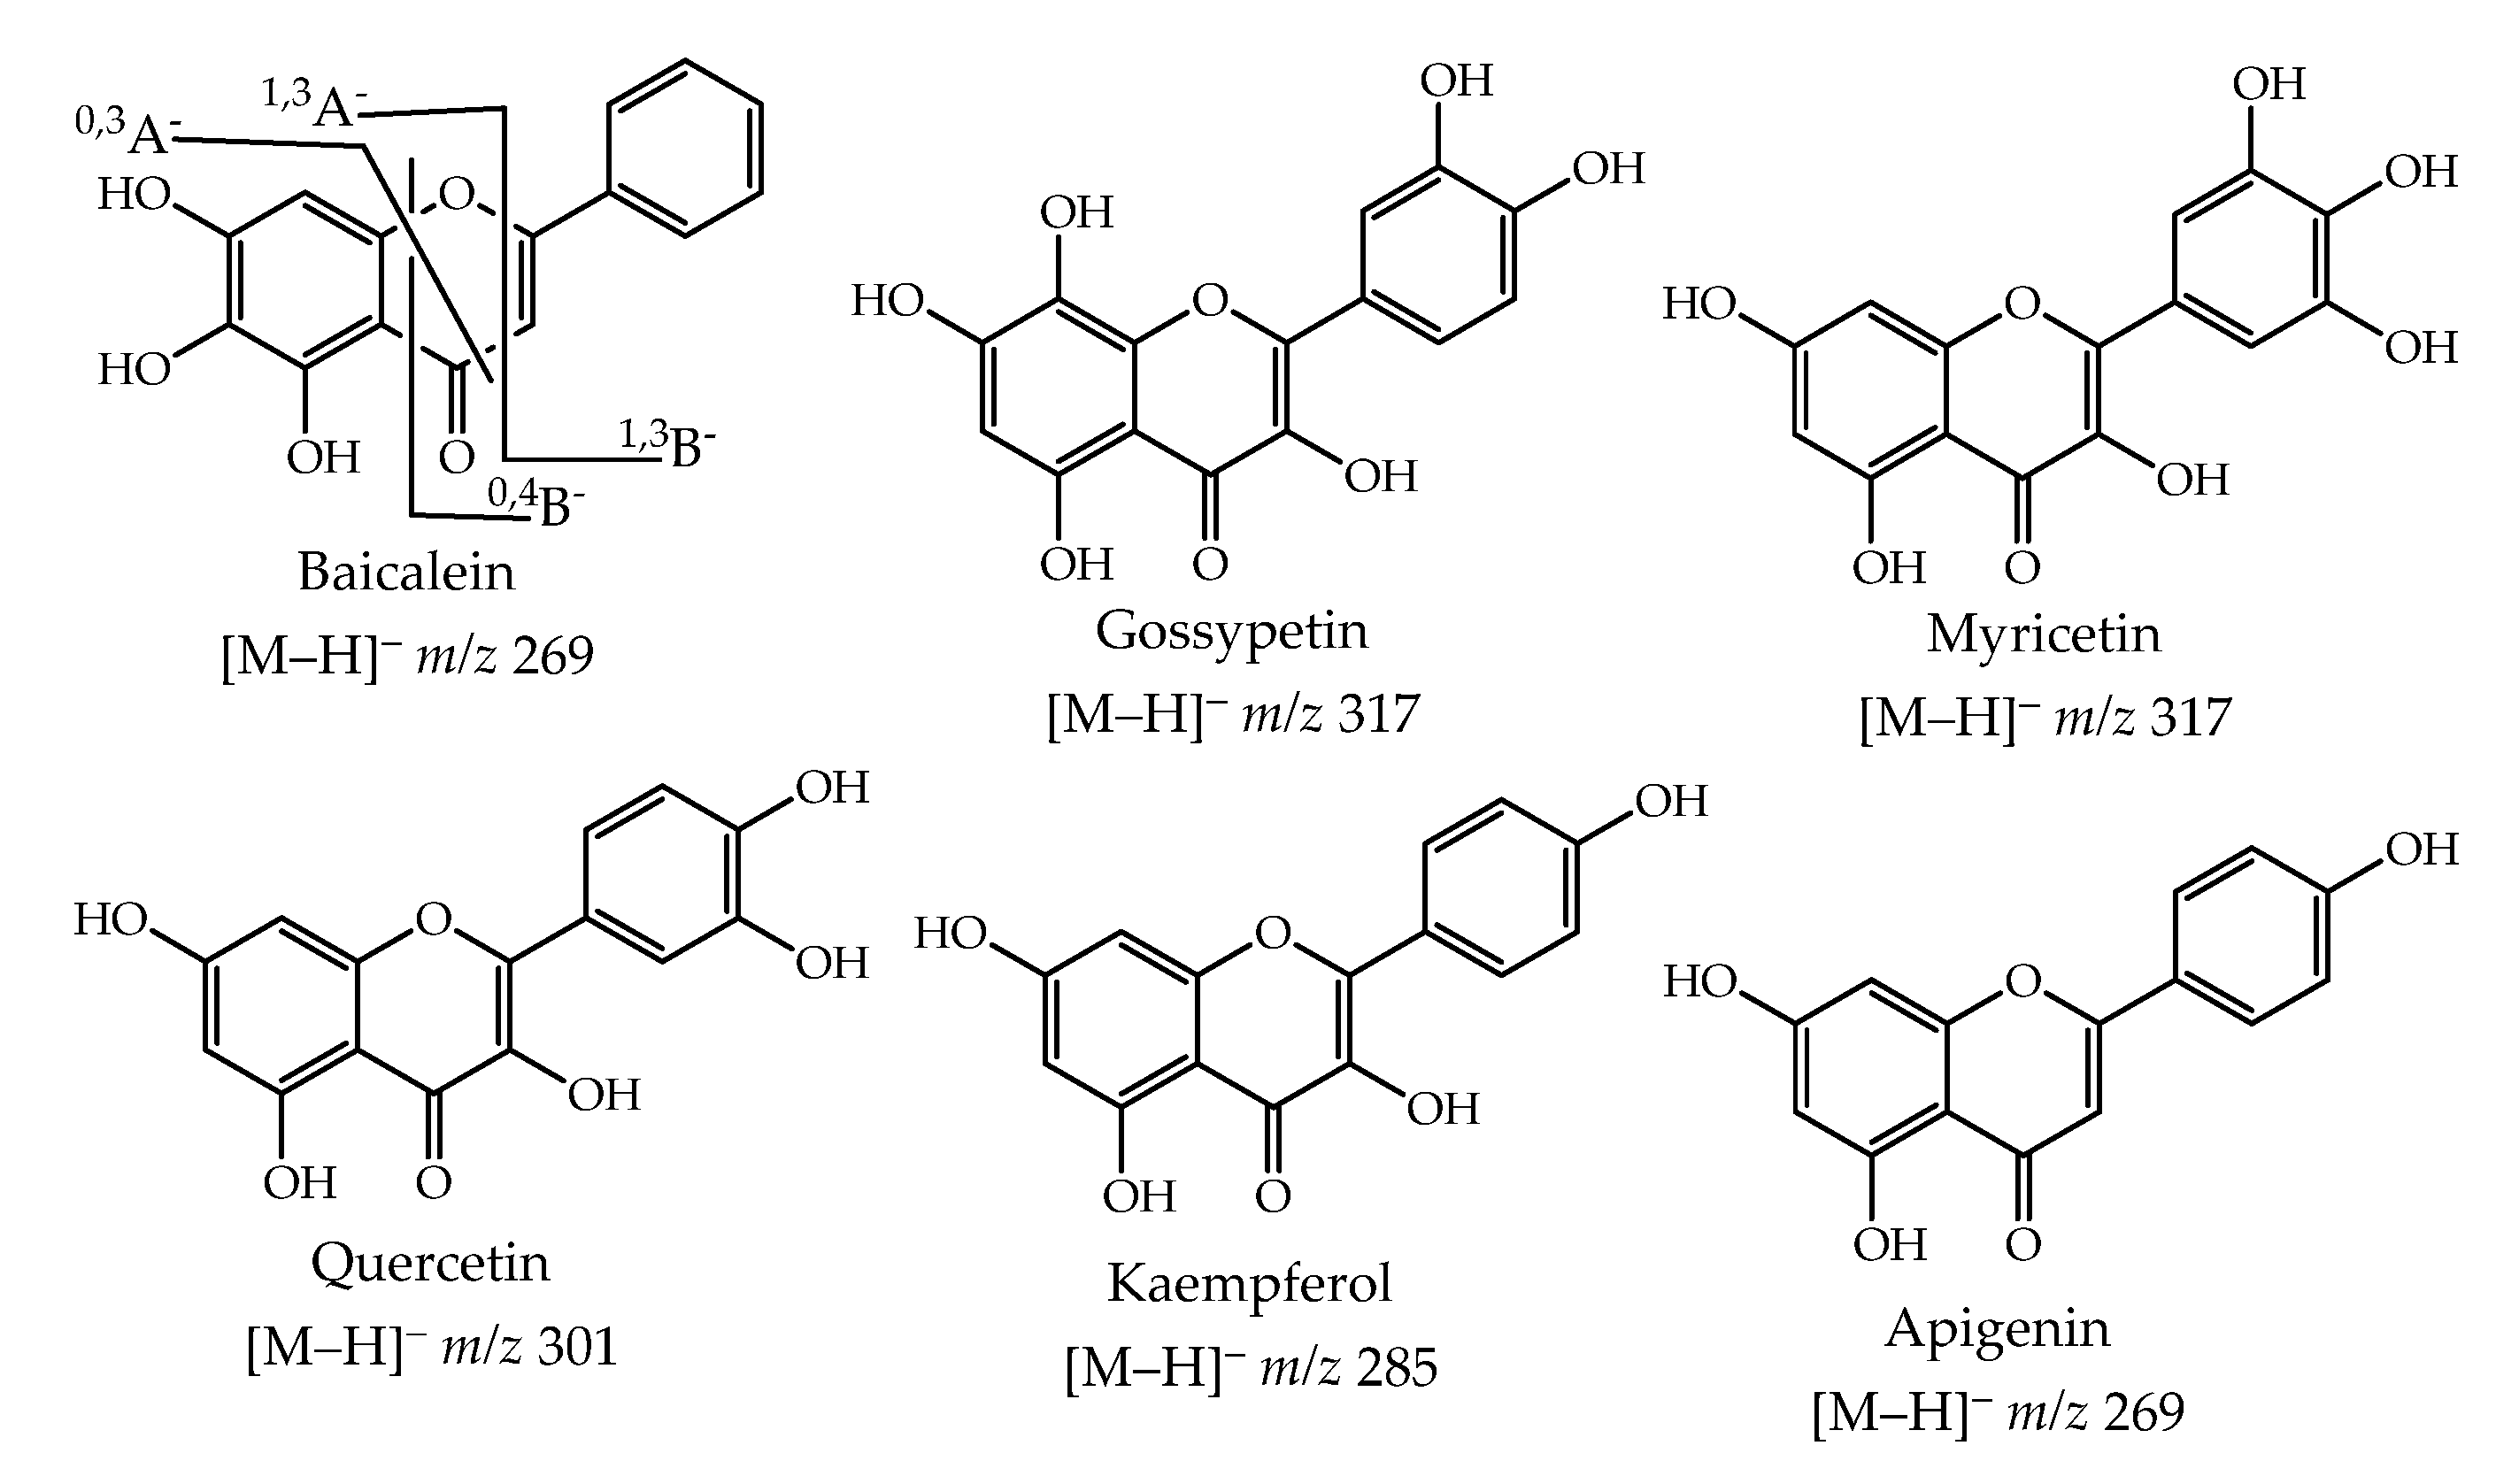
3.2. LC-MS Profile
4. Conclusions
Supplementary Materials
Author Contributions
Funding
Institutional Review Board Statement
Informed Consent Statement
Data Availability Statement
Acknowledgments
Conflicts of Interest
References
- Plants of the World Online. Available online: https://powo.science.kew.org/taxon/urn:lsid:ipni.org:names:687035-1#descriptions (accessed on 4 May 2022).
- Tuteja, N.; Gill, S.S. Climate Change and Plant Abiotic Stress Tolerance; Wiley-VCH Verlag GmbH & Co. KGaA: Weinheim, Germany, 2014. [Google Scholar]
- Chandna, R.; Azooz, M.M.; Ahmad, P. Recent advances of metabolomics to reveal plant response during salt stress. In Salt Stress in Plants: Signalling, Omil and Adaptation; Chandna, R., Azooz, M.M., Ahmad, P., Eds.; Springer: New York, NY, USA, 2013; pp. 1–15. [Google Scholar]
- Souid, A.; Bellani, L.; Gabriele, M.; Pucci, L.; Smaoui, A.; Abdelly, C.; Hamed, K.B.; Longo, V. Phytochemical and biological activities in Limonium species collected in different biotopes of Tunisia. Chem. Biodivers. 2019, 16, e1900216. [Google Scholar] [CrossRef] [PubMed]
- Lellau, T.F.; Liebezeit, G. Activity of ethanolic extracts of salt marsh plants from the lower Saxonian Wadden sea coast against microorganisms. Senckenbergiana Marit. 2003, 32, 177–181. [Google Scholar] [CrossRef]
- Lellau, T.F.; Liebezeit, G. Cytotoxic and antitumor activities of ethanolic extracts of salt marsh plants from the lower Saxonian Wadden sea, southern North Sea. Pharm. Biol. 2008, 41, 293–300. [Google Scholar] [CrossRef]
- Geng, D.; Chi, X.; Dong, Q.; Hu, F. Antioxidants screening in Limonium aureum by optimized on-line HPLC-DPPH assay. Ind. Crops Prod. 2015, 67, 492–497. [Google Scholar] [CrossRef]
- Ruiz-Riaguas, A.; Zengin, G.; Sinan, K.I.; Salazar-Mendías, C.; Llorent-Martínez, E.J. Phenolic profile, antioxidant activity, and enzyme inhibitory properties of Limonium delicatulum (Girard) Kuntze and Limonium quesadense Erben. J. Chem. 2020, 2020, 1016208. [Google Scholar] [CrossRef] [Green Version]
- Senizza, B.; Zhang, L.; Rocchetti, G.; Zengin, G.; Ak, G.; Yildiztugay, E.; Elbasan, F.; Jugreet, S.; Mahomoodally, M.F.; Lucini, L. Metabolic profiling and biological properties of six Limonium species: Novel perspectives for nutraceutical purposes. Food Funct. 2021, 12, 3443–3454. [Google Scholar] [CrossRef]
- Lin, L.-C.; Chou, C.-J. Flavonoids and phenolics from Limonium sinense. Planta Med. 2000, 66, 382–383. [Google Scholar] [CrossRef]
- Gadetskaya, A.V.; Tarawneh, A.H.; Zhusupova, G.E.; Gemejiyeva, N.G.; Cantrell, C.L.; Cutler, S.J.; Ross, S.A. Sulfated phenolic compounds from Limonium caspium: Isolation, structural elucidation, and biological evaluation. Fitoterapia 2015, 104, 80–85. [Google Scholar] [CrossRef] [Green Version]
- Faustino, M.V.; Seca, A.M.L.; Silveira, P.; Silva, A.M.S.; Pinto, D.C.G.A. Gas Chromatography—Mass spectrometry profile of four Calendula L. taxa: A comparative analysis. Ind. Crops Prod. 2017, 104, 91–98. [Google Scholar] [CrossRef]
- Costa, H.R.; Simão, I.; Silva, H.; Silveira, P.; Silva, A.M.S.; Pinto, D.C.G.A. Aglaomorpha quercifolia (L.) Hovenkamp & S. Linds a wild fern used in Timorese cuisine. Foods 2021, 10, 87. [Google Scholar]
- Füzfai, Z.; Boldizsár, I.; Molnar-Perl, I. Characteristic fragmentation patterns of the trimethylsilyl and trimethylsilyl-oxime derivatives of various saccharides as obtained by gas chromatography coupled to ion-trap mass spectrometry. J. Chromatogr. A 2008, 1177, 183–189. [Google Scholar] [CrossRef] [PubMed]
- Suttiarporn, P.; Chumpolsri, W.; Mahatheeranont, S.; Luangkamin, S.; Teepsawang, S.; Leardkamolkarn, V. Structures of phytosterols and tripernoids with potential anti-cancer activity in bran of black non-glutinous rice. Nutrients 2015, 7, 1672–1687. [Google Scholar] [CrossRef] [PubMed] [Green Version]
- Golm Metabolome Database (GMD). Available online: http://gmd.mpimp-golm.mpg.de/ (accessed on 4 May 2022).
- Nič, M.; Jirát, J.; Košata, B.; Jenkins, A.; McNaught, A. IUPAC Compendium of Chemical Terminology; IUPAC: Research Triagle Park, NC, USA, 2009. [Google Scholar]
- Faustino, M.V.; Faustino, M.A.F.; Silva, H.; Silva, A.M.S.; Pinto, D.C.G.A. Lipophilic metabolites of Spartina maritima and Puccinellia maritima involved in their tolerance to salty environments. Chem. Biodivers. 2020, 17, e2000316. [Google Scholar] [CrossRef] [PubMed]
- Wang, Z.-Y.; Xiong, L.; Li, W.; Zhu, J.-K.; Zhu, J. The plant cuticle is required for osmotic stress regulation of abscisic acid biosynthesis and osmotic stress tolerance in Arabidopsis. Plant Cell 2011, 23, 1071–1984. [Google Scholar] [CrossRef] [PubMed] [Green Version]
- Kirchoff, B.K.; ClaBen-Bockhoff, R. Inflorescences: Concepts, function, development and evolution. Ann. Bot. 2013, 112, 1471–1476. [Google Scholar] [CrossRef] [PubMed] [Green Version]
- Wu, D.; Cai, S.; Chen, M.; Ye, L.; Chen, Z.; Zhang, H.; Dai, F.; Wu, F.; Zhang, G. Tissue metabolic responses to salt stress in wild and cultivated Barley. PLoS ONE 2013, 8, e55431. [Google Scholar] [CrossRef]
- Slama, I.; Abdelly, C.; Bouchereau, A.; Flowers, T.; Savouré, A. Diversity, distribution and roles of osmoprotective compounds accumulated in halophytes under abiotic stress. Ann. Bot. 2015, 115, 433–447. [Google Scholar] [CrossRef] [Green Version]
- Meng, X.; Zhou, J.; Sui, N. Mechanisms of salt tolerance in halophytes: Current understanding and recent advances. Open Life Sci. 2018, 13, 149–154. [Google Scholar] [CrossRef]
- Wu, J.; Seliskar, D.M.; Gallagher, J.L. The response of plasma membrane lipid composition in callus of the halophyte Spartina patens (Poaceae) to salinity stress. Am. J. Bot. 2005, 92, 852–858. [Google Scholar] [CrossRef]
- Duarte, B.; Cabrita, M.T.; Marques, J.C.; Caçador, I. Leaf fatty acid remodelling in the salt-excreting halophytic grass Spartina patens along a salinity gradient. Plant Physiol. Biochem. 2018, 124, 112–116. [Google Scholar] [CrossRef]
- Duarte, B.; Cabrita, M.T.; Gameiro, C.; Matos, A.R.; Godinho, R.; Marques, J.C.; Caçador, I. Disentangling the photochemical salinity tolerance in Aster tripolium L.: Connecting biophysical traits with changes in fatty acid composition. Plant Biol. 2017, 19, 239–248. [Google Scholar] [CrossRef] [PubMed]
- Du, Y.; Fu, X.; Chu, Y.; Wu, P.; Liu, Y.; Ma, L.; Tian, H.; Zhu, B. Biosynthesis and the roles of plant sterols in development and stress responses. Int. J. Mol. Sci. 2022, 23, 2332. [Google Scholar] [CrossRef] [PubMed]
- Nattagh-Eshtivani, E.; Barghchi, H.; Pahlavani, N.; Barati, M.; Amiri, Y.; Fadel, A.; Khosravi, M.; Talebi, S.; Arzhang, P.; Ziaei, R.; et al. Biological and pharmacological effects and nutritional impact of phytosterols: A comprehensive review. Phytother. Res. 2022, 36, 299–322. [Google Scholar] [CrossRef] [PubMed]
- Arya, R.; Saldanha, S.N. Dietary phytochemicals, epigenetics, and colon cancer chemoprevention. In Epigenetics of Cancer Prevention; Bishayee, A., Bhatia, D., Eds.; Elsevier Inc.: Amsterdam, The Netherlands, 2019; Volume 8, pp. 205–229. [Google Scholar]
- Scheppele, S.E.; Mitchum, R.K.; Rudolph, C.J.; Kinneberg, K.F.; Odell, G.V. Mass spectra of tocopherols. Lipids 1972, 7, 297–304. [Google Scholar] [CrossRef]
- Szewczyk, K.; Chojnacka, A.; Górnicka, M. Tocopherols and tocotrienols—Bioactive dietary compounds; what is certain, what is doubt? Int. J. Mol. Sci. 2021, 22, 6222. [Google Scholar] [CrossRef]
- Mahajan, S.; Tuteja, N. Cold, salinity and drought stresses: An overview. Arch. Biochem. Biophys. 2005, 444, 139–158. [Google Scholar] [CrossRef]
- Hu, L.; Zhou, K.; Li, Y.; Chen, X.; Liu, B.; Li, C.; Gong, X.; Ma, F. Exogenous myo-inositol alleviates salinity-induced stress in Malus hupehensis Rehd. Plant Physiol. Biochem. 2018, 133, 116–126. [Google Scholar] [CrossRef]
- Dias, M.C.; Pinto, D.C.G.A.; Silva, A.M.S. Plant flavonoids: Chemical characteristics and biological activity. Molecules 2021, 26, 5377. [Google Scholar] [CrossRef]
- Kahkeshani, N.; Farzaei, F.; Fotouhi, M.; Alavi, S.S.; Bahramsoltani, R.; Naseri, R.; Momtaz, S.; Abbasabadi, Z.; Rahimi, R.; Farzaei, M.H.; et al. Pharmacological effects of gallic acid in health and diseases: A mechanistic review. Iran. J. Basic Med. Sci. 2019, 22, 225–237. [Google Scholar]
- Rodrigues, M.J.; Monteiro, I.; Castañed-Loaiza, V.; Placines, C.; Oliveira, M.C.; Reis, C.; Caperta, A.D.; Soares, F.; Pousão-Ferreira, P.; Pereira, C.; et al. Growth performance, in vitro antioxidant properties and chemical composition of the halophyte Limonium algarvense Erben are strongly influenced by the irrigation salinity. Ind. Crops Prod. 2020, 143, 111930. [Google Scholar] [CrossRef]
- Rodrigues, M.J.; Castañed-Loaiza, V.; Monteiro, I.; Pinela, J.; Barros, L.; Abreu, R.M.V.; Oliveira, M.C.; Reis, C.; Soares, F.; Pousão-Ferreira, P.; et al. Metabolomic profile and biological properties of sea lavender (Limonium algarvense Erben) plants cultivated with aquaculture wastewaters: Implications for its use in herbal formulations and food additives. Foods 2021, 10, 3104. [Google Scholar] [CrossRef] [PubMed]
- Faustino, M.V.; Faustino, M.A.F.; Silva, H.; Cunha, Â.; Silva, A.M.S.; Pinto, D.C.G.A. Puccinellia maritima, Spartina maritima, and Spartina patens halophytic grasses: Characterization of polyphenolic and chlorophyll profiles and evaluation of their biological activities. Molecules 2019, 24, 3796. [Google Scholar] [CrossRef] [PubMed] [Green Version]
- March, R.E.; Miao, X.-S. A fragmentation study of kaempferol using electrospray quadrupole time-of-flight mass spectrometry at high mass resolution. Int. J. Mass Spectrom. 2004, 231, 157–167. [Google Scholar] [CrossRef]
- Vukics, V.; Guttman, A. Structural characterization of flavonoid glycosides by multi-stage mass spectrometry. Mass Spectrom. Rev. 2010, 29, 1–16. [Google Scholar] [CrossRef] [PubMed]
- Kang, J.; Price, W.E.; Ashton, J.; Tapsell, L.C.; Johnson, S. Identification and characterization of phenolic compounds in hydromethanolic extracts of sorghum wholegrains by LC-ESI-MSn. Food Chem. 2016, 211, 215–226. [Google Scholar] [CrossRef] [PubMed] [Green Version]
- Farias, L.S.; Mendez, A.S.L. LC/ESI-MS method applied to characterization of flavonoids glycosides in B. forficate subsp. pruinose. Quim. Nova 2014, 37, 483–486. [Google Scholar] [CrossRef]
- Yuan, T.; Guo, X.-F.; Shao, S.-Y.; An, R.-M.; Wang, J.; Sun, J. Characterization and identification of flavonoids from Bambusa chungii leaves extract by UPLC-ESI-Q-TOF-MS/MS. Acta Chromtagr. 2021, 33, 281–294. [Google Scholar] [CrossRef]
- Simões, M.A.M.; Pinto, D.C.G.A.; Neves, B.M.R.; Silva, A.M.S. Flavonoid profile of the Genista tridentate L., a species used traditionally to treat inflammatory processes. Molecules 2020, 25, 812. [Google Scholar] [CrossRef] [Green Version]
- Harborne, J.B.; Baxter, H. The Handbook of Natural Flavonoids; John Wiley & Sons Ltd.: Chichester, UK, 1999. [Google Scholar]
- Yang, L.; Wen, K.-S.; Ruan, X.; Zhao, Y.-X.; Wei, F.; Wang, Q. Response of plant secondary metabolites to environmental factors. Molecules 2018, 23, 762. [Google Scholar] [CrossRef] [Green Version]
- Barreca, D.; Trombetta, D.; Smeriglio, A.; Mandalari, G.; Romeo, O.; Felice, M.R.; Gattuso, G.; Nabavi, S.M. Food flavonols: Nutraceuticals with complex health benefits and functionalities. Trends Food Sci. Technol. 2021, 117, 194–204. [Google Scholar] [CrossRef]
- Monjotin, N.; Amiot, M.J.; Fleurentin, J.; Morel, J.M.; Raynal, S. Clinical evidence of the benefits of phytonutrients in human healthcare. Nutrients 2022, 14, 1712. [Google Scholar] [CrossRef] [PubMed]
- Imran, M.; Saeed, F.; Hussain, G.; Imran, A.; Mehmood, Z.; Gondal, T.A.; El-Ghorab, A.; Ahmad, I.; Pezzani, R.; Arshad, M.U.; et al. Myricetin: A comprehensive review on its biological potentials. Food Sci. Nutr. 2021, 9, 5854–5868. [Google Scholar] [CrossRef] [PubMed]


| Assigned Identification b | RT | YFLv | GFLv | LLv |
|---|---|---|---|---|
| Carbohydrates | ||||
| d-Psicose d,e,f | 14.67 | 0.025 ± 0.001 | 0.036 ± 0.001 | 0.051 ± 0.002 |
| d-Glucose c,d,e | 14.77 | 0.038 ± 0.001 | 0.074 ± 0.001 | 0.083 ± 0.001 |
| Total carbohydrates | 0.063 ± 0.001 | 0.110 ± 0.001 | 0.134 ± 0.002 | |
| Alcohols | ||||
| d-Pinitol d,e,f | 13.67 | 0.015 ± 0.001 | 0.031 ± 0.001 | 0.037 ± 0.001 |
| scyllo-Inositol d,e,f | 15.82 | 0.019 ± 0.001 | 0.045 ± 0.001 | 0.038 ± 0.001 |
| Hexadecan-1-ol c,d,e | 16.33 | nd | 0.022 ± 0.002 | nd |
| myo-Inositol d,e,f | 18.63 | 0.039 ± 0.001 | 0.013 ± 0.001 | 0.031 ± 0.001 |
| Oleyl-alcohol d,e,f | 19.96 | 0.028 ± 0.001 | 0.152 ± 0.002 | 0.091 ± 0.002 |
| Octadecan-1-ol c,d,e | 20.57 | nd | 0.014 ± 0.003 | nd |
| Total alcohols | 0.101 ± 0.001 | 0.277 ± 0.003 | 0.197 ± 0.002 | |
| Terpenoids | ||||
| Neophytadiene d,e,f | 14.20 | 0.046 ± 0.001 | 0.139 ± 0.006 | 0.181 ± 0.007 |
| Phytol d,e,f | 14.94 | 0.035 ± 0.001 | 0.110 ± 0.003 | 0.117 ± 0.005 |
| β-Tocopherol d,e,f | 33.59 | 0.054 ± 0.001 | 0.192 ± 0.001 | 0.162 ± 0.002 |
| γ-Tocopherol d,e,f | 33.76 | nd | nd | 0.160 ± 0.002 |
| α-Tocopherol c,d,e | 35.69 | 0.080 ± 0.001 | 0.280 ± 0.002 | 0.389 ± 0.008 |
| Campesterol c,d,e | 37.28 | 0.053 ± 0.002 | 0.218 ± 0.003 | 0.174 ± 0.008 |
| Stigmasterol c,d,e | 37.60 | nd | 0.201 ± 0.003 | 0.176 ± 0.012 |
| β-Sitosterol c,d,e | 38.47 | 0.166 ± 0.001 | 0.822 ± 0.015 | 0.534 ± 0.017 |
| Total terpenoids | 0.434 ± 0.002 | 1.962 ± 0.016 | 1.893 ± 0.019 | |
| Fatty acids and derivatives | ||||
| Ethyl palmitate c,d,e | 17.14 | 0.031 ± 0.001 | 0.108 ± 0.002 | nd |
| Palmitic acid c,d,e | 18.13 | 0.168 ± 0.001 | 0.520 ± 0.010 | 0.403 ± 0.008 |
| Ethyl linoleate d,e,f | 20.80 | 0.033 ± 0.001 | 0.110 ± 0.001 | 0.084 ± 0.004 |
| Ethyl linoleolate d,e,f | 20.94 | 0.057 ± 0.002 | 0.128 ± 0.001 | 0.174 ± 0.012 |
| Linoelaidic acid d,e,f | 21.86 | 0.068 ± 0.001 | 0.215 ± 0.002 | 0.157 ± 0.011 |
| Linolenic acid c,d,e | 22.01 | 0.114 ± 0.001 | 0.285 ± 0.008 | 0.324 ± 0.015 |
| Stearic acid c,d,e | 22.64 | 0.033 ± 0.003 | nd | nd |
| Oleamide d,e,f | 25.28 | 0.041 ± 0.001 | 0.136 ± 0.005 | 0.161 ± 0.010 |
| Heptadecyl heptadecanoate d,e,f | 39.13 | 0.030 ± 0.001 | nd | nd |
| Octyl stearate d,e,f | 42.79 | 0.036 ± 0.001 | nd | nd |
| Total fatty acids and derivatives | 0.611 ± 0.002 | 1.502 ± 0.010 | 1.303 ± 0.016 | |
| Alkanes | ||||
| Heneicosane d,e | 19.40 | 0.023 ± 0.001 | nd | nd |
| Tricosane g | 23.98 | 0.068 ± 0.001 | nd | nd |
| Pentacosane d,e | 27.28 | 0.037 ± 0.001 | 0.085 ± 0.001 | 0.058 ± 0.001 |
| Hexacosane g | 29.91 | 0.105 ± 0.001 | 0.301 ± 0.003 | 0.142 ± 0.003 |
| Octacosane g | 31.22 | 0.035 ± 0.001 | 0.095 ± 0.002 | 0.069 ± 0.002 |
| Nonacosane d,e | 32.57 | 0.228 ± 0.001 | 0.541 ± 0.013 | 0.262 ± 0.002 |
| Triacontane g | 33.90 | 0.032 ± 0.001 | 0.091 ± 0.001 | 0.072 ± 0.003 |
| Hentriacontane d,e | 35.27 | 0.208 ± 0.001 | 0.593 ± 0.014 | 0.411 ± 0.014 |
| Dotriacontane d,e | 36.61 | 0.029 ± 0.001 | 0.088 ± 0.002 | 0.082 ± 0.001 |
| Tetratetracontane d,e | 37.97 | 0.055 ± 0.001 | 0.249 ± 0.009 | 0.194 ± 0.008 |
| Pentatriacontane d,e | 41.14 | 0.020 ± 0.001 | 0.162 ± 0.001 | 0.104 ± 0.003 |
| Total alkanes | 0.840 ± 0.002 | 2.205 ± 0.016 | 1.394 ± 0.015 | |
| Proposed Compound | tR b | λmax | [M − H]− | MS2 | YFLv | GFLv | LLv |
|---|---|---|---|---|---|---|---|
| Gallic acid c | 2.3 | 215, 270 | 169 | 125 (100) [M − H − CO2]− | 9.85 ± 0.06 | 9.21 ± 0.09 | 15.44 ± 1.01 |
| 4-Hydroxybenzoic acid c | 2.7 | 190, 275 | 137 | 93 (80) [M − H − CO2]− | 5.79 ± 0.10 | 4.27 ± 0.07 | 7.70 ± 0.20 |
| 3-O-Caffeoylquinic acid d | 8.4 | 220, 294, 316 | 353 | 335 (20) [M − H − H2O]− 325 (100) [M − H − CO2]− 191 (5) [M − H − caffeic]− 163 (35) [M − H − quinic]− | 2.27 ± 0.02 | 1.82 ± 0.02 | 3.07 ± 0.04 |
| Baicalein c | 9.0 | 240, 276, 368 | 269 | 251 (10) [M − H − H2O]− 241 (100) [M − H − CO]− 168 (12) 1,3A− 151 (37) 0,3A− 146 (8) 0,4B− 101 (15) 1,3B− | 4.42 ± 0.12 | 2.95 ± 0.01 | 5.39 ± 0.38 |
| Gossypin e | 10.1 | 227, 265, 354 | 479 | 461 (10) [M − H − H2O]− 317 (100) [M − H − glucose]− 329 (5) 1,3A− 313 (2) 0,3A− 301 (70) [M − H − Oglucose]− 194 (4) 0,4B− | 0.60 ± 0.01 | 0.46 ± 0.01 | 3.42 ± 0.30 |
| Myricetin 7-glucoside e | 10.7 | 230, 262, 356 | 479 | 461 (10) [M − H − H2O]− 317 (100) [M − H − glucose]− 313 (3) 1,3A− 301 (50) [M − H − Oglucose]− 298 (4) 0,3A− 210 (4) 0,4B− | 0.26 ± 0.01 | 0.43 ± 0.01 | 0.47 ± 0.01 |
| Myricetin 3-glycoside e | 10.9 | 223, 287, 368 | 479 | 461 (5) [M − H − H2O]− 359 (5) [M − H − C4H9O4]− 317 (100) [M − H − glucose]− 301 (50) [M − H − Oglucose]− 151 (1) 1,3A− 135 (4) 0,3A− | 3.85 ± 0.07 | 3.22 ± 0.02 | 2.88 ± 0.02 |
| Baicalein 6-methyl ether 7-glucuronide e | 11.1 | 237, 266, 368 | 459 | 445 (13) [M − H − CH3]− 441 (8) [M − H − H2O]− 358 (3) 1,3A− 342 (1) 0,3A− 283 (100) [M − H − glucuronic]− 267 (45) [M − H − Oglucuronic]− 145 (2) 0,4B− | 0.74 ± 0.01 | 0.15 ± 0.01 | 1.73 ± 0.02 |
| Myricetin 3-xyloside e | 11.6 | 208, 262, 353 | 449 | 430 (5) [M − H − H2O]− 317 (100) [M − H − xylose]− 301 (65) [M − H − Oxylose]− 151 (2) 1,3A− 135 (1) 0,3A− | 4.61 ± 0.01 | 4.17 ± 0.02 | 6.22 ± 0.08 |
| Myricitrin 3-rhamnoside e | 11.7 | 208, 262, 349 | 463 | 445 (5) [M − H − H2O]− 317 (100) [M − H − rhamnose]− 301 (65) [M − H − Orhamnose]− 151 (1) 1,3A− 135 (1) 0,3A− | 6.35 ± 0.05 | 4.28 ± 0.03 | 7.49 ± 0.08 |
| Quercitrin d | 13.0 | 257, 351, 367 | 447 | 429 (25) [M − H − H2O]− 301 (100) [M − H − rhamnose]− 285 (20) [M − H − Orhamnose]− 151 (1) 1,3A− 135 (1) 0,3A− | tr | 3. 01 ± 0.03 | tr |
| Baicalin e | 13.4 | 199, 227, 267, 337 | 445 | 343 (2) 1,3A− 327 (1) 0,3A− 269 (100) [M − H − glucuronic]− 253 (100) [M − H − Oglucuronic]− | tr | 5.15 ± 0.07 | 0.26 ± 0.01 |
| Myricetin d | 13.7 | 230, 253, 304, 368 | 317 | 299 (30) [M − H − H2O]− 289 (100) [M − H − CO]− 165 (14) 1,3B− 152 (15) 1,3A− 136 (10) 0,3A− 210 (5) 0,4B− | 4.73 ± 0.15 | 4.48 ± 0.05 | 9.69 ± 0.11 |
| Myricetin 3-(galloylrhamnoside) I e | 13.9 | 266, 368 | 615 | 317 (100) [M − H − galloylrhamnose]− 463 (5) [M − H − galloyl]− 447 (10) [M − H − gallate]− | tr | 0.65 ± 0.01 | 1.37 ± 0.01 |
| Myricetin 3-(galloylrhamnoside) II e | 14.5 | 236, 298, 368 | 615 | 317 (100) [M − H − galloylrhamnose]− 597 (10) [M − H − H2O]− 463 (20) [M − H − galloyl]− 447 (40) [M − H − gallate]− | tr | 2.35 ± 0.01 | tr |
| Myricetin 3-(galloylrhamnoside) III e | 15.1 | 250, 280, 370 | 615 | 317 (100) [M − H − galloylrhamnose]− 597 (10) [M − H − H2O]− 463 (5) [M − H − galloyl]− 447 (10) [M − H − gallate]− | tr | 0.10 ± 0.01 | 0.36 ± 0.01 |
| Quercetin c | 15.8 | 254, 368 | 301 | 283 (40) [M − H − H2O]− 273 (15) [M − H − CO]− 257 (15) [M − H − CO2]− 179 (100) 0,4B− 152 (15) 1,3A− 150 (14) 1,3B− 136 (10) 0,3A− | 4.31 ± 0.02 | 3.32 ± 0.08 | 5.40 ± 0.05 |
| Protocatechuic aldehyde c | 16.3 | 241, 279 | 136 | 118 (20) [M − H − H2O]− 109 (100) [M − H − CO]− | 5.76 ± 0.05 | 3.95 ± 0.02 | 6.83 ± 0.07 |
| Apigenin 7-(acetylglucoside) d | 16.8 | 268, 340, 368 | 473 | 430 (15) [M − H− acetyl]− 311 (15) [M − H − C6H11O5]− 268 (100) [M−H − acetylglucose]− 252 (20) [M − H − Oacetylglucose]− | tr | 0.16 ± 0.01 | tr |
| Apigenin c | 17.5 | 241, 267, 337 | 269 | 241 (20) [M − H − CO]− 225 (35) [M − H − CO2]− 162 (50) 0,4B− 146 (14) 1,3B− | tr | 3.77 ± 0.01 | tr |
Publisher’s Note: MDPI stays neutral with regard to jurisdictional claims in published maps and institutional affiliations. |
© 2022 by the authors. Licensee MDPI, Basel, Switzerland. This article is an open access article distributed under the terms and conditions of the Creative Commons Attribution (CC BY) license (https://creativecommons.org/licenses/by/4.0/).
Share and Cite
Carius, B.; Silva, H.; Silva, A.M.S.; Pinto, D.C.G.A. Chemical Profiling of Limonium vulgare Mill. Using UHPLC-DAD-ESI/MS2 and GC-MS Analysis. Appl. Sci. 2022, 12, 6384. https://doi.org/10.3390/app12136384
Carius B, Silva H, Silva AMS, Pinto DCGA. Chemical Profiling of Limonium vulgare Mill. Using UHPLC-DAD-ESI/MS2 and GC-MS Analysis. Applied Sciences. 2022; 12(13):6384. https://doi.org/10.3390/app12136384
Chicago/Turabian StyleCarius, Benedict, Helena Silva, Artur M. S. Silva, and Diana C. G. A. Pinto. 2022. "Chemical Profiling of Limonium vulgare Mill. Using UHPLC-DAD-ESI/MS2 and GC-MS Analysis" Applied Sciences 12, no. 13: 6384. https://doi.org/10.3390/app12136384
APA StyleCarius, B., Silva, H., Silva, A. M. S., & Pinto, D. C. G. A. (2022). Chemical Profiling of Limonium vulgare Mill. Using UHPLC-DAD-ESI/MS2 and GC-MS Analysis. Applied Sciences, 12(13), 6384. https://doi.org/10.3390/app12136384