Article

The Effect of Pre-Treatment of Arabica Coffee Beans with Cold Atmospheric Plasma, Microwave Radiation, Slow and Fast Freezing on Antioxidant Activity of Aqueous Coffee Extract

1
Scientific and Innovation Center of Sensor Technologies, Ural State University of Economics, 8 Marta St., 62, 620144 Yekaterinburg, Russia
2
Department of Food Technology, Ural State University of Economics, 8 Marta St., 62, 620144 Yekaterinburg, Russia
3
Department of Physics and Chemistry, Ural State University of Economics, 8 Marta St., 62, 620144 Yekaterinburg, Russia
4
Institute of Electrophysics, Ural Branch of the Russian Academy of Sciences, Amundsen St., 106, 620016 Yekaterinburg, Russia
*
Author to whom correspondence should be addressed.
Appl. Sci. 2022, 12(12), 5780; https://doi.org/10.3390/app12125780
Submission received: 23 May 2022 / Revised: 3 June 2022 / Accepted: 6 June 2022 / Published: 7 June 2022

Abstract

:
Thermal and non-thermal technologies used in food processing should be not only effective in terms of decontamination and preservation but also minimize undesirable losses of natural bioactive compounds. Arabica (Coffea arabica) is the most cultivated variety of coffee, making it a valuable source of phytonutrients, including antioxidants. In the present study, green and roasted Arabica coffee beans were treated with slow freezing (SF), fast freezing (FF), microwave radiation (MWR) and cold atmospheric plasma (CAP). Moisture content (MC) of coffee beans and antioxidant activity (AOA) of aqueous extracts were measured. Green coffee showed a decrease in MC after MWR treatment, and roasted coffee showed an increase in MC after freezing. After SF and FF at −19 °C for 24 h, all extract samples showed an increase in AOA by 4.1–17.2%. MWR treatment at 800 W for 60 s was accompanied by an increase in the AOA of green coffee extracts by 5.7%, while the changes in the AOA of roasted coffee extracts were insignificant. Sequential combined treatments of SF + MWR and FF + MWR resulted in an additive/synergistic increase in the AOA of green/roasted coffee extracts, up to +23.0%. After CAP treatment with dielectric barrier discharge (DBD) parameters of 1 μs, 15 kV and 200 Hz for 5 and 15 min, green coffee showed a decrease in the extract AOA by 3.8% and 9.7%, respectively, while the changes in the AOA of roasted coffee extracts were insignificant. A high positive correlation (r = 0.89, p < 0.001) between AOA and MC was revealed. The results obtained indicate that SF, FF, MWR and combined treatments may be applied at the pre-extraction stage of coffee bean preparation in order to increase the yield of antioxidant extractives.

1. Introduction

Coffee is one of the most popular soft drinks that are consumed by people of different age groups. Epidemiological and experimental studies showed that recommended intakes of three to five cups of coffee a day for adults might have a positive effect on the functionality of the human brain, respiratory, endocrine and digestive systems. Coffee consumption was also linked to a lower risk of developing several specific cancers. The side effects of coffee consumption, such as temporarily growth in blood pressure, insomnia, anxiety and the risk of miscarriage, were associated exclusively with high daily caffeine intakes (400 mg for adults and 200 mg for pregnant women) and, thus, were not relevant in case of decaffeinated drinks [1,2]. A recent study [3] involving 37,988 participants of the UK Biobank reported that people consuming at least one cup of coffee a day might have a lower risk of coronavirus infection 2019 (COVID-19) exposure. The observed positive health effects arising from regular consumption of coffee are linked to dietary phytochemicals (phytonutrients) present in the coffee beans that are largely biologically (pharmacologically) active. For example, polyphenolic compounds of coffee exhibit antioxidant, anti-inflammatory, antibacterial, anticancer, antidiabetic and cardio-, hepato- and neuroprotective properties [4,5,6]. This enables considering coffee as a medicinal herb and functional food [7] and also explains the ever-increasing interest of the academic community in the research in fields such as coffee. The composition and content of bioactive compounds found in coffee are determined by many factors, such as botanical variations, geographical origin, processing and storage conditions. For example, unlike Robusta coffee beans (Coffea canephora), Arabica coffee beans (Coffea arabica) have a higher content of tocopherols [8] but lower contents of phenolic compounds and caffeine [9,10].
Numerous studies examined the antioxidant properties of foods, including coffee. There are two analytical approaches to assessing the antioxidant status of a sample in vitro: (1) measuring the concentration of single antioxidants and (2) evaluating their integral content [11]. By using high-performance liquid chromatography, it was shown that the antioxidant properties of coffee are attributed to phenolic compounds [12,13,14], tocopherols [8,15] and ascorbic acid [15]. The main contribution falls on phenolic antioxidants, which are represented by phenolic acids (chlorogenic, gallic, caffeic, syringic, ferulic, etc.), flavonoids (quercetin, catechin, epigallocatechin gallate, kaempferol, resveratrol, etc.) and their derivatives (glucosides, esters, etc.) [12,13,14]. The second approach, based on the use of the methods for determining antioxidant activity/capacity (AOA/AOC), is less labor-intensive and enables measuring synergistic and antagonistic antioxidant effects and considering the effect of unknown (rare) antioxidant compounds. The value of AOA/AOC is an important parameter related to the antioxidant status of coffee since numerous synergistic and antagonistic antioxidant effects were recorded in binary mixtures of antioxidants present in coffee [16]. Though some authors highlighted the difference between AOA and AOC [17,18], these two terms continue to be used as synonymous [11]. The term “antioxidant activity” (AOA) is used in this paper to denote the integral content of antioxidants per volume unit.
During planting, growing, harvesting and storage, coffee can be attacked by filamentous fungi that produce mycotoxins [19,20] and by the coffee borer beetle Hypothenemus hampei [21]. According to the International Coffee Organization, since the beginning of the 2020/21 crop year, the coffee market has shown a steady upward trend in prices, which is largely due to unfavorable climatic conditions in the main coffee-producing countries, increased transport costs and restrictions due to COVID-19 [22]. On the one hand, in these circumstances, decontamination and long storage of coffee are becoming particularly relevant. On the other hand, the preservation of the nutritional value of coffee is also essential. It was reported that roasting could reduce the level of ochratoxins in coffee by 30–96% depending on temperature and time [20], whereas freezing at −15 °C for 6 days or at −20 °C for 5 days can be an effective treatment for control of Hypothenemus hampei [21]. At the same time, the chemical composition of coffee changes during roasting in a complex way, which results from the Maillard reaction, pyrolysis and caramelization [5], accompanied by a release of volatile compounds [23]. In general, the data on the effect of roasting on phenolic antioxidants and AOA of coffee are inconsistent [5,6,12,13,19,24,25,26]. With an increase in roasting degree, the content of phenolic compounds in coffee can increase, decrease and change in different directions [12,13,24]; however, convincing evidence that roasting causes a lower concentration of chlorogenic acids was suggested in [13,24,25,27]. The inconsistency of results on the effect of roasting on coffee AOA can be due to the release of conjugated phenolic compounds and the formation of new substances with antioxidant properties [19], as well as to a degree of sensitivity of the methods used [24]. Compared with conventional roasting in an electric oven, roasting green coffee in a microwave oven could reduce the loss of phenolic antioxidants and AOA [14]. In recent years, non-thermal food processing technologies have emerged as an alternative to thermal methods since they have lower operational costs and exhibit limited changes in the organoleptic and nutritional attributes of food [28]. The results obtained in [29] suggest that cold plasma has a good potential for inhibiting filamentous fungi and detoxifying mycotoxins in coffee.
Comprehensive studies examine the relationship between the roasting process and the antioxidant status of coffee [5,6,12,13,19,24,25,26]. However, the studies focusing on the effect of microwave radiation [14,30] and cold plasma [31] on the antioxidant status of coffee are limited, and no single study exists that deals with the impact of freezing. No single study was found comparing thermal and non-thermal methods of processing coffee beans. In this regard, the purpose of this work was to study the effect of thermal and non-thermal methods of pre-treatment of coffee beans on the AOA of aqueous coffee extracts.

2. Materials and Methods

2.1. Samples

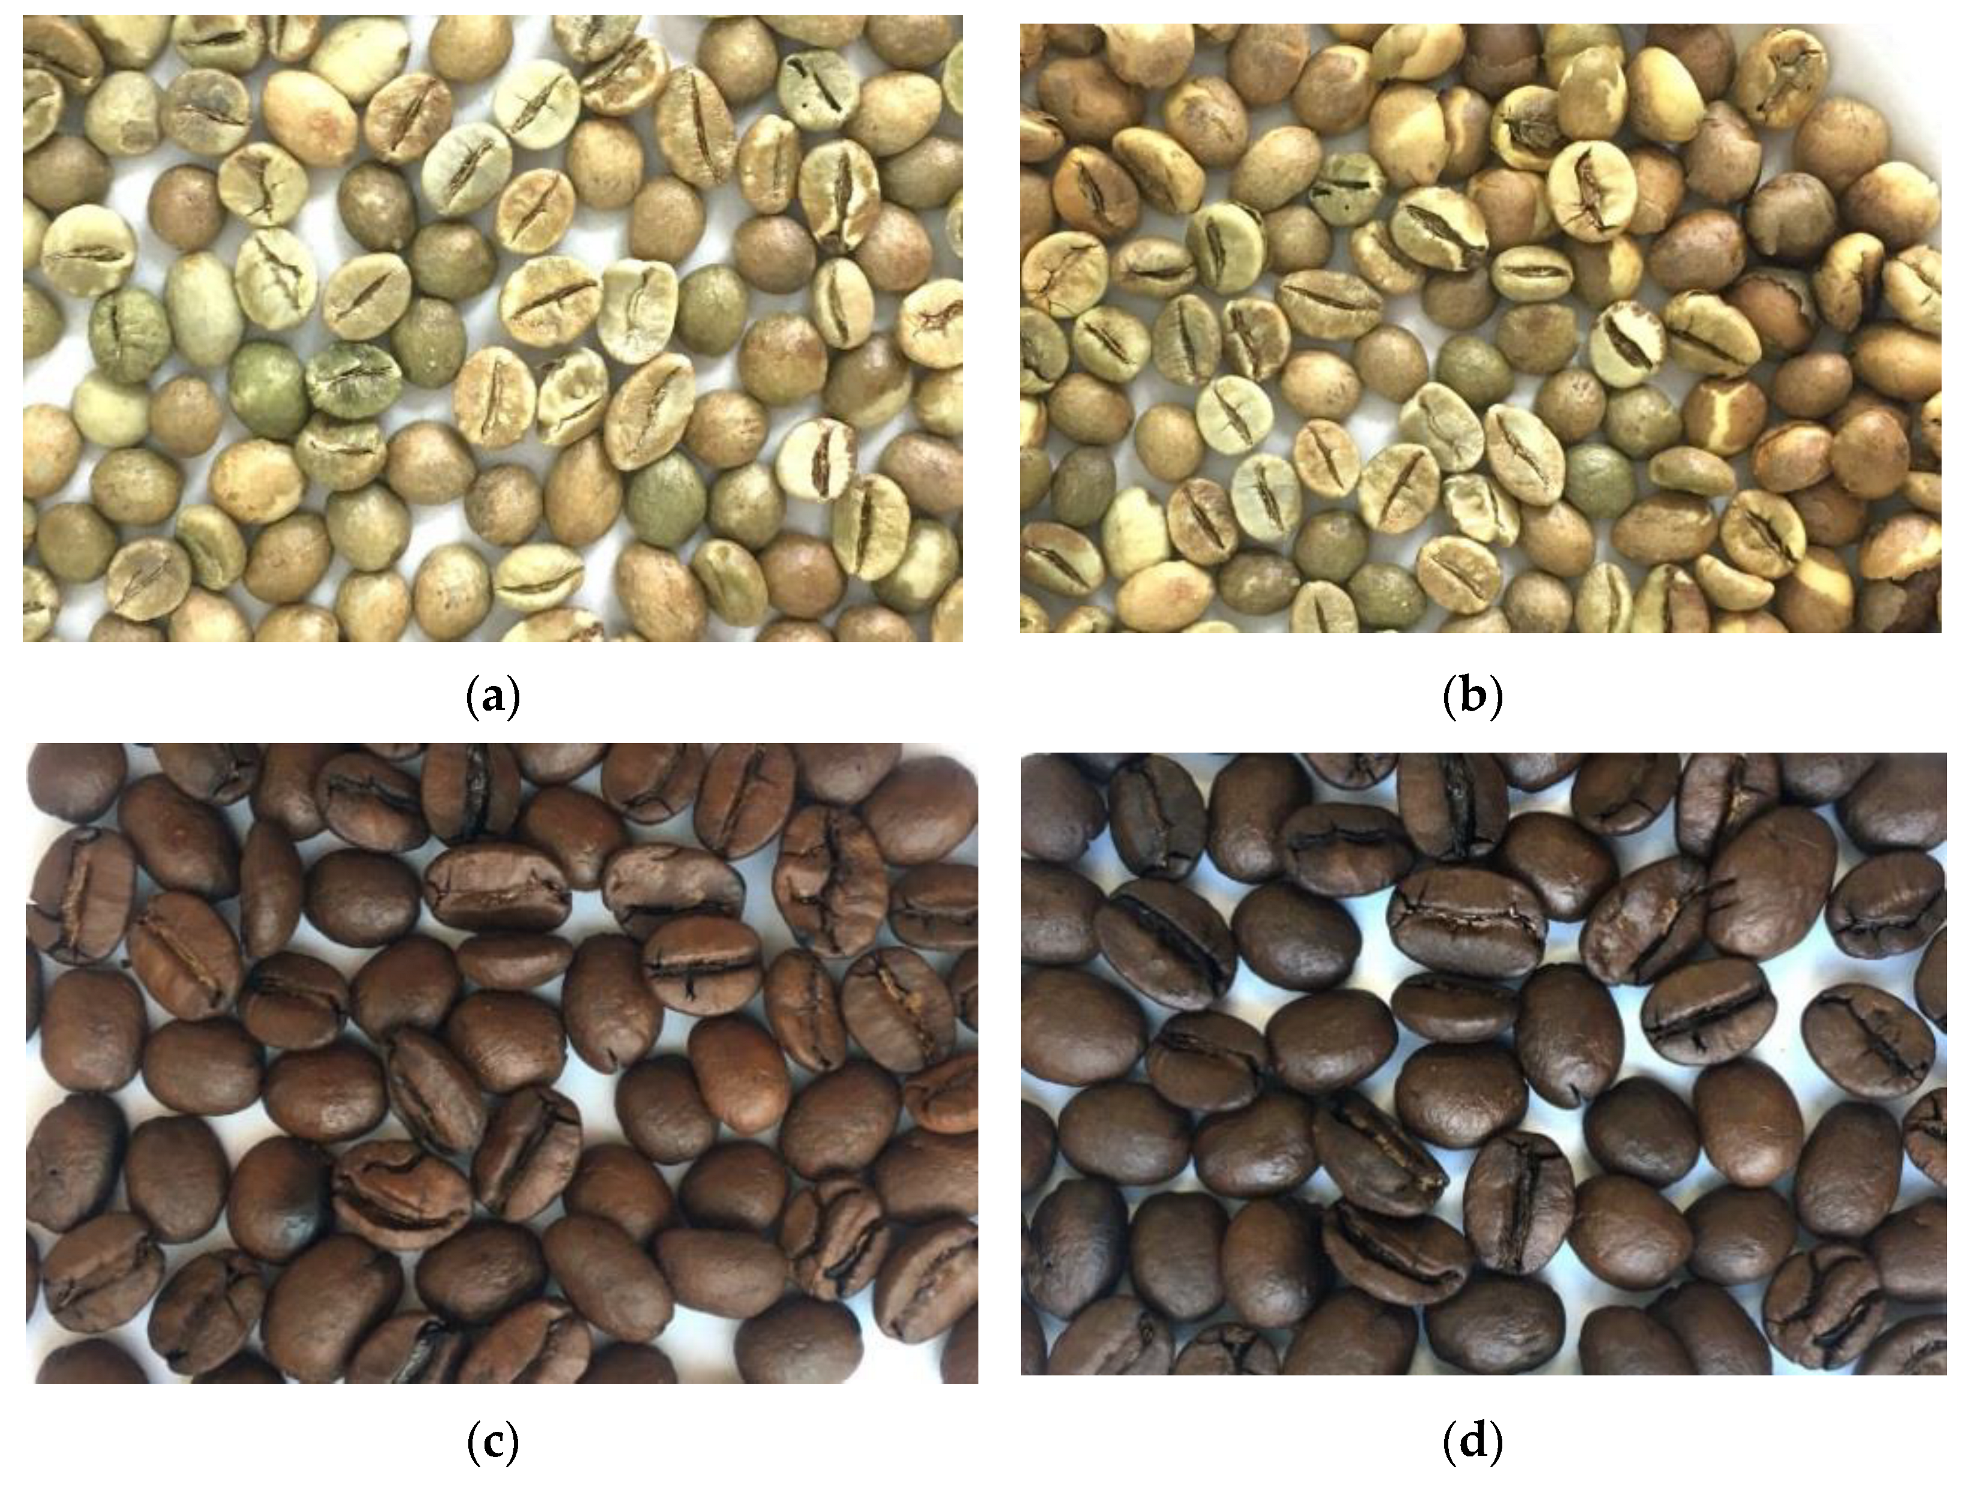
The grown and dry-processed Arabica green coffee was imported from Brazil (Minas Gerais state) in 2021. Green coffee beans were visually inspected for defects and impurities, and then they were roasted in a Trobrat-5 roaster (Trobrat, Tyumen, Russia) under the following conditions: 10 min at 200 °C for a medium roast and 15 min at 210 °C for a dark roast. The volume and temperature of bean loading were equal to 5 kg and 200 °C, respectively. After roasting, in order to degas carbon dioxide, the medium roast coffee was allowed to rest in air at room temperature for 6 days; 5 days for the dark roast coffee. One-kilo samples of unroasted (green) and roasted coffee beans were packed in bags with valves for degassing and delivered to the laboratory, where they were divided into groups for further processing and analysis. Images of the coffee beans are presented in Appendix A.

2.2. Treating Coffee Beans

In the laboratory, the coffee bean samples, 25 g in weight each, were treated with slow freezing (SF), fast freezing (FF), microwave radiation (MWR) and cold atmospheric plasma (CAP). Before freezing, the samples were placed in low-density polyethylene bags and sealed with a PFS-300 manual machine (Mechelectron-M LLC, Moscow, Russia) in order to ensure impermeability. SF of the packed samples was performed at −19 ± 3 °C for 24 h in a Stinol-242Q.002 freezer (Whirlpool RUS LLC, Moscow, Russia) using the freezing mode of 3 kg over 24 h, which is equivalent to 25 g over 12 min. FF of the packed samples was performed at −19 ± 1 °C for 24 h in an Air-o-chill 61 blast freezer cabinet (Electrolux Professional SpA, Pordenone, Italy) using the freezing mode of 25 kg over 4 h, which is equivalent to 25 g over 0.24 min. Thus, the FF speed exceeded the SF speed by about 50 times. After freezing treatments, the packaged samples were defrosted at room temperature for 2 h, and then the polyethylene bags were opened, violating their integrity. Before MWR treatment, a sample of coffee beans was spread as a uniform monolayer on the surface of a ceramic plate; then, the plate with the sample was placed into a Hansa HMO-201 M microwave oven (StroyVek LLC, Kaliningrad, Russia) and treated with MWR 800 W and 2.45 GHz for 1 min (60 s). Since the samples were heated during MWR treatment, they were left for natural cooling before they were further manipulated. The coffee beans were also sequentially treated by SF and MWR (SF + MWR) and FF and MWR (FF + MWR) under conditions similar to those described above.
CAP treatment of the coffee bean samples was performed for 5 and 15 min (CAP–5 and CAP–15, respectively) in an experimental setup (Figure 1a). The prototype of a high voltage pulse generator (Figure 1b) based on an IRFB4127 transistor (Infineon Technologies AG, Munich, Germany) and NE555 precision timer (Texas Instruments Inc., Dallas, TX, USA) was used as a source of dielectric barrier discharge (DBD). The DBD was created by applying short high voltage pulses (1 µs, 15 kV, 200 Hz) to copper electrodes (20 mm length, 1 mm diameter, 3 mm gap). The oscillograph records for the DPD pulse are given for reference in Appendix B. Coffee beans were placed on the bottom of a glass beaker. A glass funnel with a 10 mm diameter tube was inserted into the glass beaker. Air was pumped into the funnel cone with a fan, thus assisting CAP in moving down along the funnel tube. When CAP was leaving the funnel tube, it treated the coffee beans located at the bottom of the glass and escaped the “working area” through the natural gaps between the edge of the glass cup and the cone of the funnel. The experimental setup for CAP treatment presented in this paper is original. Compared with sample processing in a Petri dish, this experimental setup has the advantage since its use helps to reduce the loss of CAP intensity due to its scattering in space [32].
All treatments were performed in triplicate. The samples of coffee beans, both untreated and treated by each of the above-described methods, were ground in a KitFort CT-1329 rotary coffee grinder (Aero-Trade LLC, St. Petersburg, Russia), which operated intermittently to avoid overheating of the samples.

2.3. Monitoring Temperature

For SF and FF, the final temperature of coffee beans was set by the equipment used. The temperature changes inside the freezers were monitored using thermometers. In other cases, the surface temperature of coffee beans was monitored using a contact thermocouple of the Owon B41T+ multimeter (Fujian Lilliput Optoelectronics Technology Co., Ltd., Zhangzhou, China).

2.4. Measuring Moisture Content

Moisture content (MC) both in untreated and treated samples was measured using the gravimetric method and following ISO standards [33] and [34] for green and roasted coffee, respectively. MC was calculated as a percentage (%) based on the weight loss of the samples after thermal drying.

2.5. Chemicals and Reagents

The following chemically pure grade (≥99%) reagents were used: K3[Fe(CN)6], KCl, Na2HPO4·12H2O (JSC Vekton, St. Petersburg, Russia); K4[Fe(CN)6]·3H2O (JSC Kupavnareaktiv, Staraya Kupavna, Russia); NaCl (Mikhailovsky Chemical Reagents Plant LLC, Barnaul, Russia); KH2PO4 (NevaReaktiv LLC, St. Petersburg, Russia); Na2CO3(JSC LenReactiv, St. Petersburg, Russia). Folin–Ciocalteu reagent (FCR) 2 N and gallic acid (GA) monohydrate ACS grade (≥98%) were obtained from Firm Syntacon LLC (St. Petersburg, Russia) and MP Biomedicals LLC (Solon, OH, USA), respectively. All chemicals were used without extra purification. The solvent was deionized water. Akvalab-UVOI-MF-1812 installation (JSC RPC Mediana-Filter, Moscow, Russia) was used to obtain deionized water.

2.6. Preparation of Aqueous Coffee Extracts

The hot brew method was used to obtain coffee extracts with a higher AOA as compared to cold brewing techniques [35]. The hot brewing process was standardized following the recommendations of the Specialty Coffee Association for coffee cupping [36]. The ground coffee samples were fractionated by particle size using two metal-woven sieves (Kraft LLC, Chelyabinsk, Russia) with 0.8 and 0.4 mm mesh. Aqueous extracts were obtained by hot brewing of ground and fractionated coffee in the following way: 5.5 g of coffee (0.41–0.80 mm) was added to 100 mL of water heated to 93 °C. Then the resulting suspension was kept at a temperature of 93 ± 2 °C with constant mixing at 900 rpm for 5 min using an RCT Basic stirrer with controlled heating, coming with a PT 1000 temperature sensor (IKA-Werke GmbH and Co., Ltd., KG, Staufen, Germany). After the extraction was completed, the suspension was cooled in a water bath and filtered through an ashless white ribbon paper filter (JSC Ekos-1, Moscow, Russia). The coffee-to-water ratio (1:18), temperature (93 °C), and time (5 min) of hydrothermal extraction meet the recommendations for making a golden cup with a medium-ground powder [36]. Freshly prepared filtrates were used in measuring AOA.

2.7. Measuring AOA

The AOA of aqueous coffee extracts was measured by using two electron transfer-based assays [18,37]: spectrophotometry with the use of FCR and potentiometry with the use of potassium hexacyanoferrates. The FCR is non-specific for phenolic compounds; therefore, the spectrophotometric assay with the FCR is currently recommended for the AOA measurement [18,38,39]. The spectrophotometric determination of AOA was performed as described by Singleton et al. [40]. An amount of 2.5 mL of the FCR (0.2 N) was mixed with 0.5 mL of GA solution of the known concentration or pre-diluted coffee extract (1:100). After 4–6 min, 2 mL of Na2CO3 solution (7.5%) was added. The resulting mixture was remixed and incubated for 2 h in the dark at room temperature to develop a blue color. Absorbance was measured in cuvettes with a path length of 10 mm at 760 nm relative to a blank sample (water) by using an Ecoview UV-1200 spectrophotometer (Shanghai Mapada Instruments Co., Ltd., Shanghai, China). A linear calibration curve Abs = 0.0133·CGA + 0.026 with an approximation factor R2 = 0.9997 was obtained for solutions with a concentration of GA 0, 10, 20, 30, 40 and 50 mg/L. AOA in mg equivalent of GA in 1 L of extract (mg GAE/L) was calculated on the basis of a previously obtained calibration curve. The potentiometric determination of AOA was performed as described in Brainina et al. [41]. An amount of 1 mL of the analyzed coffee extract was added to 10 mL of phosphate-buffered saline (pH 7.4) containing 10−2 mol/L K3[Fe(CN)6] and 10−4 mol/L K4[Fe(CN)6]. The potential change was recorded for 20 min in a two-electrode cell using a pH/ions meter TA-Ion completed with a DPTA.25.0220.000SB thermal sensor (RPE Tomanalyt LLC, Tomsk, Russia). The platinum screen-printed electrode (RPIE Iva LLC, Yekaterinburg, Russia) was pre-purified by annealing at 750 °C for 1 h [42] and was used as an indicator (working) electrode. The silver chloride electrode EVL-1M3.1 (JSC Gomel Plant of Measuring Devices, Gomel, Belarus) was prepared as described in the user manual and was used as a reference electrode. AOA in µmol equivalent of iron (II) in 1 L of extract (µmol Fe2+-E/L) was calculated according to Equation (1):
AOA = C o x α · C r e d 1 + a · q ,     α = C o x C r e d · 10 Δ E F 2.3 R T ,
where Cox = 10−2 mol/L is the concentration of K3[Fe(CN)6] in a cell; Cred = 10−4 mol/L is the concentration of K4[Fe(CN)6] in a cell; q = 11 is a degree of sample dilution in a cell, non-dimensional value; ΔE = (E1E2) is the difference between initial and final potentials, V; F = 96,485.332 C/mol is the Faraday constant; R = 8.314 J/(mol·K) is the molar gas constant; T = (T°C + 273.15) is the absolute temperature, K.
The obtained AOA values were recalculated per one gram of dry weight (DW) of coffee beans using Equation (2):
AOA ( unit g DW ) = AOA ( unit L ) · V m · 100 100 W ,
where V = 0.1 L is the water volume for extraction; m = 5.5 g is the coffee mass for extraction; W is the MC in the analyzed coffee sample, %.
AOA was assessed under repeatability conditions; the average value of three parallel measurements was taken as the result.

2.8. Statistical Analysis

The results are presented as an arithmetic mean with the corresponding standard deviation (mean ± SD) of triplicates (n = 3). The total number of experimental and evaluated units was 24 and 51, respectively. The data were analyzed using the PSPP software version 1.4.1 for Microsoft Windows (Free Software Foundation Inc., Boston, MA, USA), distributed under the GNU General Public License [43]. Pearson correlation coefficient (r) was used to assess the interrelation of variables. Paired Student’s t-test was used to assess the significance of paired correlations and differences for the measurement variables as insignificant (p ≥ 0.05), significant (0.01 ≤ p < 0.05) and very significant (p < 0.01).

3. Results and Discussion

3.1. MC Analysis

The obtained analytical results of MC in the coffee beans are presented in Table 1. MC in the initial samples accounted for 9.33 ± 0.15% for green coffee, 2.02 ± 0.08% for medium roasted coffee and 1.72 ± 0.07% for dark roasted coffee. The roasting process of coffee beans resulted in a very significant decrease in MC (p < 0.001), along with a significant difference in MC between medium and dark roasted coffee samples (p < 0.001). As can be seen from Table 1, green coffee showed the largest loss in MC after MWR treatment, while roasted coffee showed an increase in MC after freezing.
Despite the fact that the freezing experiments were performed with the samples whose impermeability was controlled, after freezing, all samples showed an increase in MC. It is known that the freezing of food samples is accompanied by moisture crystallization. Ice crystals cause cell walls (membranes) to break and lead to the release of cellular contents (cytoplasm, nucleoplasm), which affects moisture content and its distribution in the sample tissues. Low/high freezing speed promotes the formation of large/small ice crystals. Large ice crystals contribute to more intense damage to the cell matrix. The effects of freezing on cell structure have been extensively studied and are associated not only with deterioration of food quality [44,45] but also with a yield of antioxidant extractives [46]. Roasting conditions can also cause complex changes in the bean microstructure, such as greater pore volume and larger micropores in the cell wall [47,48]. In the present study, roasted coffee beans showed the most significant increase in MC after SF treatment, with a significance level of p < 0.05. Apparently, microstructural changes that occurred as a result of roasting were enhanced by damage caused by freezing. Following the conclusions made in [44,45,46,47,48], as a result of freezing, the highest yield of antioxidant extractives could be expected for roasted coffee (Section 3.3).
After MWR treatment, the bean surface temperature rose from approximately 27 °C to an average of 90 °C for green, 66 °C for medium roasted and 64 °C for dark roasted coffee, which correlated with the initial level of MC in the beans (r > 0.99, p < 0.05). MWR is known to cause polarization, vibrations and rotations of molecules, including water molecules. As a result, the frequency of collisions and friction between the molecules grows, which leads to heating of the sample and heat transmission from the inside out. These phenomena can be accompanied by cell breakage and a higher yield of antioxidant extractives [49,50]. Dong et al. reported that higher microwave power affected the porosity of green coffee beans and the fragmentation of structure [30]. In this work, the parameters of MWR treatment were constant; thus, the microstructural changes in the sample primarily depend on its dielectric properties, which increase with growing MC [51,52]. As it was concluded in [30,49,50,51,52], beans with the highest MC (green coffee) are most susceptible to microstructural changes and thermal heating as a result of MWR treatment. At the same time, MWR treatment of green coffee was accompanied by the release of volatile substances and the change in the color to yellow-brown (Appendix A). A drop in MC in green coffee beans after MWR treatment from 9.33% to 5.95% (p < 0.01) significantly facilitated their grinding. In the process of MWR treatment of roasted coffee beans, no release of volatile substances was observed because, firstly, the bulk of volatile substances had left the beans during roasting and, secondly, an oily film on the roasted bean surface can block these processes.
After combined SF + MWR and FF + MWR treatments, MC decreased only in green coffee (from 9.33% to 6.28–6.44%, p < 0.01), while no significant changes in MC in roasted coffee were observed. The obtained data can be explained as follows: after freezing treatment, MC grows in roasted coffee beans, but these changes are insignificant in green coffee beans (Table 1). As a result of subsequent MWR treatment, moisture evaporates. This process occurs faster in green coffee beans because roasted coffee beans are covered with an oily film that blocks the escape of moisture. Together, these processes result in lower MC in green coffee and its preservation in roasted coffee relative to the initial samples.
CAP-treatment did not show any significant changes in the bean surface temperature. MC fluctuations in coffee beans treated with CAP were also insignificant.

3.2. Selection of AOA Estimation Method

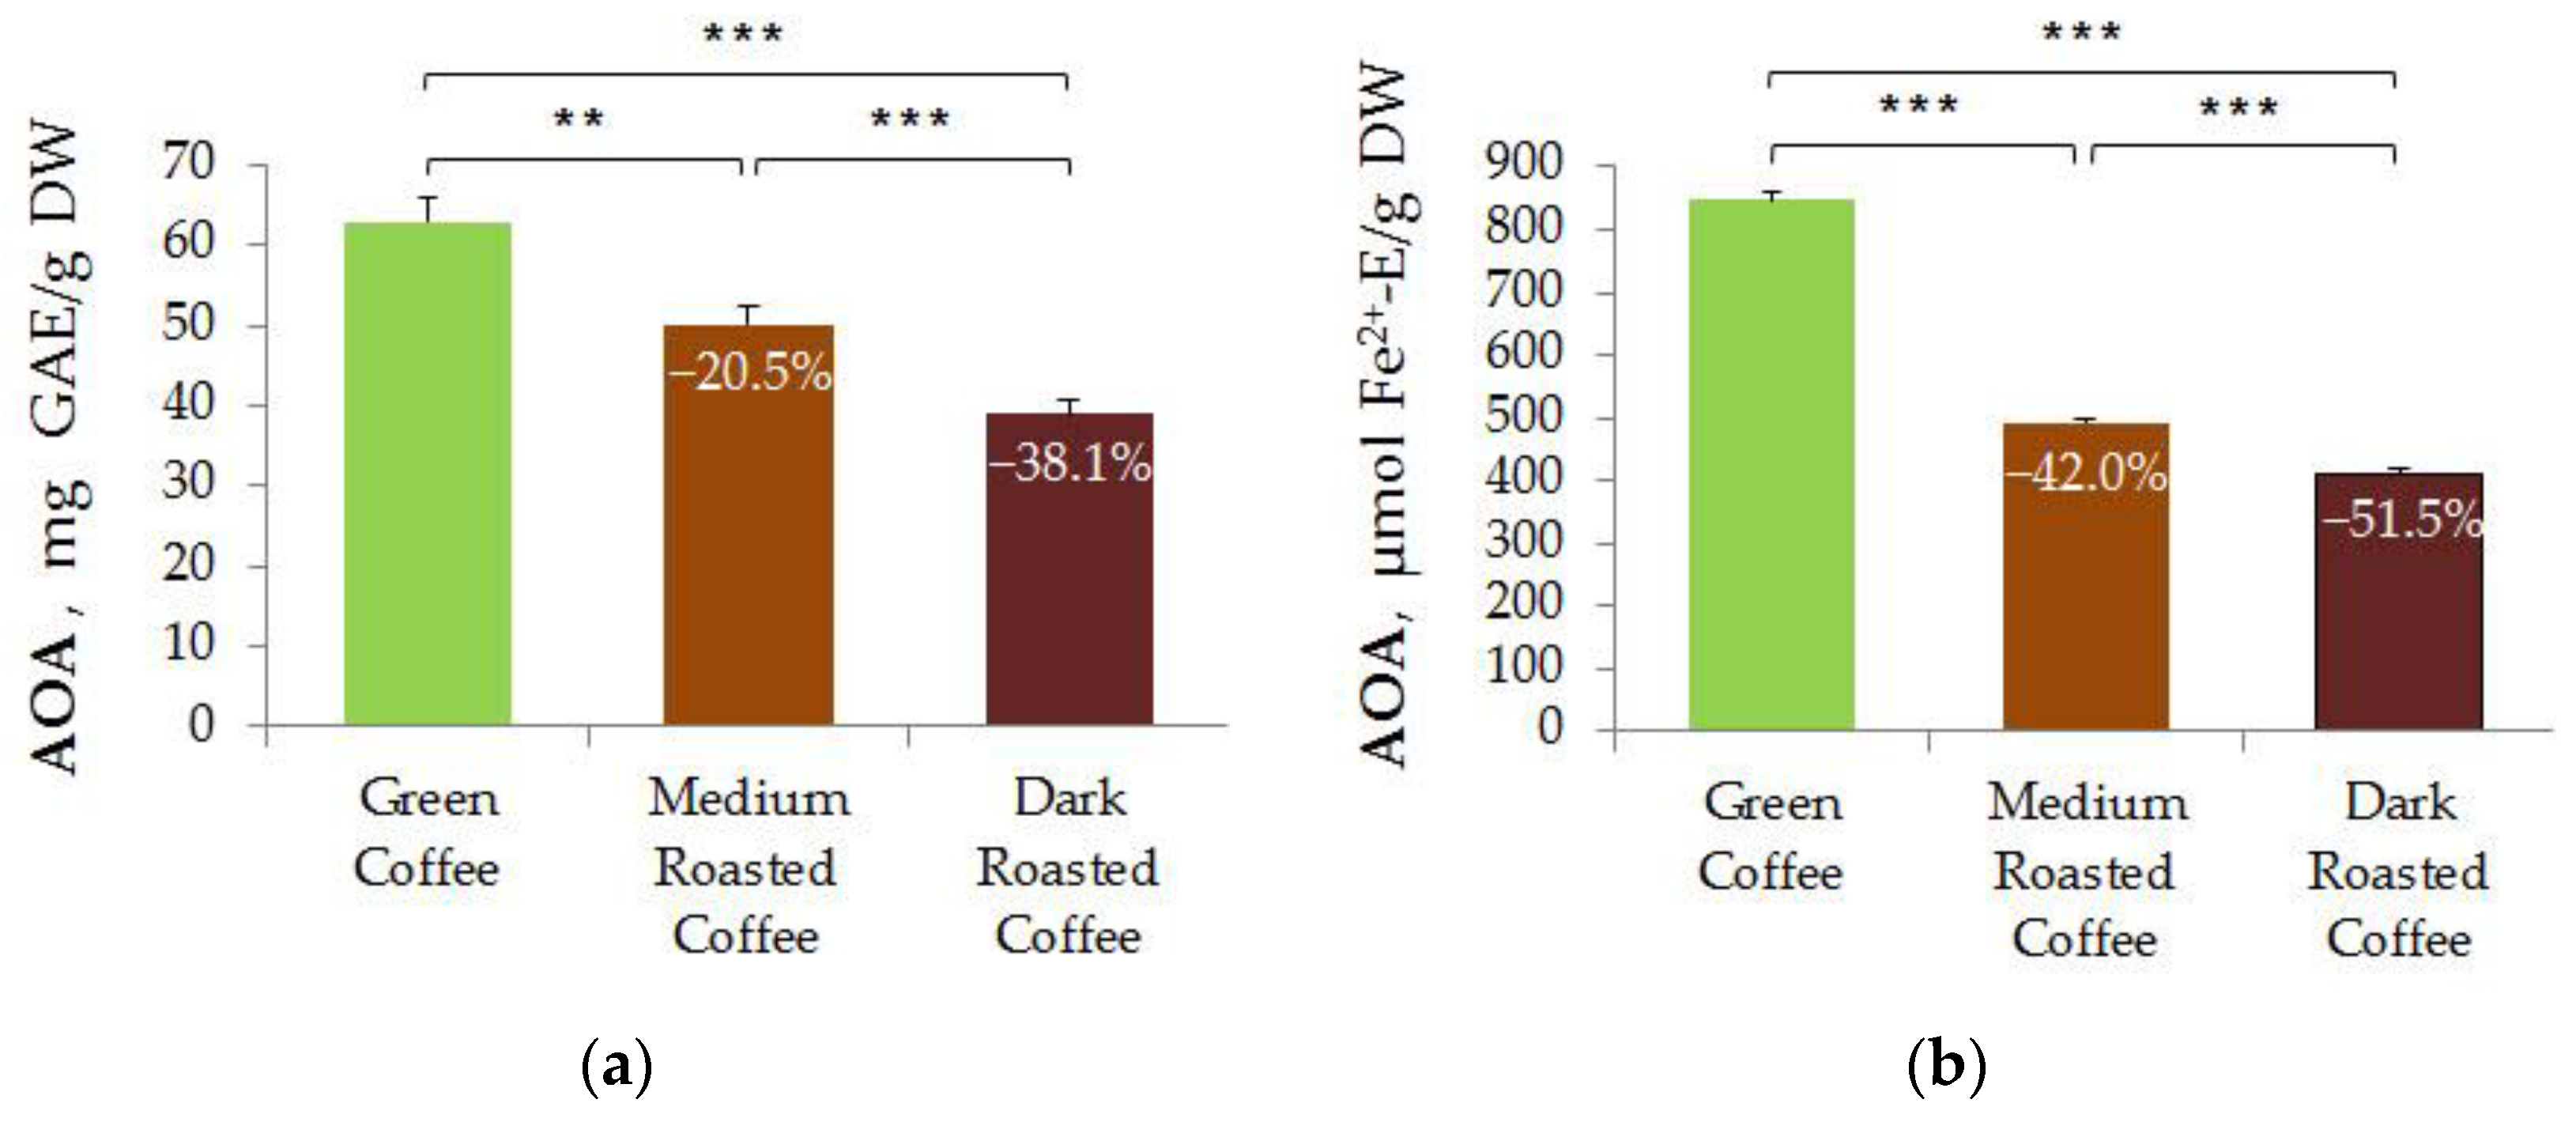
Souza et al. [24] reported that methods of AOA determination have different sensitivity to the degree of roasting of coffee beans. The spectrophotometric analysis based on 2,2-diphenyl-1-picrylhydrazyl (DPPH) radical scavenging was the most sensitive assay. However, the DPPH assay has a mixed mechanism that combines electron transfer (ET) and hydrogen atom transfer (HAT) reactions [53]. This means that the antioxidative (ET) and antiradical (HAT) properties of the analyzed sample cannot be differentiated, which challenges the interpretation of the obtained results. In the present work, the analysis of the AOA of extracts of untreated coffee beans was performed through two methods based on the electron transfer mechanism [18,37] in order to select the most sensitive. The AOA evaluation results of untreated coffee beans by spectrophotometric and potentiometric methods are presented in Figure 2a,b, respectively.
As can be seen from Figure 2, the AOA of coffee extracts declined: green coffee presented the highest AOA, followed by medium roast coffee and dark roast coffee, which is consistent with the literature data obtained through the methods based on electron transfer [24,26]. The correlation between the spectrophotometric and potentiometric data was r = 0.94, p < 0.001. In assessing the AOA differences between medium roast and dark roast coffee extracts, both methods demonstrated similar sensitivity (p < 0.001), whereas, in green coffee and medium roast coffee extracts, the potentiometric method showed more significant differences (p < 0.001) than spectrophotometry (p < 0.01). In addition, the FCR, used in the spectrophotometric analysis, is a strong oxidizer. It was reported that the FCR is capable of oxidizing compounds other than phenolic antioxidants (ascorbic and uric acids), as well as organic compounds that are not antioxidants (carbohydrates, nucleotides, aromatic amines, etc.) [18,38,39]. Potassium ferricyanide, used in potentiometry, is a milder oxidizer. Interference studies showed that K3[Fe(CN)6] does not oxidize carbohydrates [54]. By considering all these facts, potentiometry was used to evaluate the AOA of extracts of treated coffee beans (Section 3.3).

3.3. Comparative Analysis of the AOA of Aqueous Extracts of Treated and Untreated Coffee Beans

The data of the potentiometric evaluation of the AOA of aqueous extracts of untreated and treated coffee beans are presented in Figure 3. The AOA of untreated coffee bean extracts (846.9 ± 12.5, 491.5 ± 8.8 and 410.7 ± 9.3 µmol Fe2+-E/g DW for green, medium roasted and dark roasted coffee, respectively) were taken as control values. As can be seen from Figure 3, green coffee turned out to be sensitive to all treatments, whereas roasted coffee was most sensitive to thermal treatments.
After SF treatment, there was an increase in the AOA of the extracts to 910.3 ± 24.6 (green coffee), 521.2 ± 17.7 (medium roasted coffee) and 481.5 ± 20.9 (dark roasted coffee) µmol Fe2+-E/g DW (0.01 < p < 0.05), which in percentage terms gave a rise in the mean AOA value by 7.5%, 6.0% and 17.2%, respectively. After FF treatment, green, medium roasted and dark roasted coffee showed an increase in the AOA of extracts to 882.4 ± 21.1, 511.5 ±14.8 and 479.1 ± 15.3 µmol Fe2+-E/g DW (0.01 < p < 0.05), which in percentage terms gave a rise in the mean AOA value by 4.2%, 4.1% and 16.6%, respectively. These results are explained by the destruction of the cell matrix due to the presence of ice crystals and a yield of antioxidant extractives. Jiao et al. reported that pre-treatment of corn by freezing caused an increase in the yield of extractive antioxidant compounds (lutein and zeaxanthin) and also led to an increase in the AOA of the extract [46]. In the SF treatment process, larger ice crystals are formed, which causes the most severe cell damage [44,45]. For this reason, the samples treated with SF showed the greatest positive deviations of AOA compared to the samples treated with FF. Apparently, the microstructural changes caused by roasting were amplified by the damage caused by freezing. Due to this fact, dark roasted coffee seemed to be most sensitive to freezing and showed the highest growth in the AOA of aqueous extracts. Neri et al. [55] reviewed the effect of freezing on the AOA of plant food extracts; however, their work did not discuss coffee. Apparently, the present study is one of the first to report on the effect of freezing on the AOA of coffee bean extracts. Neri et al. [55] concluded that the effect of freezing on the AOA of plant food extracts depends on the initial state of the treated sample, i.e., its variety, origin, integrity, etc. As a result of the breakage of the cellular structure caused by ice crystals in whole fruits, bioactive substances are released. At the same time, the AOA of the extract can: (a) increase if antioxidants stay in the product; (b) decrease if antioxidants are leached during thawing; (c) remain unchanged.
After MWR treatment, green coffee presented an increase in the AOA of the extract to 895.3 ± 31.7 μmol Fe2+-E/g DW (p < 0.05), or an approximately 5.7% rise in the mean AOA value. The changes in the AOA of roasted coffee extracts were insignificant. Green coffee has the highest MC and, as a consequence, the best dielectric capacity [51,52]; therefore, it was most sensitive to MWR treatment. MWR treatment can be accompanied not only by cell breakage and release of extractive antioxidant compounds but also by the transformation of some antioxidant substances into others [14,49,50]. After the roasting process, the MC in coffee beans decreased significantly (Table 1), their dielectric capacity declined, and they became less sensitive to MWR treatment with specified parameters (800 W, 2.45 GHz, 60 s).
After combined SF + MWR treatment, green, medium roasted and dark roasted coffee showed an increase in the AOA of the extracts to 979.8 ± 29.5, 565.1 ± 15.4 and 505.0 ± 32.1 µmol Fe2+-E/g DW (0.01 < p< 0.05), or an increase in the mean AOA value by 15.7%, 15.0% and 23.0%, respectively. After combined FF + MWR treatment, green, medium roast and dark roast coffee showed an increase in the AOA of the extracts to 940.7 ± 25.9, 543.8 ± 13.7 and 492.8 ± 33.5 µmol Fe2+-E/g DW (0.01 < p < 0.05), or an increase in the mean AOA value by 11.1%, 10.6% and 20.0%, respectively. After combined treatments, an increase in the AOA of green coffee extracts was approximately the same as the total effects of individual treatments. In the case of roasted coffee, combined treatments led to a synergistic increase in the AOA of the extracts. Thus, SF + MWR and FF + MWR are the best pre-treatment methods that can be applied to coffee beans to increase the release of extractive antioxidant compounds.
The results showed that CAP treatment of green coffee for 5 and 15 min reduced the extract AOA to 814.6 ± 18.5 µmol Fe2+-E/g DW (p < 0.05) or by 3.8%, and to 765.1 ± 19.8 µmol Fe2+-E/g DW (p < 0.01) or by 9.7%, respectively. The changes in the AOA of roasted coffee extracts were insignificant. The obtained results are explained by heterophase oxidative processes involving reactive oxygen and nitrogen species, as well as by the presence of a protective oily film on the surface of roasted beans. The DBD is known to produce reactive oxygen and nitrogen species that can work as strong oxidants [56,57,58,59,60]. Since radical particles have a short lifespan and there is a spatial gap between the DBD and the treated sample (Figure 1a), then the main contribution of heterophase oxidation is caused by the most stable molecules, such as ozone (O3), nitrogen oxides (NOx) and hydrogen peroxide (H2O2). The mechanisms of generating O3, NOx and H2O2 by the DBD were discussed in [56,57,58,59,60]. The only report on the effect of cold plasma treatment on the AOA of coffee extracts was found in [31]. In that study, samples of ground roasted coffee were placed in a Petri dish and treated with a stream of cold helium plasma for 30 min. The AOA of the extracts was determined by spectrophotometric methods using FCR and 2,2′-azinobis-3-ethyl benzthiazoline-6-sulfonic acid (ABTS) radical cation. After a 30 min treatment with cold plasma, Folin–Ciocalteu assay showed a 12% reduction in the extract AOA, while the ABTS assay showed that the AOA of the extracts increased by 14%. Casas-Junco et al. [31] explained the obtained results by oxidation of phenolic antioxidants with molecular ozone to hydroxylated and quinone compounds (Folin–Ciocalteu assay) and by non-phenolic antioxidant synthesis due to the effect of UV-B radiation during the exposure to cold plasma (ABTS assay). Meanwhile, UV-B enhanced biosynthesis of phenolics in the plant cellular system was also taking place [61]. Apparently, by reason of the complex nature of plasma, the exact mechanisms of degradation and synthesis of bioactive compounds still remain unclear. It is also worth noting that the results for coffee beans and ground coffee may differ due to differences in the active surface area.

3.4. Interrelation between AOA and MC

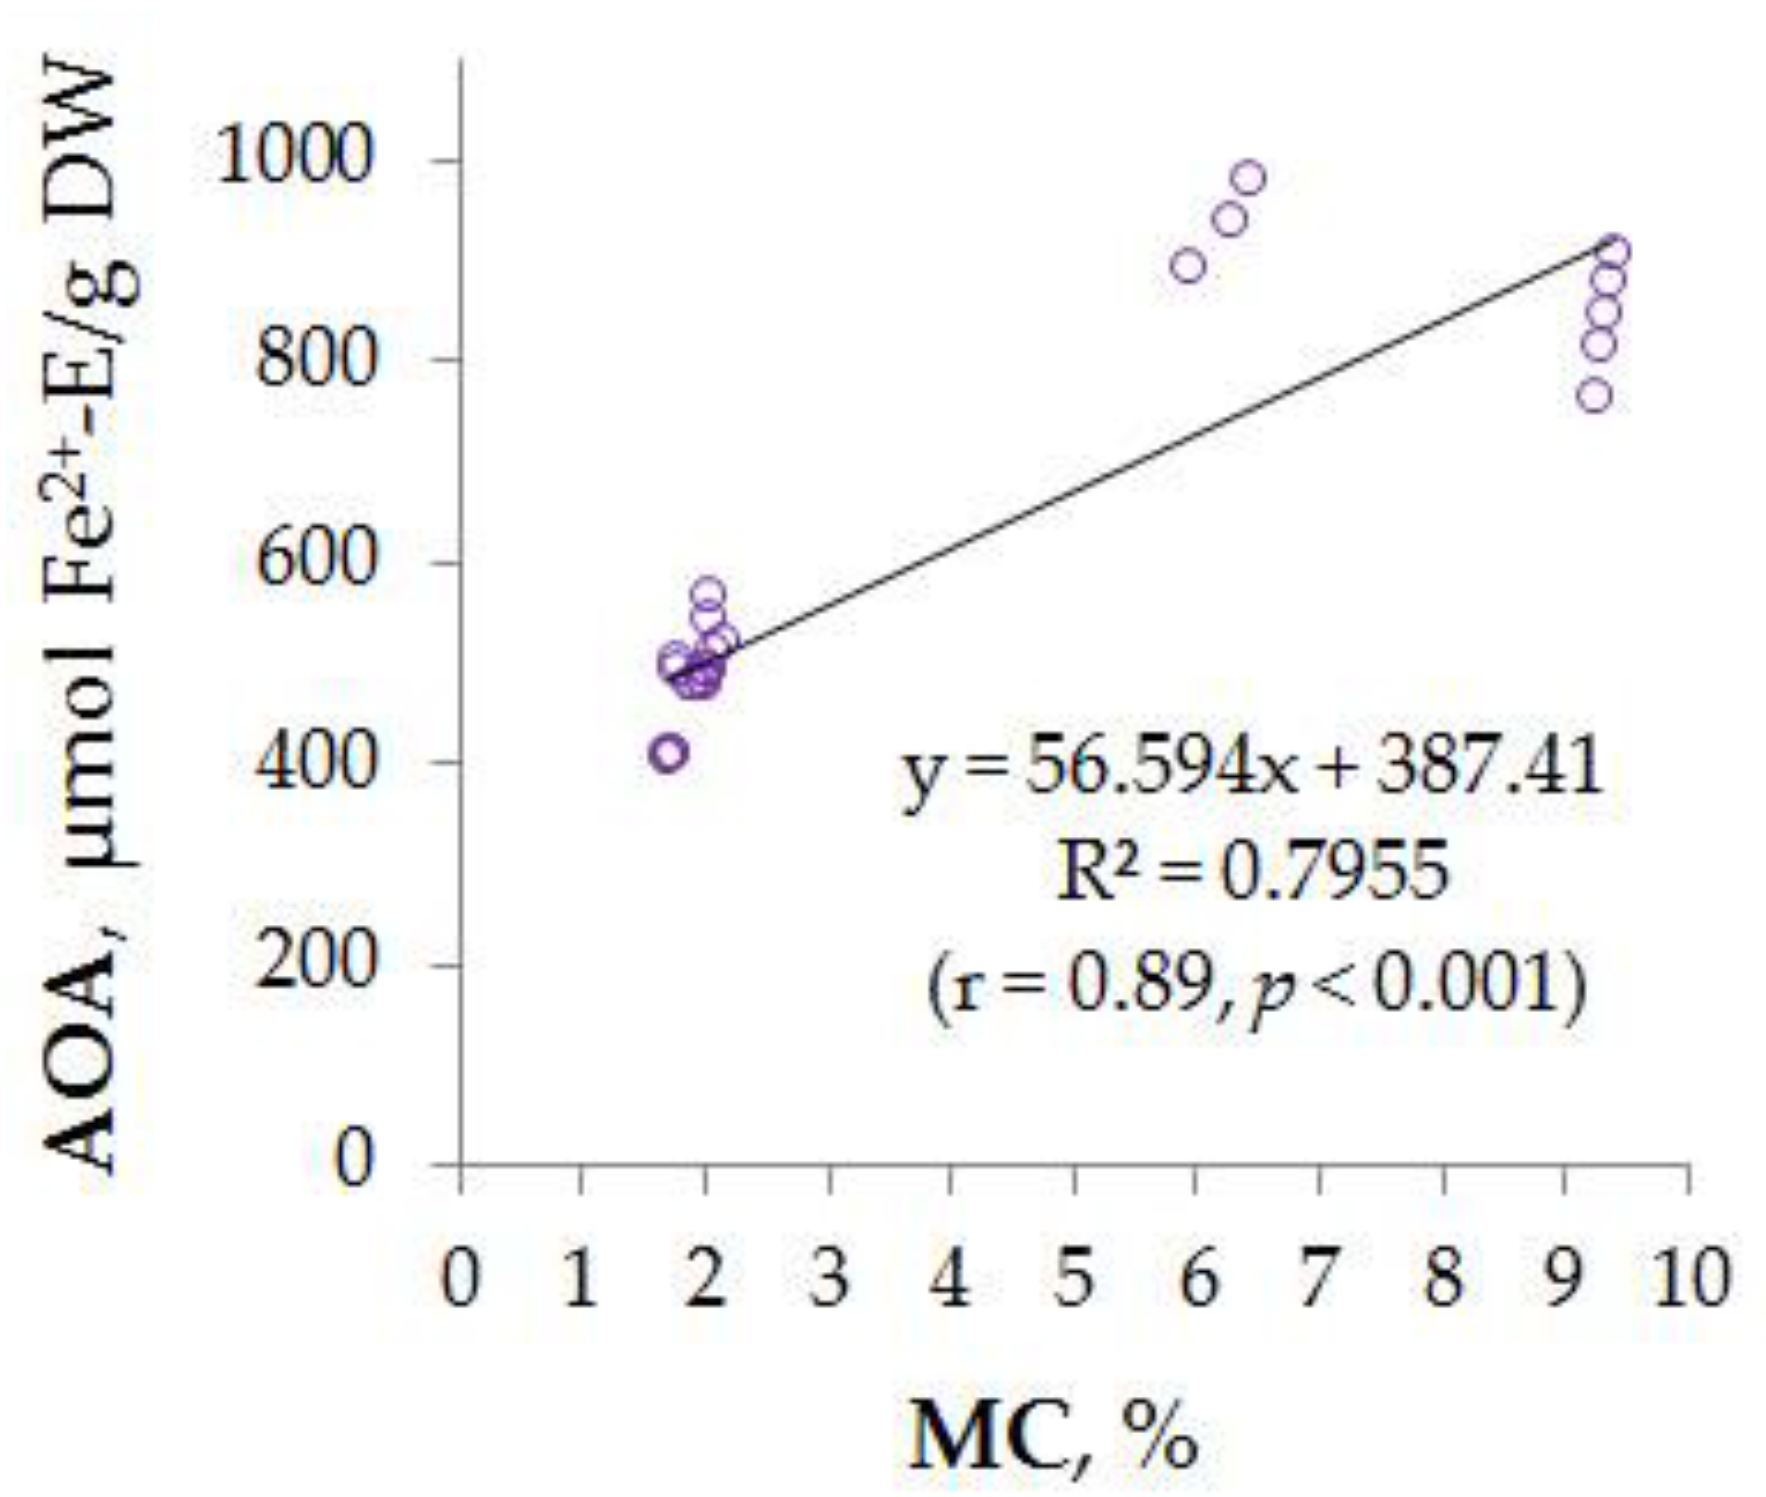
Figure 4 shows the linear dependence AOA = f(MC), describing the interrelation between the AOA of an aqueous extract of coffee beans and MC in coffee beans. A high positive correlation (r = 0.89, p < 0.001) was also found between AOA and MC. These data indicate that MC in coffee beans is a predictive index of the yield of AOA in the extraction process. Treatment methods associated with an increase in the total moisture of coffee beans may enhance the release of antioxidant compounds in the extraction process.

4. Conclusions

The current trends in the development of the food industry are associated with an increase in the food product shelf life and preservation of their nutritional value. In order to solve this problem, non-thermal food processing technologies were proposed as an alternative to thermal technologies. In the present work, Arabica coffee beans (Coffea arabica) were treated by thermal (SF, FF, MWR, SF + MWR, FF + MWR) and non-thermal (CAP) methods in order to study their effect on the AOA of aqueous coffee extracts. The paper provides the first evidence that there is a strong positive correlation between the AOA of an aqueous coffee extract and MC in coffee beans, which indicates the possibility of predicting the yield of AOA during the extraction process by analyzing the total moisture. This study demonstrated that CAP treatment might lead to a more obvious decrease in the antioxidant status of coffee as compared to thermal treatments. The results obtained indicate that SF, FF, MWR and combined treatments may be applied at the pre-extraction stage of coffee bean preparation in order to increase the yield of antioxidant extractives. The effect of the studied treatments aimed at the highest AOA of aqueous extracts of Arabica coffee beans increases in the following sequence: FF > MWR > SF > FF + MWR > SF + MWR for green coffee and FF > SF > FF + MWR > SF + MWR for roasted coffee. It is also worth noting that treatments with SF, MWR and SF + MWR can be easily carried out by utilizing home electric appliances.

Author Contributions

Conceptualization, O.C. and N.S.; investigation, A.T., A.B. and I.M.; validation, A.T., A.B. and I.M.; formal analysis, A.T.; visualization, A.T. and I.M.; resources, A.T., I.M. and O.C.; writing—original draft preparation, A.T.; writing—review and editing, O.C. and N.S. All authors have read and agreed to the published version of the manuscript.

Funding

This research received no external funding.

Institutional Review Board Statement

Not applicable.

Informed Consent Statement

Not applicable.

Data Availability Statement

The data can be obtained from the corresponding author on request.

Conflicts of Interest

The authors declare no conflict of interest.

Appendix A

Figure A1. Images of green coffee beans before (a) and after (b) MWR treatment; medium roasted coffee beans (c) and dark roasted coffee beans (d).
Applsci 12 05780 g00a1

Appendix B

Figure A2. Oscillograph records characterizing no-load voltage (a) and discharge current (b) of DBD impulse.
Applsci 12 05780 g00a2

References

  1. Poole, R.; Kennedy, O.J.; Roderick, P.; Fallowfield, J.A.; Hayes, P.C.; Parkes, J. Coffee consumption and health: Umbrella review of meta-analyses of multiple health outcomes. Br. Med. J. 2017, 359, j5024. [Google Scholar] [CrossRef] [PubMed] [Green Version]
  2. Van Dam, R.M.; Hu, F.B.; Willett, W.C. Coffee, caffeine, and health. N. Engl. J. Med. 2020, 383, 369–378. [Google Scholar] [CrossRef]
  3. Vu, T.-H.T.; Rydland, K.J.; Achenbach, C.J.; Van Horn, L.; Cornelis, M.C. Dietary behaviors and incident COVID-19 in the UK biobank. Nutrients 2021, 13, 2114. [Google Scholar] [CrossRef] [PubMed]
  4. Patay, É.B.; Bencsik, T.; Papp, N. Phytochemical overview and medicinal importance of Coffea species from the past until now. Asian Pac. J. Trop. Med. 2016, 9, 1127–1135. [Google Scholar] [CrossRef] [PubMed] [Green Version]
  5. Munyendo, L.M.; Njoroge, D.M.; Owaga, E.E.; Mugendi, B. Coffee phytochemicals and post-harvest handling–A complex and delicate balance. J. Food Compos. Anal. 2021, 102, 103995. [Google Scholar] [CrossRef]
  6. LIczbiński, P.; Bukowska, B. Tea and coffee polyphenols and their biological properties based on the latest in vitro investigations. Ind. Crops Prod. 2022, 175, 114265. [Google Scholar] [CrossRef]
  7. Meletis, C.D. Coffee—Functional food and medicinal herb. Altern. Complementary Ther. 2006, 12, 7–13. [Google Scholar] [CrossRef] [Green Version]
  8. Alves, R.C.; Casal, S.; Alves, M.R.; Oliveira, M.B. Discrimination between arabica and robusta coffee species on the basis of their tocopherol profiles. Food Chem. 2009, 114, 295–299. [Google Scholar] [CrossRef]
  9. Coffee, tea, cocoa. In Food Chemistry; Belitz, H.-D.; Grosch, W.; Schieberle, P. (Eds.) Springer: Berlin/Heidelberg, Germany, 2009. [Google Scholar] [CrossRef]
  10. Moreira, A.S.P.; Nunes, F.M.; Simões, C.; Maciel, E.; Domingues, P.; Domingues, M.R.M.; Coimbra, M.A. Data on coffee composition and mass spectrometry analysis of mixtures of coffee related carbohydrates, phenolic compounds and peptides. Data Brief 2017, 13, 145–161. [Google Scholar] [CrossRef]
  11. Brainina, K.H.; Stozhko, N.; Vidrevich, M. Antioxidants: Terminology, methods, and future considerations. Antioxidants 2019, 8, 297. [Google Scholar] [CrossRef] [Green Version]
  12. Somporn, C.; Kamtuo, A.; Theerakulpisut, P.; Siriamornpun, S. Effects of roasting degree on radical scavenging activity, phenolics and volatile compounds of Arabica coffee beans (Coffea arabica L. cv. Catimor). Int. J. Food Sci. Technol. 2011, 46, 2287–2296. [Google Scholar] [CrossRef]
  13. Król, K.; Gantner, M.; Tatarak, A.; Hallmann, E. The content of polyphenols in coffee beans as roasting, origin and storage effect. Eur. Food Res. Technol. 2020, 246, 33–39. [Google Scholar] [CrossRef] [Green Version]
  14. Saeed Alkaltham, M.; Musa Özcan, M.; Uslu, N.; Salamatullah, A.M.; Hayat, K. Effect of microwave and oven roasting methods on total phenol, antioxidant activity, phenolic compounds, and fatty acid compositions of coffee beans. J. Food Process. Preserv. 2020, 44, e14874. [Google Scholar] [CrossRef]
  15. Arzoo, S.; Badr, N.A.; Masri, S.A.; Obead, M.A.A.B. Study on the flavonoids, tocopherol and ascorbic acid content in raw and roasted Arabica coffee beans. J. Agric. Res. 2018, 4, 49–60. [Google Scholar]
  16. Olszowy-Tomczyk, M. Synergistic, antagonistic and additive antioxidant effects in the binary mixtures. Phytochem. Rev. 2020, 19, 63–103. [Google Scholar] [CrossRef]
  17. Apak, R.; Gorinstein, S.; Böhm, V.; Schaich, K.M.; Özyürek, M.; Güçlü, K. Methods of measurement and evaluation of natural antioxidant capacity/activity (IUPAC Technical Report). Pure Appl. Chem. 2013, 85, 957–998. [Google Scholar] [CrossRef] [Green Version]
  18. Apak, R.; Özyürek, M.; Güçlü, K.; Çapanoğlu, E. Antioxidant activity/capacity measurement. 1. Classification, physicochemical principles, mechanisms, and electron transfer (ET)-based assays. J. Agric. Food Chem. 2016, 64, 997–1027. [Google Scholar] [CrossRef] [PubMed]
  19. Wu, H.; Gu, J.; BK, A.; Nawaz, M.A.; Barrow, C.J.; Dunshea, F.R.; Suleria, H.A.R. Effect of processing on bioaccessibility and bioavailability of bioactive compounds in coffee beans. Food Biosci. 2022, 46, 101373. [Google Scholar] [CrossRef]
  20. Noonim, P.; Mahakarnchanakul, W.; Varga, J.; Samson, R.A. Aspergilli and Ochratoxin A in coffee. In Aspergillus in the Genomic Era; Varga, J., Samson, R.A., Eds.; Wageningen Academic Publishers: Wageningen, The Netherlands, 2008; pp. 213–231. [Google Scholar] [CrossRef]
  21. Hollingsworth, R.G.; Jang, E.B.; Follett, P.A. Freezing as a treatment to prevent the spread of Hypothenemus hampei (Coleoptera: Curculionidae), in coffee. J. Econ. Entomol. 2013, 106, 653–660. [Google Scholar] [CrossRef] [Green Version]
  22. International Coffee Organization. Available online: https://www.ico.org/ (accessed on 27 April 2022).
  23. Dutra, E.R.; Oliveira, L.S.; Franca, A.S.; Ferraz, V.P.; Afonso, R.J.C.F. A Preliminary study on the feasibility of using the composition of coffee roasting exhaust gas for the determination of the degree of roast. J. Food Eng. 2001, 47, 241–246. [Google Scholar] [CrossRef]
  24. Souza, L.S.; Carrero Horta, I.P.; Souza Rosa, L.; Barbosa Lima, L.G.; Santos da Rosa, J.; Montenegro, J.; Silva Santos, L.; Nana de Castro, R.B.; Freitas-Silva, O.; Teodoro, A.J. Effect of the roasting levels of Coffea arabica L. extracts on their potential antioxidant capacity and antiproliferative activity in human prostate cancer cells. RSC Adv. 2020, 10, 30115–30126. [Google Scholar] [CrossRef]
  25. Jung, S.; Gu, S.; Lee, S.-H.; Jeong, Y. Effect of roasting degree on the antioxidant properties of espresso and drip coffee extracted from Coffea arabica cv. Java. Appl. Sci. 2021, 11, 7025. [Google Scholar] [CrossRef]
  26. Bobková, A.; Hudáček, M.; Jakabová, S.; Belej, L.; Capcarová, M.; Čurlej, J.; Bobko, M.; Árvay, J.; Jakab, I.; Čapla, J.; et al. The effect of roasting on the total polyphenols and antioxidant activity of coffee. J. Environ. Sci. Health Part B 2020, 55, 495–500. [Google Scholar] [CrossRef]
  27. Farah, A.; Paulis, T.; Trugo, L.C.; Martin, P.R. Effect of roasting on the formation of chlorogenic acid lactones in coffee. J. Agric. Food Chem. 2005, 53, 1505–1513. [Google Scholar] [CrossRef] [PubMed]
  28. Chacha, J.S.; Zhang, L.; Ofoedu, C.E.; Suleiman, R.A.; Dotto, J.M.; Roobab, U.; Agunbiade, A.O.; Duguma, H.T.; Mkojera, B.T.; Hossaini, S.M.; et al. Revisiting non-thermal food processing and preservation methods–Action mechanisms, pros and cons: A technological update (2016–2021). Foods 2021, 10, 1430. [Google Scholar] [CrossRef]
  29. Casas-Junco, P.P.; Solís-Pacheco, J.R.; Ragazzo-Sánchez, J.A.; Aguilar-Uscanga, B.R.; Bautista-Rosales, P.U.; Calderón-Santoyo, M. Cold plasma treatment as an alternative for Ochratoxin A detoxification and inhibition of mycotoxigenic fungi in roasted coffee. Toxins 2019, 11, 337. [Google Scholar] [CrossRef] [PubMed] [Green Version]
  30. Dong, W.; Cheng, K.; Hu, R.; Chu, Z.; Zhao, J.; Long, Y. Effect of microwave vacuum drying on the drying characteristics, color, microstructure, and antioxidant activity of green coffee beans. Molecules 2018, 23, 1146. [Google Scholar] [CrossRef] [Green Version]
  31. Casas-Junco, P.P.; Ragazzo-Sánchez, J.A.; Solís-Pacheco, J.R.; Aguilar-Uscanga, B.R.; Sáyago-Ayerdi, S.G.; Calderón-Santoyo, M. Physicochemical, aromatic, sensory properties and antioxidant activity of roasted coffee (Coffea arabica L.) treated with cold plasma technology. Biotecnia 2021, 23, 120–126. [Google Scholar] [CrossRef]
  32. Muzyukin, I.L. Experimental investigation of plasma cloud scattering initiated by an accelerated electron beam. IEEE Trans. Plasma Sci. 2015, 43, 3744–3748. [Google Scholar] [CrossRef]
  33. ISO 1446:2001; Green Coffee. Determination of Water Content. Basic Reference Method. International Organization for Standardization: Geneva, Switzerland, 2018; pp. 1–8.
  34. ISO 11294:1994; Roasted Ground Coffee. Determination of Moisture Content. Method by Determination of Loss in Mass at 103 Degrees C (Routine Method). International Organization for Standardization: Geneva, Switzerland, 2018; pp. 1–3.
  35. Muzykiewicz-Szymańska, A.; Nowak, A.; Wira, D.; Klimowicz, A. The Effect of brewing process parameters on antioxidant activity and caffeine content in infusions of roasted and unroasted Arabica coffee beans originated from different countries. Molecules 2021, 26, 3681. [Google Scholar] [CrossRef]
  36. SCAA Standard. Golden Cup; Specialty Coffee Association of America: Santa Ana, CA, USA, 2015; pp. 1–2. Available online: http://www.scaa.org/PDF/resources/golden-cup-standard.pdf (accessed on 27 April 2022).
  37. Ivanova, A.; Gerasimova, E.; Gazizullina, E. Study of antioxidant properties of agents from the perspective of their action mechanisms. Molecules 2020, 25, 4251. [Google Scholar] [CrossRef] [PubMed]
  38. Magalhães, L.M.; Segundo, M.A.; Reis, S.; Lima, J.L.F.C. Methodological aspects about in vitro evaluation of antioxidant properties. Anal. Chim. Acta 2008, 613, 1–19. [Google Scholar] [CrossRef]
  39. Gulcin, İ. Antioxidants and antioxidant methods: An updated overview. Arch. Toxicol. 2020, 94, 651–715. [Google Scholar] [CrossRef] [Green Version]
  40. Singleton, V.L.; Orthofer, R.; Lamuela-Raventós, R.M. Analysis of total phenols and other oxidation substances and antioxidants by means of Folin-Ciocalteu reagent. In Methods in Enzymology; Packer, L., Ed.; Elsevier Inc.: Amsterdam, The Netherlands, 1999; Volume 299, pp. 152–178. [Google Scholar] [CrossRef]
  41. Brainina, K.; Stozhko, N.; Bukharinova, M.; Khamzina, E.; Vidrevich, M. Potentiometric method of plant microsuspensions antioxidant activity determination. Food Chem. 2019, 278, 653–658. [Google Scholar] [CrossRef] [PubMed]
  42. Brainina, K.H.Z.; Tarasov, A.V.; Kazakov, Y.A.E.; Vidrevich, M.B. Platinum electrode regeneration and quality control method for chronopotentiometric and chronoamperometric determination of antioxidant activity of biological fluids. J. Electroanal. Chem. 2018, 808, 14–20. [Google Scholar] [CrossRef]
  43. GNU PSPP. Available online: https://www.gnu.org/software/pspp/ (accessed on 27 April 2022).
  44. Li, D.; Zhu, Z.; Sun, D.-W. Effects of freezing on cell structure of fresh cellular food materials: A review. Trends Food Sci. Technol. 2018, 75, 46–55. [Google Scholar] [CrossRef]
  45. Jha, P.K.; Xanthakis, E.; Chevallier, S.; Jury, V.; Le-Bail, A. Assessment of freeze damage in fruits and vegetables. Food Res. Int. 2019, 121, 479–496. [Google Scholar] [CrossRef] [PubMed]
  46. Jiao, Y.; Li, D.; Chang, Y.; Xiao, Y. Effect of freeze-thaw pretreatment on extraction yield and antioxidant bioactivity of corn carotenoids (lutein and zeaxanthin). J. Food Qual. 2018, 2018, 9843503. [Google Scholar] [CrossRef]
  47. Schenker, S.; Handschin, S.; Frey, B.; Perren, R.; Escher, F. Pore structure of coffee beans affected by roasting conditions. J. Food Sci. 2000, 65, 452–457. [Google Scholar] [CrossRef]
  48. Wang, X.; Hong, D.-F.; Hu, G.-L.; Li, Z.-R.; Peng, X.-R.; Shi, Q.-Q.; Qiu, M.-H. Morphological changes and component characterization of coffee silverskin. Molecules 2021, 26, 4914. [Google Scholar] [CrossRef]
  49. Li, Y.; Fabiano-Tixier, A.S.; Abert-Vian, M.; Chemat, F. Microwave-assisted extraction of antioxidants and food colors. In Microwave-Assisted Extraction for Bioactive Compounds. Theory and Practice; Chemat, F., Cravotto, G., Eds.; Springer: Boston, MA, USA, 2012; Chapter 5; pp. 103–125. [Google Scholar] [CrossRef]
  50. Hu, Q.; He, Y.; Wang, F.; Wu, J.; Ci, Z.; Chen, L.; Xu, R.; Yang, M.; Lin, J.; Han, L.; et al. Microwave technology: A novel approach to the transformation of natural metabolites. Chin. Med. 2021, 16, 87. [Google Scholar] [CrossRef]
  51. Jafari, M.; Chegini, G.; Rezaeealam, B.; Akmal, A.A.S. Experimental determination of the dielectric constant of wheat grain and cluster straw in different moisture contents. Food Sci. Nutr. 2020, 8, 629–635. [Google Scholar] [CrossRef] [Green Version]
  52. Solyom, K.; López, P.R.; Esquivel, P.; Vásquez-Caicedo, A.L. Effect of temperature and moisture contents on dielectric properties at 2.45 GHz of fruit and vegetable processing by-products. RSC Adv. 2020, 10, 16783–16790. [Google Scholar] [CrossRef] [PubMed]
  53. Apak, R.; Özyürek, M.; Güçlü, K.; Çapanoğlu, E. Antioxidant activity/capacity measurement. 2. Hydrogen atom transfer (HAT)-based, mixed-mode (electron transfer (ET)/HAT), and lipid peroxidation assays. J. Agric. Food Chem. 2016, 64, 1028–1045. [Google Scholar] [CrossRef]
  54. Tarasov, A.V.; Chugunova, O.V.; Stozhko, N.Y. Potentiometric sensor system based on modified thick-film electrodes for determining the antioxidant activity of beverages. Food Ind. 2020, 5, 85–96. [Google Scholar] [CrossRef]
  55. Neri, L.; Faieta, M.; Di Mattia, C.; Sacchetti, G.; Mastrocola, D.; Pittia, P. Antioxidant activity in frozen plant foods: Effect of cryoprotectants, freezing process and frozen storage. Foods 2020, 9, 1886. [Google Scholar] [CrossRef]
  56. Chang, M.B.; Wu, S.-J. Experimental study on ozone synthesis via dielectric barrier discharges. Ozone Sci. Eng. 1997, 19, 241–254. [Google Scholar] [CrossRef]
  57. Pekárek, S. Non-thermal plasma ozone generation. Acta Polytech. 2003, 43, 47–51. [Google Scholar] [CrossRef]
  58. Shimizu, T.; Sakiyama, Y.; Graves, D.B.; Zimmermann, J.L.; Morfill, G.E. The dynamics of ozone generation and mode transition in air surface micro-discharge plasma at atmospheric pressure. New J. Phys. 2012, 14, 103028. [Google Scholar] [CrossRef] [Green Version]
  59. Locke, B.R.; Shih, K.-Y. Review of the methods to form hydrogen peroxide in electrical discharge plasma with liquid water. Plasma Sources Sci. Technol. 2011, 20, 034006. [Google Scholar] [CrossRef]
  60. Feizollahi, E.; Iqdiam, B.; Vasanthan, T.; Thilakarathna, M.S.; Roopesh, M.S. Effects of atmospheric-pressure cold plasma treatment on deoxynivalenol degradation, quality parameters, and germination of barley grains. Appl. Sci. 2020, 10, 3530. [Google Scholar] [CrossRef]
  61. Grzegorzewski, F.; Rohn, S.; Kroh, L.W.; Geyer, M.; Schlüter, O. Surface morphology and chemical composition of lamb’s lettuce (Valerianella locusta) after exposure to a low-pressure oxygen plasma. Food Chem. 2010, 122, 1145–1152. [Google Scholar] [CrossRef]
Figure 1. Experimental setup for CAP treatment: 1—high voltage pulse generator; 2—fan; 3—glass funnel with DBD source; 4—glass beaker with a sample (a). Circuit diagram of a high voltage pulse generator prototype used in the experiment (b).
Applsci 12 05780 g001
Figure 2. The AOA of aqueous extracts of untreated coffee beans measured by spectrophotometric (a) and potentiometric (b) methods (n = 3). Percentage indicates the change in mean AOA after roasting relative to green coffee. Bars indicate the upper boundaries of the SD. Statistically significant differences are indicated by two (p < 0.01) and three (p < 0.001) asterisks.
Applsci 12 05780 g002
Figure 3. The AOA of aqueous extracts of untreated (control) and treated coffee beans (n = 3). Percentage indicates the change in the average value of AOA after treatment. Bars indicate the upper boundaries of the SD. Statistically significant differences relative to the control are indicated by one (p < 0.05) and two (p < 0.01) asterisks.
Applsci 12 05780 g003
Figure 4. Linear dependence between AOA of aqueous extract of coffee beans and MC in coffee beans.
Applsci 12 05780 g004
Table 1. Effect of different types of treatment on MC in coffee beans (n = 3).
TreatmentGreen CoffeeMedium Roasted CoffeeDark Roasted Coffee
MC, %ΔMC, %MC, %ΔMC, %MC, %ΔMC, %
No Treatment9.33 ± 0.15-2.02 ± 0.08-1.72 ± 0.07-
SF9.42 ± 0.29+0.092.15 ± 0.12 *+0.131.92 ± 0.14 *+0.20
FF9.37 ± 0.25+0.042.08 ± 0.13+0.061.87 ± 0.12 *+0.15
MWR5.95 ± 0.37 **−3.381.99 ± 0.07−0.031.70 ± 0.06−0.02
SF + MWR6.44 ± 0.45 **−2.892.04 ± 0.14+0.021.79 ± 0.13+0.07
FF + MWR6.28 ± 0.41 **−3.052.02 ± 0.1401.77 ± 0.15+0.05
CAP–59.31 ± 0.17−0.022.01 ± 0.09−0.011.73 ± 0.08+0.01
CAP–159.25 ± 0.19−0.082.00 ± 0.09−0.021.71 ± 0.08−0.01
Note: * significant difference relative to the untreated sample, p < 0.05; ** significant difference relative to the untreated sample, p < 0.01. ΔMC indicates the difference between the mean MC in treated and untreated coffee beans.
Publisher’s Note: MDPI stays neutral with regard to jurisdictional claims in published maps and institutional affiliations.