1. Introduction
Occupational safety and health is a critical process for all industries that require auditing to complement or facilitate the monitoring of events that introduce risk of injury. Information and communication technologies have been at the forefront of business-intelligence tools and services that support safety analysis and effective decision making. Recently, their ability to fully utilize portable devices and their innovative features have provided the means for mitigating technology-oriented design issues and limitations and moving towards a more human-centered approach [
1]. Capitalizing on user requirements and skill set, modern tools produce audits and safety reports that collect media-enriched temporal and spatial information. This essentially translates to safety data that require more sophisticated maintenance, management, organization and analysis. During the last decade, long-term data has been processed to produce various legislative, regulatory and process-oriented safety recommendations that, in turn, also offer a valuable resource for analysis and classification [
2].
Mining incident reports and safety audits is gradually becoming the main paradigm for extracting insights that optimize risk analysis and assessment strategies. Textual databases of safety narratives are being increasingly exploited to aid decision-making tasks and further improve inspection planning, process monitoring and coordination [
3]. Being highly confidential and corporate-sensitive, such information silos and data pools have not been shared or open for a long time. Regulatory acts and initiatives have managed to remove a few barriers and achieve public sharing. As a result, research initiatives were able to gain access and analyze reports across many industries, mapping diverse working environments and capturing a wide scope of events [
4,
5]. Specifically, text classification is emerging as a key enabler of industrial knowledge management, leveraging the aggregated wealth of corporate and manufacturing information captured in a textual format. Fueled by the ongoing and rapid digital transformation of industry, text mining techniques have been extensively studied for the detection and diagnosis of engineering problems, reliability issues and safety risks. Currently, machine learning is the primary enabler for analytical processes that address challenges that span from labeling and mining reports for the classification of causal factors [
6], to developing safety leading indicators and driving predictive policies [
7,
8].
The world around us is multimodal. We hear sounds, see images, smell odours and use language to represent high-level concepts. Multimodal processing aims to combine information from multiple sources (modalities) and effectively model inter- and intra-modality interactions. These representations can be used in machine-learning pipelines to solve real-world tasks. Common examples of multimodal tasks involve image captioning [
9], visual question answering [
10,
11] and sentiment analysis [
12,
13,
14]. Furthermore, in multimodal formulations of traditionally unimodal tasks, the inclusion of multiple modalities can significantly improve model performance, e.g., machine translation [
15] and speech recognition [
16,
17].
In this work, we employ multimodal processing in the field of OSH data analysis. For this, we create a novel dataset, Safety4All, for the classification of safety-related observations. Safety4All is a collection of textual and visual observations by expert SOs, with associated metadata, gathered during on-premise safety inspections in real-world businesses. We propose a multimodal architecture that takes advantage of the representational power of modality-specific, large pretrained models for the extraction of unimodal textual and visual representations. These representations are projected in a shared multimodal space through contrastive learning. In contrast to previous works, we do not use contrastive learning for large-scale model pretraining; rather, we formulate a joint task and contrastive objective during regular model training.
Our key contributions can be summarized as follows:
We present an overview of the data-driven approaches in the literature geared towards OSH applications. We summarize the currently studied applications and datasets and present an overview of the current trends.
To our knowledge, most of the works on the data-driven analysis of OSH observations are based on text-based analysis. The multimodal analysis of textual and visual observations is a novel and not widely explored field. In this paper, we demonstrate that the inclusion of on-site photographs can provide complementary information to the observation description that can significantly improve performance of data-driven OSH applications.
We construct and curate the Safety4All dataset, comprising of 5344 safety observations, gathered from 86 safety officers (SO) across 486 sites. The observations consist of pairs of on-site photographs and issue descriptions, accompanied with relevant metadata. We present an extensive analysis on this dataset and define three tasks for the automatic analysis of OSH observations, i.e., (a) priority classification of observations, (b) observation assessment and (c) observation categorization.
We perform extensive ablations regarding the proposed shared-space fusion approach, using all combinations of two state-of-the-art text and visual encoders, and compare it to a simple late-fusion baseline. Our analysis shows that shared-space representations extracted with the use of the joint loss yield a superior performance to the representations extracted through the baseline fusion approach for all experimental settings.
We train and publish GR-Electra, a large pretrained language model for the Greek language based on the ELECTRA architecture [
18], created for the analysis of the issue descriptions. GR-Electra yields comparable performance to GreekBERT [
19], given less training data, due to the aggressive cleaning of the pretraining corpus.
Paper Organization
The paper is organized as follows: In
Section 2, we present an extensive list of related works for data-driven OSH applications, and multimodal and contrastive machine learning. In
Section 3, we describe the collection and curation of the Safety4All dataset, used throughout this work. In
Section 4, we describe the proposed multimodal fusion approach and the joint contrastive learning objective. In
Section 5, we describe the training pipeline for GR-ELECTRA. In
Section 6, we describe the experimental configuration we use and provide reproducibility details for the proposed models. In
Section 7, we present and discuss experimental results for three OSH tasks, enabled by the Safety4All dataset, i.e., priority classification in
Section 7.1, observation assessment in
Section 7.2 and observation categorization in
Section 7.3. Finally, in
Section 8, we discuss the main findings of this work, summarize the key conclusions, and recommend avenues for future works and extensions. An ethical statement about the implications of this work is included in
Section 9.
2. Related Work
2.1. Text-Mining of Safety Narratives and Reports
Narrative texts have been, for decades, the recording format of any report that describes an incident, an accident, an injury or a potential risk. Combining machine learning with natural language processing can automate their classification and help safety managers in construction projects to quickly understand underlying conditions and factors and gain insights for proper assessment regarding safety measures [
20]. As part of these safety reports, near misses often provide free-text descriptions for unplanned events that introduce risk but have not resulted in an injury yet. Their place in the causality chain of events make them extremely useful for interpreting the context of accidents and the function of every incident mechanism. This, in turn, allows for better reaction times and more efficient prevention, by installing the appropriate monitoring agents and allocating the needed resources [
21]. Such methods can significantly impact the efficient forecasting of safety risks in construction, since the frequency of critical events is considerably higher compared to other industries and working environments, and often the accumulated knowledge is limited by manual analysis or lack of capacity and means to handle the large number of reports [
22,
23]. Evaluating several automatic classification methods has revealed that a key challenge resides in the overly focused content of many narratives, about aspects that are not directly relevant to causes or effects. Proper labeling and keyword classification are also affected by the diverse semantics and phrasing of similar or the same events [
24]. No classifier can uniformly offer the best performance, but using text ontologies and lexicons can overcome the excessive volume of terms in narratives during pre-processing. Domain-specific lexicons can be extracted from construction accident reports to refine the analysis process and help identify safety risk factors. Producing suitable lexical resources and investing in their semantic relationships (i.e., synonyms) helps improve text segmentation. Furthermore, mining performance can benefit from placing experts in the loop and allowing them to contextualize high-frequency terms [
25]. Fusing lexicons into text mining can help overcome language-specific limitations and provide the semantic tools for advanced pre-processing. The results can drive established methods, such as an ABC analysis that calculates the importance of safety-risk-management processes [
3]. Finally, metrics have also been studied to evaluate the strength of classification categories for construction incidents, allowing their prioritization when considering a standardized set for specific accidents and risks. While weak categories can still offer meaningful knowledge, their use will not contribute to the performance of machine-learning applications [
26].
Towards using more sophisticated semantic tools, ontologies can offer significant value when analyzing structured safety reports that feature strictly defined relationships between established parameters and metrics. They provide formalizations that leverage sharing, integration and collaboration, while primarily facilitating the use of automated reasoning [
27]. While traditional methods of text classification require a properly maintained reference of a classified corpus for training and ensuring efficient performance, ontology-oriented classifiers capitalize on aggregated domain knowledge to offer enhanced accuracy [
28,
29]. This approach can effectively overcome the boundaries introduced when dealing with reports in different languages. Building a multilingual domain ontology can facilitate the identification of meaningful semantic patterns in incident descriptions, regardless of their language [
30].
Automating the classification of unstructured text from hazard reports can also create the appropriate input for specific safety-management systems and visualization tools such as bow-tie diagrams. Such integration prospects can directly benefit the adoption of best practices, in terms of safety process pipelines. Strengthening the management of safety knowledge can also aid incident investigation and facilitate the collection of provenance data [
31]. Dealing with hazards and, specifically, a HAZOP analysis, safety experts can now conduct text mining with active and deep-learning techniques, to re-evaluate previously recorded knowledge and validate or expand it accordingly. Gathering hints and insights from this versioning process empowers them to detect hidden dangers and actively enrich a reference resource that supports and guides every professional in the field [
32].
The aviation domain is another demanding field and an early adopter of modern data-driven frameworks. The use of NLP methods and metadata analysis for incident reports can reveal how causal factors and external parameters are shared across many incidents, and help understand how the experience of each collaborator connects and aligns, despite their subjective nature [
33]. Classification of safety narratives in this context can help in assessing the probability of the event reaching a higher severity level, and studying the controllability and intervention capacity of the people involved. Familiarity and awareness can also be studied to determine the baseline cognition state required for the successful mitigation of the problem and confrontation of unexpected obstacles [
34]. Since aviation is considered as a domain where safety reporting systems have reached higher maturity and sophistication, providing advanced and interactive environments for experts to view, filter and identify emerging dangers and risks is a necessity [
35].
In
Table 1, we present an overview and categorization of the applications of data-analytics and text-mining techniques in the OSH domain across industries. The studied research indicates that construction is a prominent industry, currently leading the advances of both research and development on risk analysis and safety solutions. Text classification is a challenging task and modern approaches show that its accuracy can greatly benefit from utilizing modern lexical and semantic resources, such as domain-oriented lexicons, thesauri and ontologies. We also note that several research initiatives employ the evaluation of key risk parameters such as severity, priority and preparedness, to rate and rank safety reports, or even assess inspection performance. In terms of datasets, most research facilitates the volume of reports that populate the OSHA repositories.
While rich in size and often extensive as a timespan, publicly available datasets primarily offer text-only reports with no additional formats such as photos or videos. This is commonly expected, since such media types take up significantly more storage resources and contain sensitive data that require sophisticated anonymization techniques. In recent years, both major industries and OHS services have invested in devices (smartphones) and software services (clouds) that leverage media production during inspection and make it a necessity, to maximize the value of insights from the multimodal analysis of enriched safety reports. This paper follows this trend and reports the results from the analysis of a dataset from a major Greek OHS service contractor.
2.2. Pretrained Language Encoders and Image Encoders
The adoption of large pretrained language models has resulted in impressive results in multiple natural language benchmarks and tasks [
36]. ELMO [
37] is one of the first large models that learns contextualized word representations, i.e., embeddings, via Bidirectional LSTMs [
38] and autoregressive lagnuage model losses. BERT [
39] utilizes the transformer architecture [
40] as well as masked language modeling (MLM) loss function, and learns contextual representations of (tokenized) words. RoBERTa [
41], ALBERT [
42], and ELECTRA [
18] all heavily rely on BERT and propose improvements on the initial training strategy and/or architecture. The GPT family [
43,
44,
45,
46] propose a generative pretraining language model loss function coupled with a decoder-based transformer architecture and its successors are larger models trained on massive datasets with additional pretraining heuristics to improve scalability.
Vision models and, in particular, image classification have been one of the early successes in deep learning. In particular, transfer learning from CNN architectures, pretrained as image classifiers on large datasets (e.g., ImageNet [
47]) have boosted performance or enabled a large variety of downstream tasks. These architectures include VGG [
48], the ResNet model family [
49,
50,
51], and, lately, EfficientNet [
52]. Transformer and (multi-Layer perceptron) MLP-based architectures have also been proposed, enabling efficient pretraining of deeper models on larger datasets. ViT [
53] is a transformer-based image encoder, pretrained on a 300M labeled image dataset and then fine tuned on downstream tasks. MLP-Mixer [
54] follows a similar approach to ViT, but is purely based on MLPs which have been shown to match CNN and transformer-based architectures when pretrained on massive labeled data. In [
55], Chen et al. propose a training procedure for ViT that smooths the loss landscape and does not require large-scale pretraining for good performance. Self-supervised learning in vision models has also been explored for computer vision models. In [
56], the self-supervision signal is generated through context-prediction loss, while in [
57], Zhang et al. propose the image colorization task for model self-supervision. In addition, iGPT (image GPT) [
58] reduces image resolution and applies an unsupervised generative pretraining on a transformer-based architecture.
The above is a succinct overview of the available encoders for image and language inputs. For a more detailed study, we direct the reader to this survey [
36], which summarizes the history, trends and open questions in the field of pretrained models, as well as the following surveys that take a deep dive into the individual models [
59,
60,
61].
2.3. Contrastive Learning
Contrastive learning is a subfield of metric learning that aims to explicitly shape the latent feature space learned by a neural network. This is usually performed by formulating training losses that enforce that latent features of samples belonging to the same class are close to each other, while other samples lie far away in the latent space. One early attempt at supervised contrastive learning is proposed in [
62], where a loss function is formulated, which, given a pair of input samples, minimizes their latent feature distance if they belong to the same class and maximizes it otherwise. Other lines of work in contrastive learning rely on “negative sampling”, i.e., the sampling of “counter-examples”. In general, given an anchor sample, a positive and a negative sample are chosen and the embedding of the anchor is forced to have high similarity with the positive sample and low similarity with the negative. This approach was popularized by the triplet loss [
63], which compares triplets within a batch and is generalized, in [
64], to compare all elements within the batch. In [
65], Sohn et al. propose another extension to the triplet loss which compares a positive sample with multiple negative samples. A probabilistic formulation of this is the noise contrastive estimation (NCE) loss [
66], and its softmax version [
67], which aims to distinguish an input sample from noise. In [
68], the authors propose InfoNCE, an extension of NCE that compares an input sample to multiple independent noise samples.
In the multimodal setting, contrastive learning has been applied for the alignment of multimodal representations in a shared multimodal space. In [
69], the authors propose MACD, which uses a cross-modal version of the NCE loss for pretraining a multimodal model to solve downstream natural language inference tasks. A multi-layer version of NCE was also used for pretraining, in [
70], for action recognition and video retrieval. In [
71], a large text corpus was augmented with multimodal data, which were used to align textual representations using a variant of the SimCSE loss [
72], in order to create better sentence embeddings. In [
73], a variant of the InfoNCE loss was used for the pretraining of a multimodal model to produce transferable representations for multiple downstream tasks. In [
74], an n-pair auxiliary loss was used in a bi-modal architecture for fake-news detection and fine-grained sentiment analysis. In [
75,
76], the authors proposed contrastive-learning pretraining objectives that model both inter- and intra-modality representations with applications in video captioning and retrieval ([
75]), and cross-modal retrieval and image tagging ([
76]). In [
77], MIL-NCE was proposed, an extension of softmax NCE [
67] for multimodal pretraining. A pretraining objective based on NCE loss was also proposed in [
78], which aimed to build shared and independent multimodal spaces for three modalities using the visual modality as an anchor. Finally, in [
79], the authors proposed the CLIP model, which utilizes an n-pair loss for large-scale pretraining of a visual-text multimodal architecture with applications in zero-shot learning. In
Table 2, we summarize the use of contrastive objectives for multimodal representation learning in the literature. In particular, we summarize the downstream tasks they tackle, the types of contrastive objectives and the datasets used for self-supervised pretraining (if any). We observe that most of these works use the contrastive-learning paradigm to construct self-supervised objectives for model pretraining on large-scale datasets, with numbers of samples in the order of millions. In our case, we want to leverage contrastive learning to align the text–visual representations in the multimodal space for a smaller-scale setting. Therefore, we opted to use contrastive loss as an auxiliary objective during model training.
3. The Safety4All Dataset
In the present analysis, the data used were gathered during the health and safety visits of 86 Safety Officers (SO) on 486 sites. The approximately 5344 issues were collected from multiple locations across Greece, between hundreds of companies. These issues were identified on four broad location types: (i) offices, (ii) retail, (iii) warehouses and (iv) construction Sites. Since this dataset is linked with hundreds of distinct working places, each location type may span across a wide diversity of sites and conditions. As an example, while a small warehouse (of less than 300 square meters) is essentially a quite different site from a large logistics center, they both share similar hazards and, thus, inspection is based on the same criteria.
3.1. Locations and Checklists
A checklist is a taxonomy of possible health and safety hazards that can be encountered in a location and is used to guide the SOs to produce structured observations. Each location type has a corresponding checklist (i.e., offices checklist). This checklist offers an extensive set of probable events and issues, organized in groups and sub-groups, to be referenced by the SO during inspection. Every probable issue is placed under a specific sub-group of the checklist taxonomy. For example, regarding an office, an SO may detect and report an issue that falls in the group ‘Fire Safety’ and the sub-group ‘Fire Extinguishers’. The checklists’ taxonomy is not exhaustive and SOs are not expected to make a binary (i.e., yes/no) decision for every possible issue. The software that captures the SO reports allows them to browse these checklists as a reference guide for what needs to be inspected and audited in every location type and situation, in general.
Every distinct location type presents a very specific set of relevant and probable hazards. To effectively assist the SO in identifying them, a specific checklist has been studied, defined, and developed. The checklist is curated according to the scope and specifications of the sites that it serves, updating its internal structure of groups and sub-groups. Despite the differences between locations and the safety parameters that profile them, there can be checklist overlap of common issues and shared hazards. For example, hazards associated with hot works (welding, disc cutting etc.) will be covered only in the construction-site checklist, whereas subjects relevant to fire safety will be the same in all four checklists (i.e., the presence of minimum required units for fire extinguishers).
Table 3 shows the number of groups and sub-groups in the checklists of the four location types.
Office spaces: This location type covers all office spaces, regardless of their size and complexity. The respective checklist focuses on three main groups: (i) issues about the site itself, (ii) issues relevant to the workstations, and (iii) other special matters. The first category includes sub-categories such as emergency exits, fire safety, electro-mechanical installations, lighting, etc. The second category includes ergonomic hazards for workstations, while working on computers, cleaning, storing of materials, drivers etc. The last category addresses the employer’s compliance with very specific aspects, such as documentation, training, etc. While large office-buildings may feature more hazards than small ones, in terms of actual cases and similar issues, their main groups and types remain the same.
Warehouses: Warehouses are a distinctly different site as they have some unique hazards related to manual work, the operation of lifting equipment, and warehousing structures. The main groups are the same as in the office’s checklist, while the sub-groups differ and include warehouse-specific checklist items such as the required certification of lifting equipment.
Retail stores: There are two important factors that make the retail checklist quite different from the rest of the location types. Retail stores constitute the only type that needs to address and manage hazards associated with large numbers of visitors and the general public. In addition, retail stores are often part of larger shopping malls and department stores; thus, hazards linked to the activities of neighboring stores also need to be accounted for. Main groups are once more the same as other location types, with different checklist items inside them.
Construction sites: The construction-site checklist is the most extensive of the all the location types. The comparatively large number of checklist items (166 vs. <20) is due to the extensive list of activities and associated hazards that the checklist needs to cover. In addition, all the activities carried out on a construction site, such as working at height, hot works, use of heavy machinery and equipment, etc., introduce significantly more legal obligations and accompanying paperwork.
3.2. Observation Attributes
The information included in each report of our dataset is the same across all checklists and location types. Using a mobile application, SOs submit their reports by entering their input in a form that contains the following fields:
Audit/inspection details (company, location, duration, type of checklist previously used)
Safety officer carrying out the audit/inspection
Issue group and sub-group
The SO selects the location type of a site during the first audit. From that point on, the contribution is mapped upon the issues of the specific checklist. When reporting an issue, the SO can provide:
A short description of the issue (i.e., what is the deviation)
A short description of the proposed corrective action
The priority of the issue (from a scale of low, medium, and high)
Photographs displaying the issue (up to four stills). An example is shown in
Figure 1.
In our multimodal analysis, we only considered issues accompanied by photographs. For each issue, we selected one of the accompanying photographs and created pairs of images and textual descriptions.
Table 4 summarizes all the attributes present in an observation, along with example values.
3.3. Observation Priority
In the domain of risk management and health and safety, it is important to define the concepts of “Hazard”, “Risk”, “Severity” and “Probability”.
Hazard: Source with a potential to cause injury and ill health; the potential to cause harm. Harm includes ill health and injury; damage to property, plant, products or the environment; production losses or increased liabilities.
Risk (): the likelihood that a specified undesired event will occur due to the realization of a hazard by, or during, work activities or by the products and services created by work activities.
Severity (): the amount of damage or harm a hazard could create.
Probability (): the likelihood of the hazard occurring.
The above concepts are associated in Equation (
1):
These terms are used mainly in risk assessment studies. The reason we decided to use the term priority instead of the above risk rating was to simplify the process of resolving the raised issues. For example, in an office, most of the issues would be low to medium risk, whereas in construction works, the majority would be medium to high. This bias offers little information on which issues the site owners should tackle first.
In
Figure 2, we can see the distribution of observation priorities in different locations. We can see that the distribution is skewed towards high-priority issues in construction sites, due to the dangerous and heavily regulated work. Specifically, construction sites are constantly changing; thus, new hazards are constantly created. Stores also have a large proportion of high priority issues, because retail shops also host the general public; thus, even a hazard which may be considered negligible in an office environment may become significant in a retail shop. Finally, offices are the least changing environments, both in terms of infrastructure and people, and are generally considered more safe working environments; thus, they have the least amount of high-priority issues.
3.4. SO Expertise
The semantics of the dataset’s priority rating incorporates the concept of risk by evaluating both severity and probability within the context of the specific site and while considering all its new and pending issues. Investing in the SOs expertise and skill to dynamically assess and calibrate the baseline of this rating, the dataset features a certain degree of subjectivity. To filter this bias and measure the effectiveness of the human in the loop, a three-point scale ranking (inexperienced, experienced, expert) of SO’s expertise was produced by Ergonomia based on objective parameters, such as years of experience, frequency of inspections, average length of issues descriptions and diversity of audited sites.
Figure 3 shows the number of observations of SOs per their experience level. Each point in the scatter plot corresponds to one SO. We can see that, on average, more experienced users have reported more observations, but observation volume is not the sole attribute for assessing SO experience. In
Figure 4, we see the average priority ratings across observations reported by each SO. The SOs are split by their expertise level. We can see that experienced SOs and expert SOs exhibit a smaller deviation across their ratings. Furthermore, we can see that experienced SOs and expert SOs generally concern themselves with higher priority issues, while inexperienced SOs report lower priority issues on average.
3.5. Observation Categorization
For further analysis, we clustered the checklist groups into two high-level ontologies, i.e., “Category” and “Issue Source”.
Observation Category: This ontology aims to split observations into semantic categories that describe the domain of an issue. For example, we clustered together the checklist groups for “Fire extinguishers” and “Transportation, Use and Storage of Gas Cylinders” into the high-level category “Fire safety”. Similarly, we grouped together checklist groups about “Electrical Panel Grounding” and “Worn out Cables” into a high-level category named “Electrical Safety”. This allows for the organization of observation in a high-level ontology, which can be used for assigning the reviewing of observations to people with the correct expertise.
Table 5 summarizes the high-level categories with examples of checklist groups that belong to each category. In
Figure 5, we can see a histogram of the distribution of the different categories split by the observation priorities. We see that a large number of observations fall under the “General Issues” category. This denotes the need for the continuous curating of an expanding OSH ontology. The nature and dynamics of hazards are evolving into multifaceted and complex problems or even failures, especially when they are left untreated, underestimated and not properly addressed. Additionally, we see that, as would be expected, the “Work Injuries” category has a shifted distribution towards high-priority issues.
Issue Source: This high-level grouping of checklist groups is aimed to identify the possible cause of a hazard. For example, the “Activities” issue source groups hazards that can be caused by human activity (e.g., employees not wearing safety gear). The “Spaces” issue source is a collection of groups that describe hazards inherent to the work spaces (e.g., cleanliness or missing fire extinguishers). This ontology can help to provide high-level feedback to customers. For example, if a work site has repeated “Activities”-related observations, the recommendation is to focus on preventive measures and safety training, whereas if it has repeated “Equipment”-related observations, resources should be invested in upgrading the equipment used by workers.
Table 6 summarizes the issue source ontology. In
Figure 6, we can see the distributions of the different issue sources, split by the observation priorities.
4. Common Space Fusion through Similarity Learning
4.1. High-Level Overview
As we described in
Section 3, the Safety4All observations contain a textual description of the issue, paired with pictures taken from the observation site. Both of these information sources contain valuable information about the observation and the scene it refers to; therefore, we used a multimodal approach for building our classification pipeline. We opted to employ a fusion approach, where features extracted from the text and visual modality are projected in a
shared space. The benefit of this approach is that features extracted from different modalities live in a shared latent space
, where it is easy to compare features extracted from different modalities and extract multimodal embeddings. For this, we employed a multitask learning criterion that consists of a contrastive and a task loss. The task loss was used to learn the task at hand (cross-entropy loss for classification, minimum squared error for regression, etc.). The contrastive loss aims to bring the visual and text embeddings that correspond to the same observation close to each other in the multimodal space.
4.2. Notation
Let us define a dataset of observations
consisting of
N image-text-label tuples
. The input to the model is a batch
of
elements, containing
M randomly selected samples from the dataset
, so that:
where
the uniform distribution of (discrete) indices
and
defines that the cardinality of
B is equal to the batch size
, indicating that the sampling of
elements in the batch
B is performed
without replacement.
The cross-entropy loss, used for classification tasks, is defined as
where
C is the number of classes,
the batch size, and
the one-hot ground truth label, which is 1 if sample
i is classified as class
j and 0 otherwise:
The logits are the predicted probability that sample i belongs to class j.
A feedforward (or projection) layer is denoted as a function
:
where
is an input vector and
the set of trainable parameters that correspond to
. The output of the feedforward layer is
,
and
.
The cosine distance operation between two vectors
is defined as
where ‖·‖ defines the L2 norm of a vector and
defines the dot-product operation between
and
.
The concatenation operation, ⊕, is defined for two vectors
and
by merging the elements
of both vectors, as in Equation (
7):
4.3. Detailed Method Description
In
Figure 7, we can see an overview of the proposed multimodal fusion pipeline. Given an input batch containing the text and visual modality features, we extracted the text and visual representations using two unimodal encoders. For training, we used a joint contrastive loss and classification loss. The contrastive loss brings the corresponding text and image features in the batch close in the multimodal space, while the classification loss is used to solve the task. The model was jointly trained using both losses through multitask learning.
In detail, given an input batch
B, we first passed each image
in the batch through the visual encoder
and each textual description
through the text encoder
, to obtain intermediate representations
and
:
We created the shared projection space using a contrastive loss
. Our contrastive loss is inspired by the one used in CLIP [
79]. To obtain
, we first created the cross-modal cosine distance matrix
A
of all the encoded pairs
in the batch, where
. Each row
is a vector of the pairwise cosine similarities of the visual features
with every textual feature vector in the batch
. Similarly, each column
is a vector of pairwise cosine similarities of the textual features
with every visual feature vector in the batch
. For the first part of the contrastive loss, we constructed the n-pair loss [
64,
65] over the columns of
A, using the identity matrix
as labels, as in Equation (
10)
Similarly, the second part of the contrastive loss is taken over the rows of
A:
The contrastive loss
is given by Equation (
12):
The goal of the contrastive loss is that the diagonal elements of A take values close to 1, while all other elements take values close to 0. This creates a shared multimodal space , where image representations and text representations that correspond to the same sample are close, while text and image representations that correspond to different samples are further away from each other.
For the task loss, we created the multimodal representation in Equation (
13) for each sample
k in the batch:
where ⨁ denotes the vector concatenation. The representation
m is based on both the shared space representations
and
and the individual modality representations
and
, to capture both unimodal and bimodal interactions. The vector
m was then fed through a classification network, described in Equation (
14)
where
denotes a feedforward layer and
a is the GELU activation [
86]. The classification network produces the logits
used in the task loss, in conjunction with the ground truth labels
l:
The network was trained end to end with the joint task and contrastive losses:
5. Pretraining a Transformer-Based Language Model for Greek
Large pretrained language models (PLMs) based on the transformer architecture [
40] have been repeatedly shown to outperform other approaches in a variety of tasks [
36]. These models are trained on huge corpora using self-supervised learning, i.e., the models are used to directly learn the structure of the language in the corpus through some form of language modelling rather than being trained to solve a supervised task. Regarding the Greek language, publicly available resources are more limited than in English. Efforts have been made in the literature to develop a Greek version of BERT [
19], which is a widely used and useful resource. One problem is that, due to the limited number of public resources, Greek BERT training is by and large based on the OSCAR dataset [
87], which is a filtered and deduplicated, but still noisy, version of the Common Crawl corpus (
https://commoncrawl.org/, accessed on 31 May 2022). For this reason, we aim to construct a better pretraining corpus for training large Greek PLMs.
Our model is based on the ELECTRA architecture [
18]. Specifically, we trained a similarly sized variant, with 12 layers and 768 hidden size (
electra-base). ELECTRA is trained as a discriminator that tries to detect token replacements produced by a small MLM generator. We base the training corpus on the C4 dataset [
88] instead of OSCAR. C4 is also based on the Common Crawl corpus, but includes additional filtering and cleaning steps:
The filtering of lines that do not end in punctuation, contain fewer than 3 words and/or contain obscene words.
The removal of all pages that contain fewer than 5 sentences.
The removal of Javascript and pages that contain code or placeholder tokens (e.g., “lorem ipsum”).
The deduplication of any three consecutive sentence spans that appear multiple times.
In addition, we implemented a set of more aggressive cleaning steps to create the final version of the corpus, which we name GfC4 (Greek filtered C4):
The removal of lines that contain URLs.
The removal of lines that do not contain Greek characters.
The removal of lines that contain UTF-8 characters that do not belong in one of the following sets: (a) Greek, (b) Latin, (c) numeric, (d) punctuation, (e) accents.
The removal of Ancient or purist Greek text, by removing lines that contain diacritics that are only used in Ancient or purist Greek (polytonic).
We observed that, in many sentences in the corpus, some words were merged due to the crawling of the web pages (e.g., “somewordsaremerged”). We believe this should not be a large issue, since words are going to be split into subwords using a wordpiece algorithm [
89]. Nevertheless, in order to produce the cleanest possible version of the corpus, we found words that were longer than 20 characters and split them using a bigram language model.
To create the complete training corpus, we merged the GfC4 corpus with the Greek version of Wikipedia and the Hellenic National Corpus (HNC) [
90]. We also removed accents and converted all words to lower-case. The model was trained using AdamW optimizer [
91] with a learning rate of
and warmup of 8000 training steps, and batch size of 16. Due to limitations in computational resources, we used a 20 GB subset of the training corpus and trained the model on four NVIDIA RTX 3090 GPUs for 18 days.
6. Experimental Settings
6.1. Text Encoders
We used two large pretrained transformer-based text encoders in our experiments:
- Greek BERT
Greek BERT (
https://huggingface.co/nlpaueb/bert-base-greek-uncased-v1, accessed on May 31 2022) was proposed in [
19]. The Greek BERT architecture is based on the 12-layer, 768 hidden size version of BERT [
39], i.e.,
bert-base-uncased. For model training, the authors used 29GB of text from the Greek versions of Wikipedia, European Parliament Proceedings Parallel Corpus (Europarl) [
92] and OSCAR, which is a filtered, deduplicated version of Common Crawl. Since OSCAR contributed the vast majority of the training data and is based on the very noisy Common Crawl corpus, we find it useful to review the preprocessing steps. The first step of OSCAR preprocessing involves the splitting of pages across languages using a fastText linear classifier [
93,
94]. The second step of preprocessing involves rejecting lines shorter than 100 UTF-8 encoded characters and deduplicating the text lines. Additionally, the authors of [
19] removed accents and diacritics and converted all lines to lower-case. The model was trained using the masked language model (MLM) and next sentence prediction (NSP) losses with learning rate of
. Training took 5 days on a Google Cloud TPU v3-8.
- GR-Electra
6.2. Visual Encoders
To obtain the image representations, we experimented with one transformer-based model and one CNN-based architecture.
- ViT
The visual transformer (ViT) [
53] is a transformer encoder that is adapted for image classification. Since transformers are geared primarily towards sequence processing, the authors proposed to convert the input images into sequences by splitting them into a sequence patches of
pixels. The authors note that the use of transformers, a model with fewer “inductive biases” than CNNs (e.g., no assumptions about locality), yields models that scale better with larger pretraining datasets. We used the
vit-base variant (12 layers, 768 hidden size) (
https://huggingface.co/google/vit-base-patch16-224, accessed on 31 May 2022). ViT was pretrained in a supervised fashion, for image classification on Imagenet-21k dataset [
95], which consists of 14M images with labels across 21,841 classes. The model was trained on Google Cloud TPUv3 hardware for 90 epochs, on 3-channel images of
pixels, using 4096 batch size, Adam optimizer and linear learning-rate decay. Training took 230 TPUv3 core days (i.e., the number of TPUv3 cores used for training times the training time in days).
- ResNet
The residual network (ResNet) architecture was proposed in [
49]. ResNets comprise of multiple layers of
convolutions, with residual (i.e., shortcut) connections jumping every 2 layers. The authors demonstrated that residual connections facilitate the training of very deep networks, combating the degradation problem of deep architectures. We used the ResNet18 variant (
https://pytorch.org/vision/stable/generated/torchvision.models.resnet18.html, accessed on 31 May 2022), which is a 18-layer convolutional architecture. ResNet18 was pretrained for supervised image classification on Imagenet-1k [
47] dataset, which is a subset of Imagenet-21k that contains
M images labeled across 1000 classes. ResNet18 was pretrained on 3-channel
patches, using random crop, image flip and scale data augmentations using stochastic gradient descent with batch size 256 for a maximum of
. Learning rate started at
and was divided by 10 every time an error plateau was reached. Batch normalization [
96] was employed after each convolutional layer. Training needed
floating point operations (FLOPs).
6.3. Fusion Methods
We compared the following two fusion methods:
- Concatenation (cat):
we concatenated the outputs of the visual and text encoders and fed the resulting feature vector directly into the classifier.
- Contrastive Loss Shared Space (CLSS):
we followed the procedure described in
Section 4.3 and fine tuned the model using the joint loss.
6.4. Dataset Splits and Preprocessing
To create the dataset splits, we removed all incomplete observations (e.g., missing photographs or descriptions) and performed a stratified split of the samples according to the observation priority. The distribution of the samples across splits was in the training set, in the validation set and in the test set. All experiments were run on this split. For text preprocessing of the issue descriptions, we removed all accents, converted the text to lower-case and used Wordpiece for tokenization (according to BERT or Electra pipelines). For image preprocessing, we performed a random crop that yields images of pixels, and normalized the resulting images using the Imagenet default mean and standard deviation. The random crop was used for data augmentation, as the model receives a different patch of the image every time it processes a sample. During inference, the random cropping operation was swapped with an image resizing, followed by center cropping, using the assumption that most salient information will lie close to the center of a photograph.
6.5. Reproducibility Details
In this section we describe the hyperparameters and experimental settings. This configuration was used across all experiments, unless explicitly stated otherwise. We used dropout probability
. We trained all models using Adam optimizer [
97] with learning rate
. For classification tasks, we used a randomly initialized classification head, as described in Equation (
14), on top of the fused representations. The models were fine tuned on the Safety4All training set for 10 epochs. We employed early stopping with patience 3 on the validation loss, i.e., we stopped the training if the validation loss did not improve for three consecutive epochs. We kept checkpoints every epoch, and used the checkpoint that corresponded to the epoch with the smallest validation loss. Batch size was set to 16, while we accumulated gradients over 2 training steps for an effective batch size of 32. Models were implemented using PyTorch [
98] and PyTorch Lightning (
https://www.pytorchlightning.ai/, accessed on 31 May 2022) and we used a single NVIDIA RTX 2080 Ti for training. All results presented are averaged over 3 runs.
7. Experiments and Results
7.1. Task 1: Priority Classification
The first challenge we want to address is the classification of observations across different levels of priority. This is a 3-class classification problem with issue severities ranging from high to medium to low. The “priority” represents a general assessment score for the end users, which can encode multiple aspects of a safety issue. The criteria for marking an observation priority as high include the danger level of the observation, the probability of an accident occurring, possible legal or economic ramifications to the business or this safety issue persisting for large periods of time, across different safety inspections.
Our goal was to use multimodal cues for automatic priority assessment of observations.
Table 7 summarizes the priority classification results on the Safety4All test set. We evaluated the unimodal and bimodal classification accuracy of all combinations for the fusion methods, the visual and text encoders described in
Section 6, as well as the score for the random baseline. The random baseline was calculated as the majority class score, i.e., the accuracy score that we would receive, if we had a system that always predicted the majority class. We can see the scores for the unimodal models in the first four rows and the scores for the multimodal models in the eight rows that follow. The random baseline score is shown in the last row of
Table 7. First, we observe that the majority class score is
, which indicates some class imbalance in the 3-class classification problem. All models surpass the random baseline by a large margin (≈10%). Second, for the unimodal configurations, we observe that the text and visual modalities contain balanced information for the task of priority classification. The weakest unimodal models are Greek BERT and Resnet18, while the strongest are GR-Electra and ViT. Third, we see that all multimodal configurations surpass the unimodal model performance, regardless of the fusion approach. This indicates that both the text and visual modalities contain valuable information regarding the observation’s priority. Regarding the fusion method, we observe that the
CLSS approach outperforms the naive concatenation consistently, resulting in a 0.5–1.5% absolute improvement in the accuracy scores. One interesting observation is that, while the text-only GR-Electra model surpasses the Greek BERT by
, the best results are achieved using the combination of Greek BERT, ViT and CLSS. The “
unimodal” column indicates the improvement in the multimodal configuration over the best encoder involved in that configuration. For example, for a “Resnet18+GR-Electra” multimodal configuration we report the improvement over the unimodal “GR-Electra” model, while for a “ViT+Greek-BERT” multimodal configuration, we report the improvement over “Greek-BERT”. Possible negative values in this column indicate that the unimodal encoder outperforms that multimodal configuration.
In
Table 8, we present an ablation study for priority classification in different locations. For this experiment, we fine tuned the models on the training set and split the test-set observations in four location-specific test sets, namely, “Construction”, “Office”, “Store” and “Warehouse”. We evaluated the model on each of the location-specific test sets. We used ViT as the visual encoder, GR-Electra or Greek BERT as the text encoder and, for multimodal configurations, we used CLSS for fusion. We report the unimodal model accuracy, the multimodal model accuracy, as well as the random baseline. The first observation is that the “Construction”, “Office” and “Warehouse” sets are more imbalanced than the overall test set, with the random baseline accuracy being
,
and
, respectively. The “Construction” set statistics differ though, as the most frequent priority class is “high”, while in the other sets the most frequent class is “medium” priority. The reason for this is that construction sites are more dangerous places than office spaces, warehouses or stores, and, therefore, construction workers face more serious and frequent dangers during their jobs. We can see that, again, all models surpass the random baseline, except for the text-only Greek BERT on the “Construction” set. Furthermore, we observe that multimodal architectures surpass their unimodal counterparts by a margin of 3–4%. The best overall performance is achieved by the combination of Greek BERT, ViT with CLSS fusion.
7.2. Task 2: Observation Assessment
Each observation is accompanied by metadata for the SO who created it and their experience level. In this section, we investigate the development of a system that can assign an effective SO experience score to incoming observations. Specifically, the system is tasked by being given an observation to guess the experience level of the SO who registered it. This system could be applied to the continuous training of SOs, where incoming observations can be quickly assessed with respect to their effective experience score. The training could be based on case studies with “good” and “bad” examples of existing observations, selected using the outputs of this system (it should be stressed for ethical concerns that the goal of this system is to perform observation assessment and not SO assessment. The desired application is to be used in the creation of case studies for SO training.). The underlying assumption is that more experienced SOs will register higher quality observations about more serious safety or compliance issues. The task was formulated as a 3-class classification problem for four different experience levels.
Table 9 summarizes the results for the “effective experience level” classification task. We evaluate all model configurations. We observe that, for this task, the visual and text modalities contain complementary information, as the improvement between the best unimodal model (Greek BERT) and the best multimodal model (Greek BERT, Resnet18, CLSS) is larger than
in terms of accuracy. Moreover, we observe that the fusion approach is important. Most models that use simple concatenation for fusion show marginal, if any, improvement over their unimodal counterparts. In contrast, when we used CLSS fusion, we obtain a strong and consistent improvement for all configurations.
7.3. Task 3: Observation Categorization
The third task we include involved the categorization of observations. This is split into two subtasks, i.e., “Issue Source” and “Categories”.The possible application of this task is the automatic organization of past observations into meaningful classes, for analysis by specialized experts and the devising of meaningful feedback for the involved businesses. Regarding the “Issue source” subtask, the goal of this task is to predict the actor or situation that caused a particular safety issue. For this task, observations were labeled under the “Activities”, “Spaces”, “Equipment”, “Regulations” and “Other” categories. For example, if an observation is classified under the “Activities” label, the cause of the issue is the actions of people during the observation time (e.g., employees not wearing protective gear); whereas, if it is classified under the “Spaces” category, the cause of the issue is related to the space where it was observed (e.g., missing fire extinguishers). For the “Category” subtask, we employed a semantic labeling of the observations under high-level categories, e.g., “Electrical safety”, “Fire safety”, etc. The goal was to organize observations into semantic clusters to make the post-processing easier. For example, one observation may concern compliance to safety regulations and should be reviewed by an SO that specializes in the law and regulations of the country or city, while another observation may regard electrical safety and should be processed by an SO with an electrical engineering background.
In
Table 10, we can see the results for the issue categorization tasks. We can see that, for these tasks, in contrast to the observation assessment and priority classification, the dominant modality is the textual description of the issue, while the visual modality does not convey much information. This is evident, as most of the multimodal configurations fail to surpass their unimodal counterparts. Furthermore, we can observe that the only configurations that manage to gain a positive “
unimodal” involve the use of the CLSS fusion approach, while the feature concatenation approach fails to extract good multimodal representations.
8. Conclusions and Future Work
Training AI models capable of providing accurate and timely evaluations for the priority of emerging issues can offer significant value in the health and safety industry. Focusing on OSH domain knowledge, the presented research described a pipeline of tasks that models, refines and analyzes unstructured text from safety reports. A multimodal approach was explained and tested for producing valid risk ratings for reports and effectively serving two different classification themes for organising them. Such models can drive the appropriate tools for the decision support and improved performance of inexperienced safety engineers, while also streamlining the assessment process for experienced ones. Offering insights and recommendations for the classification of safety reports can directly impact inspection performance in any workplace or shop-floor, where hundreds or thousand of issues require immediate attention and handling.
Allowing non-experts such as clients, employees or the general public to contribute tp a feedback loop that validates and enriches the above knowledge is a major step towards building confidence and certainty for the underlying models. The discussed models will support the applications and services of the Safety4ALL platform, delivering a collective awareness platform for OSH reports. Investing in croudsourcing and mobile technologies, the platform will drive the collection, review, enrichment and classification of reports, ensuring the required volume of data that can consistently update and retrain the models. Statistics from each category will support tasks that plan appropriate training for employees and users of the site, record the performance of different types of equipment and identify major sources of hazards in each site.
The scope of health and safety shares common goals, tools and applications with the wider domain of risk management. This paper provides evidence that collective knowledge from safety experts can be easily captured and modeled to serve an SO-in-the-loop paradigm, a paradigm where safety reports can be formalized and processed to build the datasets required for multimodal analysis and produce actionable results. This involvement loop of experts for refined feedback and accurate classification can be easily imported and mapped on every other industry where risk management is a key consideration, such as finance and healthcare. Every industry where risk assessment is traditionally carried out manually will find significant value in receiving AI-assisted decisions for the balanced and correct classification of critical issues and reports.
Regarding our approach, we propose a sample efficient shared-space fusion technique based on contrastive learning. Contrary to prior work, we do not rely on pretraining the fusion pipeline on large multimodal datasets; rather, we use the contrastive objective as an online auxiliary loss during model training. This is shown to outperform vanilla concatenation across experiments, tasks and for different encoders. This indicates that the proposed joint loss helps to extract more informative common representations of the two modalities involved. We evaluated our system on three proposed tasks, i.e., “priority estimation”, “observation assessment” and “observation categorization”. For the first two, both visual and text modalities have balanced information, and the use of multimodality yields significant improvements in terms of absolute model performance (accuracy), namely, for priority classification and for observation assessment. For the “observation categorization” task, we see that the text modality contains most of the information needed to solve the task, and the use of multimodality either hurts or marginally improves model performance.
In the future, we want to explore more intricate fusion approaches by collecting a larger dataset that would allow for model pretraining based on the contrastive objective [
78]. Furthermore, we want to apply architectural improvements [
13] for cross-modal fusion, which would enable both efficient utilization of information present across modalities and model interpretability. Another line of work can explore the issue of the dominant modalities, especially for the task of observation categorization, and propose techniques from the multi-modal learning literature to alleviate this issue [
14]. Unsupervised domain adaptation of existing models to new locations and site conditions can also be explored [
99]. Finally, in this work we have not explored the “corrective actions” that are proposed by the SOs for each observation. In the future, we want to explore sequence-to-sequence models that could generate proposed corrective actions, given an observation description and, optionally, an accompanying image. For this, ideas and methods can be borrowed from the image-captioning literature, e.g., [
9].
9. Ethical Statement
Potential concerns that the need for safety engineers will decrease as their expertise is substituted by a constantly more capable AI application, although understandable, are not well-founded. No matter how good an AI might be in assessing a risk, a safety engineer will always be needed to identify the risks arising from human behaviors and activities, risks that an AI may not be able to detect, at least in the foreseeable future. In addition, such an AI application protects and enhances, rather than threatens, the work of the safety engineer, as it exponentially increases their monitoring ability of a given site. In most countries, there is a strict legal framework where the safety engineer is liable for any accidents and incidents that may occur on a site under their responsibility. An application assisting in preventing such accidents and incidents, not only protects those on site, but the SOs themselves.
Author Contributions
Original conception and funding acquisition was performed by V.K., P.P. and G.B. Multi-modal elements were introduced by G.P. Related software and experimental design was performed by G.P. Experimental execution and validation was performed by G.P. and E.G. Data acquisition by G.B. Data curation and analysis by G.P. and P.P., with the expert input of G.B. Writing—review and editing by G.P., P.P., G.B., E.G. and V.K. Scientific project coordination was lead by V.K. All authors have read and agreed to the published version of the manuscript.
Funding
This research was co-financed by the European Regional Development Fund of the European Union and Greek national funds through the Operational Program Competitiveness, Entrepreneurship and Innovation, under the call RESEARCH–CREATE–INNOVATE (project safety4all with code: T2EDK04248).
Informed Consent Statement
Not applicable.
Data Availability Statement
Due to the sensitivity of the analyzed industrial data, they will be made available upon contact with the authors. A small subset of samples will be provided to the reviewers. Features extracted from the last layers of the unimodal encoders (Greek-BERT, ViT, GR-Electra, ResNet18) will be made publicly available.
Conflicts of Interest
The funders had no role in the design of the study; in the collection, analyses, or interpretation of data; in the writing of the manuscript, or in the decision to publish the results.
Abbreviations
The following abbreviations are used in this manuscript:
| BERT | Bidirectional Encoder Representations from Transformers |
| C4 | Colossal Clean Crawled Corpus |
| CNN | Convolutional Neural Network |
| ELECTRA | Efficiently Learning an Encoder that Classifies Token Replacements Accurately |
| GPU | Graphics Processing Unit |
| HNC | Hellenic National Corpus |
| LM | Language Model |
| MLM | Masked Language Modeling |
| OSCAR | Open Super-large Crawled Aggregated coRpus |
| PLM | Pretrained Language Model |
| ResNet | Residual Network |
| SO | Safety Officer |
| TPU | Tensor Processing Unit |
| ViT | Visual Transformer |
References
- Lin, K.Y.; Tsai, M.H.; Gatti, U.C.; Je-Chian Lin, J.; Lee, C.H.; Kang, S.C. A user-centered information and communication technology (ICT) tool to improve safety inspections. Autom. Constr. 2014, 48, 53–63. [Google Scholar] [CrossRef]
- Tetzlaff, E.; Eger, T.; Pegoraro, A.; Dorman, S.; Pakalnis, V. Analysis of Recommendations from Mining Incident Investigative Reports: A 50-Year Review. Safety 2020, 6, 3. [Google Scholar] [CrossRef] [Green Version]
- Li, J.; Wang, J.; Xu, N.; Hu, Y.; Cui, C. Importance Degree Research of Safety Risk Management Processes of Urban Rail Transit Based on Text Mining Method. Information 2018, 9, 26. [Google Scholar] [CrossRef] [Green Version]
- Chokor, A.; Naganathan, H.; Chong, W.K.; Asmar, M.E. Analyzing Arizona OSHA Injury Reports Using Unsupervised Machine Learning. Procedia Eng. 2016, 145, 1588–1593. [Google Scholar] [CrossRef] [Green Version]
- Suh, Y. Sectoral patterns of accident process for occupational safety using narrative texts of OSHA database. Saf. Sci. 2021, 142, 105363. [Google Scholar] [CrossRef]
- Robinson, S.D. Multi-Label Classification of Contributing Causal Factors in Self-Reported Safety Narratives. Safety 2018, 4, 30. [Google Scholar] [CrossRef] [Green Version]
- Poh, C.Q.; Ubeynarayana, C.U.; Goh, Y.M. Safety leading indicators for construction sites: A machine learning approach. Autom. Constr. 2018, 93, 375–386. [Google Scholar] [CrossRef]
- Yedla, A.; Kakhki, F.D.; Jannesari, A. Predictive Modeling for Occupational Safety Outcomes and Days Away from Work Analysis in Mining Operations. Int. J. Environ. Res. Public Health 2020, 17, 7054. [Google Scholar] [CrossRef] [PubMed]
- You, Q.; Jin, H.; Wang, Z.; Fang, C.; Luo, J. Image captioning with semantic attention. arXiv 2016, arXiv:1603.03925. [Google Scholar]
- Agrawal, A.; Lu, J.; Antol, S.; Mitchell, M.; Zitnick, C.L.; Batra, D.; Parikh, D. Vqa: Visual question answering. arXiv 2015, arXiv:1505.00468. [Google Scholar] [CrossRef]
- Anderson, P.; He, X.; Buehler, C.; Teney, D.; Johnson, M.; Gould, S.; Zhang, L. Bottom-up and top-down attention for image captioning and visual question answering. arXiv 2018, arXiv:1707.07998. [Google Scholar]
- Koromilas, P.; Giannakopoulos, T. Deep Multimodal Emotion Recognition on Human Speech: A Review. Appl. Sci. 2021, 11, 7962. [Google Scholar] [CrossRef]
- Paraskevopoulos, G.; Georgiou, E.; Potamianos, A. Mmlatch: Bottom-Up Top-Down Fusion For Multimodal Sentiment Analysis. In Proceedings of the ICASSP 2022—2022 IEEE International Conference on Acoustics, Speech and Signal Processing (ICASSP), Singapore, 22–27 May 2022; pp. 4573–4577. [Google Scholar] [CrossRef]
- Georgiou, E.; Paraskevopoulos, G.; Potamianos, A. M3: MultiModal Masking applied to sentiment analysis. In Proceedings of the Interspeech 2021, Brno, Czech Republic, 30 August–3 September 2021; pp. 2876–2880. [Google Scholar]
- Caglayan, O.; Madhyastha, P.; Specia, L.; Barrault, L. Probing the Need for Visual Context in Multimodal Machine Translation. In Proceedings of the NAACL; Association for Computational Linguistics: Minneapolis, MN, USA, 2019. [Google Scholar]
- Paraskevopoulos, G.; Parthasarathy, S.; Khare, A.; Sundaram, S. Multimodal and Multiresolution Speech Recognition with Transformers. In Proceedings of the 58th ACL, Online, 5–10 July 2020. [Google Scholar]
- Srinivasan, T.; Sanabria, R.; Metze, F.; Elliott, D. Multimodal Speech Recognition with Unstructured Audio Masking. In Proceedings of the 1st Workshop on NLPBT, Online, 20 November 2020. [Google Scholar]
- Clark, K.; Luong, M.T.; Le, Q.V.; Manning, C.D. ELECTRA: Pre-training Text Encoders as Discriminators Rather Than Generators. In Proceedings of the ICLR, Addis Ababa, Ethiopia, 26–30 April 2020. [Google Scholar]
- Koutsikakis, J.; Chalkidis, I.; Malakasiotis, P.; Androutsopoulos, I. Greek-bert: The greeks visiting sesame street. In Proceedings of the 11th Hellenic Conference on Artificial Intelligence, Athens, Greece, 2–4 September 2020; pp. 110–117. [Google Scholar]
- Cheng, M.Y.; Kusoemo, D.; Gosno, R.A. Text mining-based construction site accident classification using hybrid supervised machine learning. Autom. Constr. 2020, 118, 103265. [Google Scholar] [CrossRef]
- Fang, W.; Luo, H.; Xu, S.; Love, P.E.; Lu, Z.; Ye, C. Automated text classification of near-misses from safety reports: An improved deep learning approach. Adv. Eng. Inform. 2020, 44, 101060. [Google Scholar] [CrossRef]
- Tixier, A.J.P.; Hallowell, M.R.; Rajagopalan, B.; Bowman, D. Automated content analysis for construction safety: A natural language processing system to extract precursors and outcomes from unstructured injury reports. Autom. Constr. 2016, 62, 45–56. [Google Scholar] [CrossRef] [Green Version]
- Zhang, J.; Zi, L.; Hou, Y.; Deng, D.; Jiang, W.; Wang, M. A C-BiLSTM Approach to Classify Construction Accident Reports. Appl. Sci. 2020, 10, 5754. [Google Scholar] [CrossRef]
- Goh, Y.M.; Ubeynarayana, C. Construction accident narrative classification: An evaluation of text mining techniques. Accid. Anal. Prev. 2017, 108, 122–130. [Google Scholar] [CrossRef]
- XU, N.; MA, L.; Liu, Q.; WANG, L.; Deng, Y. An improved text mining approach to extract safety risk factors from construction accident reports. Saf. Sci. 2021, 138, 105216. [Google Scholar] [CrossRef]
- Chi, N.W.; Lin, K.Y.; El-Gohary, N.; Hsieh, S.H. Evaluating the strength of text classification categories for supporting construction field inspection. Autom. Constr. 2016, 64, 78–88. [Google Scholar] [CrossRef]
- Batres, R.; Fujihara, S.; Shimada, Y.; Fuchino, T. The use of ontologies for enhancing the use of accident information. Process Saf. Environ. Prot. 2014, 92, 119–130. [Google Scholar] [CrossRef]
- Chi, N.W.; Lin, K.Y.; Hsieh, S.H. Using ontology-based text classification to assist Job Hazard Analysis. Adv. Eng. Inform. 2014, 28, 381–394. [Google Scholar] [CrossRef]
- Sanchez-Pi, N.; Martí, L.; Bicharra Garcia, A.C. Improving ontology-based text classification: An occupational health and security application. J. Appl. Log. 2016, 17, 48–58. [Google Scholar] [CrossRef]
- Hughes, P.; Robinson, R.; Figueres-Esteban, M.; van Gulijk, C. Extracting safety information from multi-lingual accident reports using an ontology-based approach. Saf. Sci. 2019, 118, 288–297. [Google Scholar] [CrossRef]
- Hughes, P.; Shipp, D.; Figueres-Esteban, M.; van Gulijk, C. From free-text to structured safety management: Introduction of a semi-automated classification method of railway hazard reports to elements on a bow-tie diagram. Saf. Sci. 2018, 110, 11–19. [Google Scholar] [CrossRef] [Green Version]
- Wang, Z.; Zhang, B.; Gao, D. Text Mining of Hazard and Operability Analysis Reports Based on Active Learning. Processes 2021, 9, 1178. [Google Scholar] [CrossRef]
- Rose, R.L.; Puranik, T.G.; Mavris, D.N. Natural Language Processing Based Method for Clustering and Analysis of Aviation Safety Narratives. Aerospace 2020, 7, 143. [Google Scholar] [CrossRef]
- Karanikas, N.; Nederend, J. The controllability classification of safety events and its application to aviation investigation reports. Saf. Sci. 2018, 108, 89–103. [Google Scholar] [CrossRef] [Green Version]
- Tanguy, L.; Tulechki, N.; Urieli, A.; Hermann, E.; Raynal, C. Natural language processing for aviation safety reports: From classification to interactive analysis. Comput. Ind. 2016, 78, 80–95. [Google Scholar] [CrossRef] [Green Version]
- Han, X.; Zhang, Z.; Ding, N.; Gu, Y.; Liu, X.; Huo, Y.; Qiu, J.; Yao, Y.; Zhang, A.; Zhang, L.; et al. Pre-trained models: Past, present and future. AI Open 2021, 2, 225–250. [Google Scholar] [CrossRef]
- Peters, M.E.; Neumann, M.; Iyyer, M.; Gardner, M.; Clark, C.; Lee, K.; Zettlemoyer, L. Deep Contextualized Word Representations. In Proceedings of the 2018 Conference of the North American Chapter of the Association for Computational Linguistics: Human Language Technologies, New Orleans, LA, USA, 1–6 June 2018; Volume 1 (Long Papers). Association for Computational Linguistics: New Orleans, LA, USA, 2018; pp. 2227–2237. [Google Scholar] [CrossRef] [Green Version]
- Hochreiter, S.; Schmidhuber, J. Long Short-Term Memory. Neural Comput. 1997, 9, 1735–1780. [Google Scholar] [CrossRef]
- Devlin, J.; Chang, M.W.; Lee, K.; Toutanova, K. BERT: Pre-training of Deep Bidirectional Transformers for Language Understanding. In Proceedings of the 2019 Conference of the North American Chapter of the Association for Computational Linguistics: Human Language Technologies, Minneapolis, MN, USA, 2–7 June 2019; Volume 1 (Long and Short Papers). Association for Computational Linguistics: Minneapolis, MN, USA, 2019; pp. 4171–4186. [Google Scholar] [CrossRef]
- Vaswani, A.; Shazeer, N.; Parmar, N.; Uszkoreit, J.; Jones, L.; Gomez, A.N.; Kaiser, Ł.; Polosukhin, I. Attention is all you need. arXiv 2017, arXiv:1706.03762. [Google Scholar]
- Liu, Y.; Ott, M.; Goyal, N.; Du, J.; Joshi, M.; Chen, D.; Levy, O.; Lewis, M.; Zettlemoyer, L.; Stoyanov, V. RoBERTa: A Robustly Optimized BERT Pretraining Approach. arXiv 2019, arXiv:1907.11692. [Google Scholar]
- Lan, Z.; Chen, M.; Goodman, S.; Gimpel, K.; Sharma, P.; Soricut, R. Albert: A lite bert for self-supervised learning of language representations. arXiv 2019, arXiv:1909.11942. [Google Scholar]
- Radford, A.; Narasimhan, K.; Salimans, T.; Sutskever, I. Improving Language Understanding by Generative Pre-Training. 2018. Available online: https://openai.com/blog/language-unsupervised/ (accessed on 31 May 2022).
- Cohen, V.; Gokaslan, A. OpenGPT-2: Open Language Models and Implications of Generated Text. XRDS Crossroads ACM Mag. Stud. 2020, 27, 26–30. [Google Scholar] [CrossRef]
- Radford, A.; Wu, J.; Child, R.; Luan, D.; Amodei, D.; Sutskever, I. Language models are unsupervised multitask learners. OpenAI Blog 2019, 1, 9. [Google Scholar]
- Brown, T.; Mann, B.; Ryder, N.; Subbiah, M.; Kaplan, J.D.; Dhariwal, P.; Neelakantan, A.; Shyam, P.; Sastry, G.; Askell, A.; et al. Language Models are Few-Shot Learners. In Proceedings of the Advances in Neural Information Processing Systems 33 (NeurIPS 2020), Virtual, 12–16 December 2020; Larochelle, H., Ranzato, M., Hadsell, R., Balcan, M., Lin, H., Eds.; Curran Associates, Inc.: Red Hook, NY, USA, 2020; Volume 33, pp. 1877–1901. [Google Scholar]
- Deng, J.; Dong, W.; Socher, R.; Li, L.J.; Li, K.; Fei-Fei, L. Imagenet: A large-scale hierarchical image database. In Proceedings of the 2009 IEEE Conference on Computer Vision and Pattern Recognition, Miami, FL, USA, 20–25 June 2009; pp. 248–255. [Google Scholar]
- Simonyan, K.; Zisserman, A. Very Deep Convolutional Networks for Large-Scale Image Recognition. In Proceedings of the 3rd International Conference on Learning Representations, ICLR 2015, San Diego, CA, USA, 7–9 May 2015. [Google Scholar]
- He, K.; Zhang, X.; Ren, S.; Sun, J. Deep residual learning for image recognition. In Proceedings of the IEEE Conference on Computer Vision and Pattern Recognition, Las Vegas, NV, USA, 27–30 June 2016; pp. 770–778. [Google Scholar]
- Xie, S.; Girshick, R.; Dollár, P.; Tu, Z.; He, K. Aggregated residual transformations for deep neural networks. In Proceedings of the IEEE Conference on Computer Vision and Pattern Recognition, Honolulu, HI, USA, 21–26 July 2017; pp. 1492–1500. [Google Scholar]
- Zagoruyko, S.; Komodakis, N. Wide Residual Networks. In Proceedings of the British Machine Vision Conference (BMVC), York, UK, 19–22 September 2016; Richard, C., Wilson, E.R.H., Smith, W.A.P., Eds.; BMVA Press: York, UK, 2016; pp. 87.1–87.12. [Google Scholar] [CrossRef] [Green Version]
- Tan, M.; Le, Q. EfficientNet: Rethinking Model Scaling for Convolutional Neural Networks. In Proceedings of the 36th International Conference on Machine Learning, Long Beach, CA, USA, 9–15 June 2019; Chaudhuri, K., Salakhutdinov, R., Eds.; Volume 97, pp. 6105–6114. [Google Scholar]
- Kolesnikov, A.; Dosovitskiy, A.; Weissenborn, D.; Heigold, G.; Uszkoreit, J.; Beyer, L.; Minderer, M.; Dehghani, M.; Houlsby, N.; Gelly, S.; et al. An Image is Worth 16 × 16 Words: Transformers for Image Recognition at Scale. 2021. Available online: https://openreview.net/forum?id=YicbFdNTTy (accessed on 31 May 2022).
- Tolstikhin, I.O.; Houlsby, N.; Kolesnikov, A.; Beyer, L.; Zhai, X.; Unterthiner, T.; Yung, J.; Steiner, A.; Keysers, D.; Uszkoreit, J.; et al. Mlp-mixer: An all-mlp architecture for vision. arXiv 2021, arXiv:2105.01601. [Google Scholar]
- Chen, X.; Hsieh, C.J.; Gong, B. When Vision Transformers Outperform ResNets without Pre-training or Strong Data Augmentations. In Proceedings of the International Conference on Learning Representations, Lisbon, Portugal, 27–28 October 2022. [Google Scholar]
- Doersch, C.; Gupta, A.; Efros, A.A. Unsupervised visual representation learning by context prediction. In Proceedings of the IEEE International Conference on Computer Vision, Washington, DC, USA, 7–13 December 2015; pp. 1422–1430. [Google Scholar]
- Zhang, R.; Isola, P.; Efros, A.A. Colorful image colorization. In Proceedings of the European Conference on Computer Vision, Amsterdam, The Netherlands, 11–14 October 2016; pp. 649–666. [Google Scholar]
- Chen, M.; Radford, A.; Child, R.; Wu, J.; Jun, H.; Luan, D.; Sutskever, I. Generative pretraining from pixels. In Proceedings of the International Conference on Machine Learning, Virtual Event, 13–18 July 2020; pp. 1691–1703. [Google Scholar]
- Du, Y.; Liu, Z.; Li, J.; Zhao, W.X. A survey of vision-language pre-trained models. arXiv 2022, arXiv:2202.10936. [Google Scholar]
- Qiu, X.; Sun, T.; Xu, Y.; Shao, Y.; Dai, N.; Huang, X. Pre-trained models for natural language processing: A survey. Sci. China Technol. Sci. 2020, 63, 1872–1897. [Google Scholar] [CrossRef]
- Yang, J.; Xiao, G.; Shen, Y.; Jiang, W.; Hu, X.; Zhang, Y.; Peng, J. A Survey of Knowledge Enhanced Pre-trained Models. arXiv 2021, arXiv:2110.00269. [Google Scholar]
- Chopra, S.; Hadsell, R.; LeCun, Y. Learning a similarity metric discriminatively, with application to face verification. In Proceedings of the 2005 IEEE Computer Society Conference on Computer Vision and Pattern Recognition (CVPR’05), San Diego, CA, USA, 20–26 June 2005; Volume 1, pp. 539–546. [Google Scholar]
- Schroff, F.; Kalenichenko, D.; Philbin, J. Facenet: A unified embedding for face recognition and clustering. In Proceedings of the IEEE Conference on Computer Vision and Pattern Recognition, Boston, MA, USA, 7–12 June 2015; pp. 815–823. [Google Scholar]
- Oh Song, H.; Xiang, Y.; Jegelka, S.; Savarese, S. Deep metric learning via lifted structured feature embedding. In Proceedings of the IEEE Conference on Computer Vision and Pattern Recognition, Las Vegas, NV, USA, 27–30 June 2016; pp. 4004–4012. [Google Scholar]
- Sohn, K. Improved deep metric learning with multi-class n-pair loss objective. Adv. Neural Inf. Process. Syst. 2016, 29, 1857–1865. [Google Scholar]
- Gutmann, M.; Hyvärinen, A. Noise-contrastive estimation: A new estimation principle for unnormalized statistical models. In Proceedings of the Thirteenth International Conference on Artificial Intelligence and Statistics, JMLR Workshop and Conference Proceedings, Sardinia, Italy, 13–15 May 2010; pp. 297–304. [Google Scholar]
- Józefowicz, R.; Vinyals, O.; Schuster, M.; Shazeer, N.; Wu, Y. Exploring the Limits of Language Modeling. arXiv 2016, arXiv:1602.02410. [Google Scholar]
- van den Oord, A.; Li, Y.; Vinyals, O. Representation Learning with Contrastive Predictive Coding. arXiv 2018, arXiv:1807.03748. [Google Scholar]
- Cui, W.; Zheng, G.; Wang, W. Unsupervised Natural Language Inference via Decoupled Multimodal Contrastive Learning. In Proceedings of the 2020 Conference on Empirical Methods in Natural Language Processing (EMNLP), Online, 16–20 November 2020; pp. 5511–5520. [Google Scholar]
- Wang, D.; Karout, S. Fine-grained Multi-Modal Self-Supervised Learning. In Proceedings of the BMVC, Virtual, 22–25 November 2021. [Google Scholar]
- Zhang, M.; Mosbach, M.; Adelani, D.I.; Hedderich, M.A.; Klakow, D. MCSE: Multimodal Contrastive Learning of Sentence Embeddings. arXiv 2022, arXiv:2204.10931. [Google Scholar]
- Chen, T.; Kornblith, S.; Norouzi, M.; Hinton, G. A simple framework for contrastive learning of visual representations. In Proceedings of the International Conference on Machine Learning, Virtual, 13–18 July 2020; pp. 1597–1607. [Google Scholar]
- Liu, Y.; Fan, Q.; Zhang, S.; Dong, H.; Funkhouser, T.; Yi, L. Contrastive multimodal fusion with tupleinfonce. In Proceedings of the IEEE/CVF International Conference on Computer Vision, Montreal, BC, Canada, 11–17 October 2021; pp. 754–763. [Google Scholar]
- Udandarao, V.; Maiti, A.; Srivatsav, D.; Vyalla, S.R.; Yin, Y.; Shah, R.R. Cobra: Contrastive bi-modal representation algorithm. arXiv 2020, arXiv:2005.03687. [Google Scholar]
- Zolfaghari, M.; Zhu, Y.; Gehler, P.; Brox, T. CrossCLR: Cross-modal Contrastive Learning For Multi-modal Video Representations. In Proceedings of the IEEE/CVF International Conference on Computer Vision, Montreal, BC, Canada, 11–17 October 2021; pp. 1450–1459. [Google Scholar]
- Yuan, X.; Lin, Z.; Kuen, J.; Zhang, J.; Wang, Y.; Maire, M.; Kale, A.; Faieta, B. Multimodal contrastive training for visual representation learning. In Proceedings of the IEEE/CVF Conference on Computer Vision and Pattern Recognition, Nashville, TN, USA, 20–25 June 2021; pp. 6995–7004. [Google Scholar]
- Miech, A.; Alayrac, J.B.; Smaira, L.; Laptev, I.; Sivic, J.; Zisserman, A. End-to-end learning of visual representations from uncurated instructional videos. In Proceedings of the IEEE/CVF Conference on Computer Vision and Pattern Recognition, Seattle, WA, USA, 14–19 June 2020; pp. 9879–9889. [Google Scholar]
- Alayrac, J.B.; Recasens, A.; Schneider, R.; Arandjelović, R.; Ramapuram, J.; De Fauw, J.; Smaira, L.; Dieleman, S.; Zisserman, A. Self-supervised multimodal versatile networks. Adv. Neural Inf. Process. Syst. 2020, 33, 25–37. [Google Scholar]
- Radford, A.; Kim, J.W.; Hallacy, C.; Ramesh, A.; Goh, G.; Agarwal, S.; Sastry, G.; Askell, A.; Mishkin, P.; Clark, J.; et al. Learning transferable visual models from natural language supervision. In Proceedings of the International Conference on Machine Learning, Virtual, 18–24 July 2021; pp. 8748–8763. [Google Scholar]
- Lin, T.Y.; Maire, M.; Belongie, S.; Hays, J.; Perona, P.; Ramanan, D.; Dollár, P.; Zitnick, C.L. Microsoft coco: Common objects in context. In Proceedings of the European Conference on Computer Vision, Zurich, Switzerland, 6–12 September 2014; pp. 740–755. [Google Scholar]
- Young, P.; Lai, A.; Hodosh, M.; Hockenmaier, J. From image descriptions to visual denotations: New similarity metrics for semantic inference over event descriptions. Trans. Assoc. Comput. Linguist. 2014, 2, 67–78. [Google Scholar] [CrossRef]
- Miech, A.; Zhukov, D.; Alayrac, J.B.; Tapaswi, M.; Laptev, I.; Sivic, J. Howto100m: Learning a text-video embedding by watching hundred million narrated video clips. In Proceedings of the IEEE/CVF International Conference on Computer Vision, Seoul, Korea, 27 October–2 November 2019; pp. 2630–2640. [Google Scholar]
- Zhang, J.; Ma, S.; Sameki, M.; Sclaroff, S.; Betke, M.; Lin, Z.; Shen, X.; Price, B.; Mech, R. Salient object subitizing. In Proceedings of the IEEE Conference on Computer Vision and Pattern Recognition, Boston, MA, USA, 7–12 June 2015; pp. 4045–4054. [Google Scholar]
- Gemmeke, J.F.; Ellis, D.P.; Freedman, D.; Jansen, A.; Lawrence, W.; Moore, R.C.; Plakal, M.; Ritter, M. Audio set: An ontology and human-labeled dataset for audio events. In Proceedings of the 2017 IEEE International Conference on Acoustics, Speech and Signal Processing (ICASSP), New Orleans, LA, USA, 5–9 March 2017; pp. 776–780. [Google Scholar]
- Thomee, B.; Shamma, D.A.; Friedland, G.; Elizalde, B.; Ni, K.; Poland, D.; Borth, D.; Li, L.J. YFCC100M: The new data in multimedia research. Commun. ACM 2016, 59, 64–73. [Google Scholar] [CrossRef]
- Hendrycks, D.; Gimpel, K. Gaussian Error Linear Units (GELUs). arXiv 2016, arXiv:1606.08415. [Google Scholar]
- Suárez, P.J.O.; Sagot, B.; Romary, L. Asynchronous pipeline for processing huge corpora on medium to low resource infrastructures. In Proceedings of the 7th Workshop on the Challenges in the Management of Large Corpora (CMLC-7), Cardiff, UK, 22 July 2019. [Google Scholar]
- Raffel, C.; Shazeer, N.; Roberts, A.; Lee, K.; Narang, S.; Matena, M.; Zhou, Y.; Li, W.; Liu, P.J. Exploring the Limits of Transfer Learning with a Unified Text-to-Text Transformer. J. Mach. Learn. Res. 2020, 21, 1–67. [Google Scholar]
- Wu, Y.; Schuster, M.; Chen, Z.; Le, Q.V.; Norouzi, M.; Macherey, W.; Krikun, M.; Cao, Y.; Gao, Q.; Macherey, K.; et al. Google’s Neural Machine Translation System: Bridging the Gap between Human and Machine Translation. arXiv 2016, arXiv:1609.08144. [Google Scholar]
- Hatzigeorgiu, N.; Gavrilidou, M.; Piperidis, S.; Carayannis, G.; Papakostopoulou, A.; Spiliotopoulou, A.; Vacalopoulou, A.; Labropoulou, P.; Mantzari, E.; Papageorgiou, H.; et al. Design and Implementation of the Online ILSP Greek Corpus. In Proceedings of the LREC; European Language Resources Association (ELRA): Athens, Greece, 2000. [Google Scholar]
- Loshchilov, I.; Hutter, F. Decoupled Weight Decay Regularization. In Proceedings of the International Conference on Learning Representations, Vancouver, BC, Canada, 30 April–3 May 2018. [Google Scholar]
- Koehn, P. Europarl: A parallel corpus for statistical machine translation. In Proceedings of the Machine Translation Summit X: Papers, Phuket, Thailand, 13–15 September 2005; pp. 79–86. [Google Scholar]
- Joulin, A.; Grave, E.; Mikolov, P.B.T. Bag of Tricks for Efficient Text Classification. arXiv 2017, arXiv:1607.01759. [Google Scholar]
- Grave, É.; Bojanowski, P.; Gupta, P.; Joulin, A.; Mikolov, T. Learning Word Vectors for 157 Languages. In Proceedings of the Eleventh International Conference on Language Resources and Evaluation (LREC 2018), Miyazaki, Japan, 7–12 May 2018. [Google Scholar]
- Ridnik, T.; Ben-Baruch, E.; Noy, A.; Zelnik, L. ImageNet-21K Pretraining for the Masses. In Proceedings of the Neural Information Processing Systems Track on Datasets and Benchmarks, Online, 6 December 2021; Volume 1. [Google Scholar]
- Ioffe, S.; Szegedy, C. Batch normalization: Accelerating deep network training by reducing internal covariate shift. In Proceedings of the International Conference on Machine Learning, Lille, France, 7–9 July 2015; pp. 448–456. [Google Scholar]
- Kingma, D.P.; Ba, J. Adam: A Method for Stochastic Optimization. In Proceedings of the 3rd International Conference on Learning Representations, ICLR 2015, San Diego, CA, USA, 7–9 May 2015. [Google Scholar]
- Paszke, A.; Gross, S.; Massa, F.; Lerer, A.; Bradbury, J.; Chanan, G.; Killeen, T.; Lin, Z.; Gimelshein, N.; Antiga, L.; et al. PyTorch: An Imperative Style, High-Performance Deep Learning Library. In Advances in Neural Information Processing Systems 32; Wallach, H., Larochelle, H., Beygelzimer, A., d’Alché-Buc, F., Fox, E., Garnett, R., Eds.; Curran Associates, Inc.: Red Hook, NY, USA, 2019; pp. 8024–8035. [Google Scholar]
- Karouzos, C.; Paraskevopoulos, G.; Potamianos, A. UDALM: Unsupervised Domain Adaptation through Language Modeling. In Proceedings of the 2021 Conference of the North American Chapter of the Association for Computational Linguistics: Human Language Technologies, Online, 6–11 June 2021; pp. 2579–2590. [Google Scholar] [CrossRef]
Figure 1.
Example of an accompanying photograph for an observation.
Figure 1.
Example of an accompanying photograph for an observation.
Figure 2.
Distribution of observation priorities across the different location types (construction, store, warehouse, office). Green: high, orange: medium, blue: low.
Figure 2.
Distribution of observation priorities across the different location types (construction, store, warehouse, office). Green: high, orange: medium, blue: low.
Figure 3.
The average number of observations performed by users at each experience level.
Figure 3.
The average number of observations performed by users at each experience level.
Figure 4.
The average priority rating of each SO. SOs are split by their experience level. “Inexperienced”: top, “Experienced”: middle, “Expert”: bottom.
Figure 4.
The average priority rating of each SO. SOs are split by their experience level. “Inexperienced”: top, “Experienced”: middle, “Expert”: bottom.
Figure 5.
Distribution of the observation categories, split by the observation priorities.
Figure 5.
Distribution of the observation categories, split by the observation priorities.
Figure 6.
Distribution of the issue sources, split by the observation priorities.
Figure 6.
Distribution of the issue sources, split by the observation priorities.
Figure 7.
The multimodal architecture used in our experiments.
Figure 7.
The multimodal architecture used in our experiments.
Table 1.
Overview of related data-driven applications in the OSH domain.
Table 1.
Overview of related data-driven applications in the OSH domain.
| Reference Number | OSH Industry | Task | Modality | Data Availability | Dataset Size |
|---|
| [2] | Mining | Recommendations
analysis /
similarities and themes | Text
(incident reports) | Public
(Literature) | 10 |
| [3] | Construction | Analysis of
importance degree
and safety risk
factors | Text
(accident reports) | Public
(China’s State
Administration
of Work Safety) | 156 |
| [4] | Construction | State-based
classification
of accidents | Text
(injury reports) | Public
(OSHA Arizona office) | 513 |
| [5] | Multiple | Classify according
to industry
Identify
sectoral-patterns | Text
(accident reports) | Public
(OSHA US Office) | 2842 |
| [6] | Aviation | Classify the
primary problem
and contributing
factors | Text
(self-reported
safety narratives) | Public
(Aviation Safety
Reporting System
database) | 4497 |
| [7] | Construction | Classify sites
in accordance to
their safety risk
in construction
projects | Text
(accident cases) | Private
(Large contractor
in Singapore) | 1203 |
| [8] | Mining | Predict days
away from
work | Text
(tabular data
and narratives) | Public
(Mine Safety
and Health
Administration) | – |
| [20] | Construction | Classification of
accidents’ cause | Text
(accident reports) | Public
(OSHA) | 1000 |
| [21] | Construction | Classify near-miss
incidents in
safety reports | Text
(near-miss reports) | Private
(Wuhan Metro Group
Co. Ltd.) | 3280 |
| [22] | Construction | Classify injury
reports
(precursor, code,
severity,
bodypart,
energy source) | Text
(injury reports) | Public
(Published research
and OSHA) | 2201 |
| [23] | Construction | Classification of
incidents into
cause categories | Text
(accident reports) | Public
(OSHA) | 4470 |
| [24] | Construction | Classification of
narratives based
on Workplace Safety
and Health Institute
report | Text
(accident reports) | Public
(OSHA) | 4470 |
| [25] | Construction | Identify/extract
critical safety
risk factors | Text
(accident reports) | Upon request
(Construction companies) | 221 |
| [26] | Construction | Evaluate the
strength of
candidate TC
categories | Text
(inspection records) | Private
(Partner general
contractor) | 262 |
| [28] | Construction | Identify potential
hazards and
suggests safe
approaches | Text
(incident reports) | Public
(CPWR-FACE-OSHA) | 1167 |
| [29] | Oil and gas | Recognition and
classification of
failed occupational
health control | Text
(unstructured reports) | Private
(–) | 500 |
| [30] | Multiple | Classification of
incidents with
multilingual ontology | Text
(multilingual reports) | Public
(Swiss Federal Office
of Transport) | 5065 |
| [31] | Railway | Classification of
close call reports
with threat pathways
on bow-tie diagrams | Text
(close-call reports) | Private
(Great Britain
railway’s close
call database) | 219,231 |
| [32] | Chemicals | Recognition of
chemical safety
entities | Text
(HAZOP reports) | Public
(China’s State
Administration
of Work Safety) | – |
| [33] | Aviation | Clustering flight
safety narrative | Text + Metadata
(in-flight events
narratives) | Public
(Aviation Safety
Reporting System) | 13,336 |
| [34] | Aviation | Classification and
escalation of
safety events | Text
(investigation reports) | Public
(Five national
agencies and
authorities) | 317 |
| [35] | Aviation | Classification of
safety narratives | Text
(safety reports) | Public
(French DGAC
database) | 136,861 |
Table 2.
Summary of related works that utilize contrastive objectives for multimodal representation learning.
Table 2.
Summary of related works that utilize contrastive objectives for multimodal representation learning.
| Reference Number | Downstream Tasks | Contrastive Objective | Pretraining Datasets |
|---|
| [69] | Unsupervised natural language
Inference | InfoNCE [68] | COCO [80], Flickr30k [81] |
| [70] | Action recognition
Video retrieval | InfoNCE [68] | HowTo100M [82] |
| [74] | Fake-news detection
Sentiment analysis | N-pair [65] | – |
| [75] | Video retrieval
Video captioning | Cross-CLR [75] | – |
| [76] | Object detection
Cross-modal retrieval | InfoNCE [68] | COCO [80], Stock [83] |
| [77] | Action recognition
Action localization
Video retrieval | MIL-NCE [77] | HowTo100M [82] |
| [78] | Image/sound/action
classification
Zero-shot retrieval | InfoNCE [68], MIL-NCE [77] | HowTo100M [82], Audioset [84] |
| [79] | Few-shot/zero-shot
image classification | N-pair [65] | YFCC100M [85], internal image–text dataset [79] |
Table 3.
Checklist statistics for different locations.
Table 3.
Checklist statistics for different locations.
| Location | Number of Main Groups | Total Number of Internal Sub-Groups |
|---|
| Office spaces | 3 | 14 |
| Warehouses | 4 | 20 |
| Retail stores | 4 | 18 |
| Construction site | 19 | 166 |
Table 4.
Example observation with accompanying metadata.
Table 4.
Example observation with accompanying metadata.
| Issue Attribute | Example Value |
|---|
| Observation ID | 4C1B1763-A909-9F4D-BBAB-27177F62C337 |
| Safety officer | Anonymized SO ID (e.g., 5123) |
| Location | Warehouse |
| Checklist group | Water and Gutters |
| Issue description | There is an inflow of water from the roof to the distributor space |
| Corrective action | Carry out waterproofing works |
| Priority | High |
| Photograph | Figure 1 |
| Issue source | Spaces |
| Category | General Issues |
| SO expertise | Expert |
Table 5.
High-level observation categories with examples of checklist groups that belong to each category.
Table 5.
High-level observation categories with examples of checklist groups that belong to each category.
| Category | Example Checklist Groups |
|---|
| Fire safety | “Fire Extinguishers”, “Transportation, Use and Storage of Gas Cylinders” … |
| Electrical safety | “Electrical Panel Grounding”, “Worn out Cables” … |
| Health safety | “Space cleaning”, “First Aid”, “Leakage of Hazardous Materials” … |
| Preventive measures | “Site Guard”, “Warning Labels”, “Evacuation Exercises”, “Safety Training” … |
| Work injuries | “Worn out Ladders”, “Safety Goggles”, “Hearing Protection” … |
| Regulation compliance | “Safety reports”, “Certifications”, “Maintenance Books” … |
| General issues | “Other observations” |
Table 6.
High-level issue sources with examples of checklist groups that belong to each issue source.
Table 6.
High-level issue sources with examples of checklist groups that belong to each issue source.
| Issue Source | Example Checklist Groups |
|---|
| Activities | “On-site smoking”, “Work on ladders”, “Worker training” … |
| Spaces | “Rest Areas”, “Electrical panel labeling”, “Pollution” … |
| Equipment | “Protective Provisions”, “Worn out Cables”, “First-aid kit” … |
| Regulations–Certifications | “Safety reports”, “Certifications”, “Maintenance Books” … |
| Other | “Other observations” |
Table 7.
Multimodal priority classification accuracy on the Safety4All test set. : Textual, : Visual.
Table 7.
Multimodal priority classification accuracy on the Safety4All test set. : Textual, : Visual.
| Modality | Text Encoder | Visual Encoder | Fusion Method | Accuracy (%) | Unimodal |
|---|
| - | Resnet18 | - | | - |
| - | ViT | - | | - |
| Greek BERT | - | - | | - |
| GR-Electra | - | - | | - |
| Greek BERT | Resnet18 | cat | | |
| Greek BERT | Resnet18 | CLSS | | |
| Greek BERT | ViT | cat | | |
| Greek BERT | ViT | CLSS | | |
| GR-Electra | Resnet18 | cat | | |
| GR-Electra | Resnet18 | CLSS | | |
| GR-Electra | ViT | cat | | |
| GR-Electra | ViT | CLSS | | |
| Random Baseline | | |
Table 8.
Ablation regarding the priority classification accuracy for different issue locations. : Text, : Visual.
Table 8.
Ablation regarding the priority classification accuracy for different issue locations. : Text, : Visual.
| Location | Modality | Text Encoder | Visual Encoder | Fusion Method | Accuracy (%) |
|---|
| Construction | | - | ViT | - | |
| Greek BERT | - | - | |
| GR-Electra | - | - | |
| Greek BERT | ViT | CLSS | |
| GR-Electra | ViT | CLSS | |
| Random Baseline | |
| Office | | - | ViT | - | |
| Greek BERT | - | - | |
| GR-Electra | - | - | |
| Greek BERT | ViT | CLSS | |
| GR-Electra | ViT | CLSS | |
| Random Baseline | |
| Store | | - | ViT | - | |
| Greek BERT | - | - | |
| GR-Electra | - | - | |
| Greek BERT | ViT | CLSS | |
| GR-Electra | ViT | CLSS | |
| Random Baseline | |
| Warehouse | | - | ViT | - | |
| Greek BERT | - | - | |
| GR-Electra | - | - | |
| Greek BERT | ViT | CLSS | |
| GR-Electra | ViT | CLSS | |
| Random Baseline | |
Table 9.
Classification accuracy for the effective SO experience level of observations on the Safety4All test set. : Text, : Visual.
Table 9.
Classification accuracy for the effective SO experience level of observations on the Safety4All test set. : Text, : Visual.
| Modality | Text Encoder | Visual Encoder | Fusion Method | Accuracy (%) | Unimodal |
|---|
| - | ResNet18 | - | | - |
| - | ViT | - | | - |
| Greek BERT | - | - | | - |
| GR-Electra | - | - | | - |
| Greek BERT | ResNet18 | cat | | |
| Greek BERT | ResNet18 | CLSS | | |
| Greek BERT | ViT | cat | | |
| Greek BERT | ViT | CLSS | | |
| GR-Electra | ResNet18 | cat | | |
| GR-Electra | ResNet18 | CLSS | | |
| GR-Electra | ViT | cat | | |
| GR-Electra | ViT | CLSS | | |
| Random Baseline | | |
Table 10.
Classification accuracy for the issue source and the category of observations on the Safety4All test set. : Text, : Visual.
Table 10.
Classification accuracy for the issue source and the category of observations on the Safety4All test set. : Text, : Visual.
| Target | Modality | Text Encoder | Visual Encoder | Fusion Method | Accuracy (%) | Unimodal |
|---|
| Issue Source | | - | ResNet18 | - | | - |
| - | ViT | - | | - |
| Greek BERT | - | - | | - |
| GR-Electra | - | - | 72 | - |
| Greek BERT | ResNet18 | cat | | |
| Greek BERT | ResNet18 | CLSS | | |
| Greek BERT | ViT | cat | | |
| Greek BERT | ViT | CLSS | | |
| GR-Electra | ResNet18 | cat | | |
| GR-Electra | ResNet18 | CLSS | | |
| GR-Electra | ViT | cat | | |
| GR-Electra | ViT | CLSS | | |
| Random Baseline | | |
| Category | | - | ResNet18 | - | | - |
| - | ViT | - | | - |
| Greek BERT | - | - | | - |
| GR-Electra | - | - | | - |
| Greek BERT | ResNet18 | cat | | |
| Greek BERT | ResNet18 | CLSS | | |
| Greek BERT | ViT | cat | | |
| Greek BERT | ViT | CLSS | | |
| GR-Electra | ResNet18 | cat | | |
| GR-Electra | ResNet18 | CLSS | | |
| GR-Electra | ViT | cat | | |
| GR-Electra | ViT | CLSS | | |
| Random Baseline | | |
| Publisher’s Note: MDPI stays neutral with regard to jurisdictional claims in published maps and institutional affiliations. |
© 2022 by the authors. Licensee MDPI, Basel, Switzerland. This article is an open access article distributed under the terms and conditions of the Creative Commons Attribution (CC BY) license (https://creativecommons.org/licenses/by/4.0/).


 ,
, 


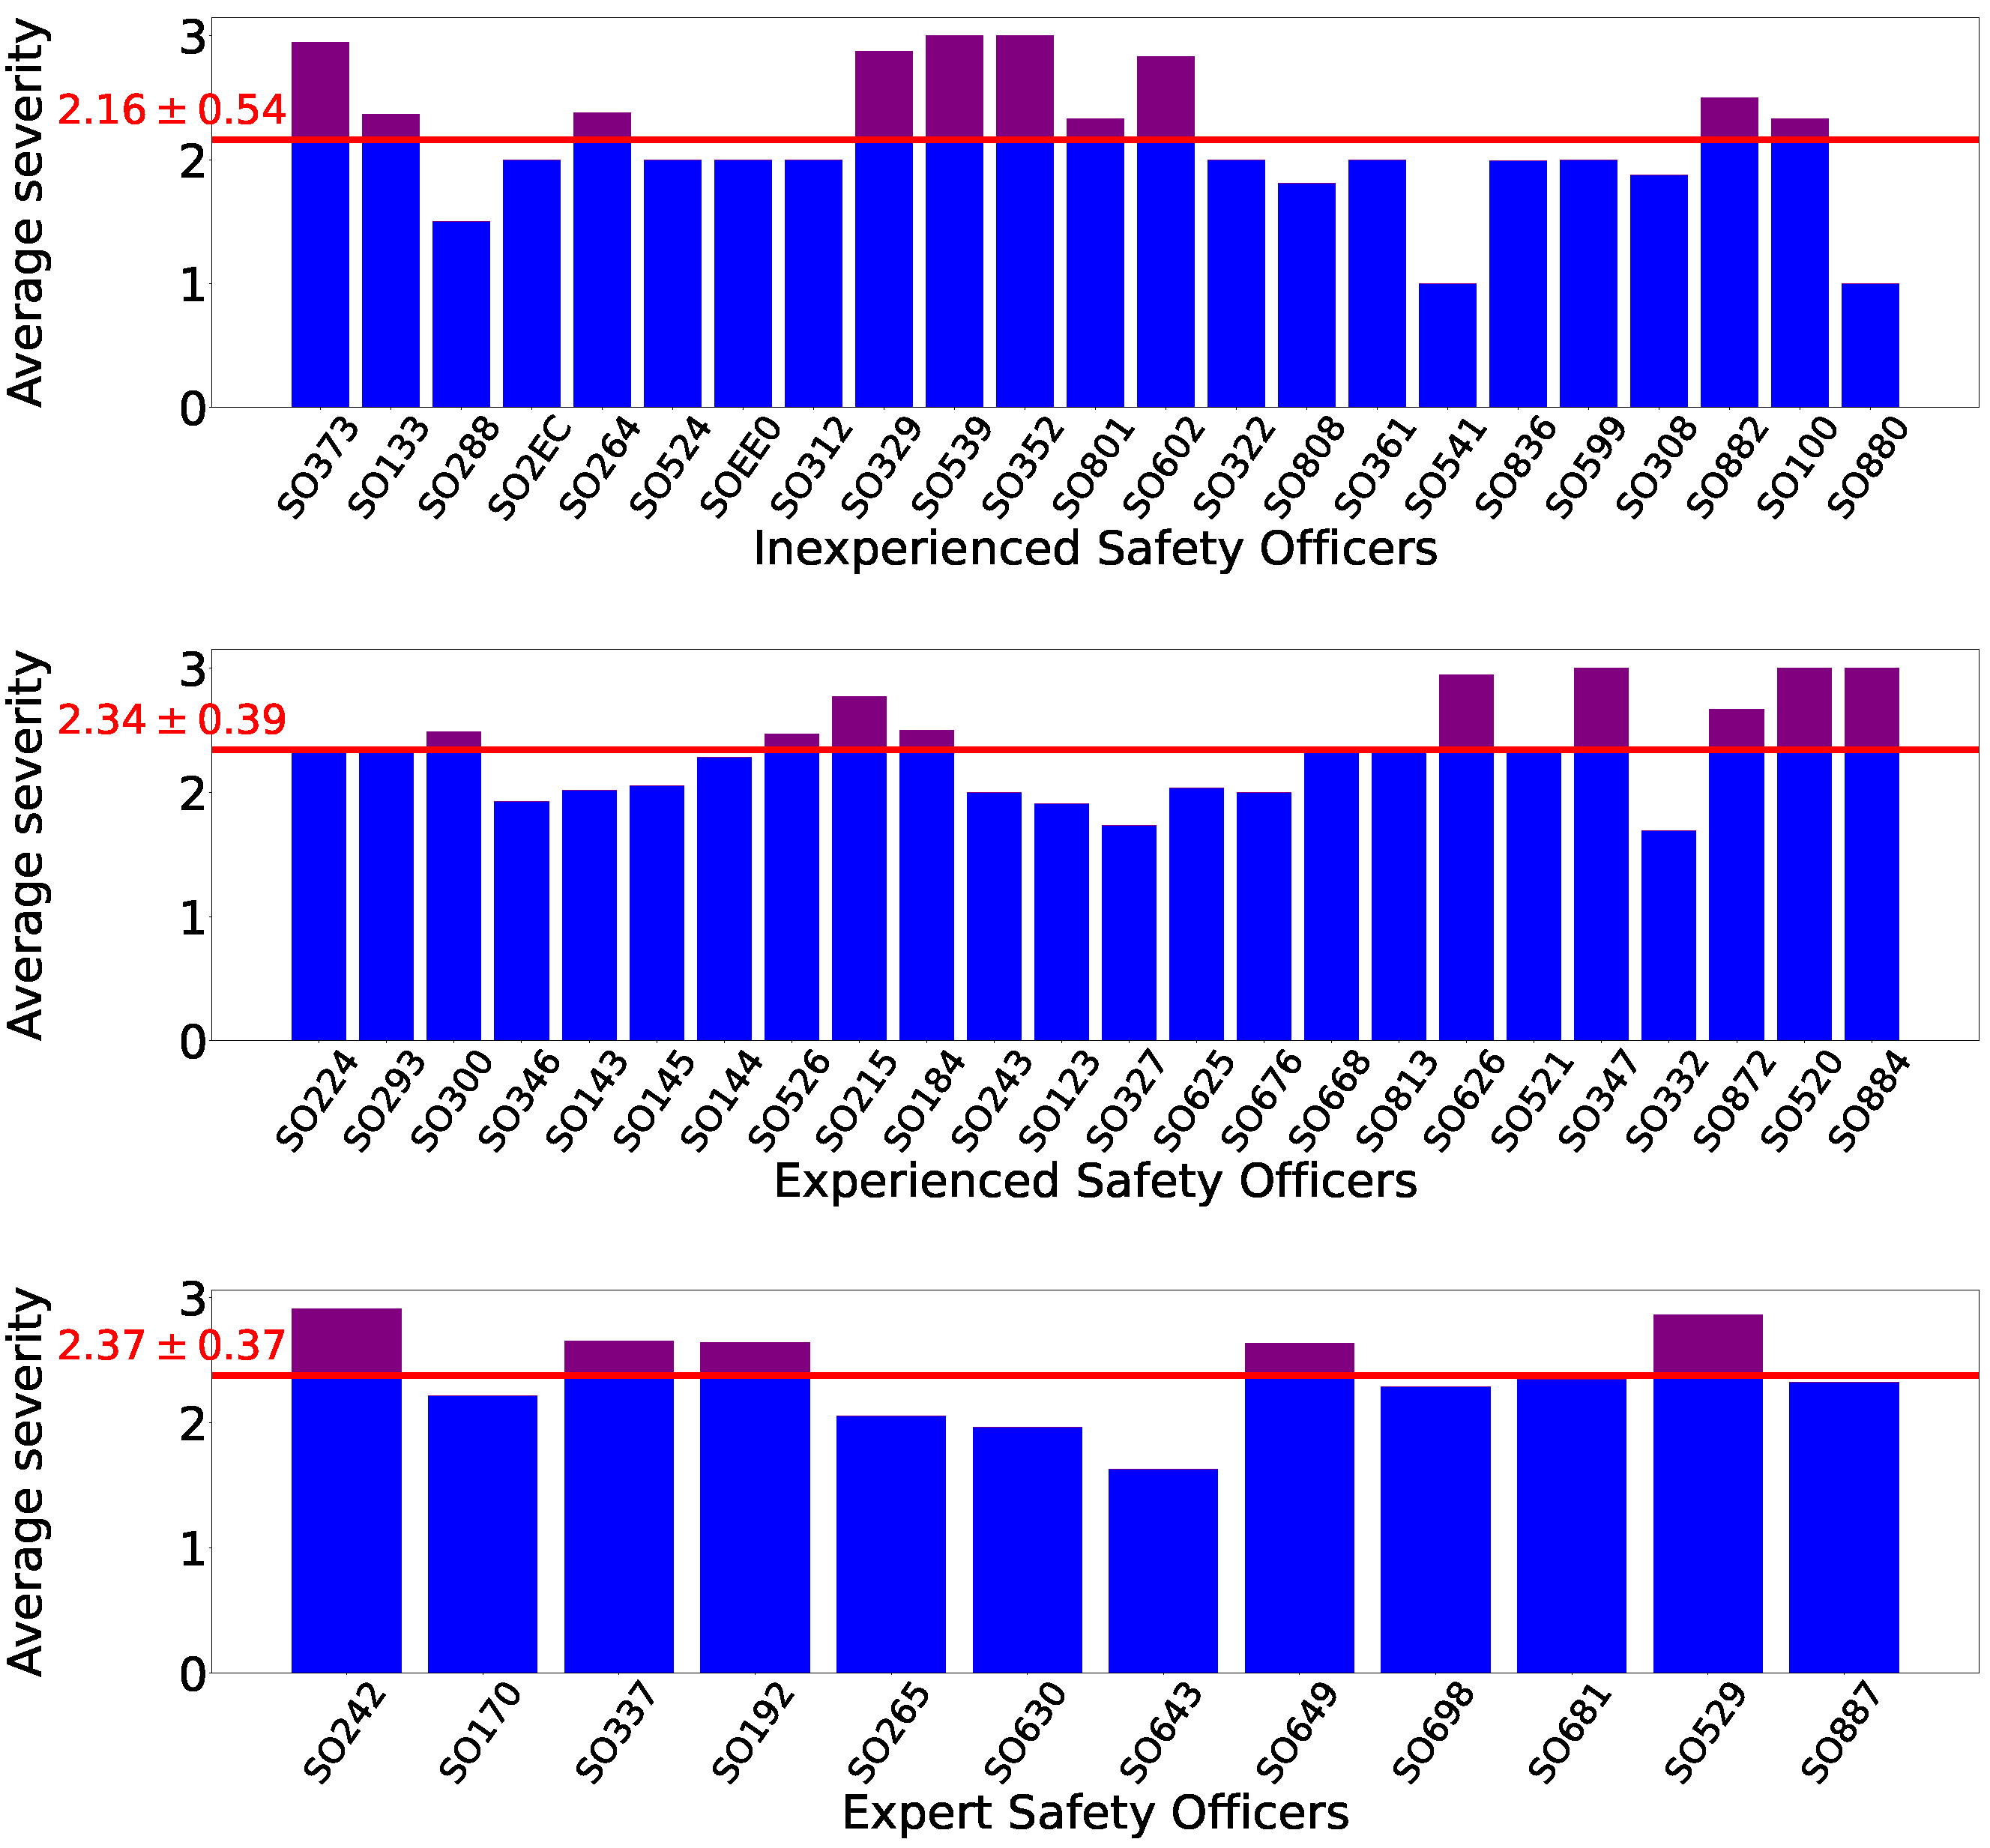

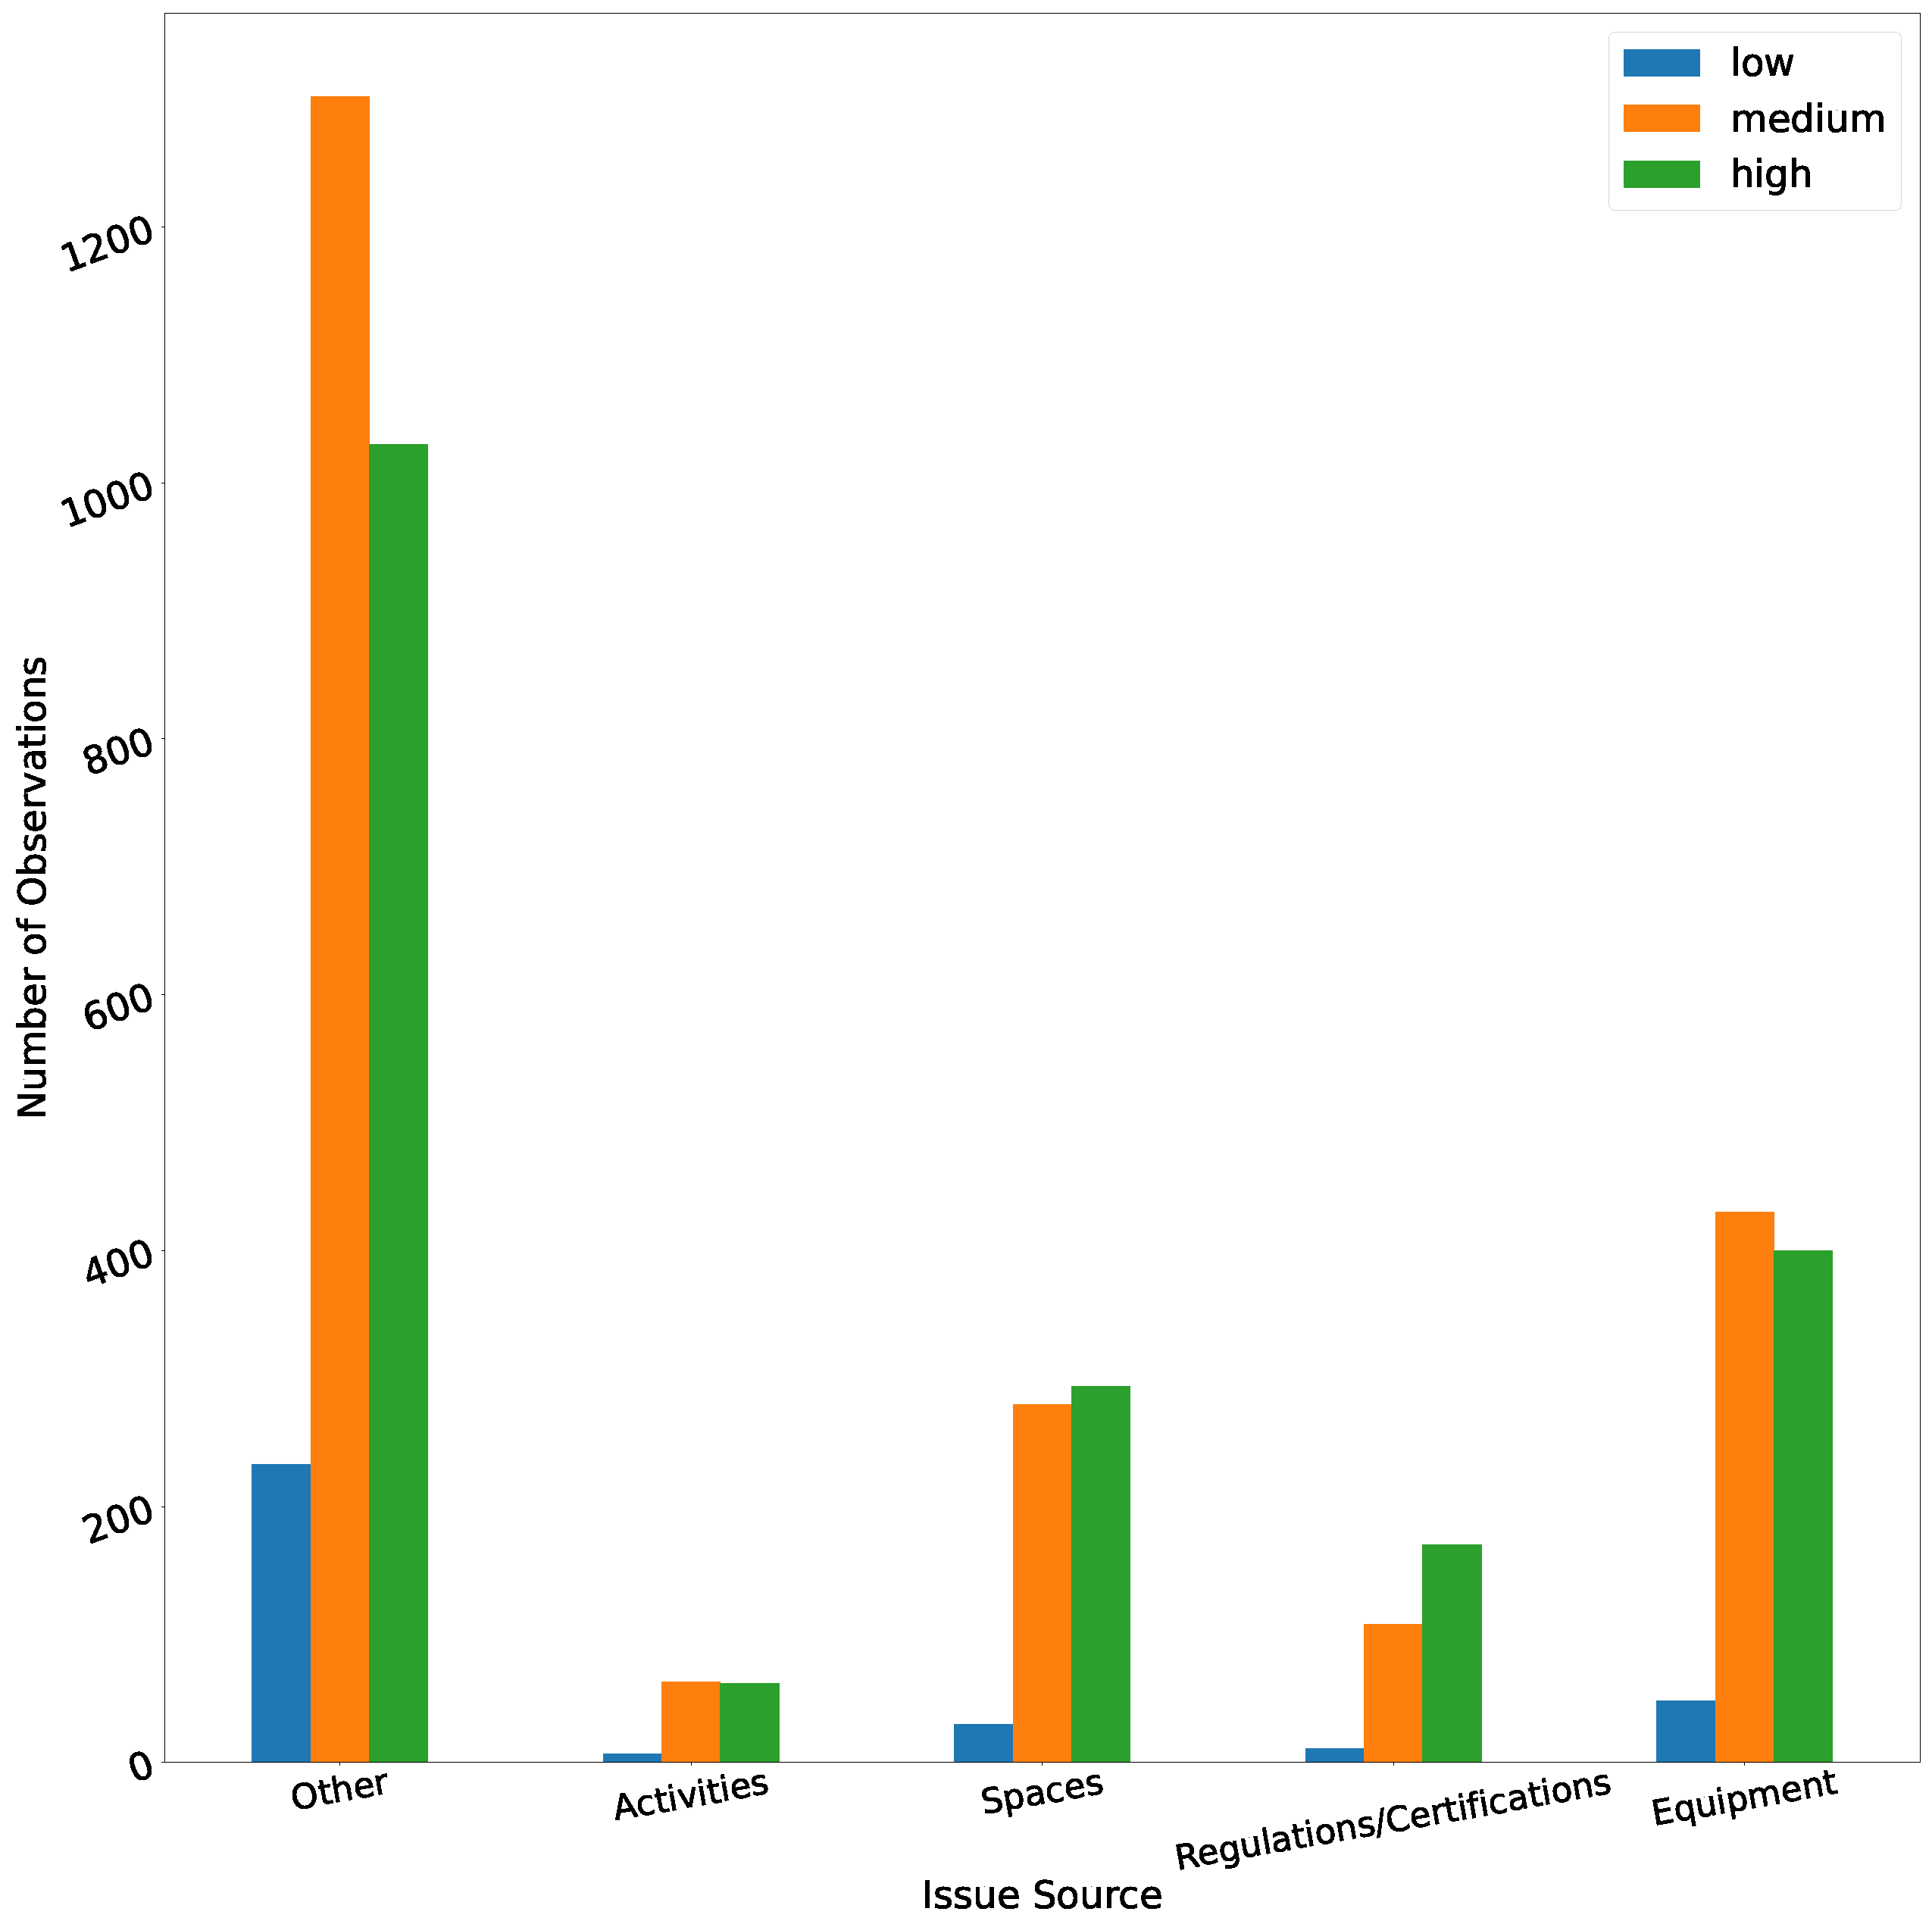
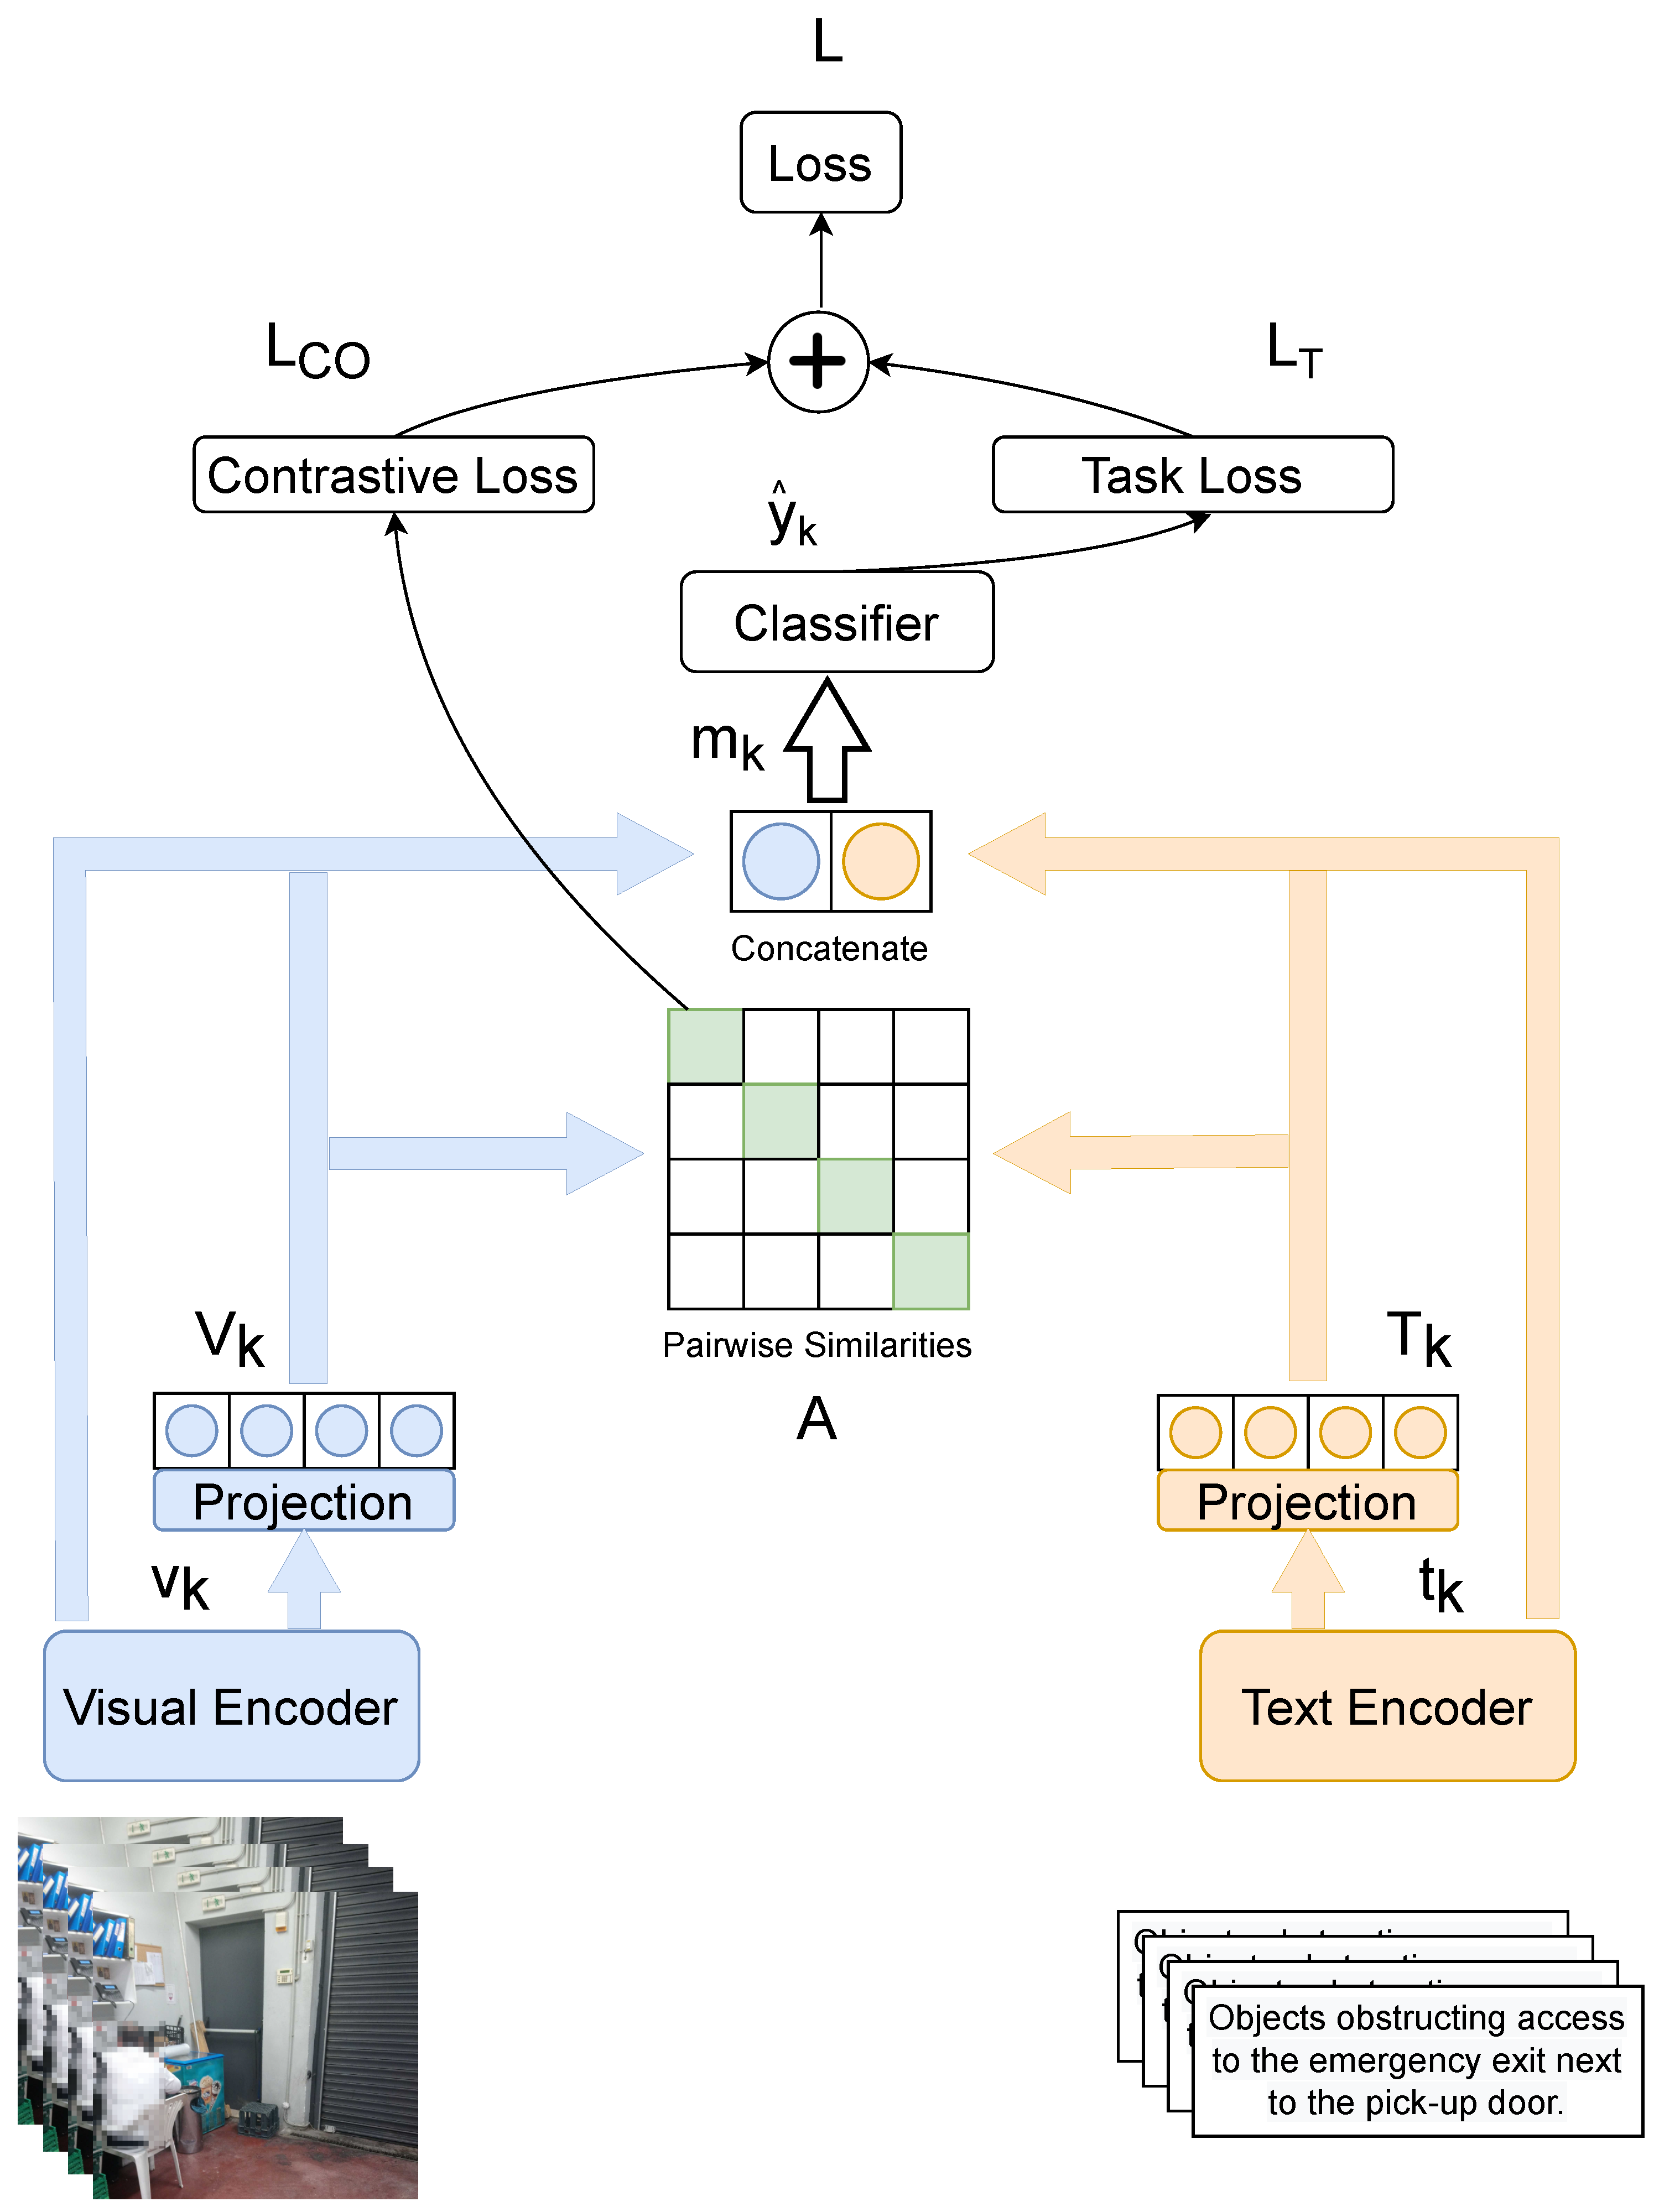
