1. Introduction
Developing countries lack suitable road maintenance, which leads to the deterioration of roads. The current maintenance program reveals that the system used is insufficient to reflect changing conditions and is lacking in its ability to assist in decision making during pavement design [
1]. A good pavement management system is therefore necessary to reduce the rate of deterioration and maintain the pavement in a serviceable state [
2]. To plan for maintenance properly, sums of data are needed—particularly data on road conditions. Road condition data change over time, especially since collecting them regularly requires a significant investment of resources and time.
A pavement maintenance management system (PMMS) consists of a series of decision-based components used to determine where and how repairs should be carried out. Often, maintenance decision making is achieved by feedback from assessments conducted by the local authority. To attain the best utilization of available funds, it is essential to have convenient methods for assessing the road conditions and a database of these conditions so that analyses can be performed, which provides useful information for decision making. Unfortunately, this is not the case in many developing countries due to their limited budgets and less advanced technology. Therefore, most road maintenance decisions are made based on engineering judgments [
3].
Road pavement roughness is an acceptable indicator for evaluating the overall condition of a pavement’s surface. Road roughness can give agencies useful information for the decision-making processes of maintenance planning and programming [
4].
Road roughness is usually measured by an index such as the international roughness index (IRI). Many approaches are available for measuring the IRI, although most of them require sophisticated profilers and tools that are highly accurate but costly to obtain, operate, and maintain, as well as skillful operators. On the other hand, a popular practice in many developing countries is visual inspection. Visual inspection is a relatively cheap option but is very labor-intensive and time-consuming. Therefore, it is necessary to investigate low-cost, practical methods for evaluating roughness.
Nowadays, smartphones usually come with many useful and inexpensive embedded sensors, such as three-axis accelerometers, a gyroscope, and a GPS [
5]. These sensors can measure the acceleration in m/s
2 along each of the x, y, and z axes, and can be used to recognize motion. Accelerometers in smartphones are primarily used for detecting the orientation of the screen. The embedded sensors in smartphones are capable of recording useful signals for road surface condition estimation, similar to those recorded by high-tech equipment [
6].
The embedded sensors within smartphones have been studied with regard to their ability to measure road roughness. The “SmartRoadSense” system presented by Alessandroni et al. (2014) aimed to measure road surfaces using smartphones. They established a model for determining a road roughness index from data obtained by the system [
7]. Douangphachanh and Oneyama (2014) estimated road conditions by using the intelligent vehicle monitoring system (IVMS) as a reference for establishing a road roughness index. They collected data via the AndroSensor smartphone application to determine road profiles and compute the IRI [
6]. Islam et al. (2014) processed integrated acceleration data using computer software. The study collected road profile and acceleration data with both an inertial profiler and a smartphone mounted on a vehicle. The results showed that smartphones measured road roughness with an acceptable accuracy when compared with an inertial profiler [
8]. Zeng et al. (2015) determined that road roughness depends on a normalized acceleration index. The data were collected by mounting two tablets on a vehicle dashboard. Data were captured on the acceleration in three dimensions, the GPS coordinates, and the speed. This revealed that the recommended index could define road surface deficiencies with a high precision (between 80 and 93 percent) [
9]. Hanson et al. (2014) made an effort to correlate road roughness between a smartphone and a conventional profiler. They obtained measurements from 11 road segments on a secondary highway in New Brunswick, Canada, and thereafter concluded that there was a strong correlation between the results of the profiler and the smartphone [
10]. To evaluate the feasibility of such a technique, Zeng et al. (2018) created a prototype smartphone app. In Virginia, the prototype app was used for collecting acceleration data from two routes by running the app on tablets. The suggested smartphone application technique enables the gathering of roughness data, according to the evaluation in Virginia. [
11]. Yeganeh et al. (2019) used the embedded sensors of a smartphone to calculate pavement roughness and investigate the feasibility of assessing pavement surface conditions with smartphones [
12]. Chatterjee and Tsai (2020) used low-cost smartphone sensor data to estimate pavement conditions, which were then entered into a known geographic information system (GIS) [
13]. Dong and Li (2021) utilized an android-based application for collecting accelerometer data on a local road in Ireland. Their results revealed the ability of the application to collect data for the identification of road surface defects. This method attempts to ensure road serviceability at lower costs for inspection and maintenance [
14]. Pavement roughness is a key indicator of pavement surface performance, since it directly reflects the pavement’s serviceability to road users. In recent years, several road agencies have employed the IRI as an objective indicator of their pavement network conditions in their business plans. A significant relationship exists between the IRI and features of pavement surface distress, such as cracking, patching, depression, and raveling [
15].
This paper presents an application method for android sensors in addition to the use of the Google Earth platform to aid the decision-making process in pavement maintenance management systems. The main objective of this paper is to provide a simple and cost-effective road maintenance management system that can be used by small and intermediate cities in developing countries. Efforts have been made to obtain a data inventory and prioritize road maintenance using sensors embedded in smartphones, as well as using the Google Earth platform to handle data and visualize the output of reporting.
2. Research Methodology
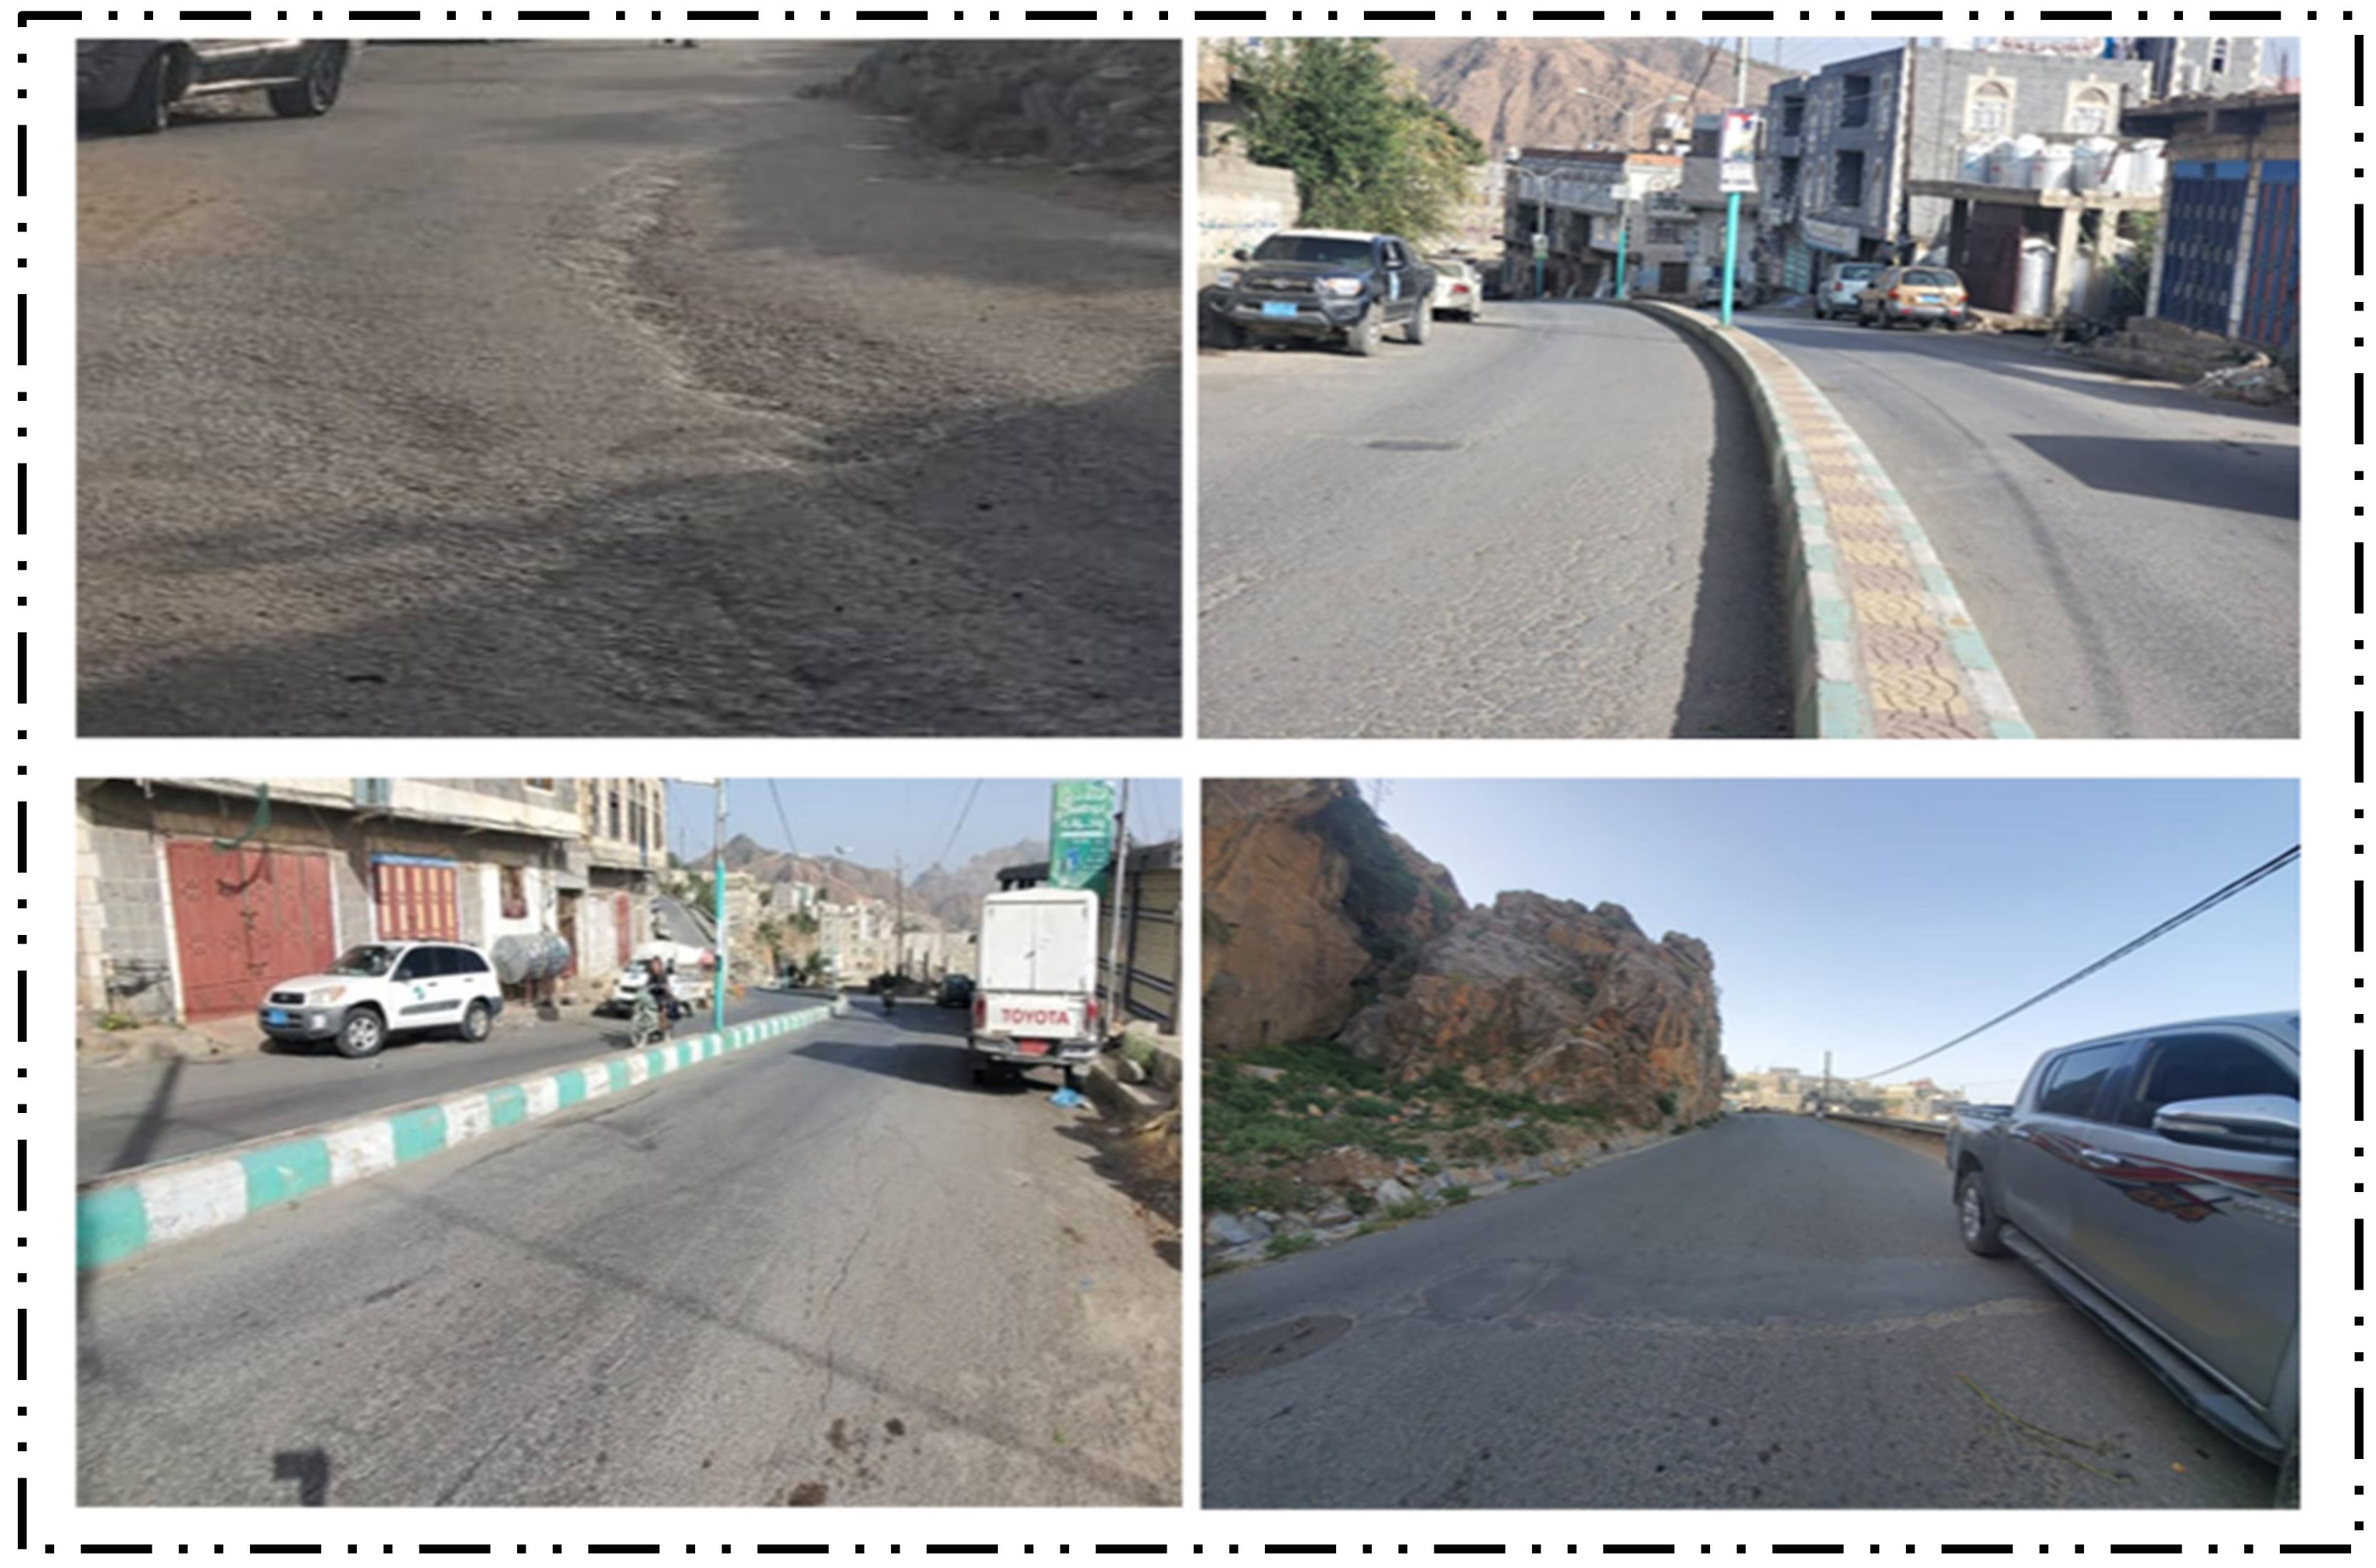
The suggested low-cost pavement maintenance management system (PMMS) includes the basic elements of a common PMMS: defining the roadway network and breaking it into manageable segments; creating an inventory for each segment; gathering pavement conditions; determining the maintenance activity required; developing a method for prioritizing segments; and documenting and reporting results. This system was implemented on a road network segment in the city of Hajjah, Yemen. Yemen is a developing country that lacks a proper and strategic maintenance plan and has a limited budget for road evaluation and maintenance. Hajjah is a small city in a mountainous area of northern Yemen without any systematic road maintenance strategies.
Figure 1 illustrates some of the road segment statuses that were investigated.
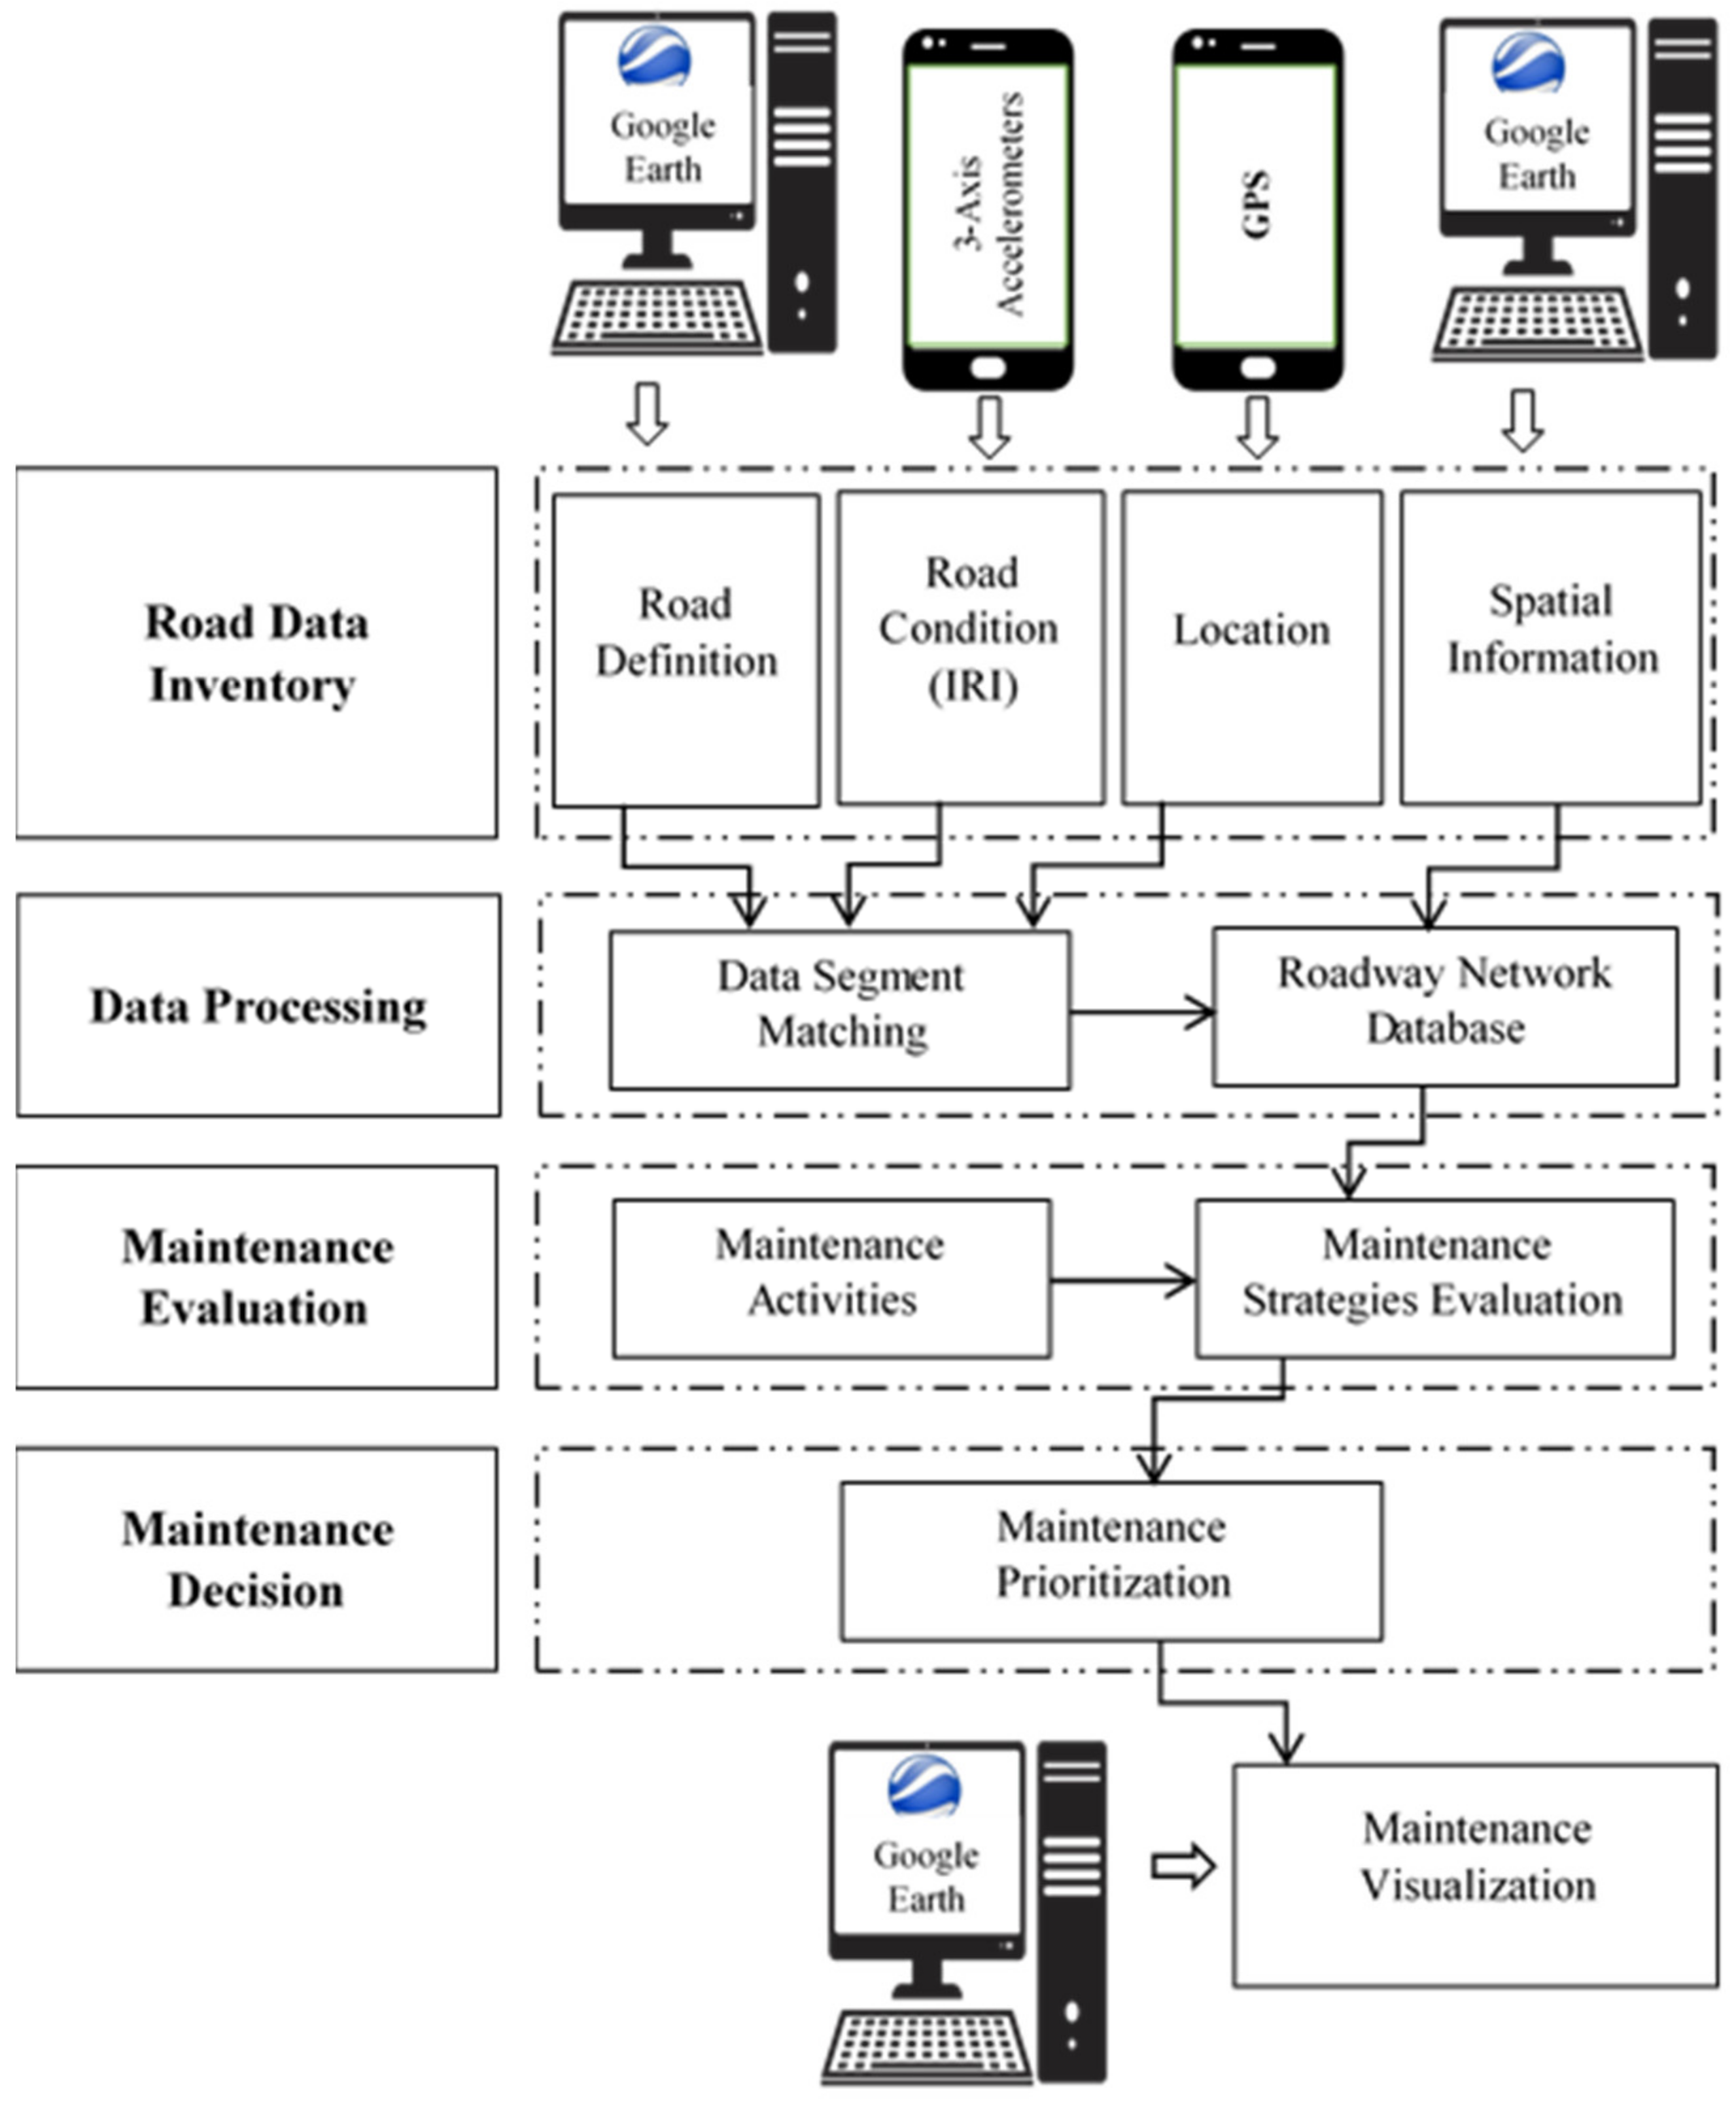
In this study, the implementation of maintenance to the Hajjah pavement network was developed with a systematic procedure as described above. The systematic procedure framework is presented in
Figure 2.
3. Network Coding
The Hajjah road network was classified functionally into three categories:
Major Roads: high-traffic roads that pass through the whole city.
Main Roads: medium-traffic collector roads.
Local Access Roads: low-traffic local roads.
Each road was divided into smaller manageable sections. A road does not always have consistent characteristics and therefore does not require the same maintenance treatment throughout its entire length. To identify these segments, the boundary between two segments was defined according to one of the following factors:
A change in the number of traffic lanes.
A change in pavement type.
A change in traffic patterns or volume.
Roadway intersections.
4. Road Inventory Data
It is important to collect and keep an accurate and reliable database for a particular road network. Data were collected to characterize each segment accurately. For this study, the data were collected and extracted from the city’s General Corporation of Roads and Bridges as well as an internet and field survey. The inventory data for each section included the road name, the coding of the segment, the coordinates for the beginning and end of the segment, the number of lanes, the pavement type, and the segment length and width.
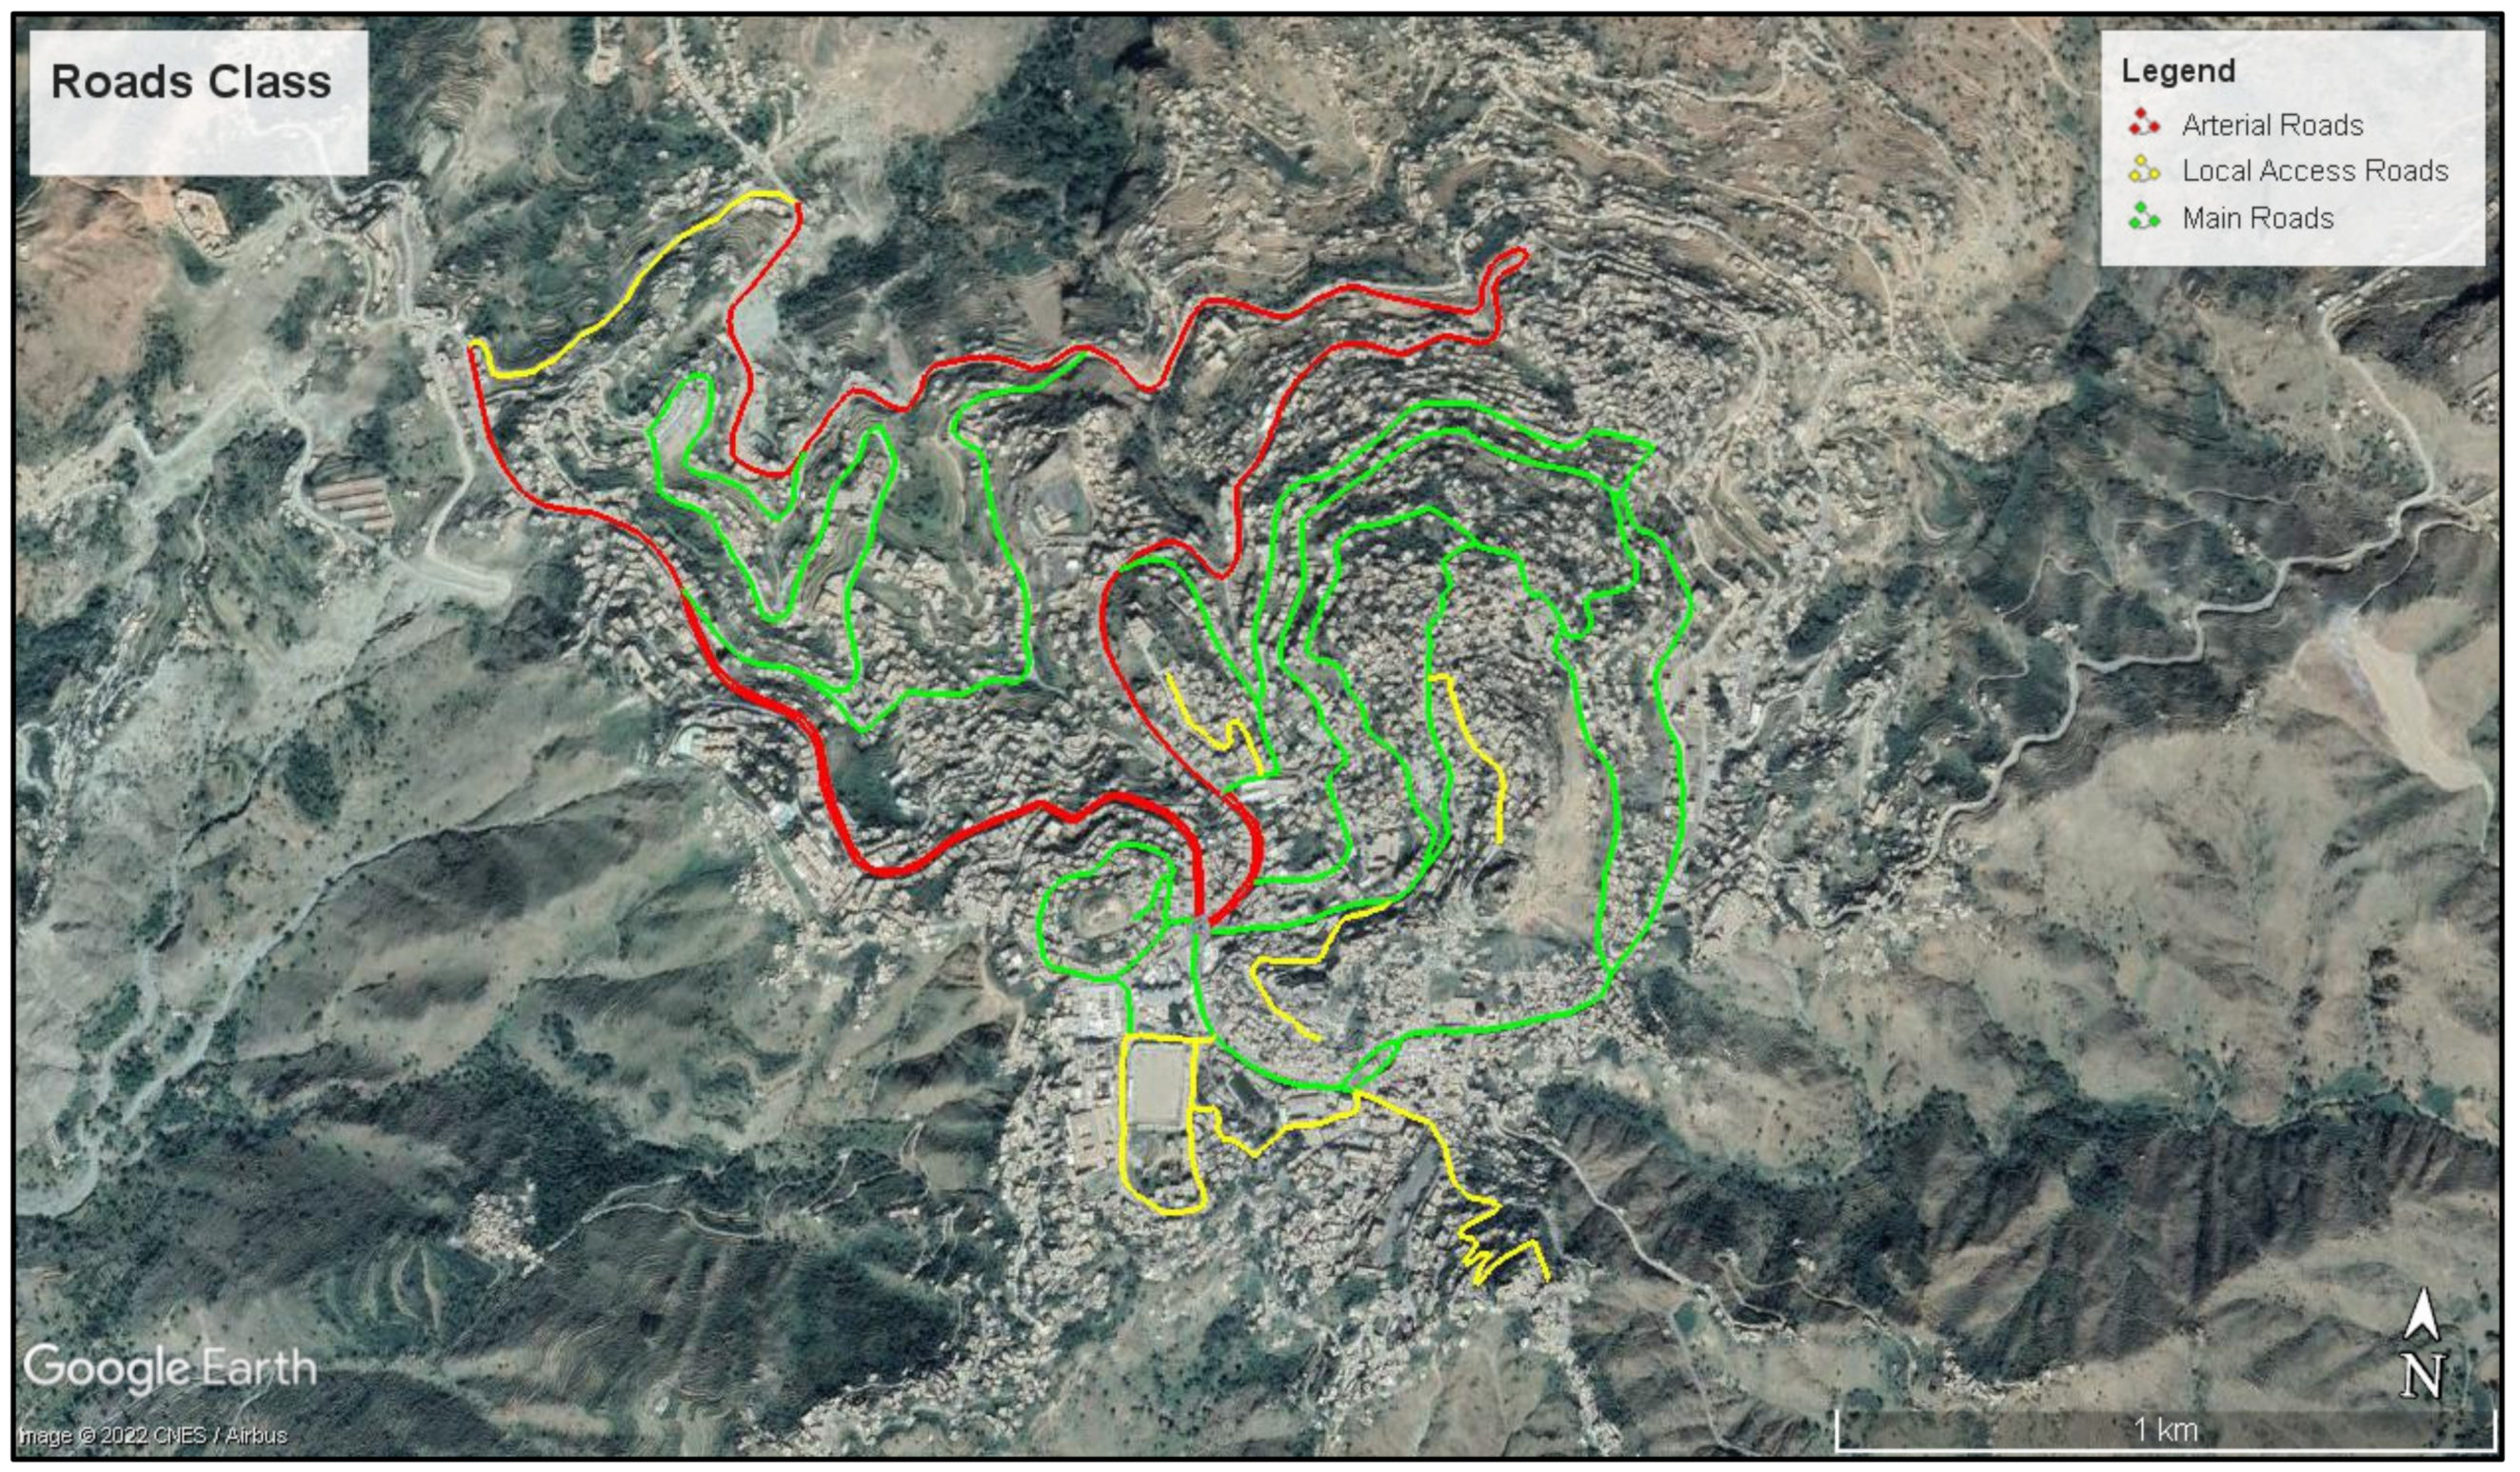
The Google Earth platform can be used to integrate, analyze, and represent a road network’s inventory information. The main component that distinguishes Google Earth from other data systems is how data are stored and accessed. The standard Google Earth functions include thematic mapping, charting, manipulation, and simultaneous access to several databases. Visualization helps users deal with problems related to the dimensions of space and time through thematic maps rather than dimensionally restricted data graphs and tables.
A map of the Hajjah road network is presented in Google Earth, with color-coding based on the functional classification of the roads. Each road was divided into segments depending on the aforementioned factors. Road segment coding was then established. Subsequently, the start and end coordinates were defined.
Figure 3 shows the Hajjah road network on Google Earth.
5. Road Condition Data
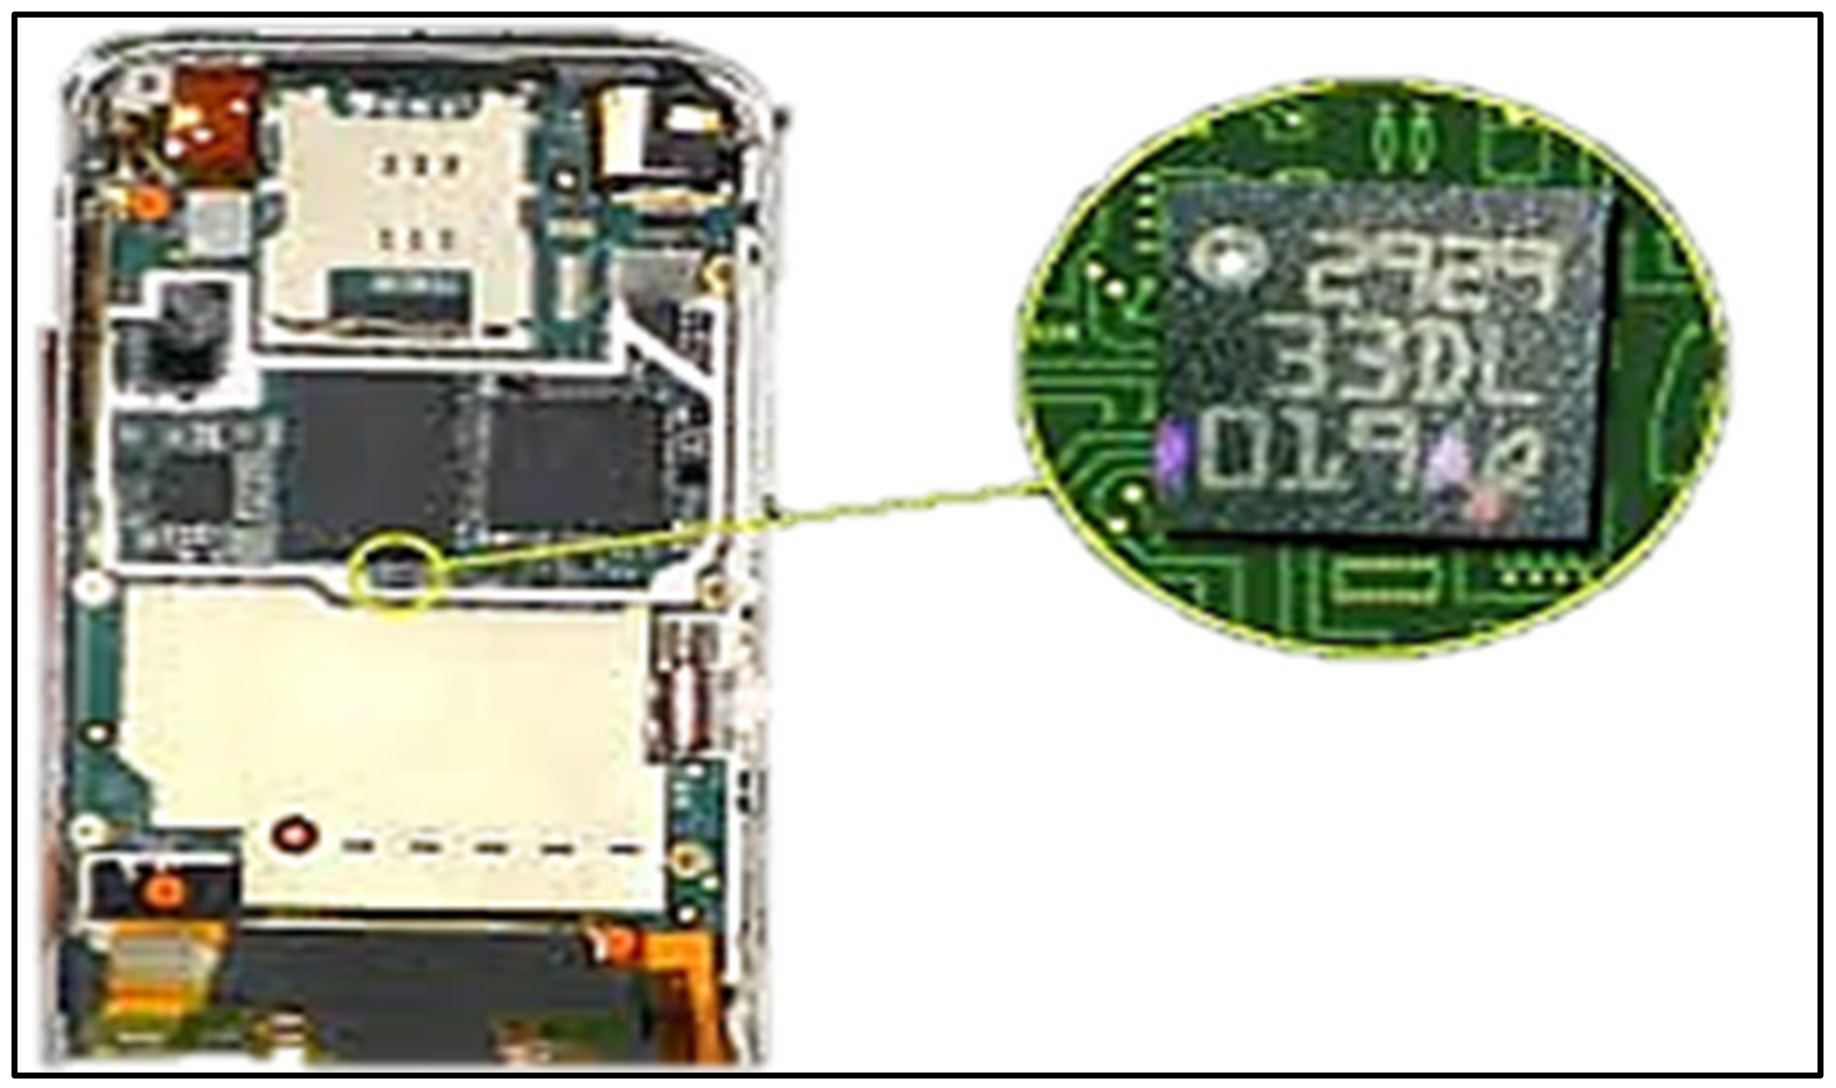
Since many existing pavement survey methods can be costly and labor-intensive, there is a need for simple and low-cost tools to facilitate the evaluation of pavement conditions with limited resources. To address this need, a smartphone application was utilized to assess pavement conditions. Smartphones contain accelerometers made of piezoelectric sensors, which can measure acceleration on the x, y, and z axes. Capable of measuring a large number of data points per second, accelerometers are very small and require very little power. A typical accelerometer is shown in
Figure 4.
Road Lab Pro is a smartphone application created to measure the road roughness and monitor the road surface quality. This application was designed as a data collection tool for engineers by the World Bank in collaboration with the Beldor Center and Softteco [
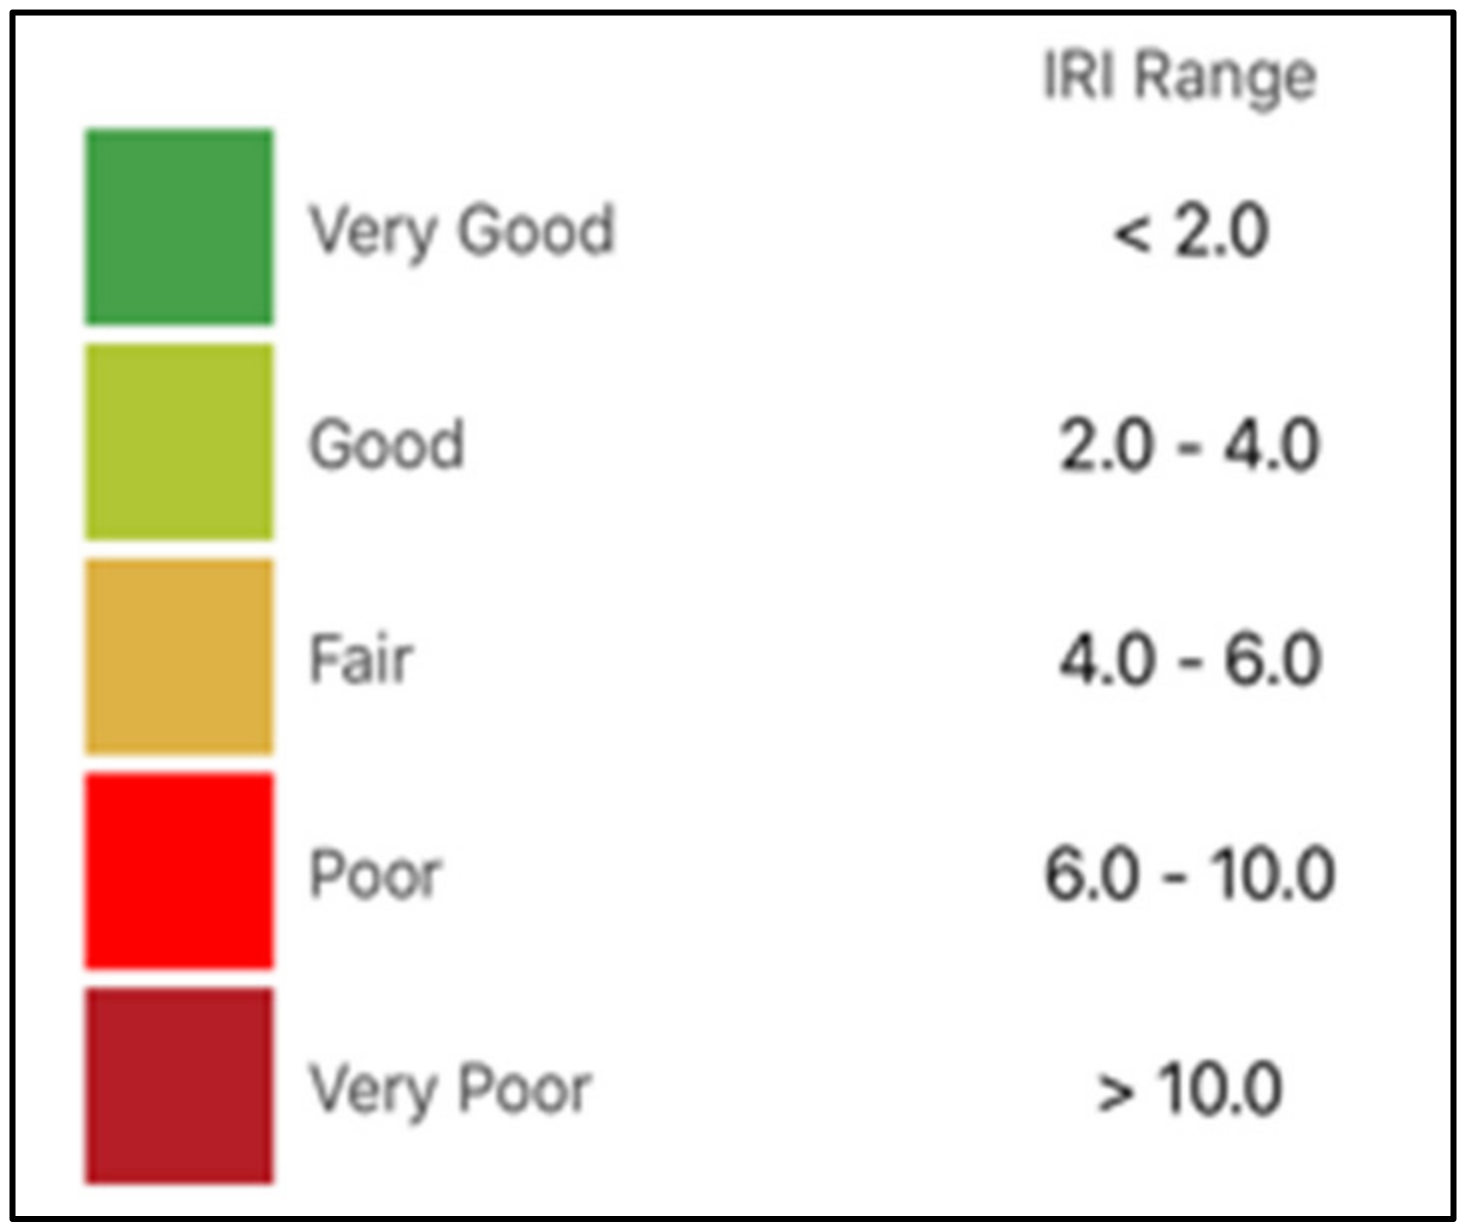
16]. It is used to record data from accelerometers, gyroscopes, and GPS devices to measure road roughness and create maps of road networks. To present the results graphically, a color-coding convention was adopted, as shown in
Figure 5.
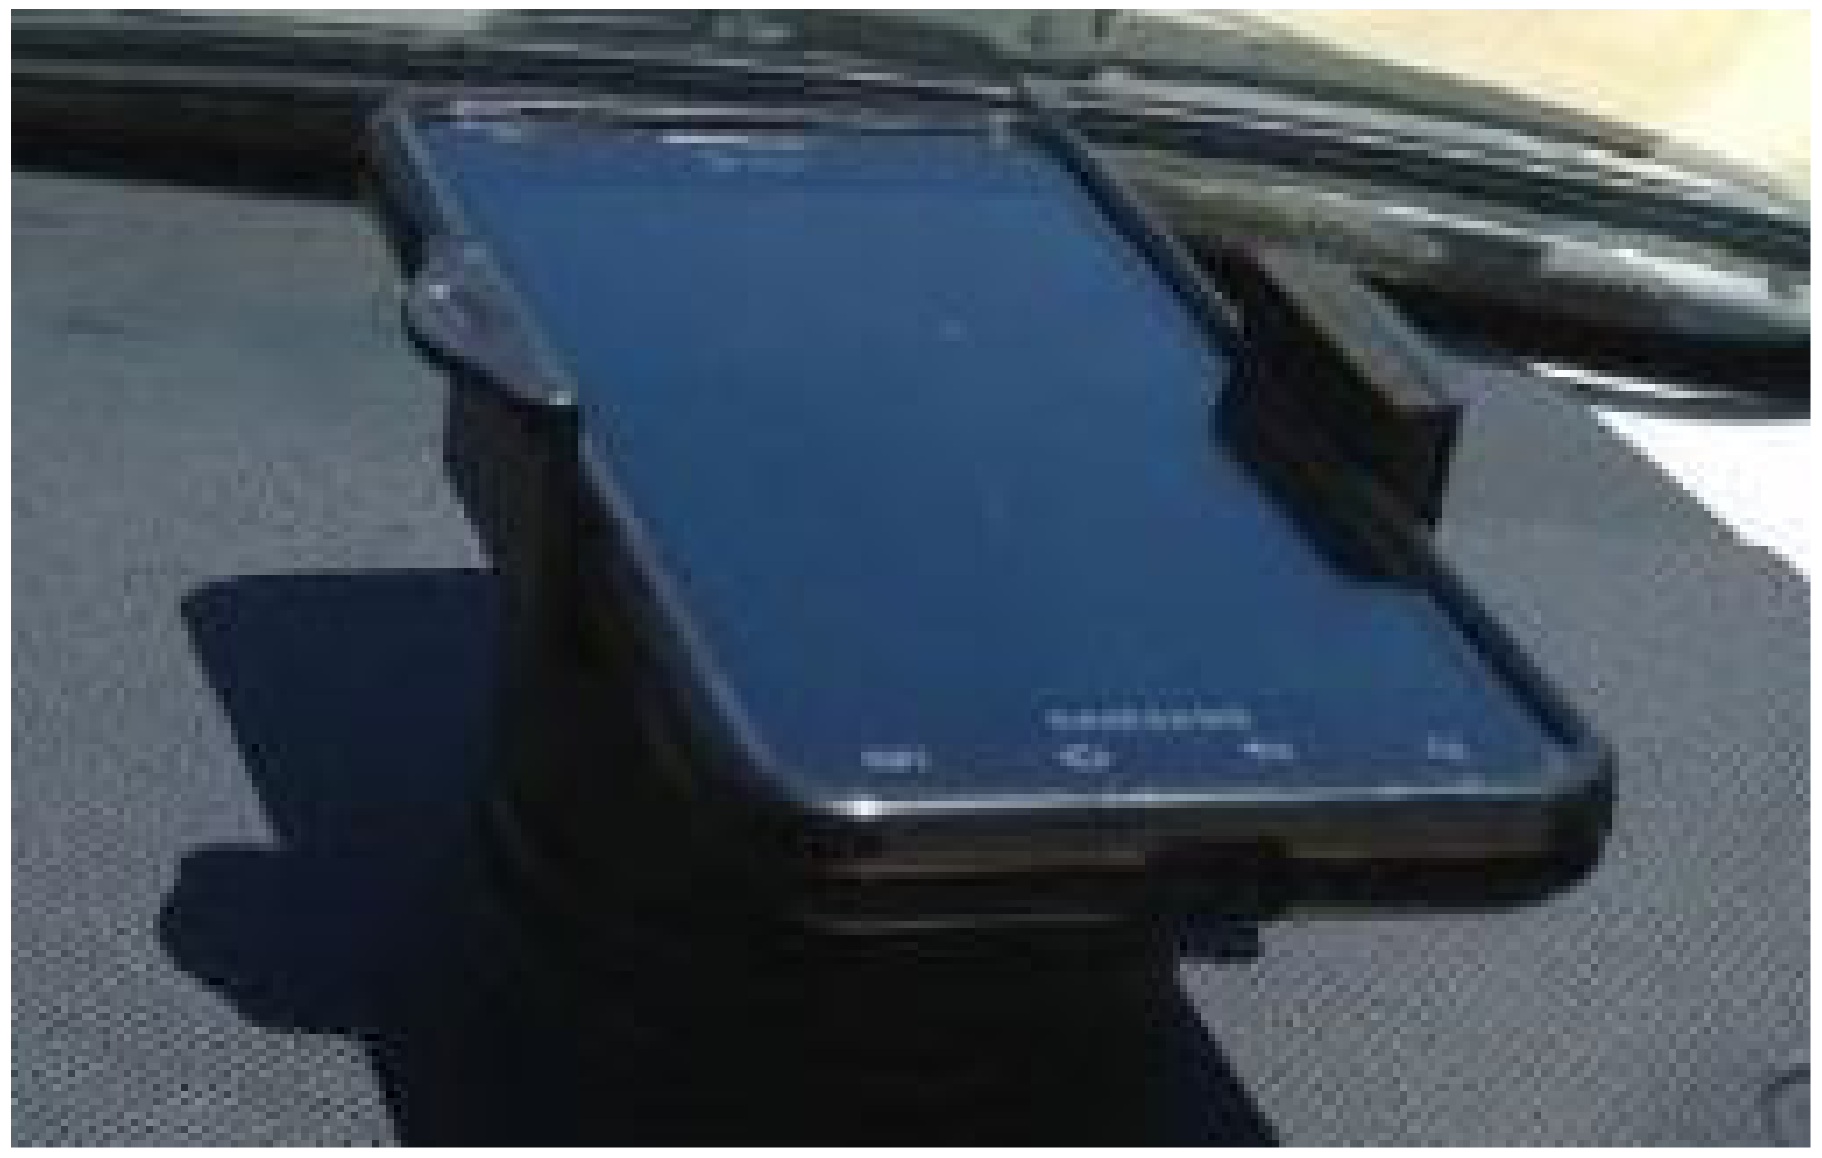
For this research, a smartphone (Samsung Galaxy S6 (SM-G920x)) was used. The Road Lab Pro application was installed on the smartphone. The type of vehicle and the speed range were selected from the main menu of the application. The selected vehicle was a Toyota Rav4 and the speed was set between 20 and 60 km/h. After the setting process, the smartphone was mounted on the dashboard of the vehicle, as seen in
Figure 6.
The smartphone application was then run, and a driver drove the vehicle at a predetermined speed of 20–60 km/h. A predetermined segment of roads was recognized using Google Earth, which was also used to determine the spatial information.
The application used the three-axis accelerometer and the GPS in the smartphone to measure the IRI automatically. The collected data were stored in comma-separated value (CSV) and keyhole markup language (KML) file formats. The KML files could be used by Google Earth to display the data and the CSV files could be opened by Excel for further analysis. Collected data were then zipped into the smartphone and could be exported from the smartphone by email, by uploading to Dropbox, or via a cable connected to a computer.
Based on the spatial road database that was extracted from Google Earth, there were many options for enhancing the data and adding attributes such as road class, road width, segment length, and others.
The measured road map was uploaded to Google Earth to visualize it and attach the measurement values for analysis. The road segment lengths were adjusted to correspond with the previous classification of road segments and the start/end coordinates were redefined. The IRI values were also aggregated and matched to road segments. Based on this arrangement, the data for each road segment included the coding, road class, number of lanes, length, width, start and end coordinates, and IRI value. All these data were exported to an Excel file, as illustrated in
Table 1.
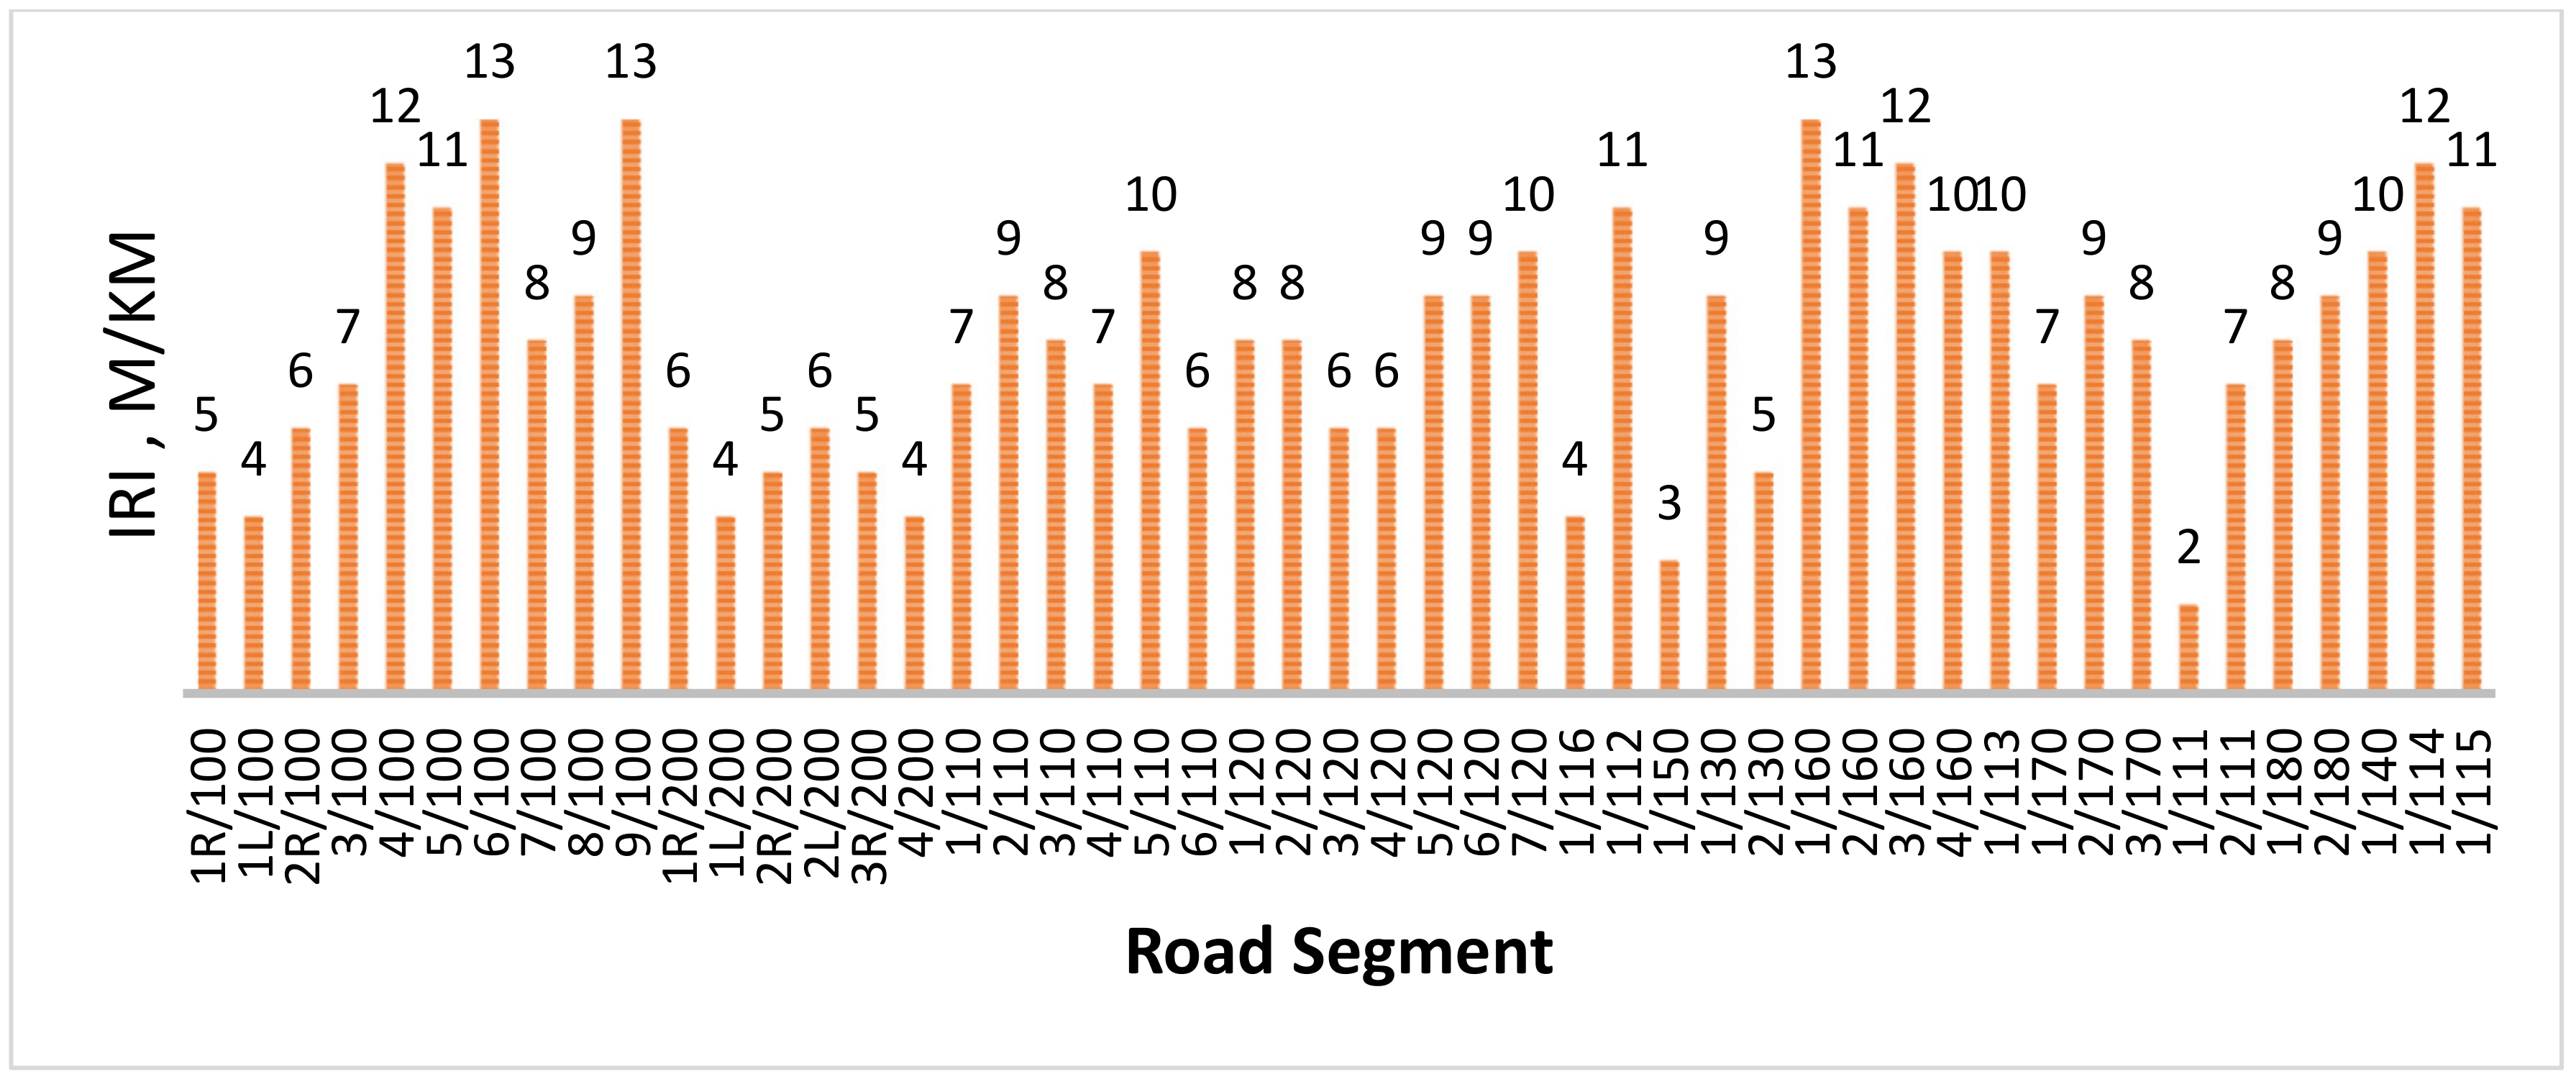
Figure 7 presents the IRI values of the segments that were captured from the field using the smartphone application.
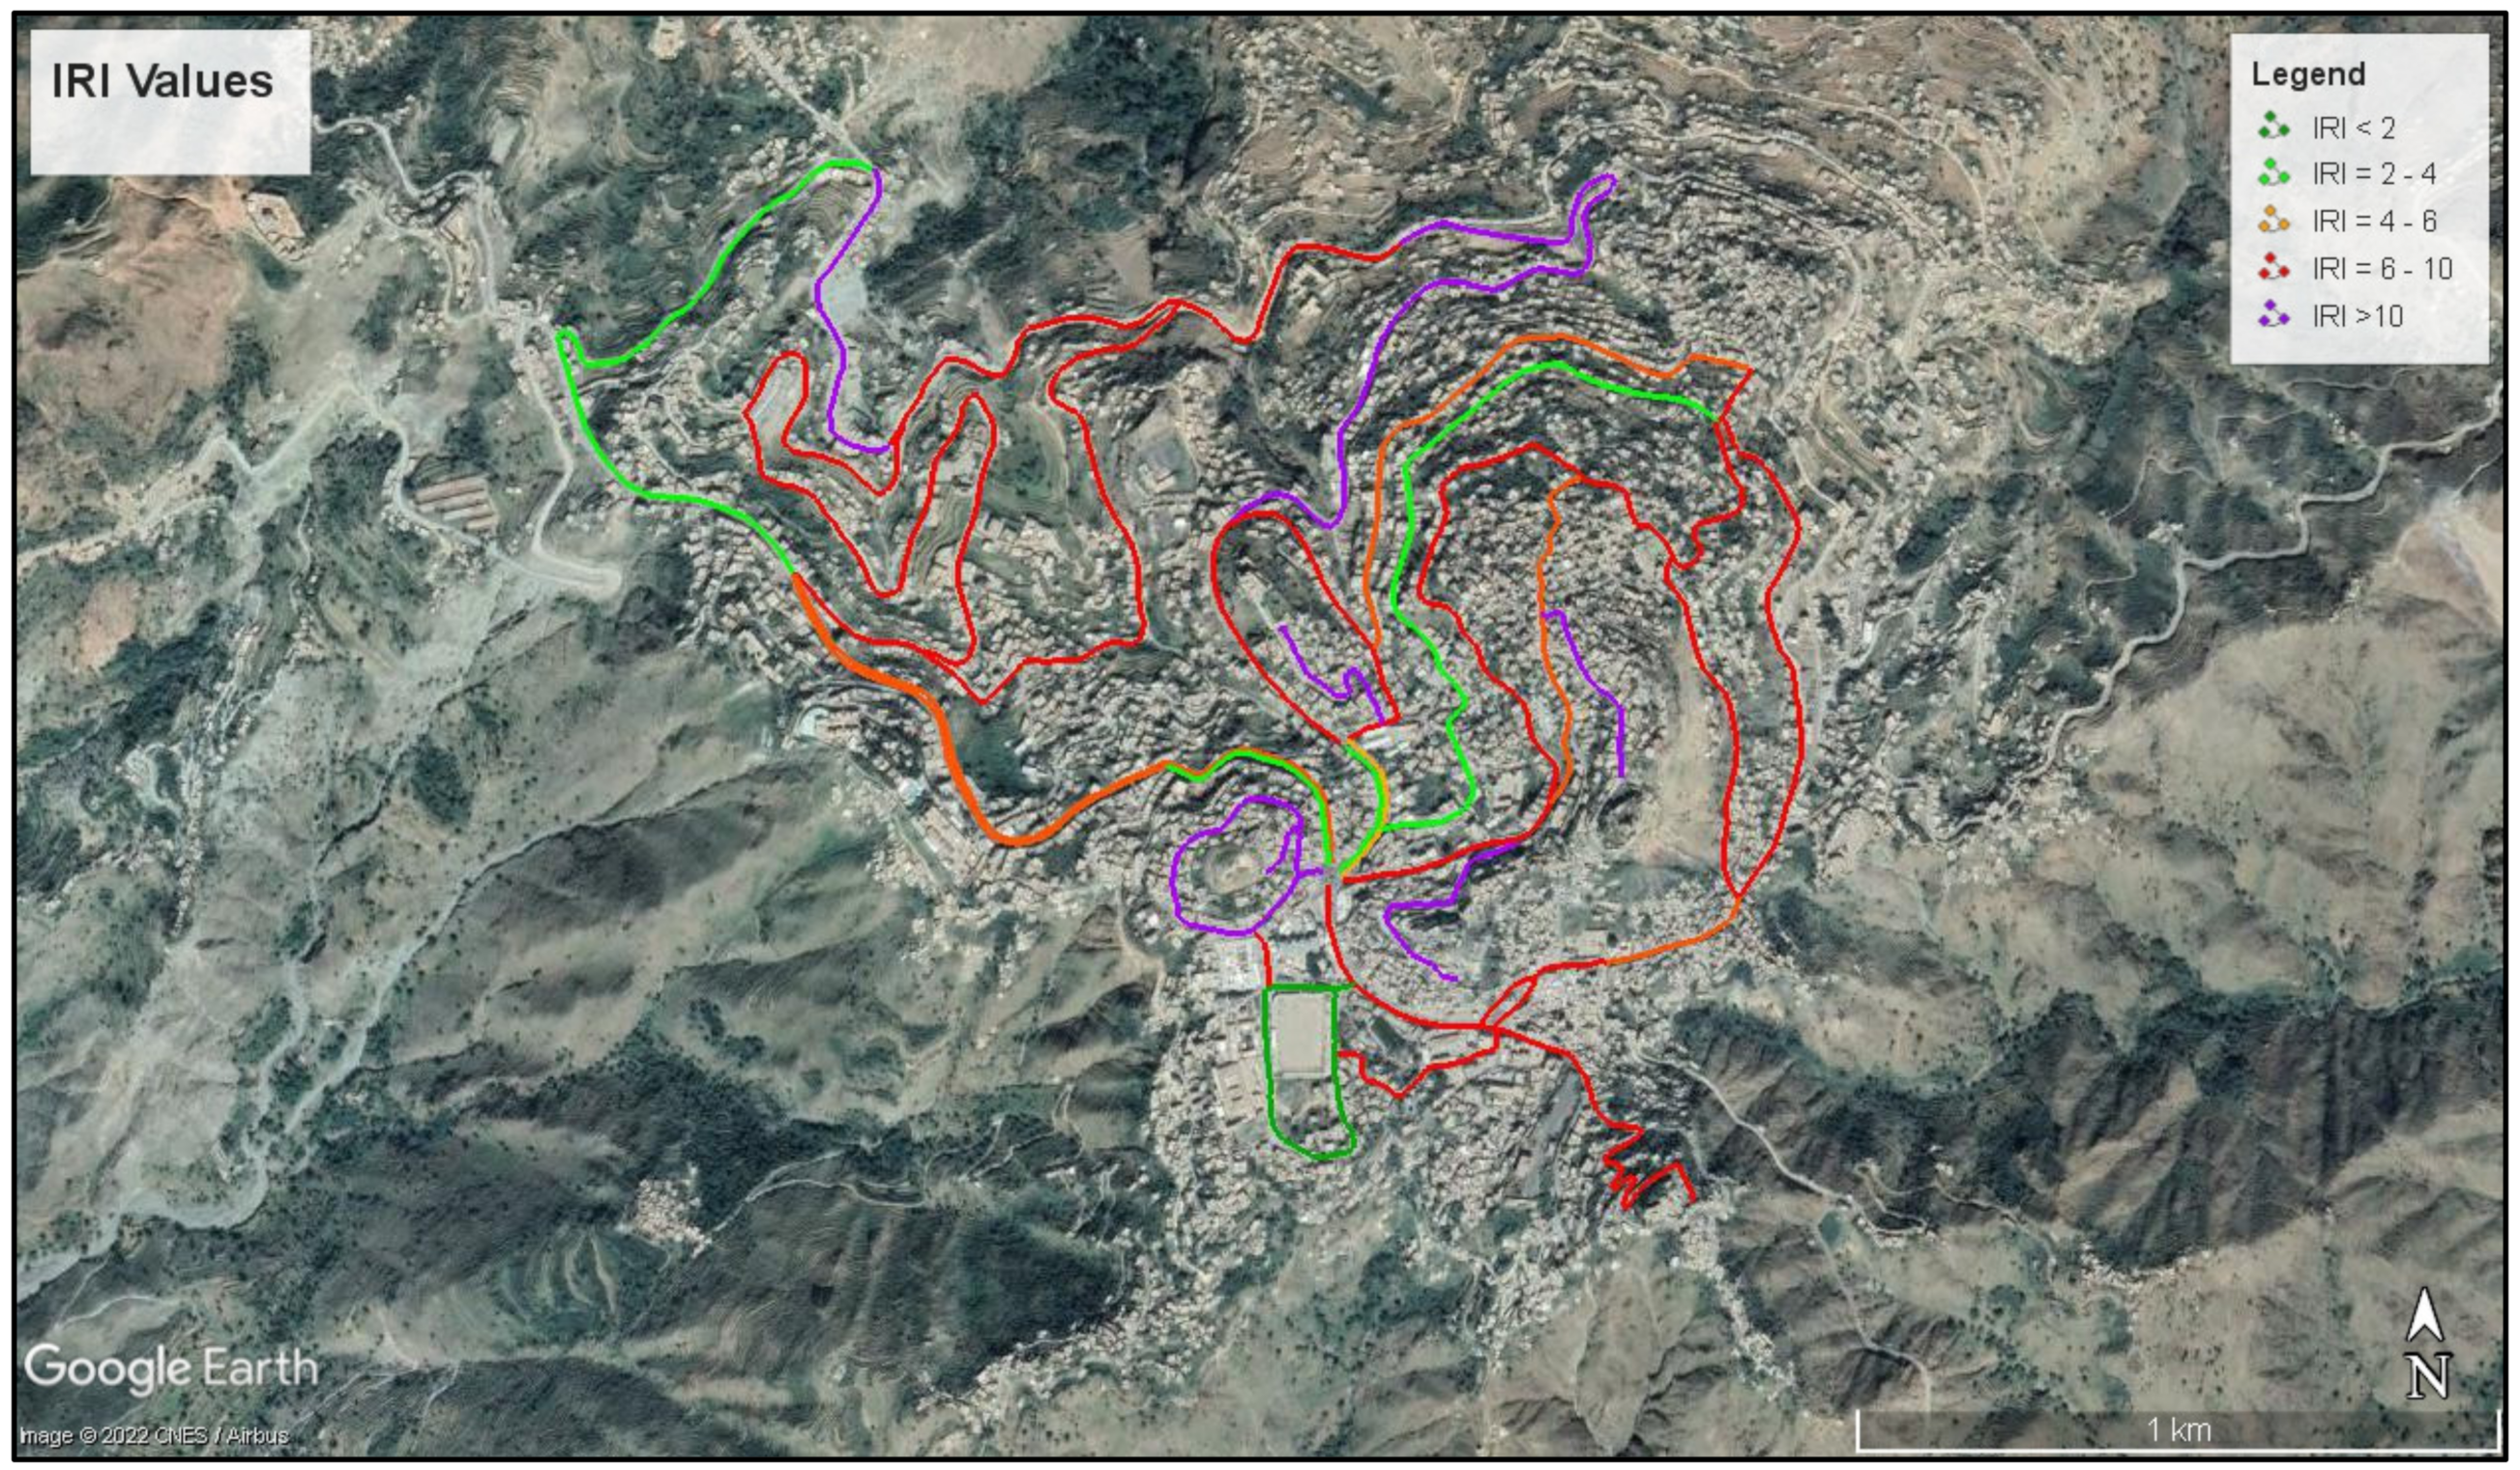
The IRI values for road segments can also be represented by a color-coded map on the Google Earth platform, as shown in
Figure 8.
6. Maintenance Activities
The maintenance decision criteria established for the developed maintenance management system were based on the collected IRI values for each segment. Generally, the maintenance strategies selected ranged from crack seals, slurry seals, and thin asphalt overlays to thick asphalt overlays. In other words, the selected type of treatment depended on the IRI values. The decision criteria for the maintenance activities were established as follows:
IRI < 2: the deterioration is very slight and there is no need for any treatment.
2 < IRI < 4: the pavement deterioration is mainly due to the presence of localized distresses such as cracks and potholes. This requires routine maintenance such as crack sealing and patching.
4 < IRI < 6: the pavement deterioration is major and the pavement surface needs treatment that reduces the rate of deterioration; therefore, preventive maintenance such as a slurry seal is selected.
6 < IRI < 10: in this case, enhancing ride quality is needed, so thin asphalt overlaying is required.
IRI > 10: this indicates that the pavement surface has become old; thus, a thick asphalt overlay might be the right choice.
The suggested pavement maintenance activity based on the IRI values is illustrated in
Table 2.
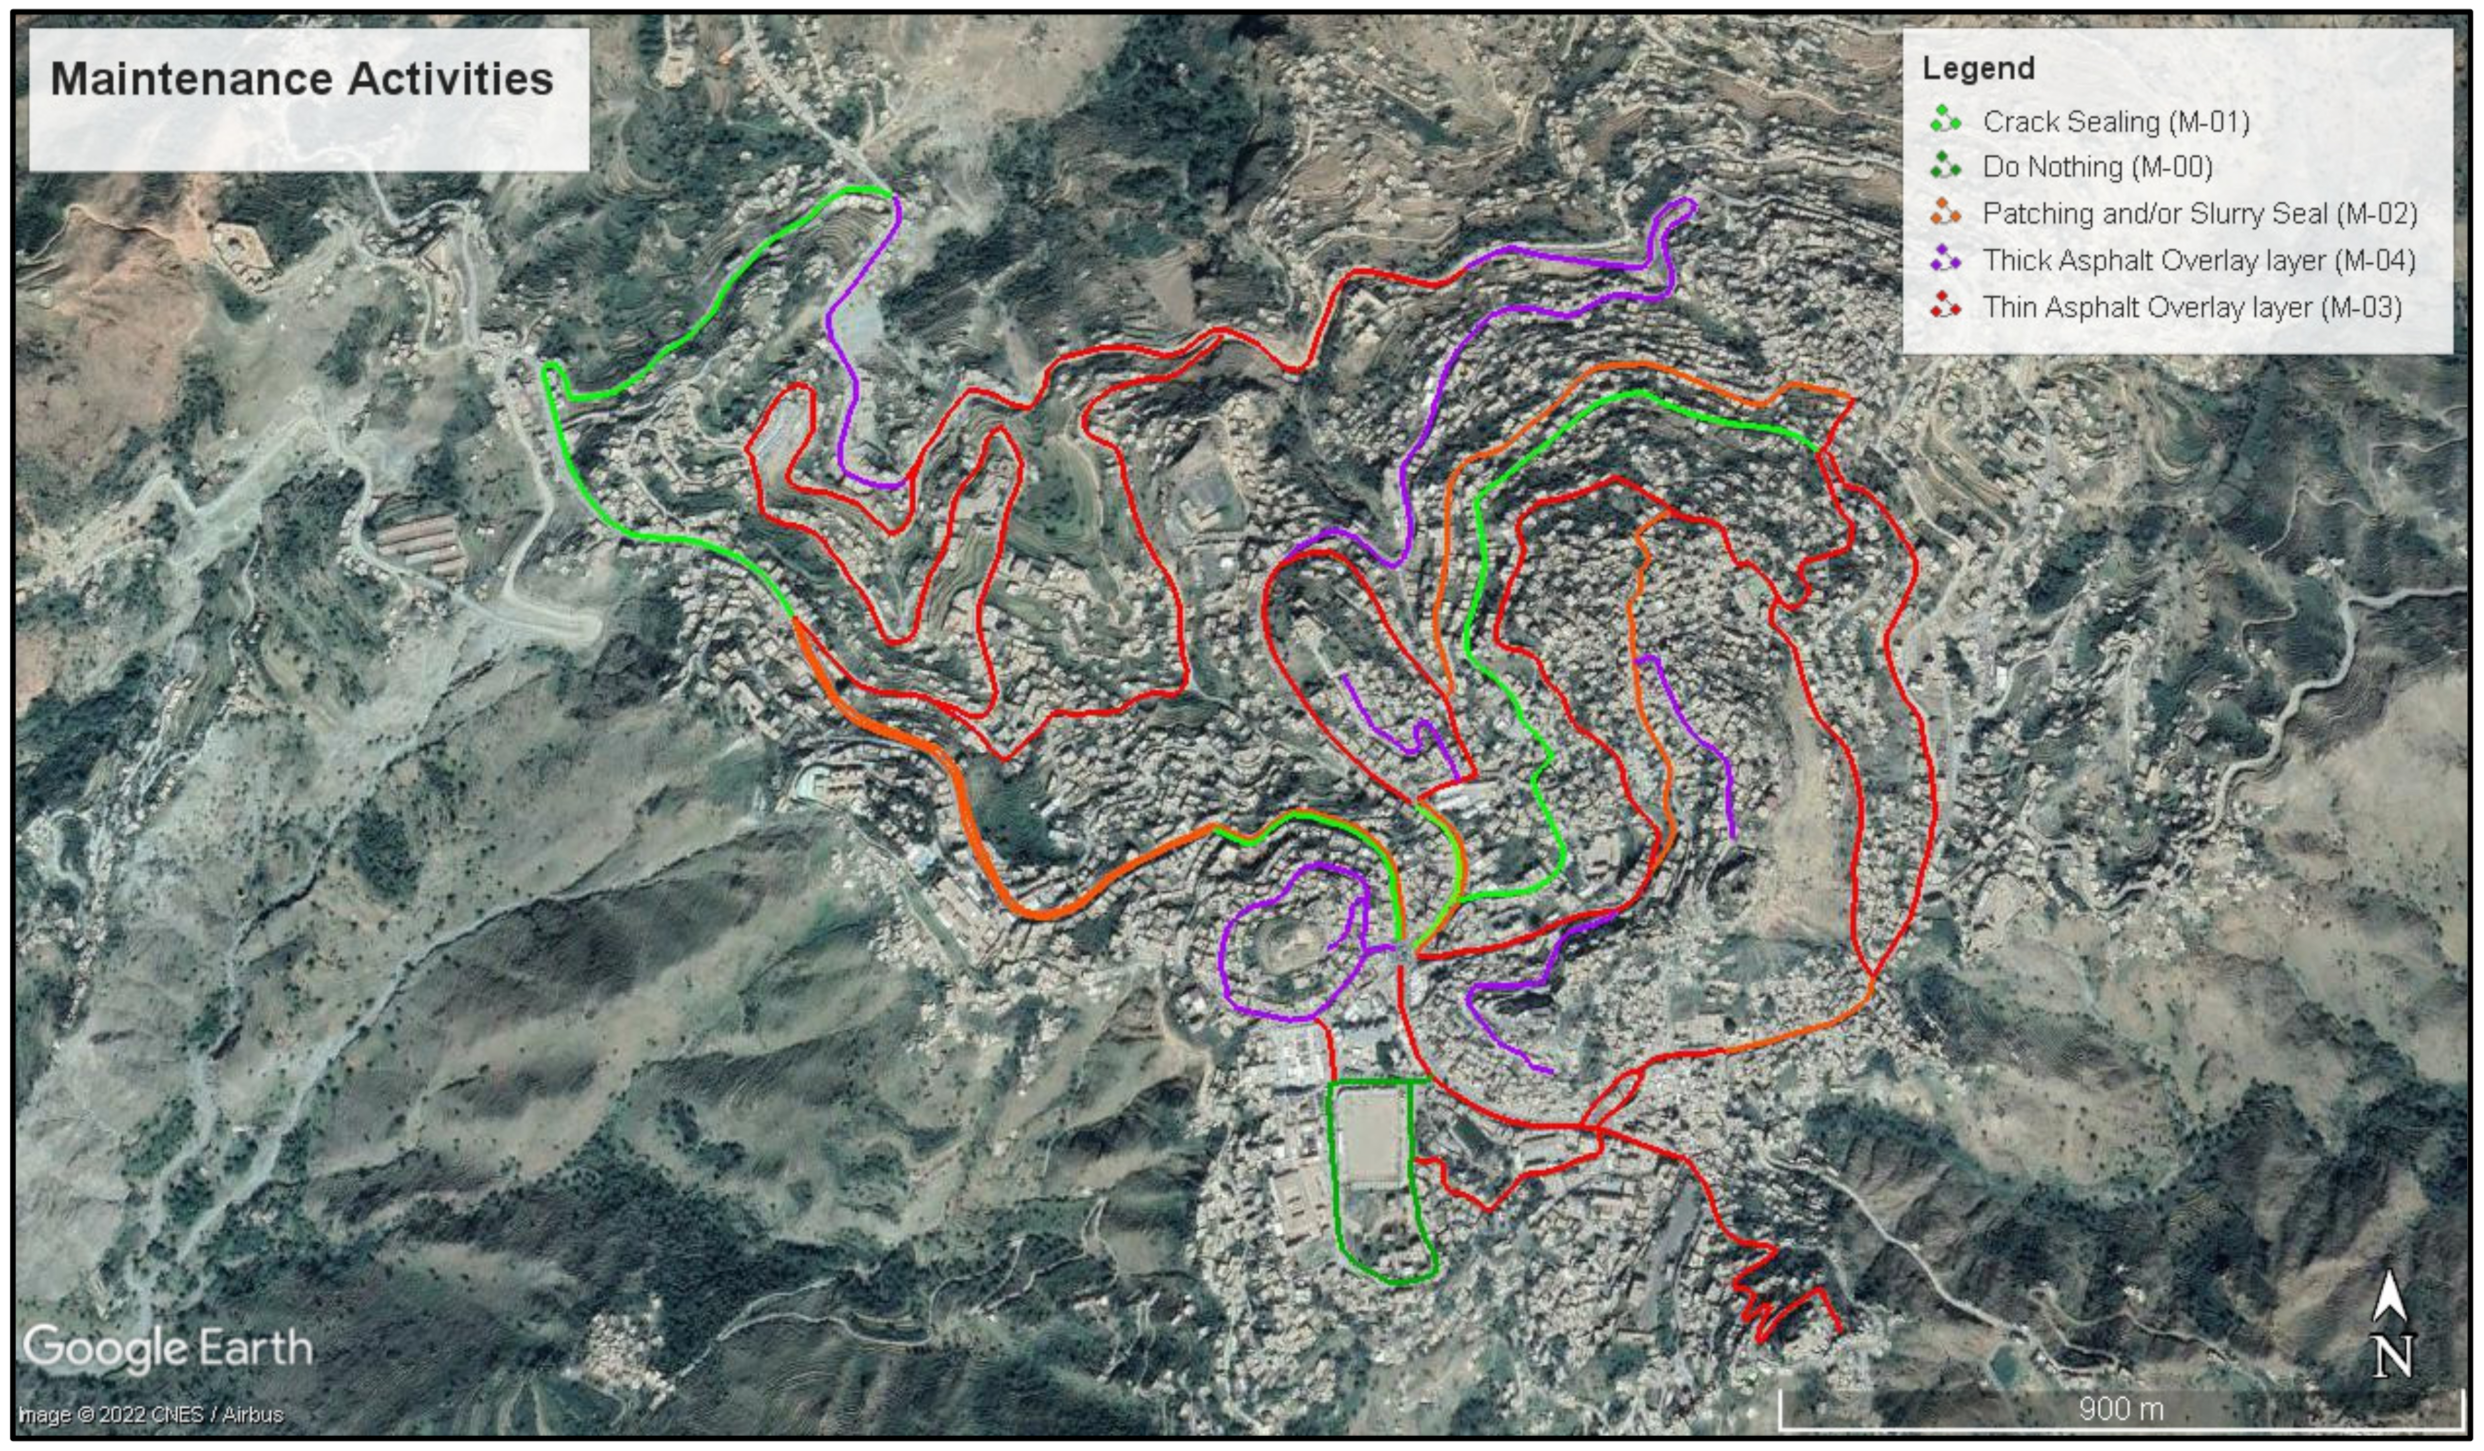
Google Earth was used to reflect the type of maintenance selected for each segment, as presented in
Figure 9.
The unit costs of maintenance activities include labor, equipment, and materials. These were obtained from the city’s General Corporation of Roads and Bridges, as presented in
Table 3.
The total required maintenance cost calculated for each segment of the road network is presented in
Figure 10.
7. Priority Setting Procedure
Different types of priority methods are commonly used. These models range from simple subjective rankings to true optimization. It was decided, however, to use a parameter-based priority ranking method. This method is relatively simple and aims to answer the basic questions of where to apply maintenance and in which order. For this purpose, the dependable factors in the decision analysis should be specified. In this study, the selected factors were roughness, traffic, road class, special factors (to emphasize the importance of the selected roads), and the maintenance budget. The simple priority method evaluates the following decision form which has m alternatives (road segments) associated with n attributes (dependable factors):
where:
For decision-making issues, the priority method usually uses subjective weights defined by the decision-makers. In this situation, a set of weights
W = (
w1,
w2,…,
wn), Σ
w =1, was determined by the decision-makers. One of the techniques for determining objective weights is the Shannon entropy method [
17].
The calculation process for the Shannon entropy method is below:
- (1)
Construct the normalized decision
ri,
- (2)
Construct the vector of the Shannon entropy
e = (
e1,
e2, …,
ej, …,
en),
- (3)
Calculate the vector of diversification degrees
d = (
d1,
d2, …,
dj, …,
dn),
- (4)
Calculate the vector of criteria weights
W = (
w1,
w2, …,
wj, …,
wn),
For this study, the weight calculation process was performed using the Shannon entropy method and MS Excel software.
Table 4 shows the weight factors for the prioritization.
The following model determined the maintenance priority for each segment:
where:
PI = priority index.
TF = traffic factor.
FC = road classification factor.
SR = special factor to emphasize the importance of selected roads.
MF = maintenance budget factor.
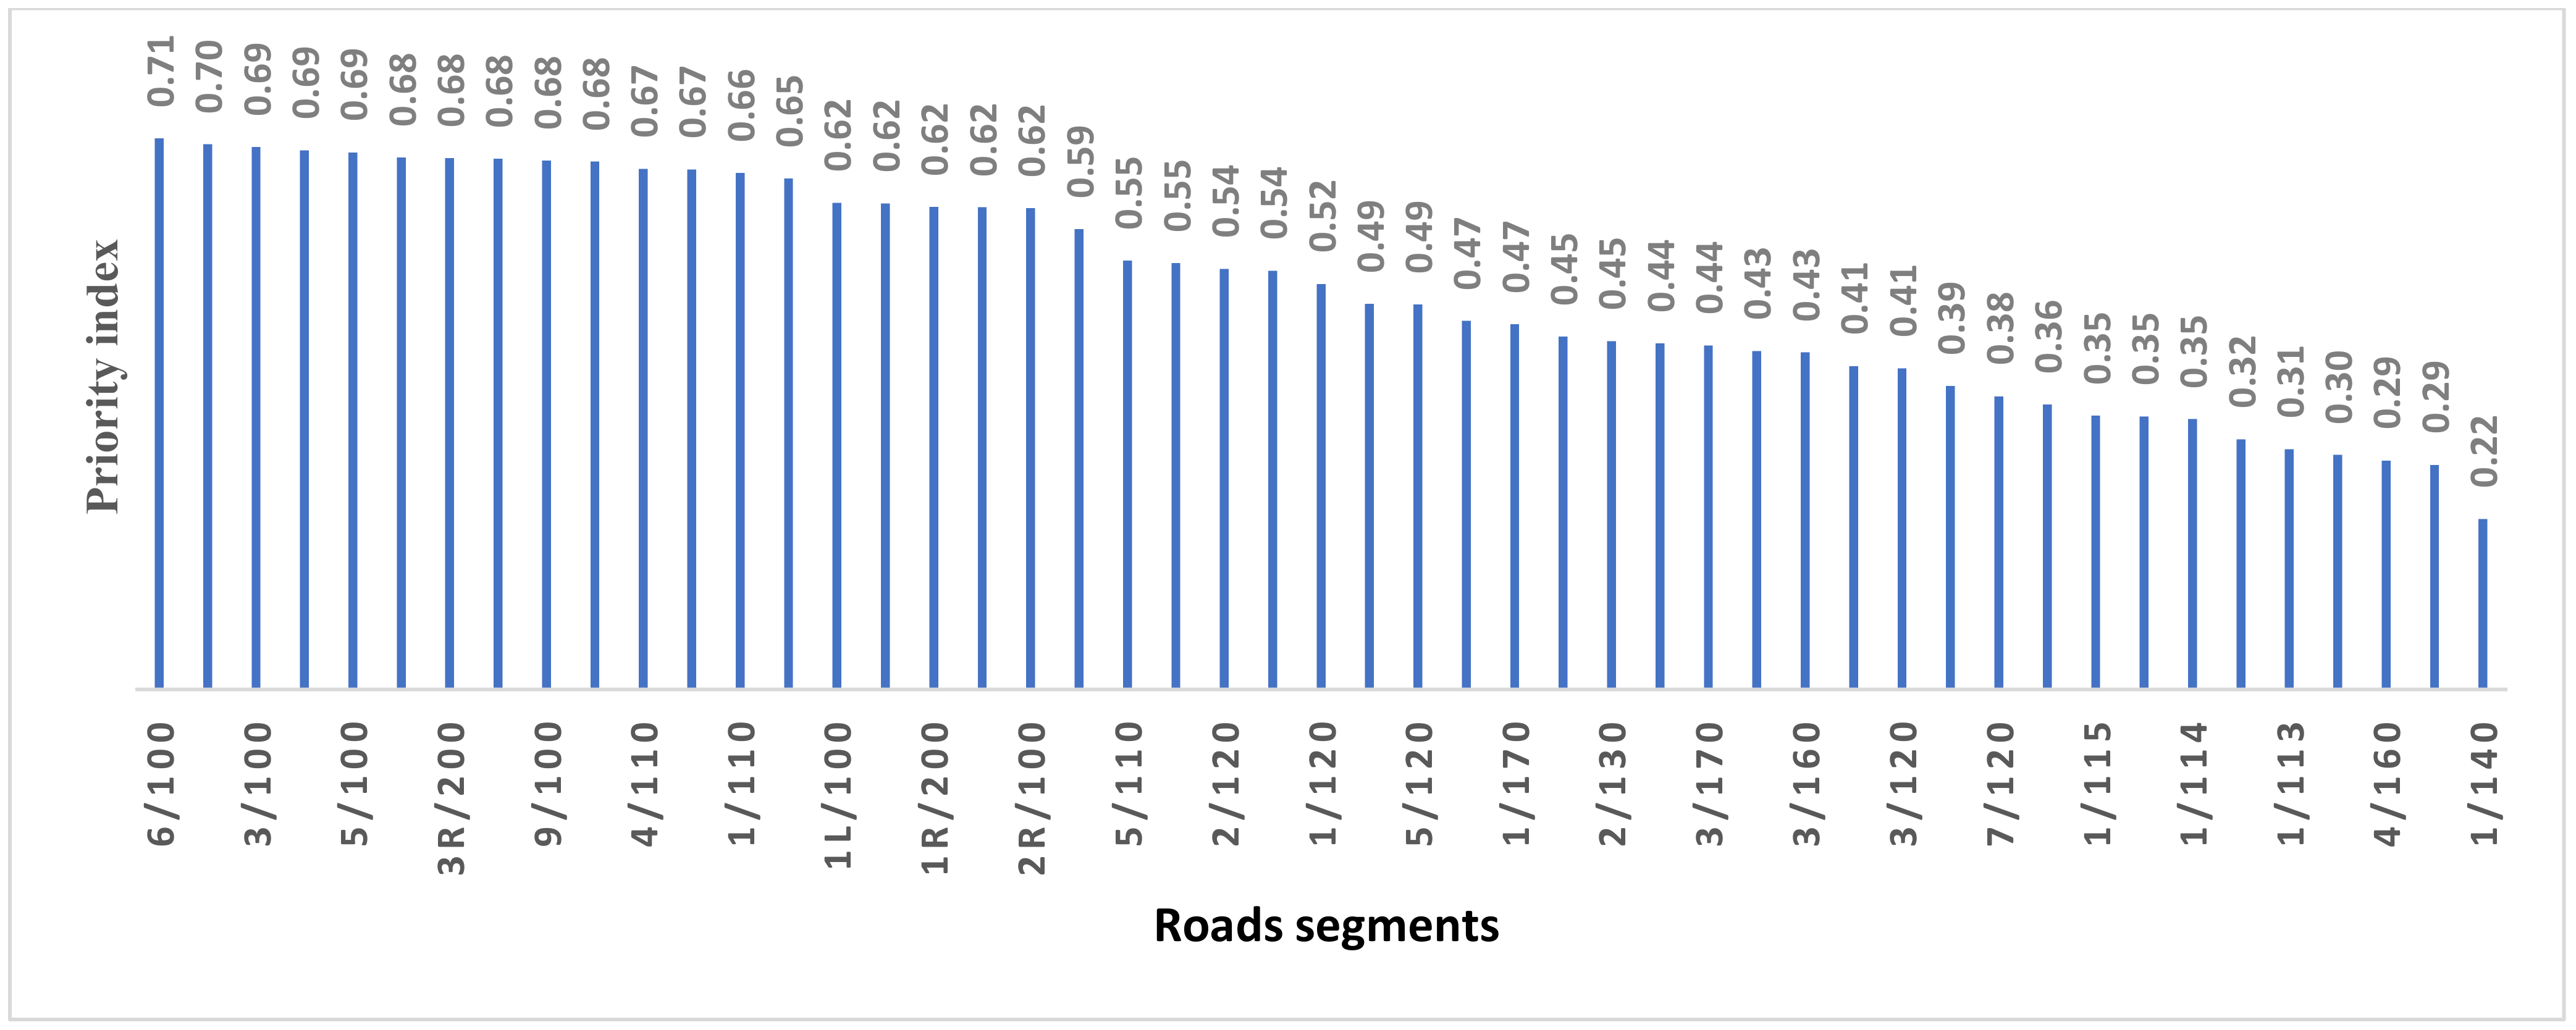
To decide on the specific segments that should be implemented first, the road segments were sorted according to their priority index in descending order.
Figure 11 presents the results of the calculated priority indexes of segments in descending order. As can be seen, the (6/100) road section had the highest priority index score, with 0.98, 0.99, 0.98, 0.97, and 0.32 for the traffic factor, road classification factor, special factor, roughness, and budget, respectively. The (1/140) road segment, on the other hand, had the lowest priority index score, with 0.33, 0.66, 0.33, 0.19, and 0.41 for the traffic factor, road classification factor, special factor, roughness, and budget, respectively.
8. Conclusions
This research proposes a simple low-cost PMMS utilizing a smartphone app and Google Earth for small to intermediate cities in developing countries. The system uses an Android application installed on a smartphone to measure the road surface roughness based on GPS and accelerometer sensors. Google Earth is utilized for the visual illustration of the road conditions and other analyses.
The proposed system was implemented in Hajjah, a city in Yemen. The results reveal that IRI measurements performed by the app and Google Earth can provide a low-cost solution for cities such as Hajjah to manage their road network at an acceptable level. Google Earth is an excellent tool that can display road network conditions and all other attributes related to road maintenance management.
The following conclusions can be drawn from these results:
Smartphones with built-in accelerometers, gyroscopes, and a GPS may be used to gather road data and assess road conditions. Smartphones are being used as probe devices due to their low cost and ease of use, as well as their potential for a large population coverage.
Google Earth, which is user-friendly, is an excellent application for presenting maintenance data and subsequently making maintenance strategy decisions.
A priority index can be established for each road segment in order to identify which segments should be implemented initially.
Thematic maps of the output maintenance information can be visually shown using Google Earth.
Any country, especially developing countries with limited budgets for producing maintenance studies, can employ this approach, as it allows for the easy and cost-effective production of road maintenance studies.
Author Contributions
Conceptualization, formal analysis, funding acquisition, investigation, methodology, project administration, and resources, A.I.A.-M.; visualization, A.I.A.-M. and A.H.A.-Q.; writing—original draft, A.I.A.-M. and A.H.A.-Q.; writing—review and editing, A.H.A.-Q. and A.I.A.-M. All authors have read and agreed to the published version of the manuscript.
Funding
The authors would like to acknowledge the support provided by the Researchers Supporting Project Number (RSP2022R424), King Saud University, Riyadh, Saudi Arabia.
Institutional Review Board Statement
Not applicable.
Informed Consent Statement
Not applicable.
Data Availability Statement
Available upon request and with regulations.
Acknowledgments
The authors acknowledge King Saud University for providing the funding for this research paper.
Conflicts of Interest
The authors declare no conflict of interest.
References
- Salih, J.; Edum-Fotwe, F.; Price, A. Investigating the Road Maintenance Performance in Developing Countries. World Acad. Sci. Eng. Technol. Int. J. Civ. Environ. Struct. Constr. Archit. Eng. 2016, 10, 472–476. [Google Scholar]
- Hokam, V.S.; Landge, V.S. Establishment of pavement maintenance management system in industrial area. Int. J. Res. Publ. 2015, 4, 1–9. [Google Scholar]
- Plessis-Fraissard, M. Planning roads for rural communities. Transp. Res. Rec. 2007, 1989, 1–8. [Google Scholar] [CrossRef]
- Gamage, D.; Pasindu, H.R.; Bandara, S. Pavement Roughness Evaluation Method for Low Volume Roads. In Proceedings of the Eighth International Conference on Maintenance and Rehabilitation of Pavements, Singapore, 27–29 July 2016; pp. 1–10. [Google Scholar]
- Douangphachanh, V.; Oneyama, H. A study on the use of smartphones for road roughness condition estimation. J. East. Asia Soc. Transp. Stud. 2013, 10, 1551–1564. [Google Scholar]
- Douangphachanh, V.; Oneyama, H. Exploring the use of smartphone accelerometer and gyroscope to study on the estimation of road surface roughness conditions. In Proceedings of the 2014 11th International Conference on Informatics in Control, Automation and Robotics (ICINCO), Vienna, Austria, 1–3 September 2014; Volume 1, pp. 783–787. [Google Scholar]
- Alessandroni, G.; Klopfenstein, L.C.; Delpriori, S.; Dromedari, M.; Luchetti, G.; Paolini, B.; Bogliolo, A. Smartroadsense: Collaborative road surface condition monitoring. In Proceedings of the 2nd IEEE SPS Italy Chapter Summer School on Signal Processing, Frascati, Italy, 7–11 July 2014; pp. 210–215. [Google Scholar]
- Islam, S.; Buttlar, W.G.; Aldunate, R.G.; Vavrik, W.R. Measurement of pavement roughness using android-based smartphone application. Transp. Res. Rec. 2014, 2457, 30–38. [Google Scholar] [CrossRef]
- Zeng, H.; Park, H.; Fontaine, M.D.; Smith, B.L.; McGhee, K.K. Identifying deficient pavement sections by means of an improved acceleration-based metric. Transp. Res. Rec. 2015, 2523, 133–142. [Google Scholar] [CrossRef]
- Hanson, T.; Cameron, C.; Hildebrand, E. Evaluation of low-cost consumer-level mobile phone technology for measuring international roughness index (IRI) values. Can. J. Civ. Eng. 2014, 41, 819–827. [Google Scholar] [CrossRef]
- Zeng, H.; Park, H.; Smith, B.L.; Parkany, E. Feasibility assessment of a smartphone-based application to estimate road roughness. KSCE J. Civ. Eng. 2018, 22, 3120–3129. [Google Scholar] [CrossRef]
- Yeganeh, S.F.; Mahmoudzadeh, A.; Azizpour, M.A.; Golroo, A. Validation of smartphone-based pavement roughness measures. arXiv 2019, arXiv:1902.10699. [Google Scholar]
- Chatterjee, A.; Tsai, Y.C. Training and testing of smartphone-based pavement condition estimation models using 3d pavement data. J. Comput. Civ. Eng. 2020, 34, 04020043. [Google Scholar] [CrossRef]
- Dong, D.; Li, Z. Smartphone sensing of road surface condition and defect detection. Sensors 2021, 21, 5433. [Google Scholar] [CrossRef] [PubMed]
- Al-Mansour, A.; Shukri, A. Correlation of Pavement Distress and Roughness Measurement. Appl. Sci. 2022, 12, 3748. [Google Scholar] [CrossRef]
- Available online: https://apps.apple.com/us/app/roadlabpro/id1125333158 (accessed on 25 May 2022).
- Ding, S.; Shi, Z. Studies on incidence pattern recognition based on information entropy. J. Inf. Sci. 2005, 31, 497–502. [Google Scholar]
| Publisher’s Note: MDPI stays neutral with regard to jurisdictional claims in published maps and institutional affiliations. |
© 2022 by the authors. Licensee MDPI, Basel, Switzerland. This article is an open access article distributed under the terms and conditions of the Creative Commons Attribution (CC BY) license (https://creativecommons.org/licenses/by/4.0/).


