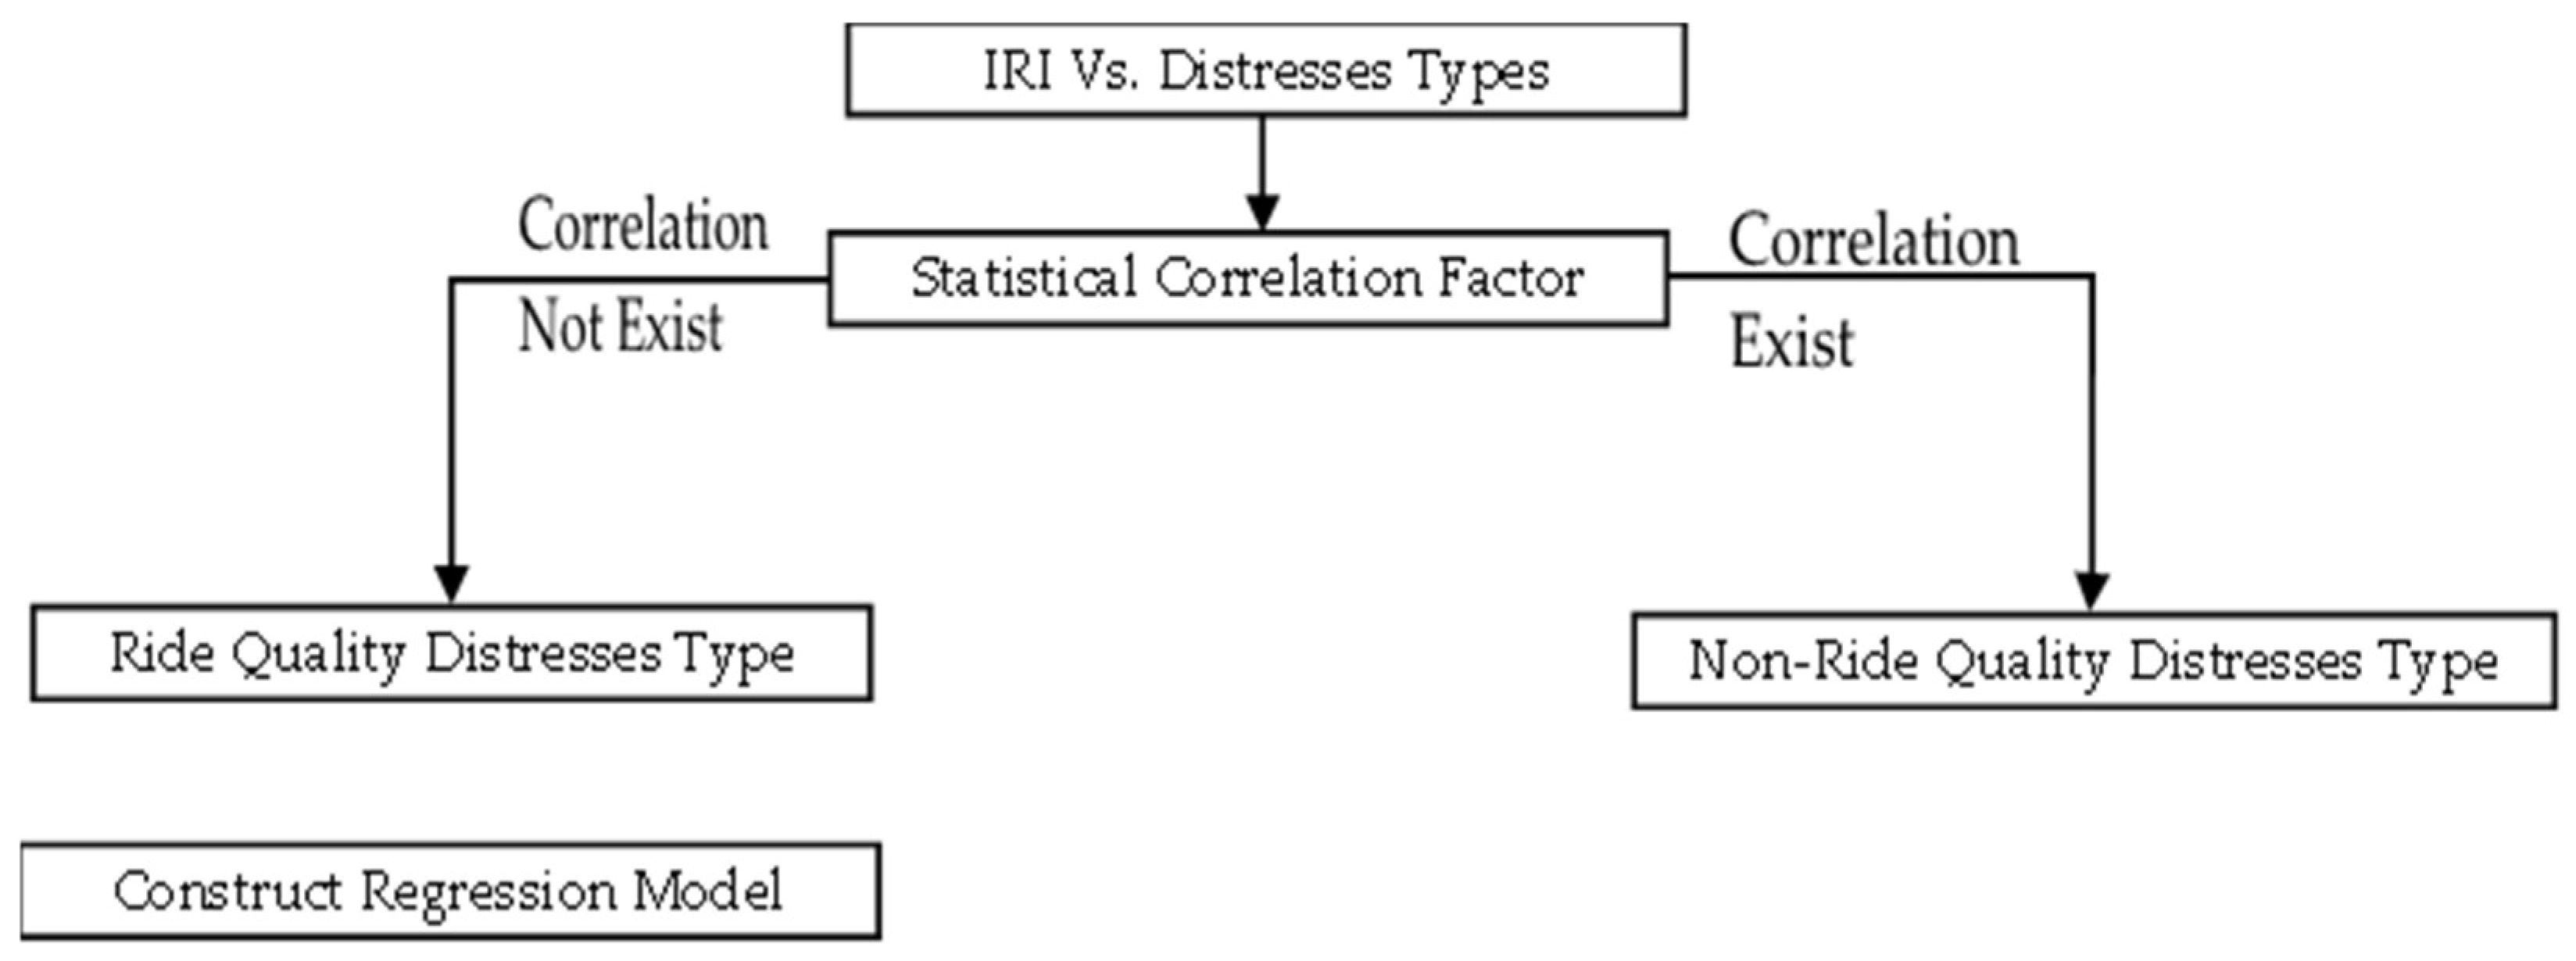
4.2. Distresses Related to Ride Quality
Pavement roughness measures are generally used to determine the riding quality surface of a roadway’s pavement. Pavement roughness is usually connected to pavement serviceability. The qualities of the pavement’s physical characteristics are measured by pavement serviceability. So, roughness is connected to the opinions of persons who drive on the road. It has a major influence on comfort, safety, vehicle operating costs, and travel speed.
This section attempts to research pavement distresses to generate the types of distresses that are related to riding quality for both main and secondary streets. All pavement distresses in the study region were studied for their impact on the IRI measurement.
For main street sections, ten types of distress appear in the study sample. The cracking distresses fatigue cracking (code D1), block cracking (code D2), longitudinal and transverse cracking (code D3) and patching cracks (code D12) have been aggregated into one group called cracking distress. In addition, the distress types of depression (code 6) and depression patching have been assembled into one group called depression distress. After grouping, the distress types were reduced to six. The distress groups in the main sections are as follows:
Cracking (codes D1, D2, D3 and D12); Patching (code D4); Potholes (code D5); Depression (codes D6 and D13); Rutting (code D7); Raveling (code D11).
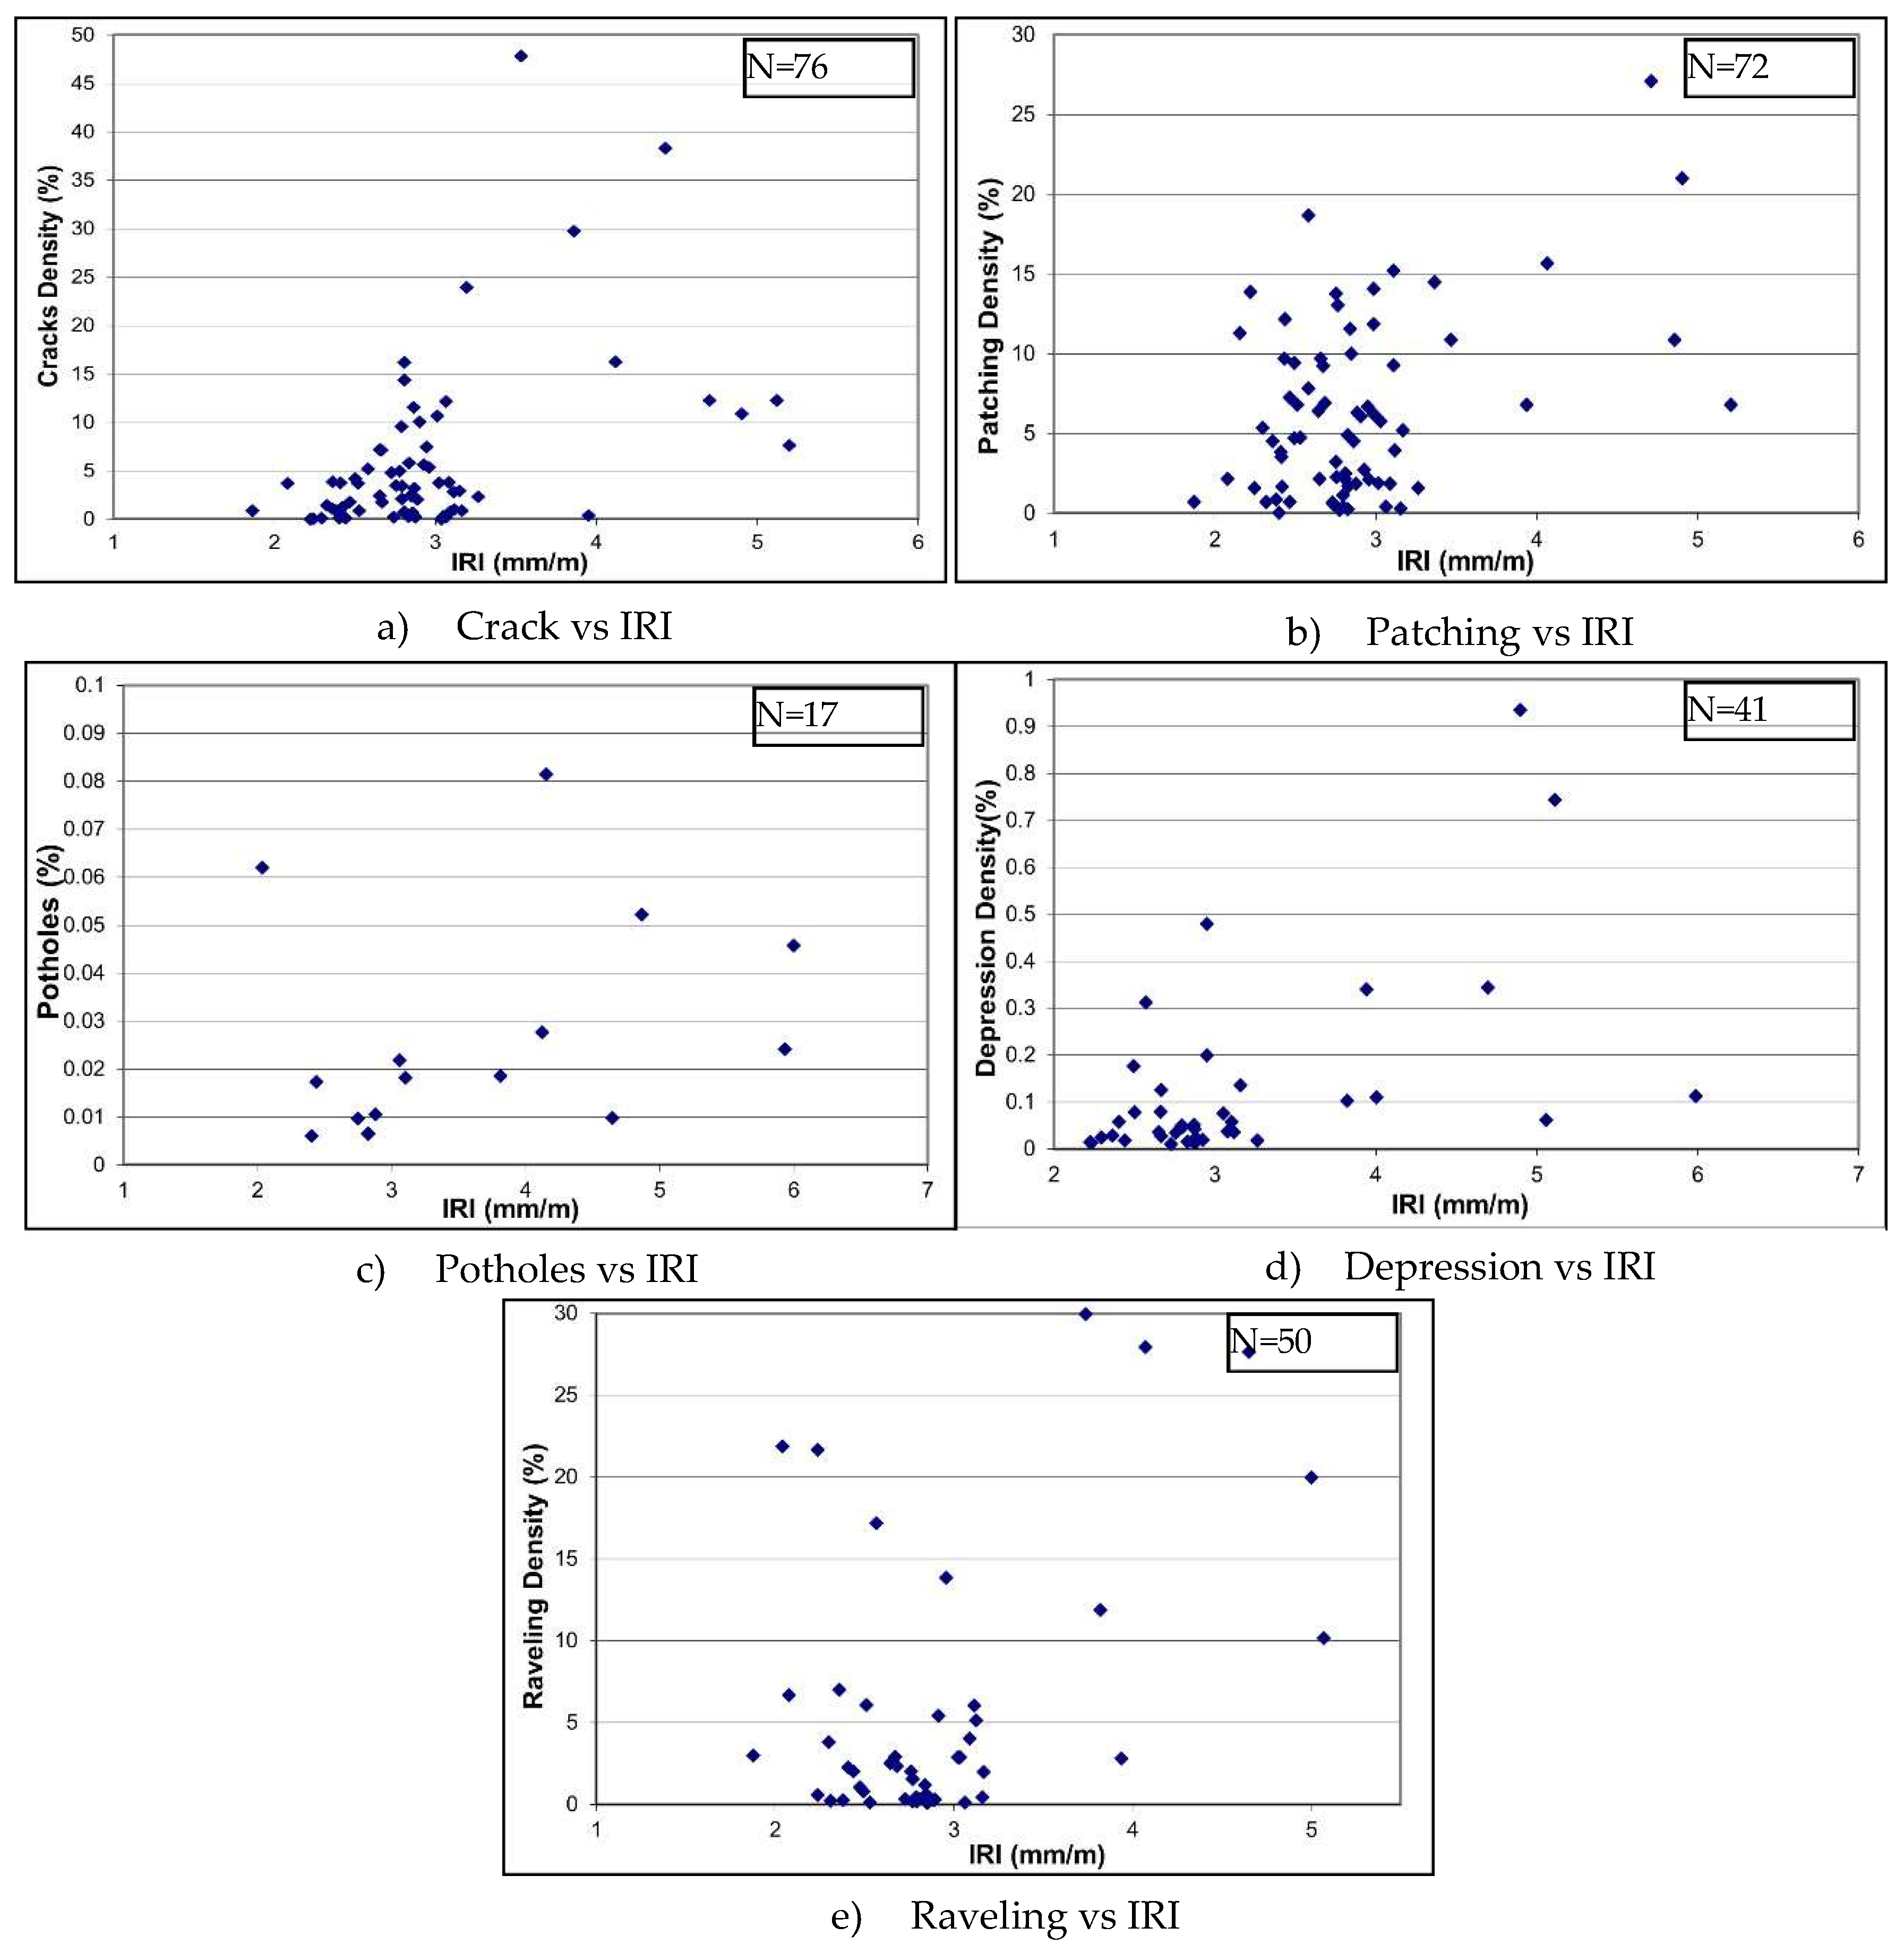
The relation between IRI and each of the distress types in main street samples is investigated and discussed in the subsequent paragraphs.
Figure 2a presents crack distress as dominant in the total sample units. It is clear from the graph that a visible scattering exists in the roughness and density of distress data. The chart doesn’t show a strong link between the IRI value and cracking density. Furthermore, the IRI and the crack density correlation coefficient is 0.167. The low correlation factor means that the two variables have a poor linear relationship. The
p-value is equal to zero. This means that there is enough relation between IRI and distress density. The statistical test result does not correspond to previous experiences indicating that cracking distress is a non-ride quality form of distress at all levels of severity.
- 2.
Patching vs. IRI
Figure 2b shows that the patching and IRI values have a positive relationship. The graph, on the other hand, does not demonstrate any clear-cut conclusions regarding the relationship’s linearity. IRI and patching density have a correlation coefficient of 0.471 and a
p-value of zero. The coefficient has a positive sign which mean that patching density and IRI have a positive relationship. The linear relationship distinguished around 47 percent of the IRI and patching density observations, according to the correlation factor value. The hypothesis test obtained a
p-value of 0, indicating that there is sufficient evidence of a link between IRI and patching density at a 95% confidence level.
- 3.
Potholes vs. IRI
Figure 2c represents the relation between pothole density and IRI. The pothole distress was the dominant distress. The graph shows that the relationship’s linearity is not well defined. The coefficient of correlation is 0.123. The
p-value is 0.390, which is larger than the level of significance of 0.05. As a result, there is not enough evidence of a link between IRI and the number of potholes.
- 4.
Depression vs. IRI
The graph in
Figure 2d shows the relationship between IRI and depression density. The graph shows that depression and IRI values have a positive relationship. IRI and depression density have a correlation coefficient of 0.342 and a
p-value of 0.011. The positive sign indicates that depression density and IRI have a positive relation. When the correlation coefficient equals 0.34, there is no clear choice about the relationship’s linearity. The
p-value for the hypothesis test is 0.011, which is less than the 0.05 level of significance. The result is that we have sufficient evidence to understand that there is a statistically significant correlation between IRI and depression density with 95 percent confidence.
- 5.
Raveling vs. IRI
Figure 2e shows the relationship between IRI and distress of raveling density. The correlation coefficient is 0.399 and the
p-value is zero. There is no clear-cut decision about the linearity of the relation. The positive sign indicates a positive relation between raveling density and IRI. In the hypothesis test the
p-value= 0, therefore there is sufficient evidence of the relationship between IRI and raveling density.
- 6.
Rutting vs. IRI
Figure 2f shows the correlation between IRI and rutting density. The graph shows that rutting density and IRI values have a positive relationship. there is no clear choice about the relationship’s linearity. The correlation coefficient is 0.357, meaning that the linear relationship only affected 35.7 percent of the IRI and rutting density observations. There is insufficient evidence of a link between IRI and rutting density since the
p-value is 0.045, which is extremely near to the 0.05 level of significance.
There are six distress types included in secondary pavements of the Riyadh street network. The cracking distresses Block Cracking (code D2) and Longitudinal and Transverse Cracking (code D3) have been aggregated to one group called cracking distress. After grouping the distress types were reduced to five. The total distress groups in the second section are Cracking (codes D2 and D3) Patching (code D4); Potholes (code D5); Depressing (code D6) and Raveling (code D11).
The relation between IRI and each group of distress types in secondary Streets is discussed in the subsequent paragraphs.
- 1.
Cracks vs. IRI
The graph in
Figure 3a shows the relationship between IRI and crack density. The correlation coefficient is 0.28, which indicates that the linear relationship only affected 28 percent of the IRI and crack density observations. There is insufficient evidence of a link between IRI and crack density since the
p-Value of the hypothesis test is zero. The positive sign means a positive correlation between IRI and carack density, the low relationship factor indicates insignificant linearity relation between crack density and IRI.
- 2.
Patching vs. IRI
The relation between IRI and patching distress density is seen in
Figure 3b. The graphic shows that patching density and IRI have a positive relationship. The coefficient of correlation is 0.514. The positive sign indicates that patching density and IRI have a positive relationship. Furthermore, the correlation factor indicates that the linear relationship distinguished around 51.4 percent of the IRI and patching density data. The p-value for the hypothesis test is zero. As a result, the relation between IRI and patching density has sufficient evidence at a 95 percent confidence level.
- 3.
Potholes vs. IRI
Figure 3c shows the relationship between IRI and pothole distress density. The correlation factor is 0.322 indicating low linearity of the relationship. The
p-value is 0.208 which is greater than the 0.05 level of significance; so, there is insufficient evidence of the relation between the value of IRI and pothole density. This result could be because potholes are usually avoided during roughness measurements.
- 4.
Depression vs. IRI
The correlation between IRI and depression distress density is presented in
Figure 3d. The graph shows that patching density and IRI have a positive relationship. When the density of depressions in the pavement sample is high, the IRI value increases. The linear relationship distinguished about 43.6 percent of the IRI and depression density data, on the basis of the correlation factor value. The hypothesis test gave a
p-value of 0.004, which is less than the 0.05 level of significance, showing that there is sufficient relation between IRI and depression density at the 95 percent confidence level.
- 5.
Raveling vs. IRI
The graph in
Figure 3e shows the relationship between the value of IRI and the raveling distress density. The graph shows a relationship between raveling and IRI. The linear relationship distinguished about 38.7% of the IRI value and raveling density data, according to the correlation factor value. The
p-value in the hypothesis test is 0.006. As a result, there is sufficient evidence of the association between the value of IRI and the raveling density at the 95 percent confidence level.
4.3. Distresses Density and the IRI Model
In this section, the regression method was chosen to create models that related IRI with the density of different distresses. The linear regression model would be in the form:
where; b
0, b
1, …, b
n: regression coefficients
For each street category, two regression models were generated. The first model looked at how different types of distress impacted pavement roughness (IRI). The previous results in detecting ride quality types of distress were then confirmed using this model. The second model was created to find the best match between IRI and the different types of ride quality distress. The two models were checked and analyzed using a variety of statistical tests. The t-test was used to evaluate the relationship between the two regression coefficients (b0, b1) and the dependent variable at the 95% confidence level. Analysis of variance was used to determine the regression line’s quality, or if the variation in IRI is dependent on the distress data. Finally, the correlation coefficient (R2) was used to show how well the regression model was fitted to the data.
where; b
0, b
1, b
2, b
3, b
4, b
5, b
6 are regression coefficients; Cr = crack distress density; Pa = patching distress density; Po = potholes distress density; Dr = depression distress density; Ru = rutting distress density; Ra = raveling distress density.
- 1.
Model-1—connects IRI to all observable distresses:
Summary of the model parameters is presented in
Table 2.
The p-values for most regression coefficients are zero, meaning that there is a significant correlation between the types of distress and the estimated value of IRI. The p-values of the potholes (Po) and rutting (Ra) coefficients, on the other hand, are more than the 0.05 level of significance. As a result, there is sufficient evidence to exclude potholes and rutting in estimating the roughness index.
- 2.
Analysis of Variance
| Source | DF | SS | MS | F | p |
| Regression | 6 | 203.339 | 33.890 | 132.26 | 0.000 |
| Residual Error | 1610 | 412.547 | 0.256 | | |
| Total | 616 | 615.886 | | | |
The p-values for the ANOVA-tests for the model are zero, meaning that there is no significant variation in the IRI predicted values caused by the regression model. The results show a strong connection between IRI and various types of distress.
- 3.
Squared multiple correlation coefficient (R2): R-Sq = 32.5% R-Sq(adj) = 32.3%
The squared multiple correlation coefficient (R2) is 32.3 percent. This means that 32.3 percent of the IRI values can be reflected and described by the regression model. It also shows that while there are statistically significant relationships between IRI and some types of distress, the relationship isn’t strong enough to use distress types as an accurate measure of roughness conditions.
- (a)
Model-2—connects IRI to ride quality distresses:
In this case, the types of distress that had a strong relationship with the IRI index are called ride quality types of distress. This distress includes cracks distress (Cr), patching distress (Pa), depression distress (Dr), and raveling distress (Ra).
- 1.
The regression model developed is as follows:
A summary of the regression model is shown in
Table 3.
Since all the regression coefficients have p-values equal to zero, this indicates that there is a statistically significant link between the different types of ride quality distress and the expected levels of IRI.
- 2.
Analysis of Variance
| Source | DF | SS | MS | F | p |
| Regression | 4 | 200.181 | 50.045 | 194.06 | 0.000 |
| Residual Error | 1612 | 415.705 | 0.258 | | |
| Total | 1616 | 615.886 | | | |
The p-values for the ANOVA-tests for the model are zero, meaning that there is no significant variation in the IRI predicted values caused by the regression model. The results show a strong connection between IRI and various types of distress. The F-value for model-2 is greater than that in model-1 meaning improvement of model-2 over model-1.
- 3.
Squared multiple correlation coefficient (R2): R-Sq = 33.0% R-Sq(adj) = 32.8%
The squared multiple correlation coefficient (R2) is 32.8 percent. This means that 32.8 percent of the IRI values can be reflected and described by the regression model. It also shows that while there are statistically significant relationships between IRI and some types of distress, the relationship isn’t strong enough to use distress types as an accurate measure of roughness conditions.
The effect of the pavement roughness on five distress types in the section of the secondary streets in the Riyadh city network has been studied and analyzed. The study developed and tested two regression models; the first one was to relate the IRI index to all distresses in the secondary street samples, whereas the second model was to relate IRI index to ride quality distress types. The distresses included in the regression evaluations were, cracks distress (Cr), patching distress (Pa), potholes distress (Po), depression distress (Dr), and raveling distress (Ra). The linear regression model would be in the form:
where the number of regression coefficients equal 6.
The distress in the secondary streets class chosen to be ride quality type distresses that showed a statistically significant association with the IRI were cracks distress (Cr), patching distress (Pa), depression distress (Dr), and raveling distress (Ra). The linear regression model would be in the form:
where the number of regression coefficients equals 5.
- (a)
Model-1 the linear regression equation for the first model that relates IRI against all apparent distresses:
The estimated regression coefficients and the overall model statistics were shown in
Table 4.
The p-values for most of the regression coefficients are zero, clearly showing a significant linear correlation between the estimated values of IRI and the different types of distress. The p-value of the potholes (Po) coefficient is equal to 0.168, which is greater than the 0.05 level of significance therefore there is significant evidence to exclude the potholes coefficient which demonstrates no linear relationship between IRI and potholes distress.
- 1.
Analysis of Variance
| Source | DF | SS | MS | F | p |
| Regression | 5 | 70.405 | 14.081 | 17.56 | 0.000 |
| Residual Error | 134 | 107.463 | 0.802 | | |
| Total | 139 | 177.868 | | | |
Based on the ANOVA-test results, the p-values for the values of IRI response variables are equal to zero, meaning that the regression model does not account for any statistically significant variance in the IRI response variables. Furthermore, the data give sufficient evidence of the presence of a dependence relationship between the value of IRI and distresses.
- 2.
Squared multiple correlation coefficient (R2): R-Sq = 38.7% R-Sq(adj) = 36.9%
The value of the squared multiple correlation coefficient (R2) is 36.9%. This means that 36.9% of the IRI values can be described by the regression model. This shows adequate logic of the regression model relating IRI and distress data.
- (b)
Model-2 the linear regression equation for the second model that relates IRI vs. ride quality distresses:
The estimated regression coefficients and the overall model statistics were shown in
Table 5.
In this case, the p-values for all ride quality regression coefficients are equal to zero, meaning that there is strong evidence to accept the regression coefficient of all distress densities in the regression model with 95 percent confidence. This indicates a statistically significant linear association between the different types of ride quality distresses and IRI ratings.
- 1.
Analysis of Variance
| Source | DF | SS | MS | F | p |
| Regression | 4 | 68.861 | 17.215 | 21.32 | 0.000 |
| Residual Error | 135 | 109.007 | 0.807 | | |
| Total | 139 | 177.868 | | | |
According to the ANOVA-test results, the p-values for the response variable is equal to zero, meaning that there is no significant amount of variation within the response variable in the regression model. The data reflect sufficient evidence of a dependent relationship between IRI and distressed values. Note that the F-value for model-2 = 21.32, which is greater than the F-value from model-1 which = 17.56, demonstrating an improvement in model-2 over model-1.
- 2.
Squared multiple correlation coefficient (R2): R-Sq = 39.6% R-Sq(adj) = 37.3%
The value of the squared multiple correlation coefficient (R2) equals 37.3% which means that 37.3 percent of the IRI values are described and evaluated by the regression model showing adequate logic of the regression model relating IRI and distress data. Note that R2 in the second model (37.3) is greater than the first one (36.9) indicating an improvement of model-2 over model-1. It also shows that while there are statistically significant correlations between IRI and some types of distress, these relationships aren’t strong enough for distress types to be used as a predictable measure for roughness conditions.


