
Finite Element Analysis of the Limit Load of Straight Pipes with Local Wall-Thinning Defects under Complex Loads


Abstract
:1. Introduction
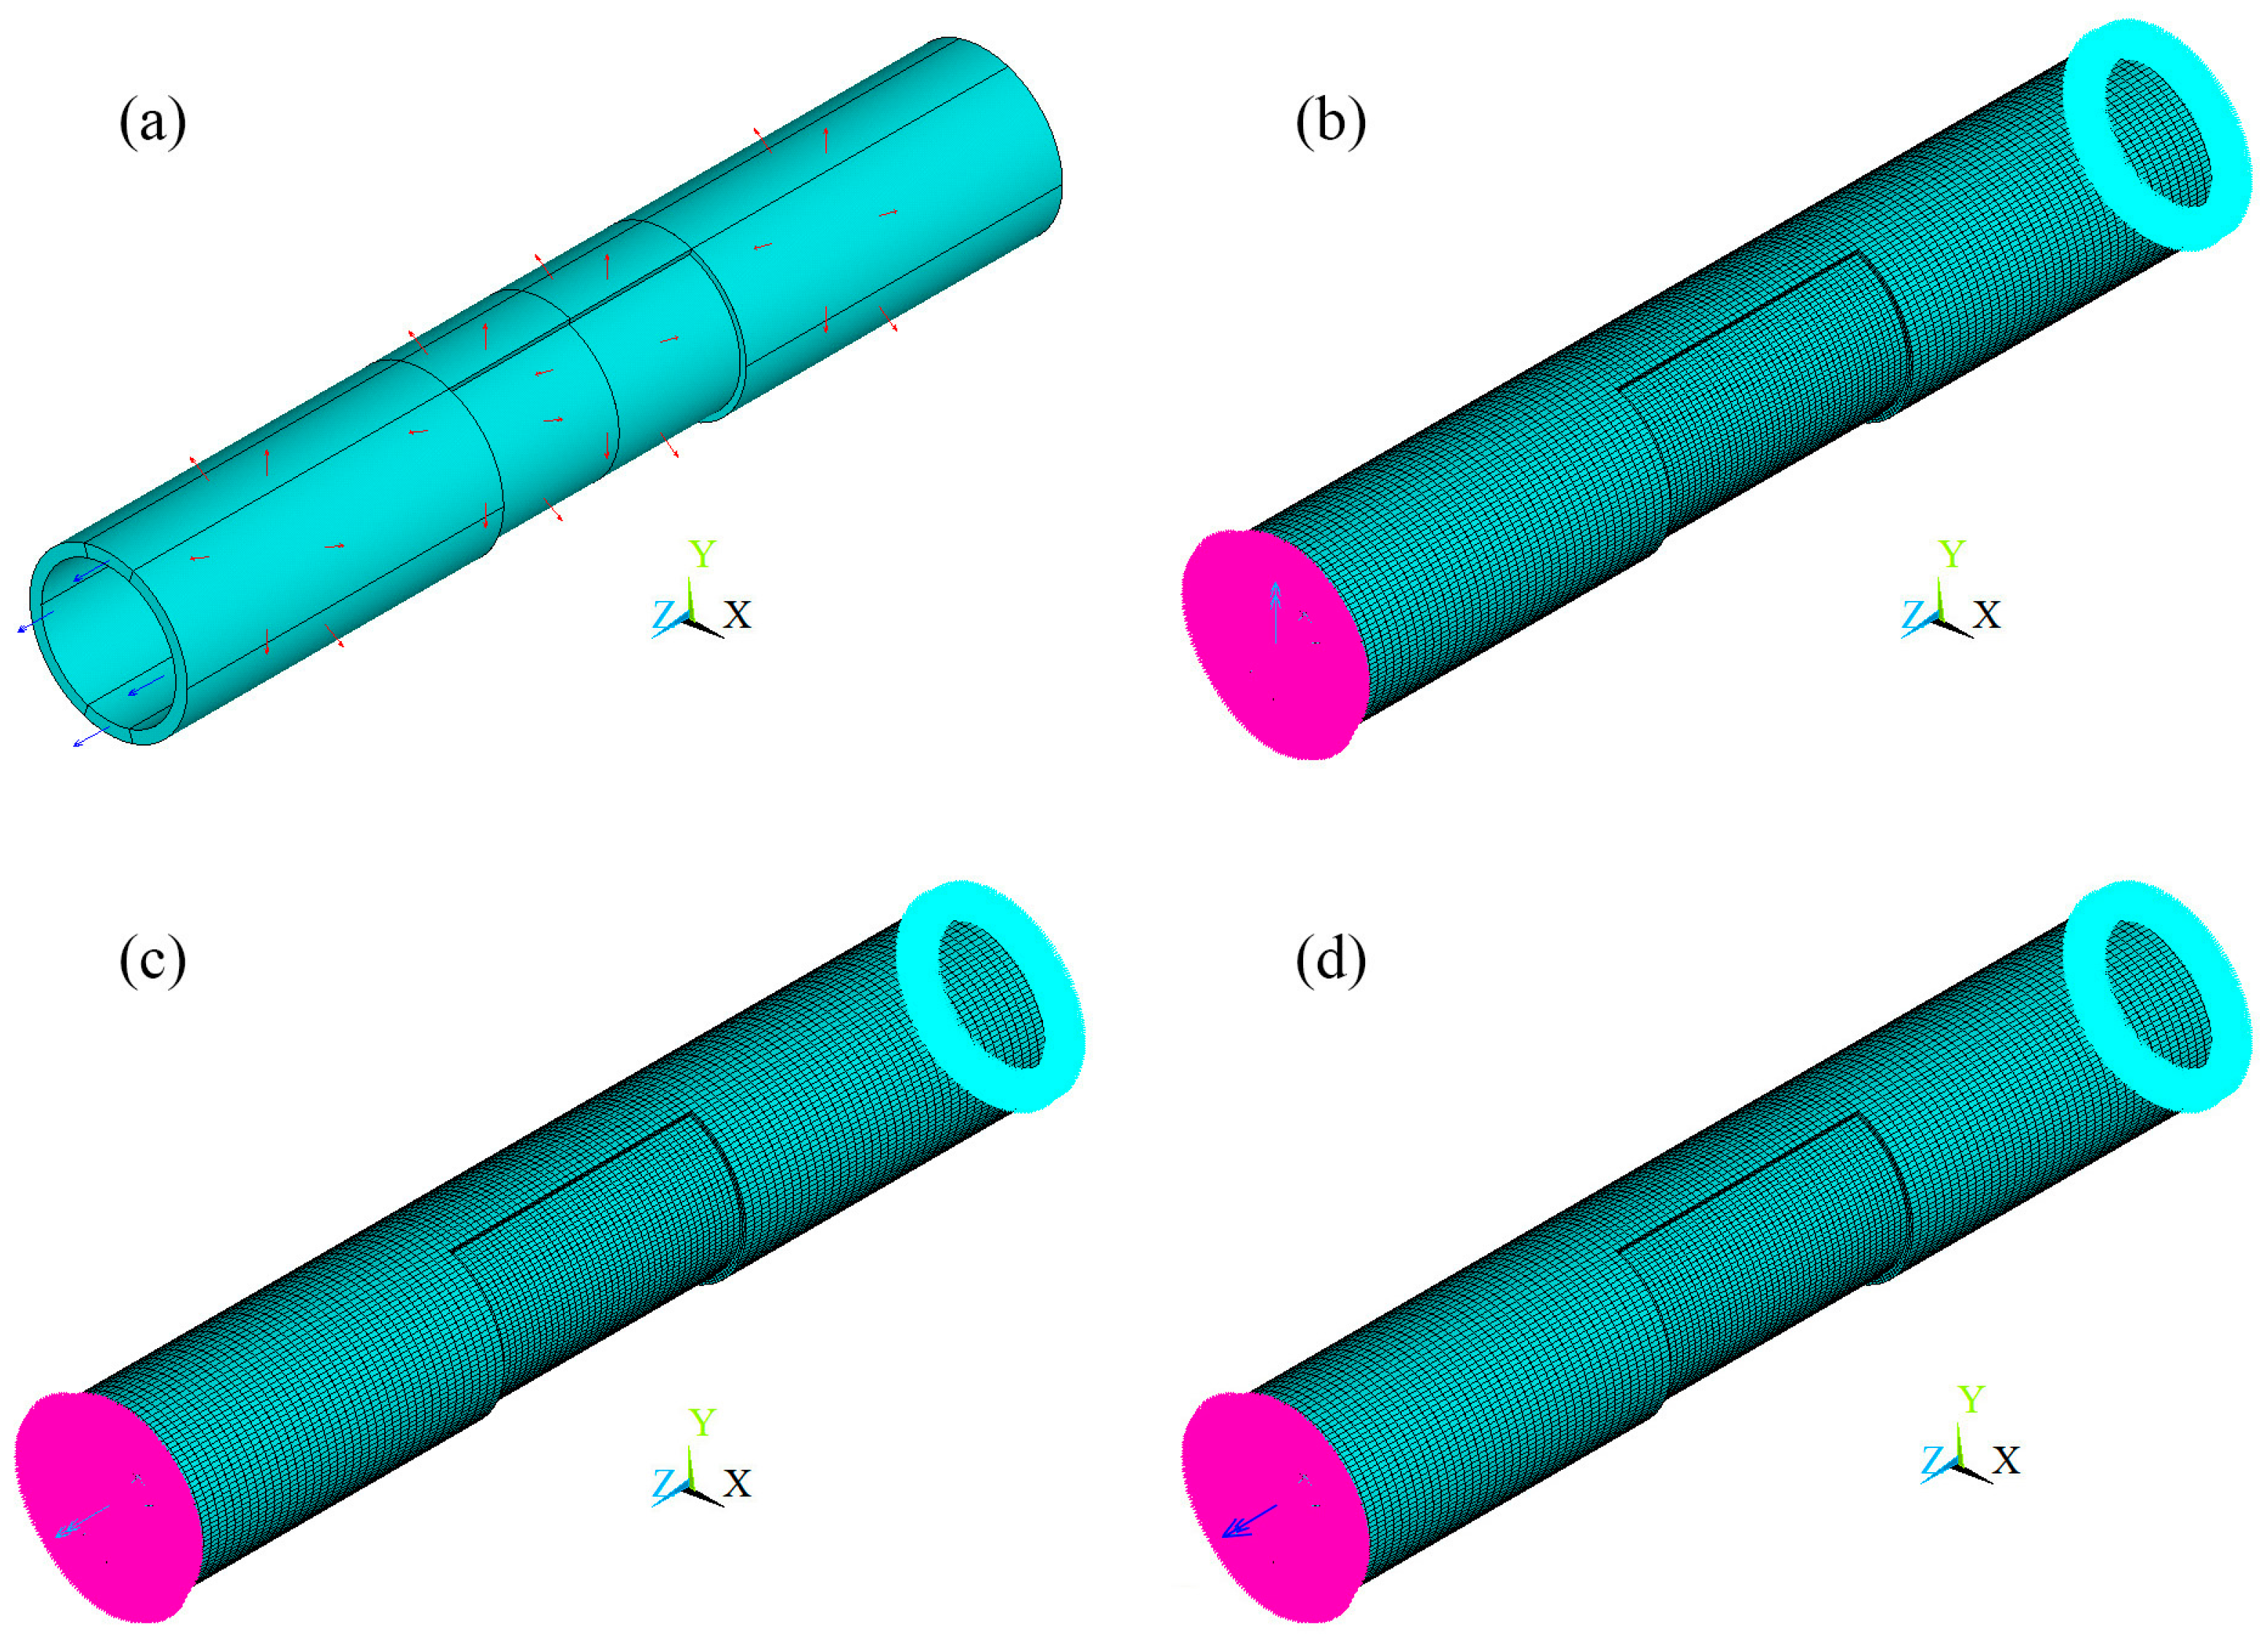
2. Finite Element Model and Limit Load Analysis Method of Straight Pipes with Local Wall-Thinning Defects
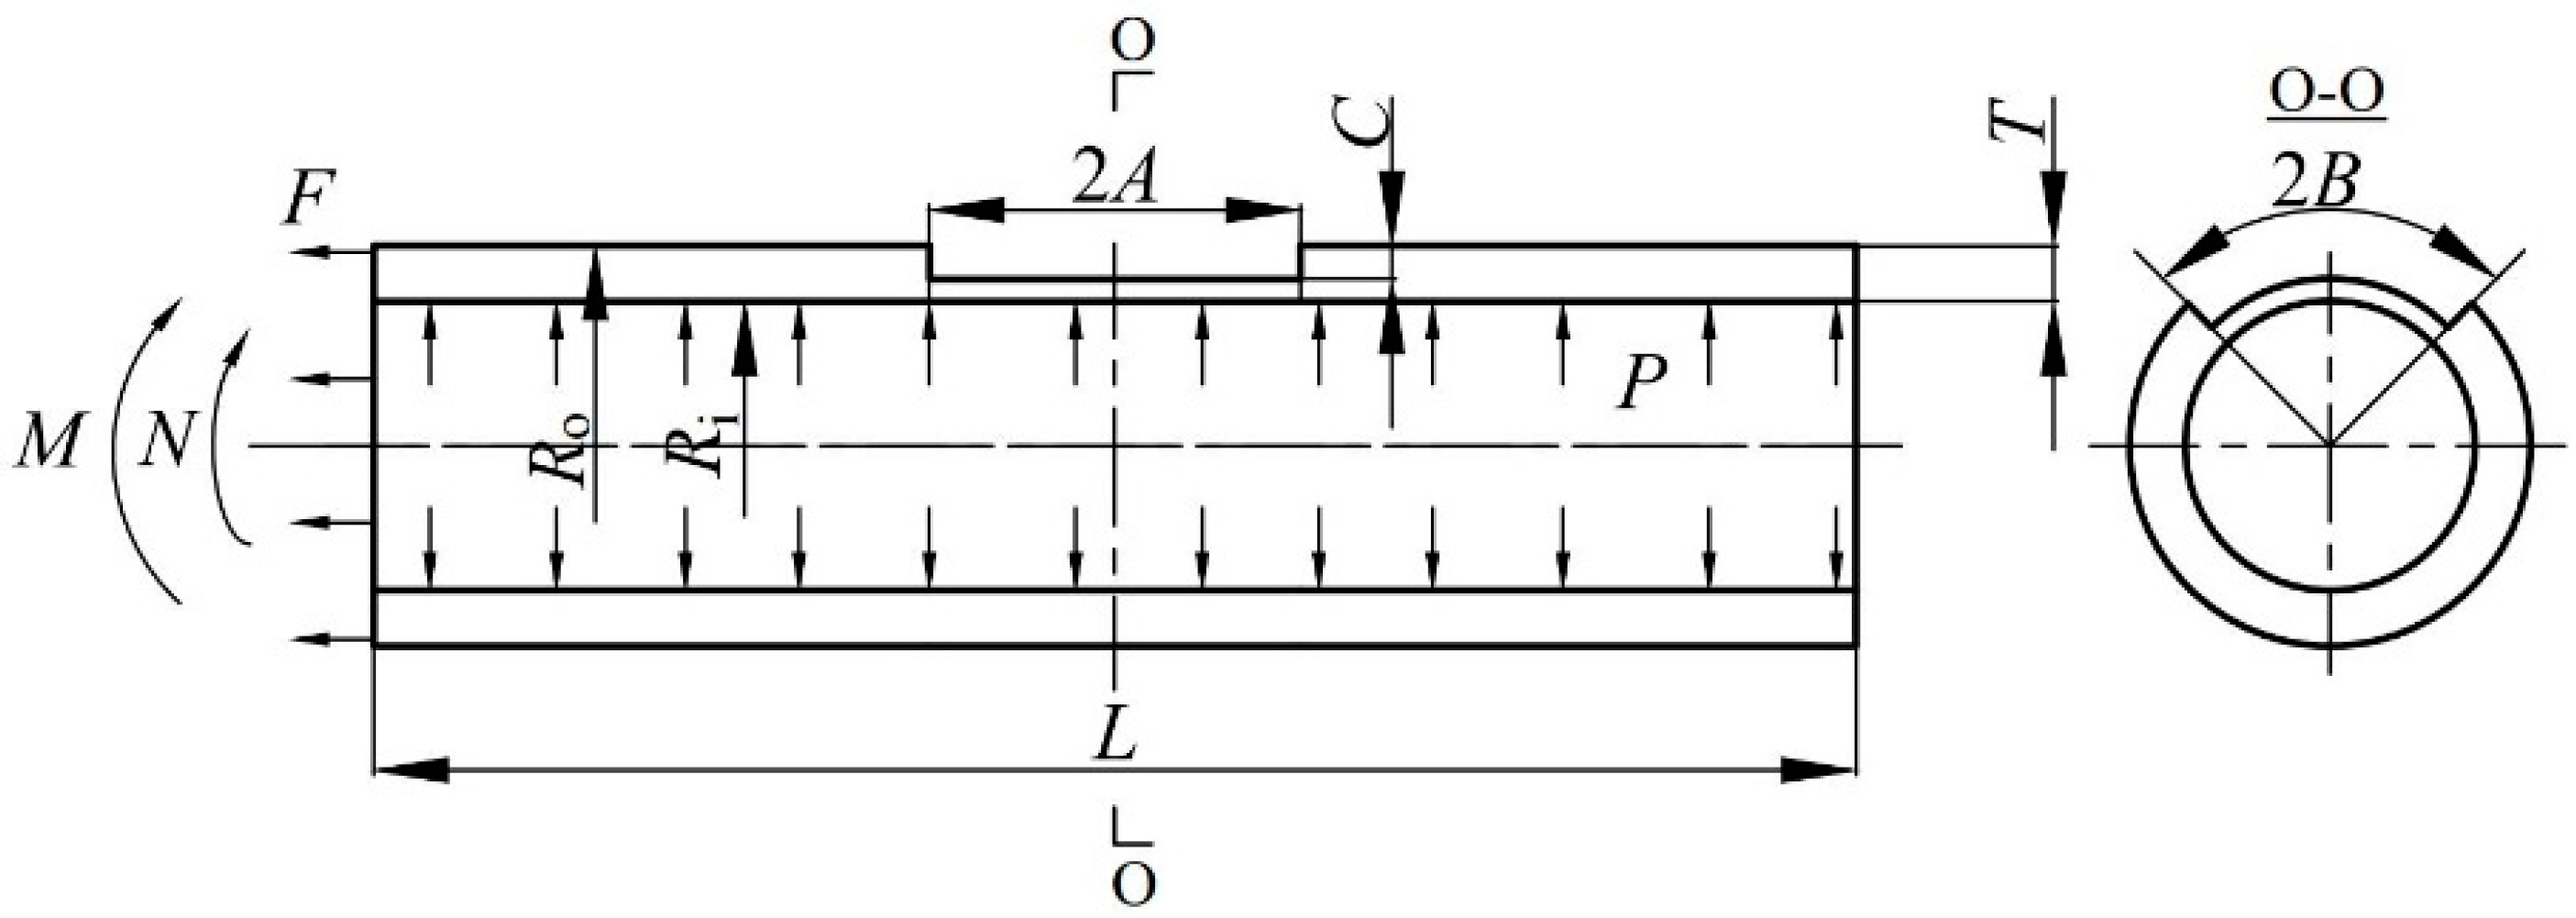
2.1. Geometry Parameters of the Calculation Model
2.2. Boundary Condition
2.3. Pipe Loads
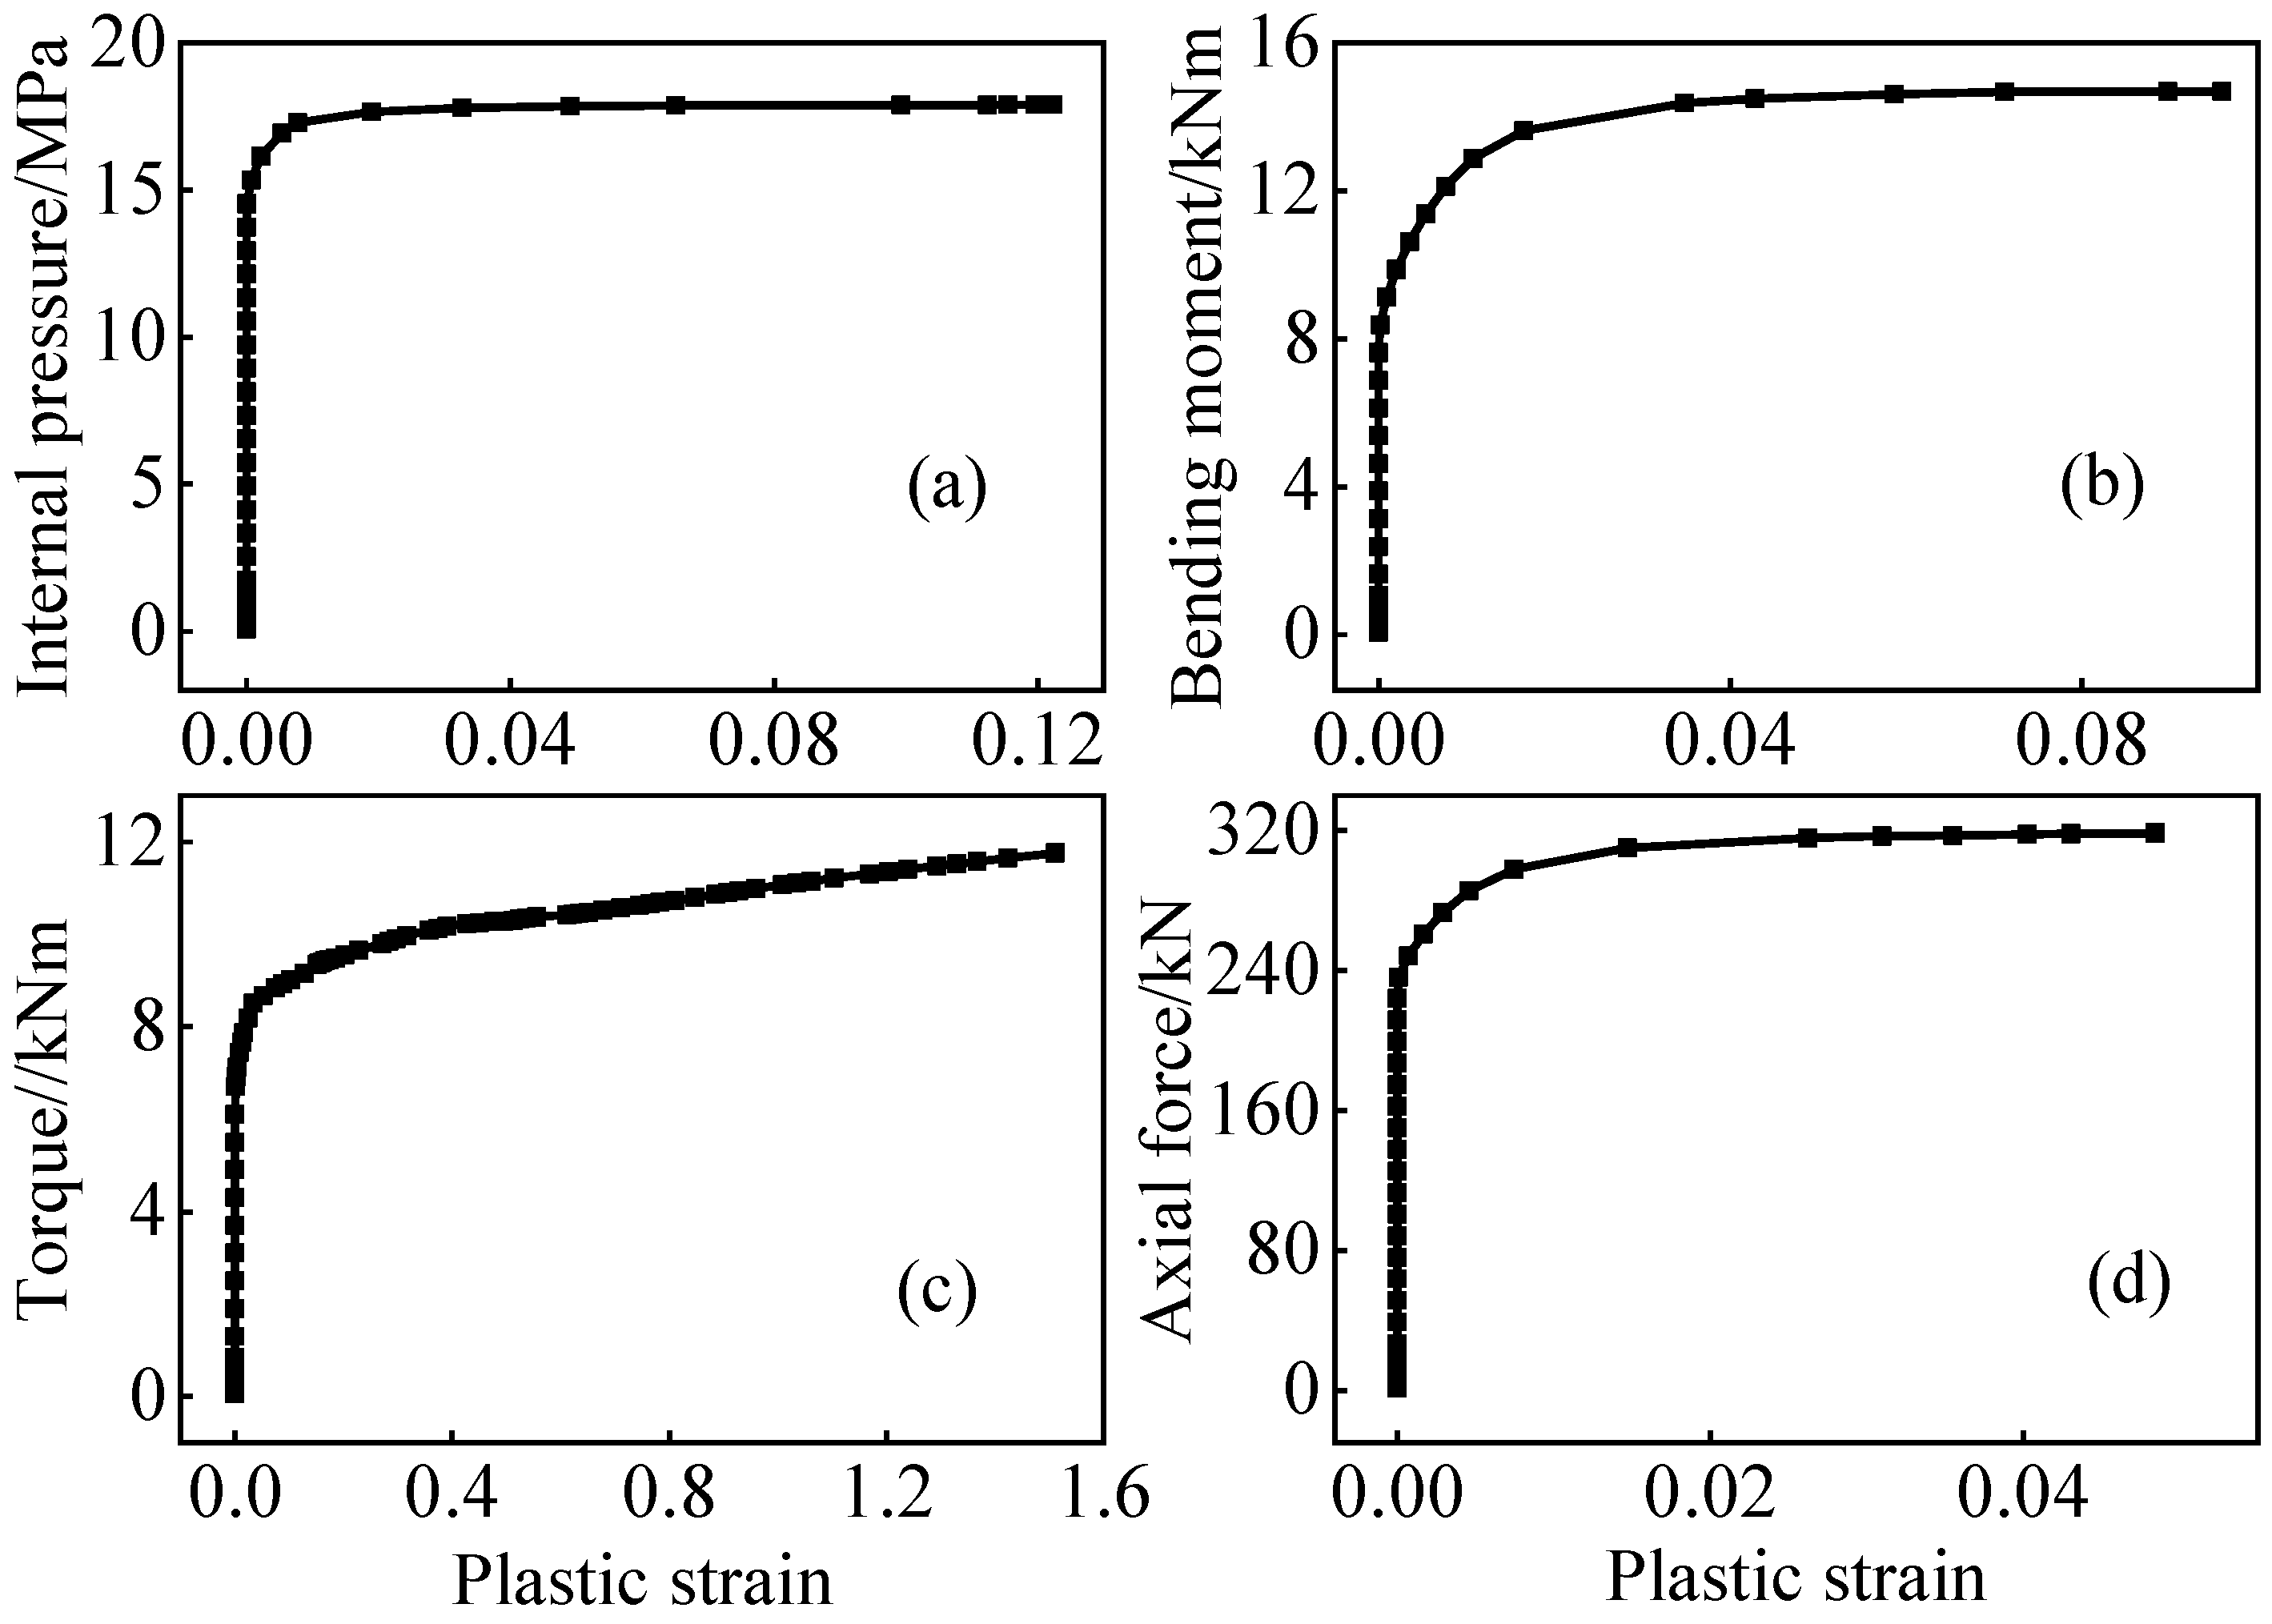
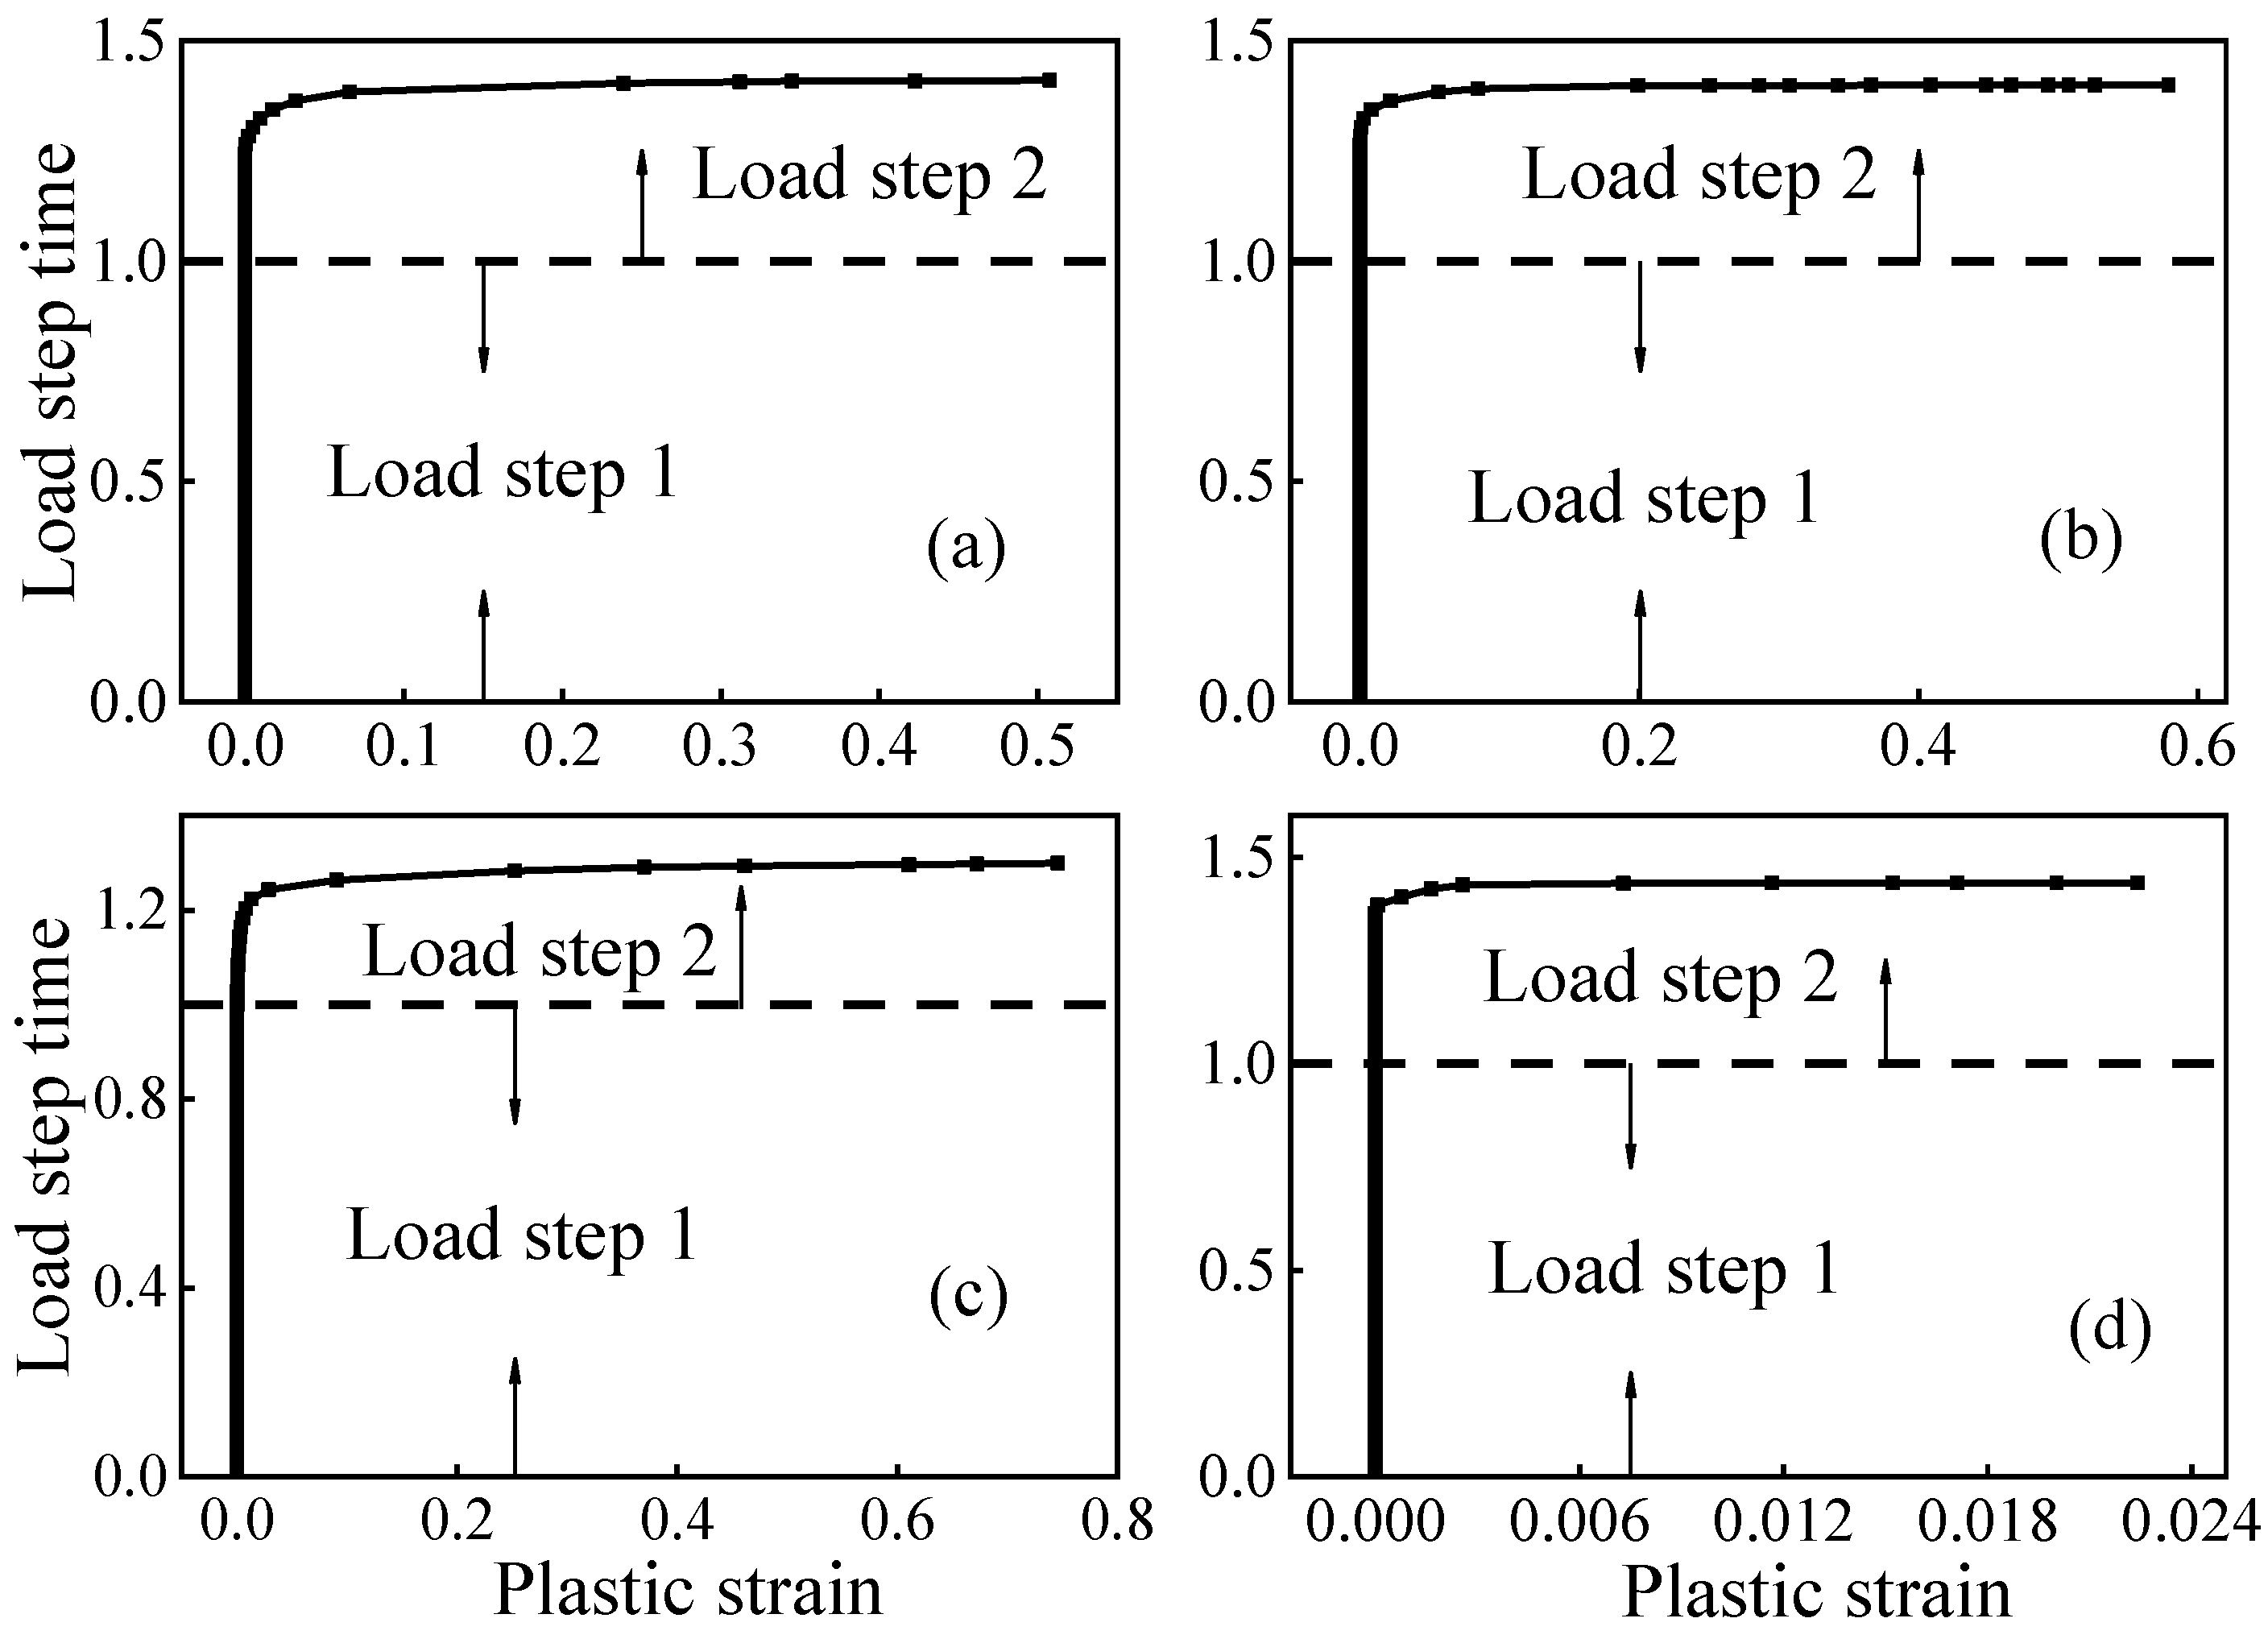
2.4. Determination Method of Limit Load
3. Limit Load Analysis of Straight Pipes with Local Wall-Thinning Defects under Single Loads
3.1. Orthogonal Calculation Scheme
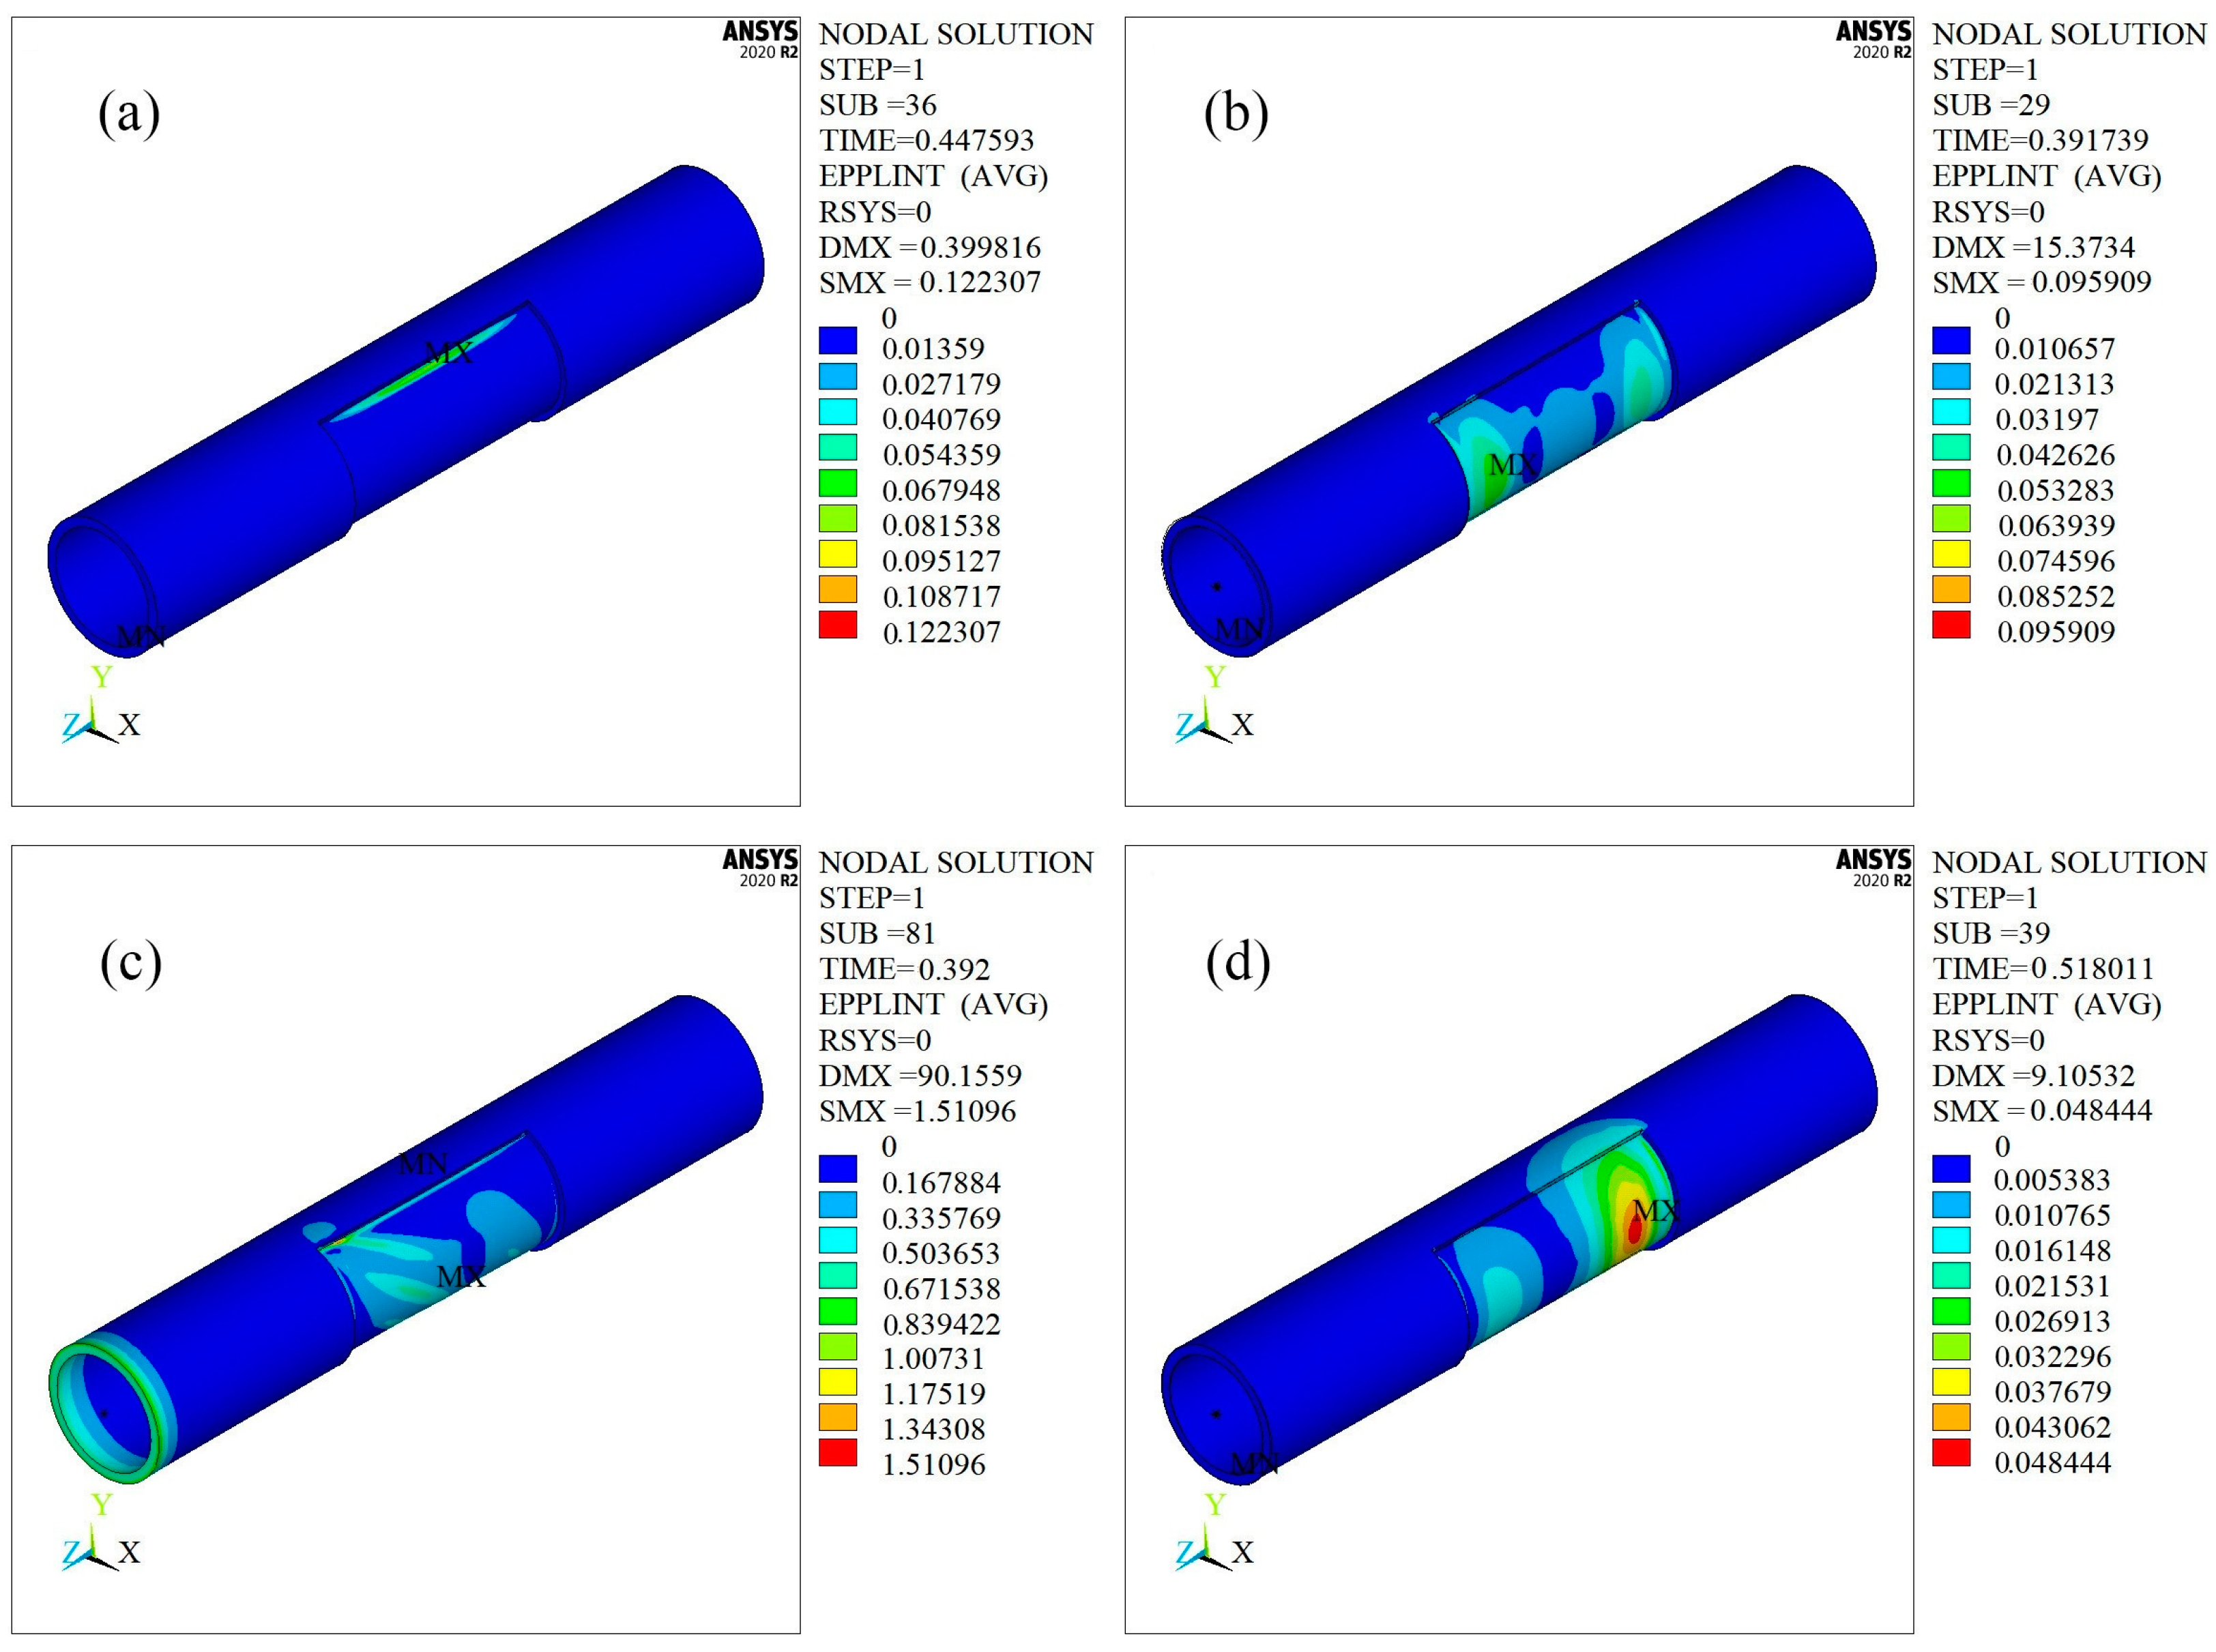
3.2. Finite Element Analysis Results
3.3. Empirical Limit-Load Equations of Straight Pipes with Local Wall-Thinning Defects
- (1)
- The limit load of SPLWT under internal pressure can be calculated by Equation (6):
- (2)
- The limit load of SPLWT under bending moment can be calculated by Equation (7):
- (3)
- The limit load of SPLWT under torque can be calculated by Equation (8):
- (4)
- The limit load of SPLWT under axial force can be calculated by Equation (9):
4. Limit Load Analysis of Straight Pipes with Local Wall-Thinning Defects under Complex Loads
4.1. Orthogonal Calculation Scheme
4.2. Finite Element Analysis Results
4.3. Empirical Limit-Load Equations of Straight Pipes with Local Wall-Thinning Defects under Complex Loads
- (1)
- The limit load of a straight pipe with an axial local wall-thinning defect can be calculated by Equation (10):
- (2)
- The limit load of a straight pipe with a circumferential local wall-thinning defect can be calculated by Equation (11):
- (3)
- The limit load of a straight pipe with a large-area local wall-thinning defect can be calculated by Equation (12):
- (4)
- The limit load of a straight pipe with a small-area local wall-thinning defect can be calculated by Equation (13):
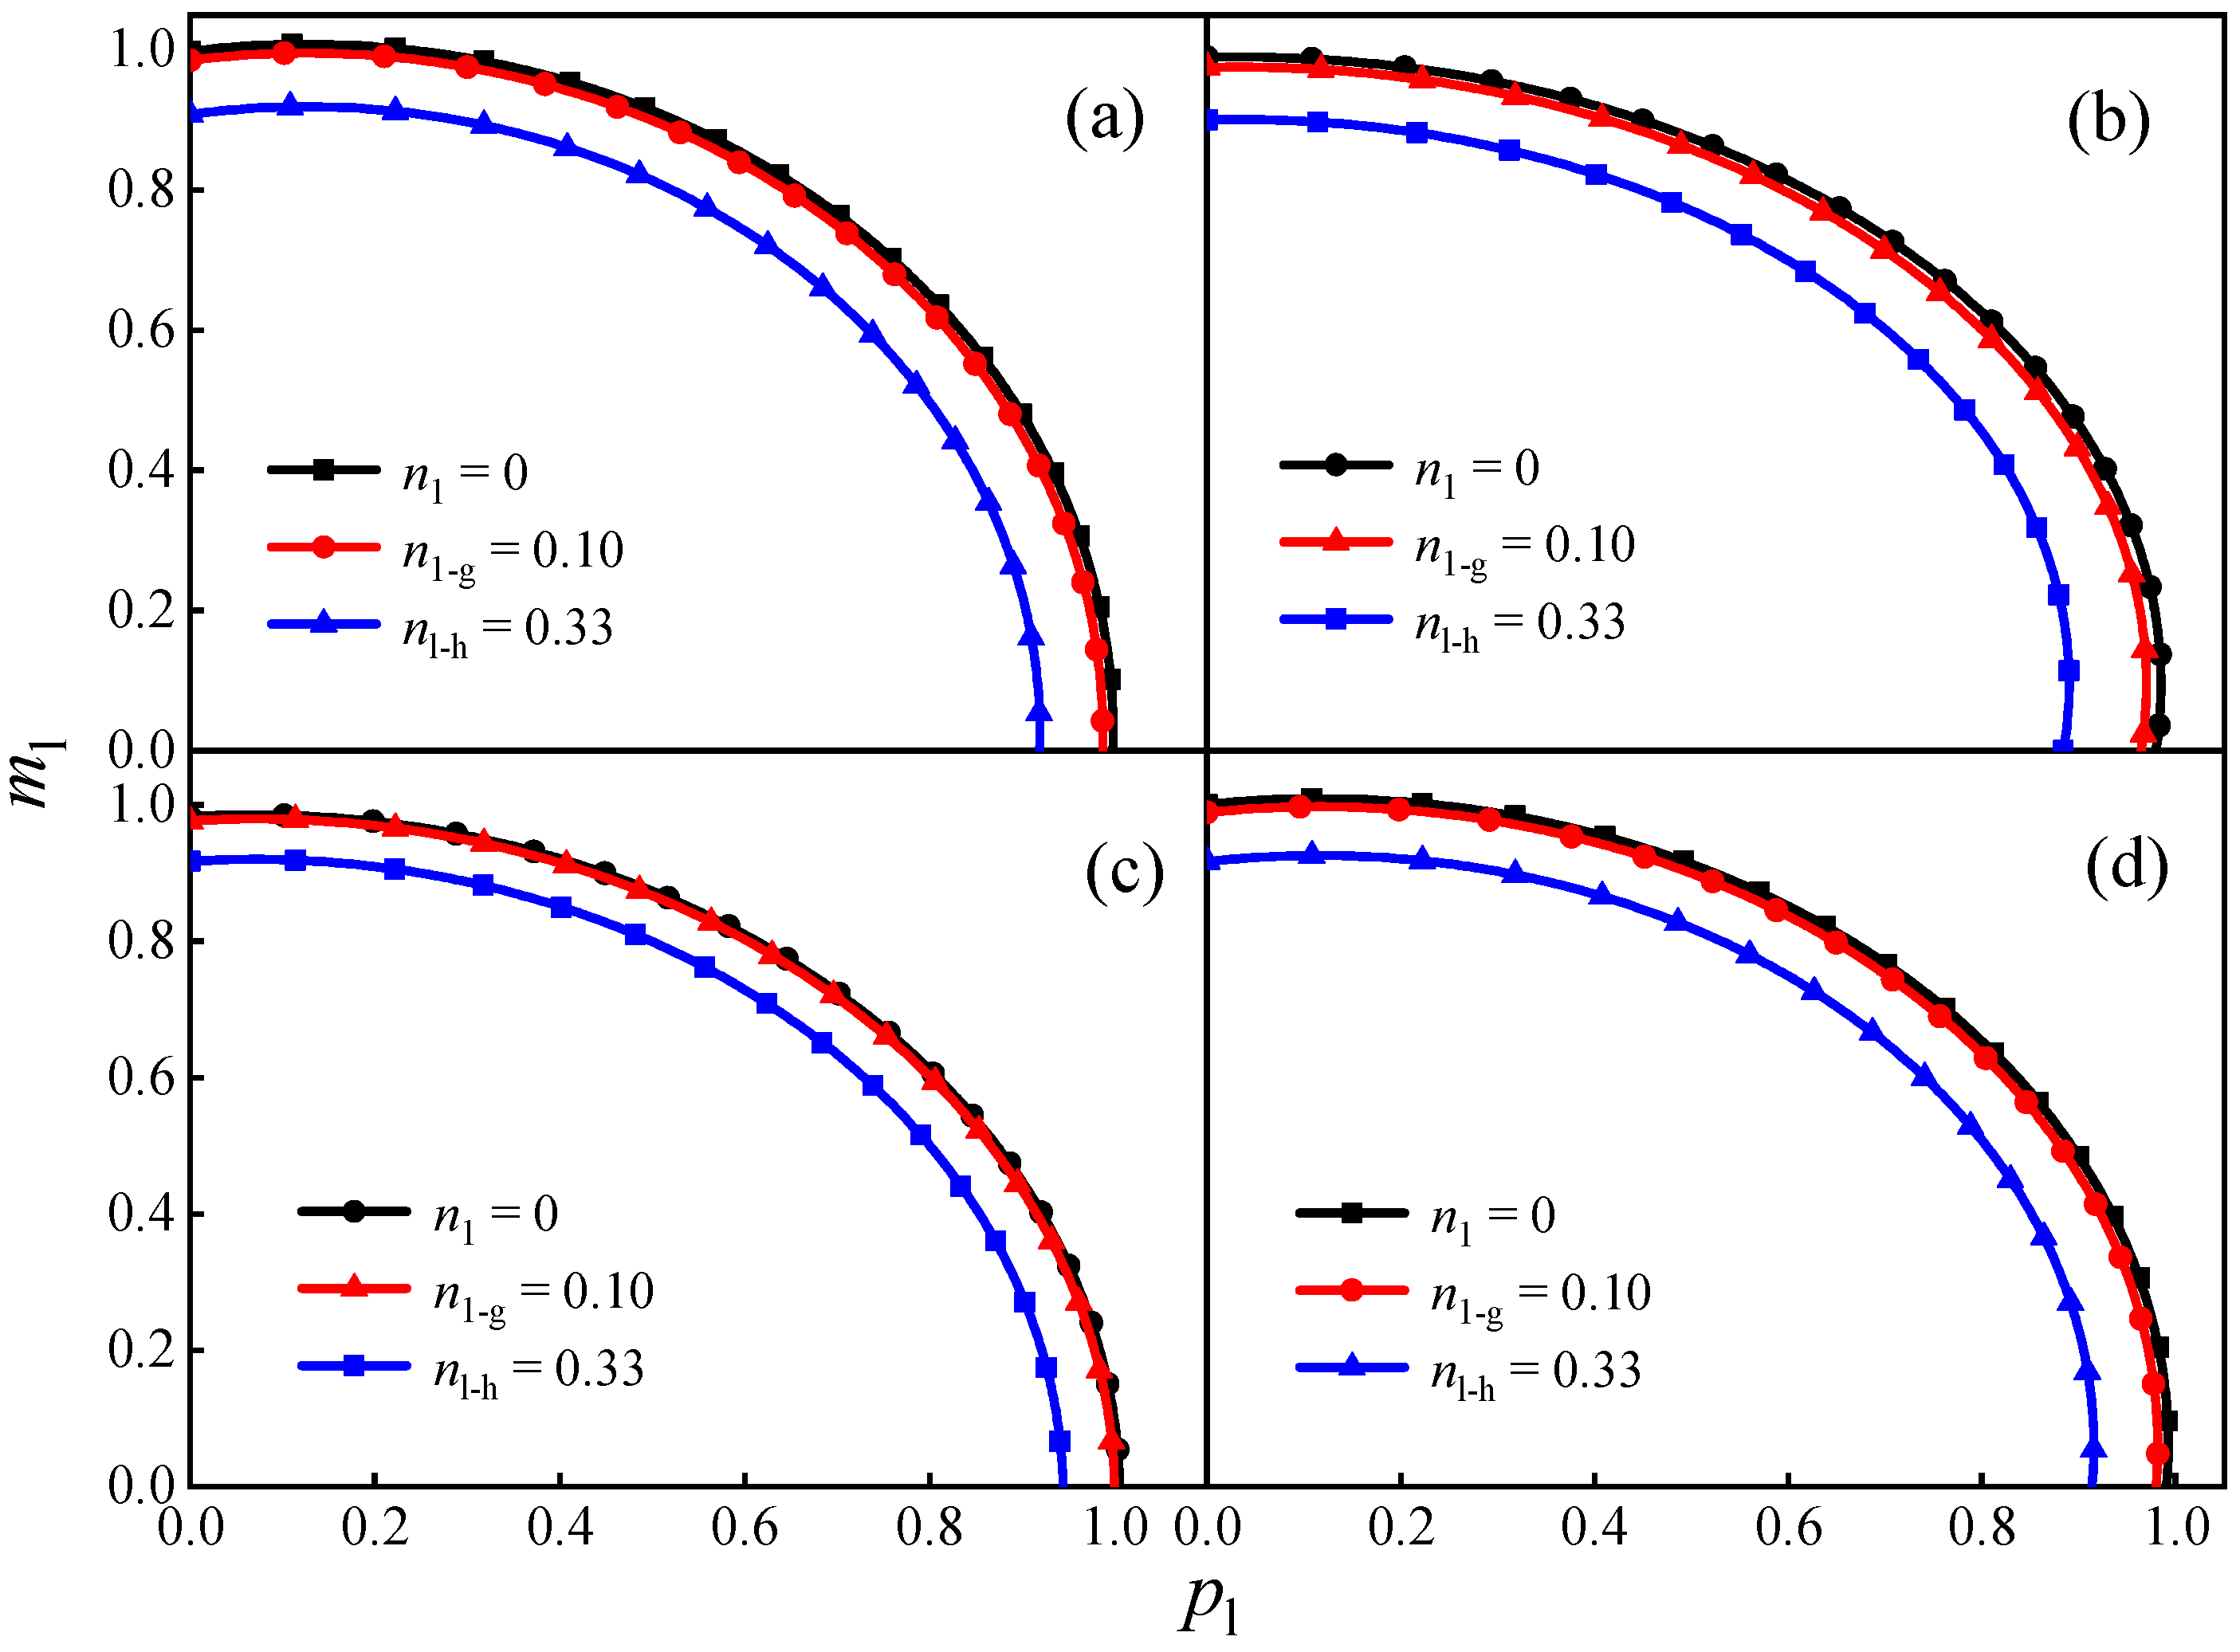
4.4. Verification of the Load-Bearing Capacity of Straight Pipes with Local Wall-Thinning Defects under the Combination of Internal Pressure and Bending Moment
5. Discussion
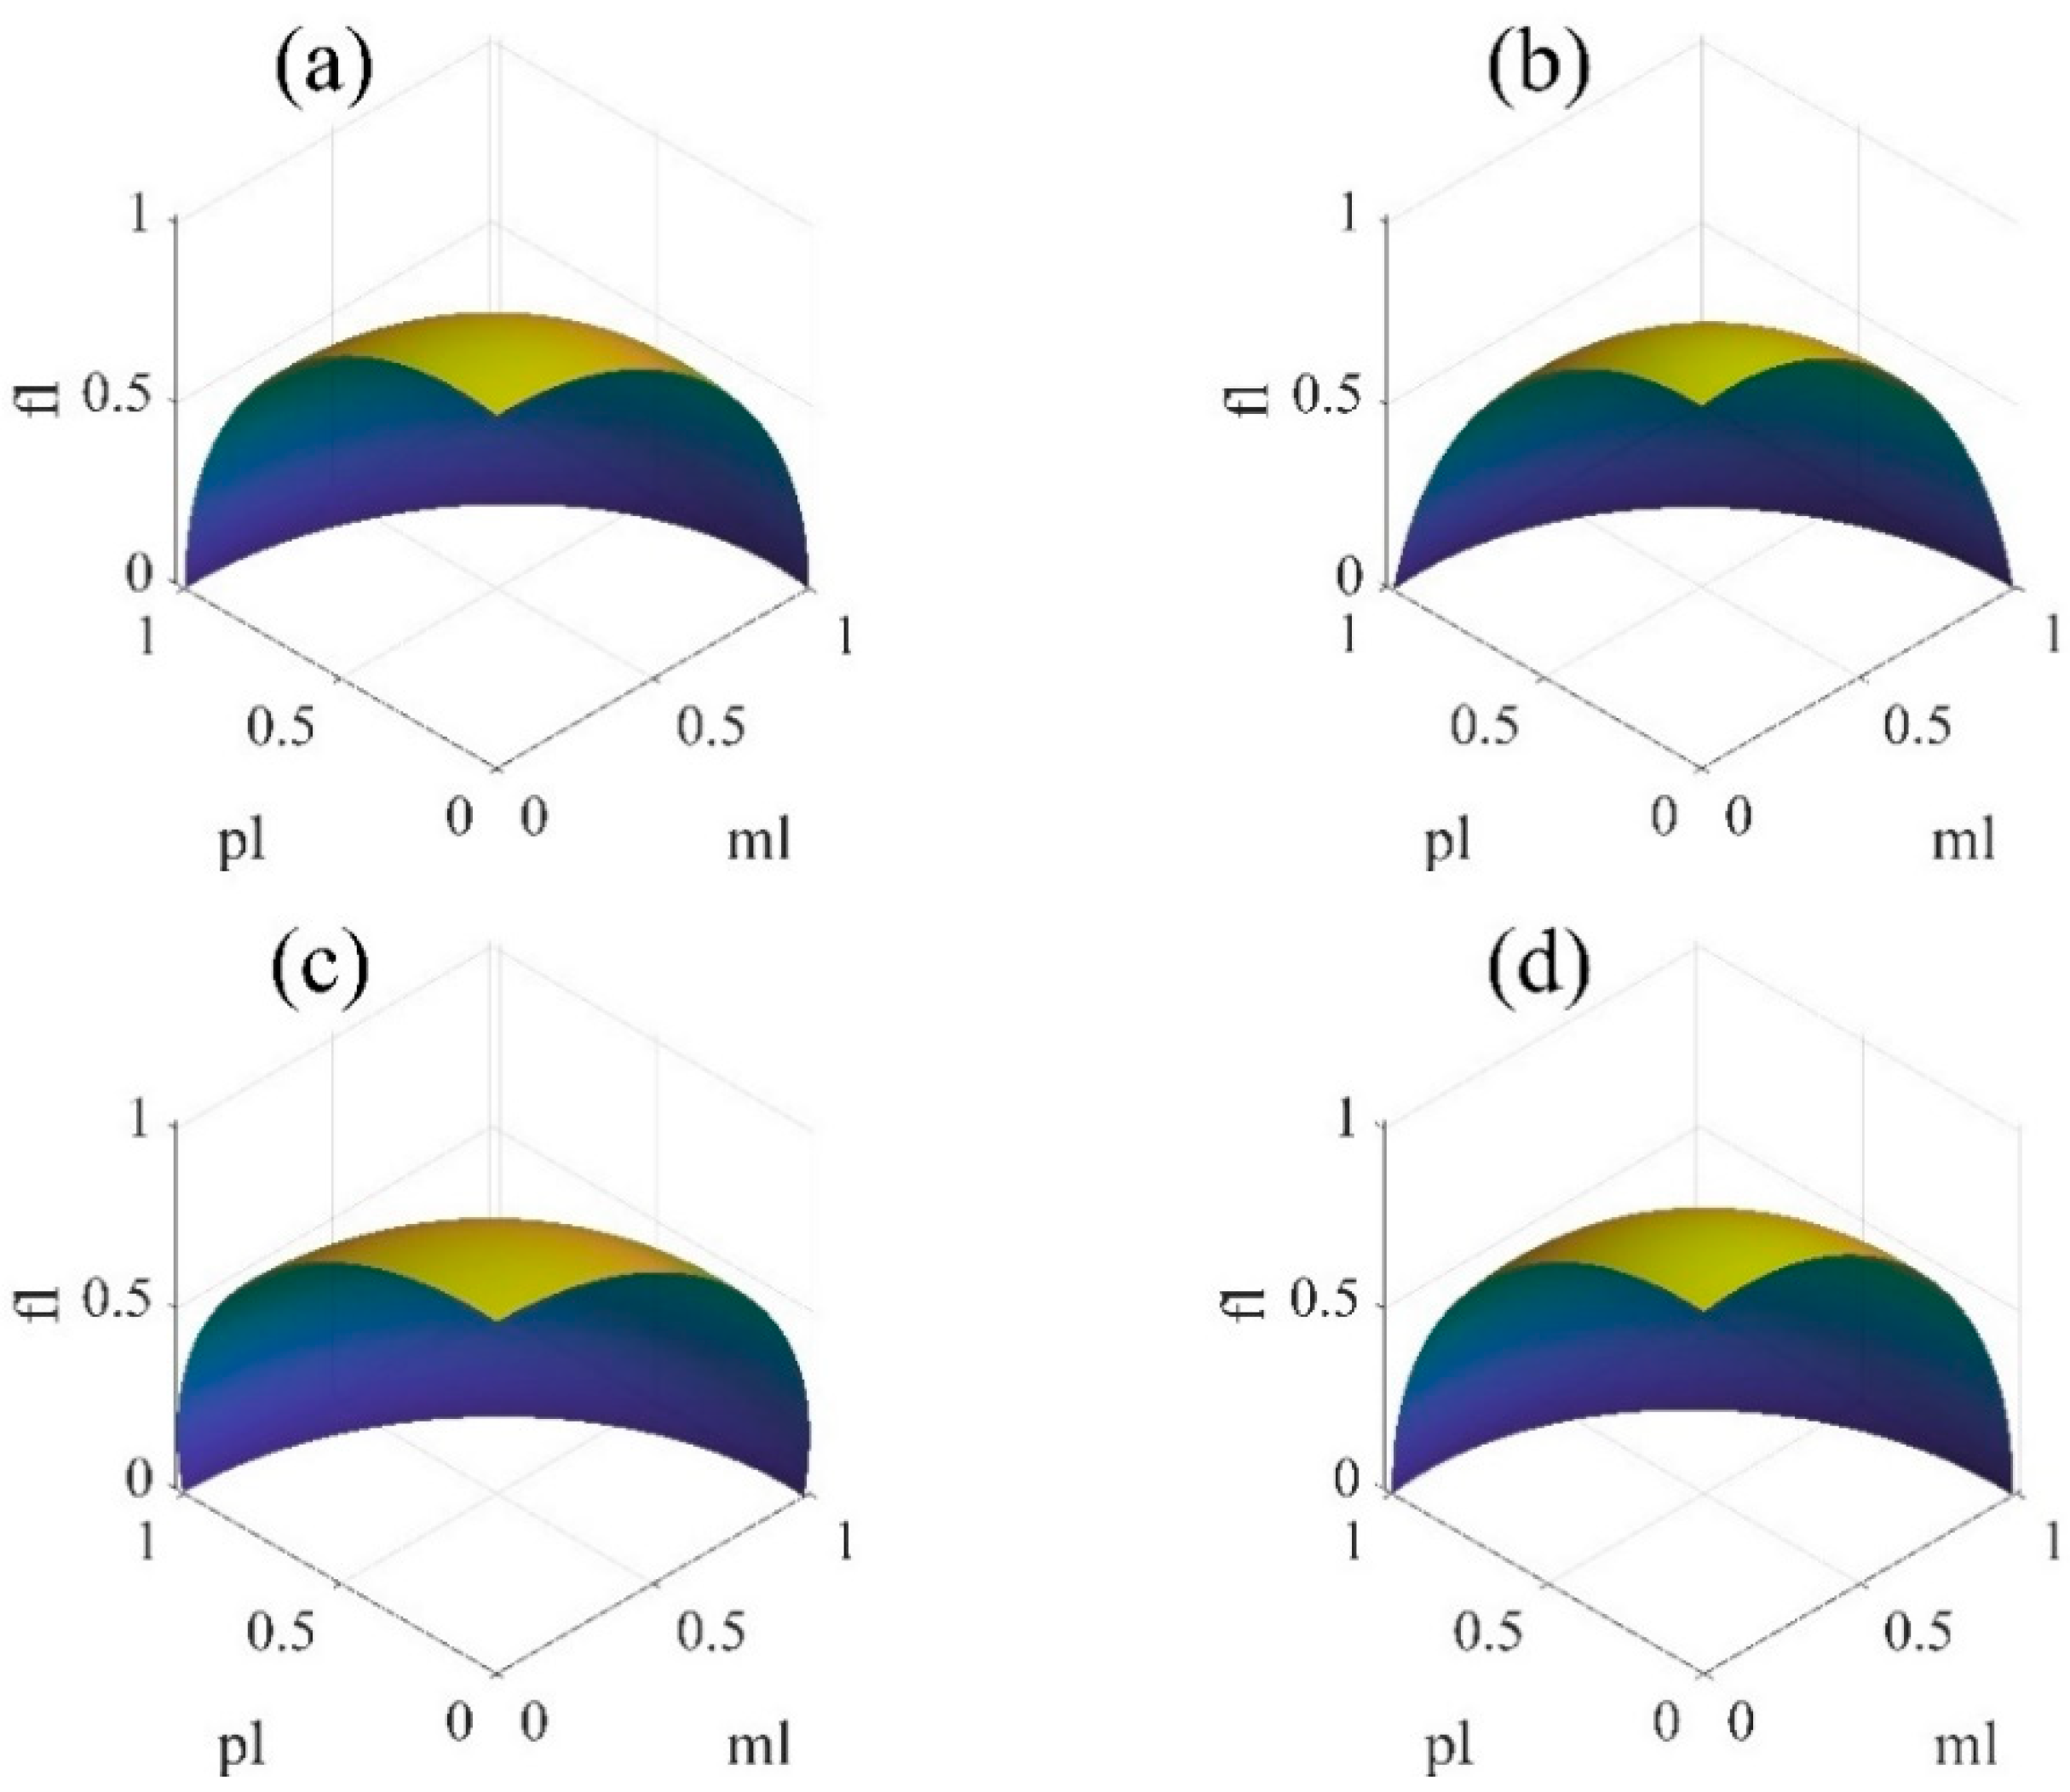
5.1. Influence of Torque on the Limit Load Equation
5.2. Influence of Axial Force on the Limit Load Equation
6. Conclusions
Author Contributions
Funding
Institutional Review Board Statement
Informed Consent Statement
Data Availability Statement
Acknowledgments
Conflicts of Interest
Nomenclature
| A | Axial half-length, mm |
| B | Circumferential half-length, mm |
| C | Defect depth, mm |
| a | A/(RoT)0.5 |
| b | B/(πRo) |
| c | C/T |
| E | Young’s modulus, GPa |
| F | Axial force, kN |
| f | Axial force, dimensionless |
| L | Length of straight pipe, mm |
| M | Bending moment, kNm |
| m | Bending moment, dimensionless |
| N | Torque, kNm |
| n | Torque, dimensionless |
| P | Internal pressure, MPa |
| p | Internal pressure, dimensionless |
| Pc | Axial equivalent surface load, MPa |
| Ro | Outer radius of straight pipe, mm |
| Ri | Inner radius of straight pipe, mm |
| r | Mean radius of straight pipe, mm |
| T | Thickness of straight pipe, mm |
| σy | Yield strength of the material, MPa |
| µ | Poisson’s ratio |
| Subscripts | |
| LS | Limit load of defective straight pipe under single load |
| L0 | Limit load of defect-free straight pipe |
| LC | Limit load of defective straight pipe under complex loads |
| l | Limit load of defective straight pipe |
| l-g | Allowable load of medium- and low-pressure equipment nozzles |
| l-h | Allowable load of high-pressure equipment nozzles |
| Abbreviations | |
| SPLWT | Straight pipe with local wall-thinning defect |
References
- Zhang, L.; Wang, Y.P.; Chen, J.; Liu, C.D. Evaluation of local thinned pressurized elbows. Int. J. Press. Vessel. Pip. 2001, 78, 697–703. [Google Scholar]
- Zhu, X.K.; Leis, B.N. Theoretical and Numerical Predictions of Burst Pressure of Pipelines. J. Press. Vessel. Technol. 2006, 129, 644–652. [Google Scholar] [CrossRef]
- Zhang, S.; Zhou, W. Assessment of effects of idealized defect shape and width on the burst capacity of corroded pipelines. Thin Wall Struct. 2020, 154, 106806. [Google Scholar] [CrossRef]
- MousavI, S.S.; Moghaddam, A.S. Failure pressure estimation error for corroded pipeline using various revisions of ASME B31G. Eng. Fail. Anal. 2020, 109, 104284. [Google Scholar] [CrossRef]
- Duan, Z.X.; Shen, S.M. Analysis and experiments on the plastic limit pressure of elbows. Int. J. Press. Vessel. Pip. 2006, 83, 707–713. [Google Scholar] [CrossRef]
- Kim, J.W.; Na, M.G.; Park, C.Y. Effect of local wall thinning on the collapse behavior of pipe elbows subjected to a combined internal pressure and in-plane bending load. Nucl. Eng. Des. 2008, 238, 1275–1285. [Google Scholar] [CrossRef]
- Oh, C.K.; Kim, Y.J.; Park, C.Y. Effects of local wall thinning on net-section limit loads for pipes under combined pressure and bending. Nucl. Eng. Des. 2009, 239, 261–273. [Google Scholar] [CrossRef]
- Han, L.H.; He, S.Y.; Wang, Y.P.; Liu, C.D. Limit moment of local wall thinning in pipe under bending. Int. J. Press. Vessel. Pip. 1999, 76, 539–542. [Google Scholar] [CrossRef]
- Kim, Y.J.; Oh, C.K.; Park, C.Y.; Hasegawa, K. Net-section limit load approach for failure strength estimates of pipes with local wall thinning. Int. J. Press. Vessel. Pip. 2006, 83, 546–555. [Google Scholar] [CrossRef]
- Shuai, Y.; Zhou, D.C.; Wang, X.H.; Yin, H.G.; Zhu, S.D.; Li, J.; Cheng, Y. Local buckling failure analysis of high strength pipelines containing a plain dent under bending moment. J. Nat. Gas. Sci. Eng. 2020, 77, 103266. [Google Scholar] [CrossRef]
- Du, X.; Jie, Z.; Liu, Y.H. Plastic failure analysis of defective pipes with creep damage under multi-loading systems. Int. J. Mech. Sci. 2017, 128–129, 428–444. [Google Scholar] [CrossRef]
- Chegeni, B.; Jayasuriya, S.; Das, S. Effect of corrosion on thin-walled pipes under combined internal pressure and bending. Thin Wall Struct. 2019, 143, 106218. [Google Scholar] [CrossRef]
- ASME B31G-2012; Manual for Determining the Remaining Strength of Corroded Pipelines. The American Society of Mechanical Engineers, Three Park Avenue: New York, NY, USA, 2012.
- API 579-1/ASME FFS-1; Fitness-For-Service, the American Petroleum Institute and the American Society of Mechanical Engineers. American Petroleum Institute and American Society of Mechanical Engineers: Washington, DC, USA, 2016.
- GB/T 19624-2019; General Administration of Quality Supervision, Inspection and Quarantine of the People’s Republic of China, Safety Assessment for in-Service Pressure Vessels Containing Defects. Standards Press of China: Beijing, China, 2019.
- Liu, Y.H.; Cen, Z.Z.; Chen, H.F.; Xu, B.Y. Plastic collapse analysis of defective pipelines under multi-loading systems. Int. J. Mech. Sci. 2000, 42, 1607–1622. [Google Scholar] [CrossRef]
- Heitzer, M. Plastic limit loads of defective pipes under combined internal pressure and axial tension. Int. J. Mech. Sci. 2002, 44, 1219–1224. [Google Scholar] [CrossRef]
- Chen, H.F.; Shu, D.W. Lower and upper bound limit analyses for pipeline with multi-slots of various configurations. Int. J. Press. Vessel. Pip. 2000, 77, 17–25. [Google Scholar] [CrossRef]
- Chen, H.F.; Shu, D. Simplified limit analysis of pipelines with multi-defects. Eng. Struct. 2001, 23, 207–213. [Google Scholar] [CrossRef]
- Zhao, P.C.; Shuai, J.; Tang, Y. Impact of axial stress on ultimate internal pressure of corroded pipelines. China Saf. Sci. J. 2019, 29, 70–75. [Google Scholar]
- Cui, P.; Zhou, C.Y. Limit Load Analysis of Elbow with Local Wall Thinning under Combined Loads. Appl. Mech. Mater. 2015, 750, 198–205. [Google Scholar] [CrossRef]
- Mondal, B.C.; Dhar, A.S. Burst pressure of corroded pipelines considering combined axial forces and bending moments. Eng. Struct. 2019, 186, 43–51. [Google Scholar] [CrossRef]
- Shuai, Y.; Zhang, X.; Feng, C.; Han, J.Y.; Cheng, Y. A novel model for prediction of burst capacity of corroded pipelines subjected to combined loads of bending moment and axial compression. Int. J. Press. Vessel. Pip. 2022, 196, 104621. [Google Scholar] [CrossRef]
- GB/T 50316; General Administration of Quality Supervision, Inspection and Quarantine of the People’s Republic of China, Industrial Metal Pipeline Design Specification. Standards Press of China: Beijing, China, 2008.
- Bao, S.; Liu, Y.; Mao, J.; Ge, R.; Li, X.Y. Numerical and experimental investigation on limit load of elbow with local thinning area. Int. J. Press. Vessel. Pip. 2019, 172, 414–422. [Google Scholar] [CrossRef]
- Kim, Y.J.; Oh, C.S. Limit loads for pipe bends under combined pressure and in-plane bending based on finite element limit analysis. Int. J. Press. Vessel. Pip. 2006, 83, 148–153. [Google Scholar] [CrossRef]
- Guo, C.X.; Li, P.N.; Jiang, X.D. Plastic Collapse Load Analysis of Circumferentially Cracked Pipes under Combined Loads of Axial Force, BendingMoment, Torsion and Internal Pressure. Press. Vessel Technol. 1999, 3–9. [Google Scholar] [CrossRef]
- Chen, G.; Ja, G.D.; Tao, X.R.; Zuo, S.Z.; Sun, L. Numerical Analyses for Plastic Limit Loads of Local Wall-Thinning Pressure Piping Under Bending and Internal Pressure; Pressure Vessel Branch of Chinese Mechanical Engineering Society: Hefei, China, 2001. [Google Scholar]


| Straight Pipe Size, mm | |
| Ro | Outer radius |
| Ri | Inner radius |
| T | Thickness |
| L | Length |
| Defect Size, mm | |
| A | Axial half-length |
| B | Circumferential half-length |
| C | Defect depth |
| Dimensionless Defect Size | |
| a | A/(RoT)0.5 |
| b | B/(πRo) |
| c | C/T |
| Material | Elastic Modulus, GPa | Poisson’s Ratio | Yield Strength, MPa |
|---|---|---|---|
| 20 g | 207 | 0.3 | 245 |
| Equipment | DN | F/N | TL/N | TC/ N | ML/Nm | MC/Nm | MT/Nm |
|---|---|---|---|---|---|---|---|
| Medium and low-pressure equipment | 80 | 1500 | 1500 | 1500 | 600 | 600 | 600 |
| 100 | 2100 | 2100 | 2100 | 1100 | 1100 | 1100 | |
| 150 | 4600 | 4600 | 4600 | 3400 | 3400 | 3400 | |
| High-pressure equipment | 80 | 7960 | 5640 | 5640 | 5720 | 5720 | 5720 |
| 100 | 12,200 | 11,460 | 11,460 | 11,640 | 11,640 | 11,640 | |
| 150 | 24,920 | 20,400 | 20,400 | 20,800 | 20,800 | 20,800 |
| Level | a | b | c |
|---|---|---|---|
| 1 | 0.2 | 0.2 | 0.2 |
| 2 | 1 | 0.4 | 0.4 |
| 3 | 3 | 0.6 | 0.6 |
| 4 | 5 | 0.8 | 0.8 |
| Test Number | a | b | c |
|---|---|---|---|
| 1 | 0.2 | 0.2 | 0.2 |
| 2 | 0.2 | 0.4 | 0.4 |
| 3 | 1.0 | 0.8 | 0.6 |
| 4 | 0.2 | 0.6 | 0.6 |
| 5 | 5.0 | 0.6 | 0.4 |
| 6 | 0.2 | 0.8 | 0.8 |
| 7 | 5.0 | 0.2 | 0.8 |
| 8 | 3.0 | 0.8 | 0.4 |
| 9 | 3.0 | 0.6 | 0.2 |
| 10 | 5.0 | 0.8 | 0.2 |
| 11 | 3.0 | 0.4 | 0.8 |
| 12 | 1.0 | 0.4 | 0.2 |
| 13 | 1.0 | 0.6 | 0.8 |
| 14 | 1.0 | 0.2 | 0.4 |
| 15 | 5.0 | 0.4 | 0.6 |
| 16 | 3.0 | 0.2 | 0.6 |
| Defect Size | Limit Load | |||||
|---|---|---|---|---|---|---|
| a | b | c | Limit Internal Pressure/MPa | Limit Bending Moment/kNm | Limit Torque/kNm | Limit Axial Force/kN |
| 0.2 | 0.2 | 0.2 | 42.59 | 18.92 | 15.66 | 586.12 |
| 0.2 | 0.4 | 0.4 | 40.36 | 17.04 | 11.93 | 538.00 |
| 1.0 | 0.8 | 0.6 | 36.16 | 15.06 | 10.30 | 320.43 |
| 0.2 | 0.6 | 0.6 | 37.31 | 15.48 | 8.61 | 421.57 |
| 5.0 | 0.6 | 0.4 | 22.70 | 17.08 | 14.59 | 456.37 |
| 0.2 | 0.8 | 0.8 | 34.58 | 12.85 | 6.31 | 243.84 |
| 5.0 | 0.2 | 0.8 | 9.47 | 14.57 | 10.28 | 501.88 |
| 3.0 | 0.8 | 0.4 | 27.09 | 16.38 | 12.93 | 416.90 |
| 3.0 | 0.6 | 0.2 | 35.60 | 18.21 | 15.78 | 531.68 |
| 5.0 | 0.8 | 0.2 | 35.09 | 17.61 | 15.55 | 513.44 |
| 3.0 | 0.4 | 0.8 | 14.26 | 14.59 | 10.14 | 402.53 |
| 1.0 | 0.4 | 0.2 | 39.71 | 18.01 | 16.19 | 557.07 |
| 1.0 | 0.6 | 0.8 | 24.51 | 14.32 | 8.83 | 292.87 |
| 1.0 | 0.2 | 0.4 | 34.91 | 16.88 | 12.85 | 561.34 |
| 5.0 | 0.4 | 0.6 | 16.02 | 14.75 | 11.50 | 318.98 |
| 3.0 | 0.2 | 0.6 | 21.91 | 15.70 | 12.37 | 519.19 |
| Level | pl | ml | fl |
|---|---|---|---|
| 1 | 0.1 | 0.1 | 0.1 |
| 2 | 0.2 | 0.2 | 0.2 |
| 3 | 0.4 | 0.4 | 0.4 |
| Test Number | pl | ml | fl |
|---|---|---|---|
| 1 | 0.1 | 0.1 | 0.1 |
| 2 | 0.1 | 0.2 | 0.2 |
| 3 | 0.1 | 0.4 | 0.4 |
| 4 | 0.2 | 0.1 | 0.2 |
| 5 | 0.2 | 0.2 | 0.4 |
| 6 | 0.2 | 0.4 | 0.1 |
| 7 | 0.4 | 0.1 | 0.4 |
| 8 | 0.4 | 0.2 | 0.1 |
| 9 | 0.4 | 0.4 | 0.2 |
| Internal Pressure pl | Bending Moment ml | Torque fl | Limit Torque/kNm | |||
|---|---|---|---|---|---|---|
| Axial Defect | Circumferential Defect | Large-Area Defect | Small-Area Defect | |||
| 0.1 | 0.1 | 0.1 | 18.10 | 13.09 | 14.67 | 18.43 |
| 0.1 | 0.2 | 0.2 | 17.31 | 12.28 | 14.57 | 17.88 |
| 0.1 | 0.4 | 0.4 | 14.93 | 9.33 | 13.49 | 15.01 |
| 0.2 | 0.1 | 0.2 | 17.61 | 12.49 | 14.49 | 17.85 |
| 0.2 | 0.2 | 0.4 | 15.53 | 10.67 | 13.75 | 15.72 |
| 0.2 | 0.4 | 0.1 | 16.33 | 11.43 | 13.79 | 16.83 |
| 0.4 | 0.1 | 0.4 | 13.73 | 10.03 | 12.75 | 13.52 |
| 0.4 | 0.2 | 0.1 | 16.58 | 11.79 | 13.46 | 16.82 |
| 0.4 | 0.4 | 0.2 | 14.95 | 9.78 | 12.89 | 14.64 |
| Defect Type | Medium- and Low-Pressure Equipment | High-Pressure Equipment |
|---|---|---|
| Axial defect | 1.28% | 9.03% |
| Circumferential defect | 1.44% | 9.01% |
| Large-area defect | 0.59% | 6.67% |
| Small-area defect | 1.20% | 8.41% |
| Defect Type | Medium and Low-Pressure Equipment | High-Pressure Equipment |
|---|---|---|
| Axial defect | 0.83% | 8.57% |
| Circumferential defect | 1.80% | 12.93% |
| Large-area defect | 1.15% | 8.07% |
| Small-area defect | 1.01% | 7.51% |
Publisher’s Note: MDPI stays neutral with regard to jurisdictional claims in published maps and institutional affiliations. |
© 2022 by the authors. Licensee MDPI, Basel, Switzerland. This article is an open access article distributed under the terms and conditions of the Creative Commons Attribution (CC BY) license (https://creativecommons.org/licenses/by/4.0/).
Share and Cite
Li, Y.; Gao, B.; Liu, S.; Lin, K.; Ding, J. Finite Element Analysis of the Limit Load of Straight Pipes with Local Wall-Thinning Defects under Complex Loads. Appl. Sci. 2022, 12, 4850. https://doi.org/10.3390/app12104850
Li Y, Gao B, Liu S, Lin K, Ding J. Finite Element Analysis of the Limit Load of Straight Pipes with Local Wall-Thinning Defects under Complex Loads. Applied Sciences. 2022; 12(10):4850. https://doi.org/10.3390/app12104850
Chicago/Turabian StyleLi, Yan, Bingjun Gao, Shuo Liu, Kaiming Lin, and Juncai Ding. 2022. "Finite Element Analysis of the Limit Load of Straight Pipes with Local Wall-Thinning Defects under Complex Loads" Applied Sciences 12, no. 10: 4850. https://doi.org/10.3390/app12104850
APA StyleLi, Y., Gao, B., Liu, S., Lin, K., & Ding, J. (2022). Finite Element Analysis of the Limit Load of Straight Pipes with Local Wall-Thinning Defects under Complex Loads. Applied Sciences, 12(10), 4850. https://doi.org/10.3390/app12104850