Article

Corrosion-Resistance Analysis of HA Layer Deposited through Electrophoresis on Ti4Al4Zr Metallic Substrate

1
Faculty of Materials Science and Engineering, “Gh. Asachi” Technical University from Iasi, 700050 Iași, Romania
2
Faculty of Dental Medicine, “Grigore T. Popa” University of Medicine and Pharmacy, 700115 Iasi, Romania
3
Integrated Center for Research, Development and Innovation in Advanced Materials, Nanotechnologies, and Distributed Systems for Fabrication and Control, Department of Computers, Electronics and Automation, Ștefan cel Mare University of Suceava, 720225 Suceava, Romania
*
Authors to whom correspondence should be addressed.
Appl. Sci. 2021, 11(9), 4198; https://doi.org/10.3390/app11094198
Submission received: 4 April 2021 / Revised: 28 April 2021 / Accepted: 4 May 2021 / Published: 5 May 2021
(This article belongs to the Special Issue Active Materials for Medical Applications)

Abstract

:
An alloy surface with possible applications in the medical field, Ti4A14Zr, was improved through the deposition of a thin hydroxyapatite (HA) layer. In this paper, we analyzed the growth of a HA layer through electrophoresis and the corrosion resistance of the metallic sample covered with the ceramic layer. The substrate surface was processed via chemical procedures before the HA deposition. The state of the metallic surface and that of the layer of HA were investigated using scanning electron microscopy (SEM) and energy dispersive spectroscopy (EDS) analysis of the chemical composition. The results indicate a high increase in the corrosion resistance associated with the ceramic layer compared to the metallic basic layer. Moreover, the analysis revealed the formation of a homogeneous TiO2 layer on the surface of the metallic substrate. The titanium oxide layer identified by SEM–EDS and confirmed by EIS was very homogeneous and resistant, with a compact microstructural appearance and submicron dimension. The layer composed of TiO2 and HA provided good corrosion protection.

1. Introduction

Titanium (Ti) and Ti-based alloys generally present desirable mechanical characteristics, corrosion resistance, and biocompatibility [1,2,3]. Titanium-based alloys have been extensively used in the last four decades to create implant elements and medical tools like prostheses or dental implants. The corrosion resistance and, at a certain level, antibacterial properties of titanium-based alloys in biomedical applications are mainly due to the formation of a passive TiO2 layer on the surface [4,5]. The domain of oral implants involves many medical fields, with breakthroughs made in surgery, prosthetics, and dental prosthetics, in particular, offering new possibilities in the restoration of prosthetics [6,7]. There are few published experimental results about the chemical, electrochemical, terminal, or combined features of surface preparation of Ti-based alloys that facilitate both the desired chemical, mechanical, and biological reactions at a superficial level and the deposition of nonmetallic layers [8,9,10,11,12]. TiAlZr systems have gained some attention as implantable materials in recent years and are considered a potential solution for medical applications where Ti is not applicable [3,4,5,13,14]. Hydroxyapatite (HA) in large or small quantities is not toxic to biological cells) and is almost inactive in biological environments. Additionally, numerous studies have investigated and confirmed the excellent properties of hydroxyapatite in contact with bone tissues [15,16]. The most efficient method of enhancing the osteogenesis of Ti-based alloys in medical implants is covering them with a bioactive layer such as hydroxyapatite. Electrophoresis deposition is a technique that uses the motion of charged particles in a suspension in the presence of an electric field. This electric field allows the formation of well-established particles in thin layers, modified in layers regardless of their shape, or even in thicker layers on their own. The first applications of electrophoresis were in the modeling of ceramic materials and in the production of coatings. There is also a growing interest in the use of this technique in the handling of biomaterials and biological components such as natural polymers, proteins, bacteria, and cells. The process is useful for the application of polymeric materials, pigments, dyes, ceramics, or metals on any surface of an electrically conductive material. The microstructural, chemical, and mechanical characteristics of complex elements obtained via superficial layer deposition remain to be determined [17,18,19].
The paper deals with a chemical treatment method for the surface of an implantable metallic material based on Ti, deposition of a thin layer of hydroxyapatite (HA) through electrophoresis, and analysis of the resistance to electrocorrosion of the resulting films using EIS. Surface investigations were performed via 2D and 3D SEM.

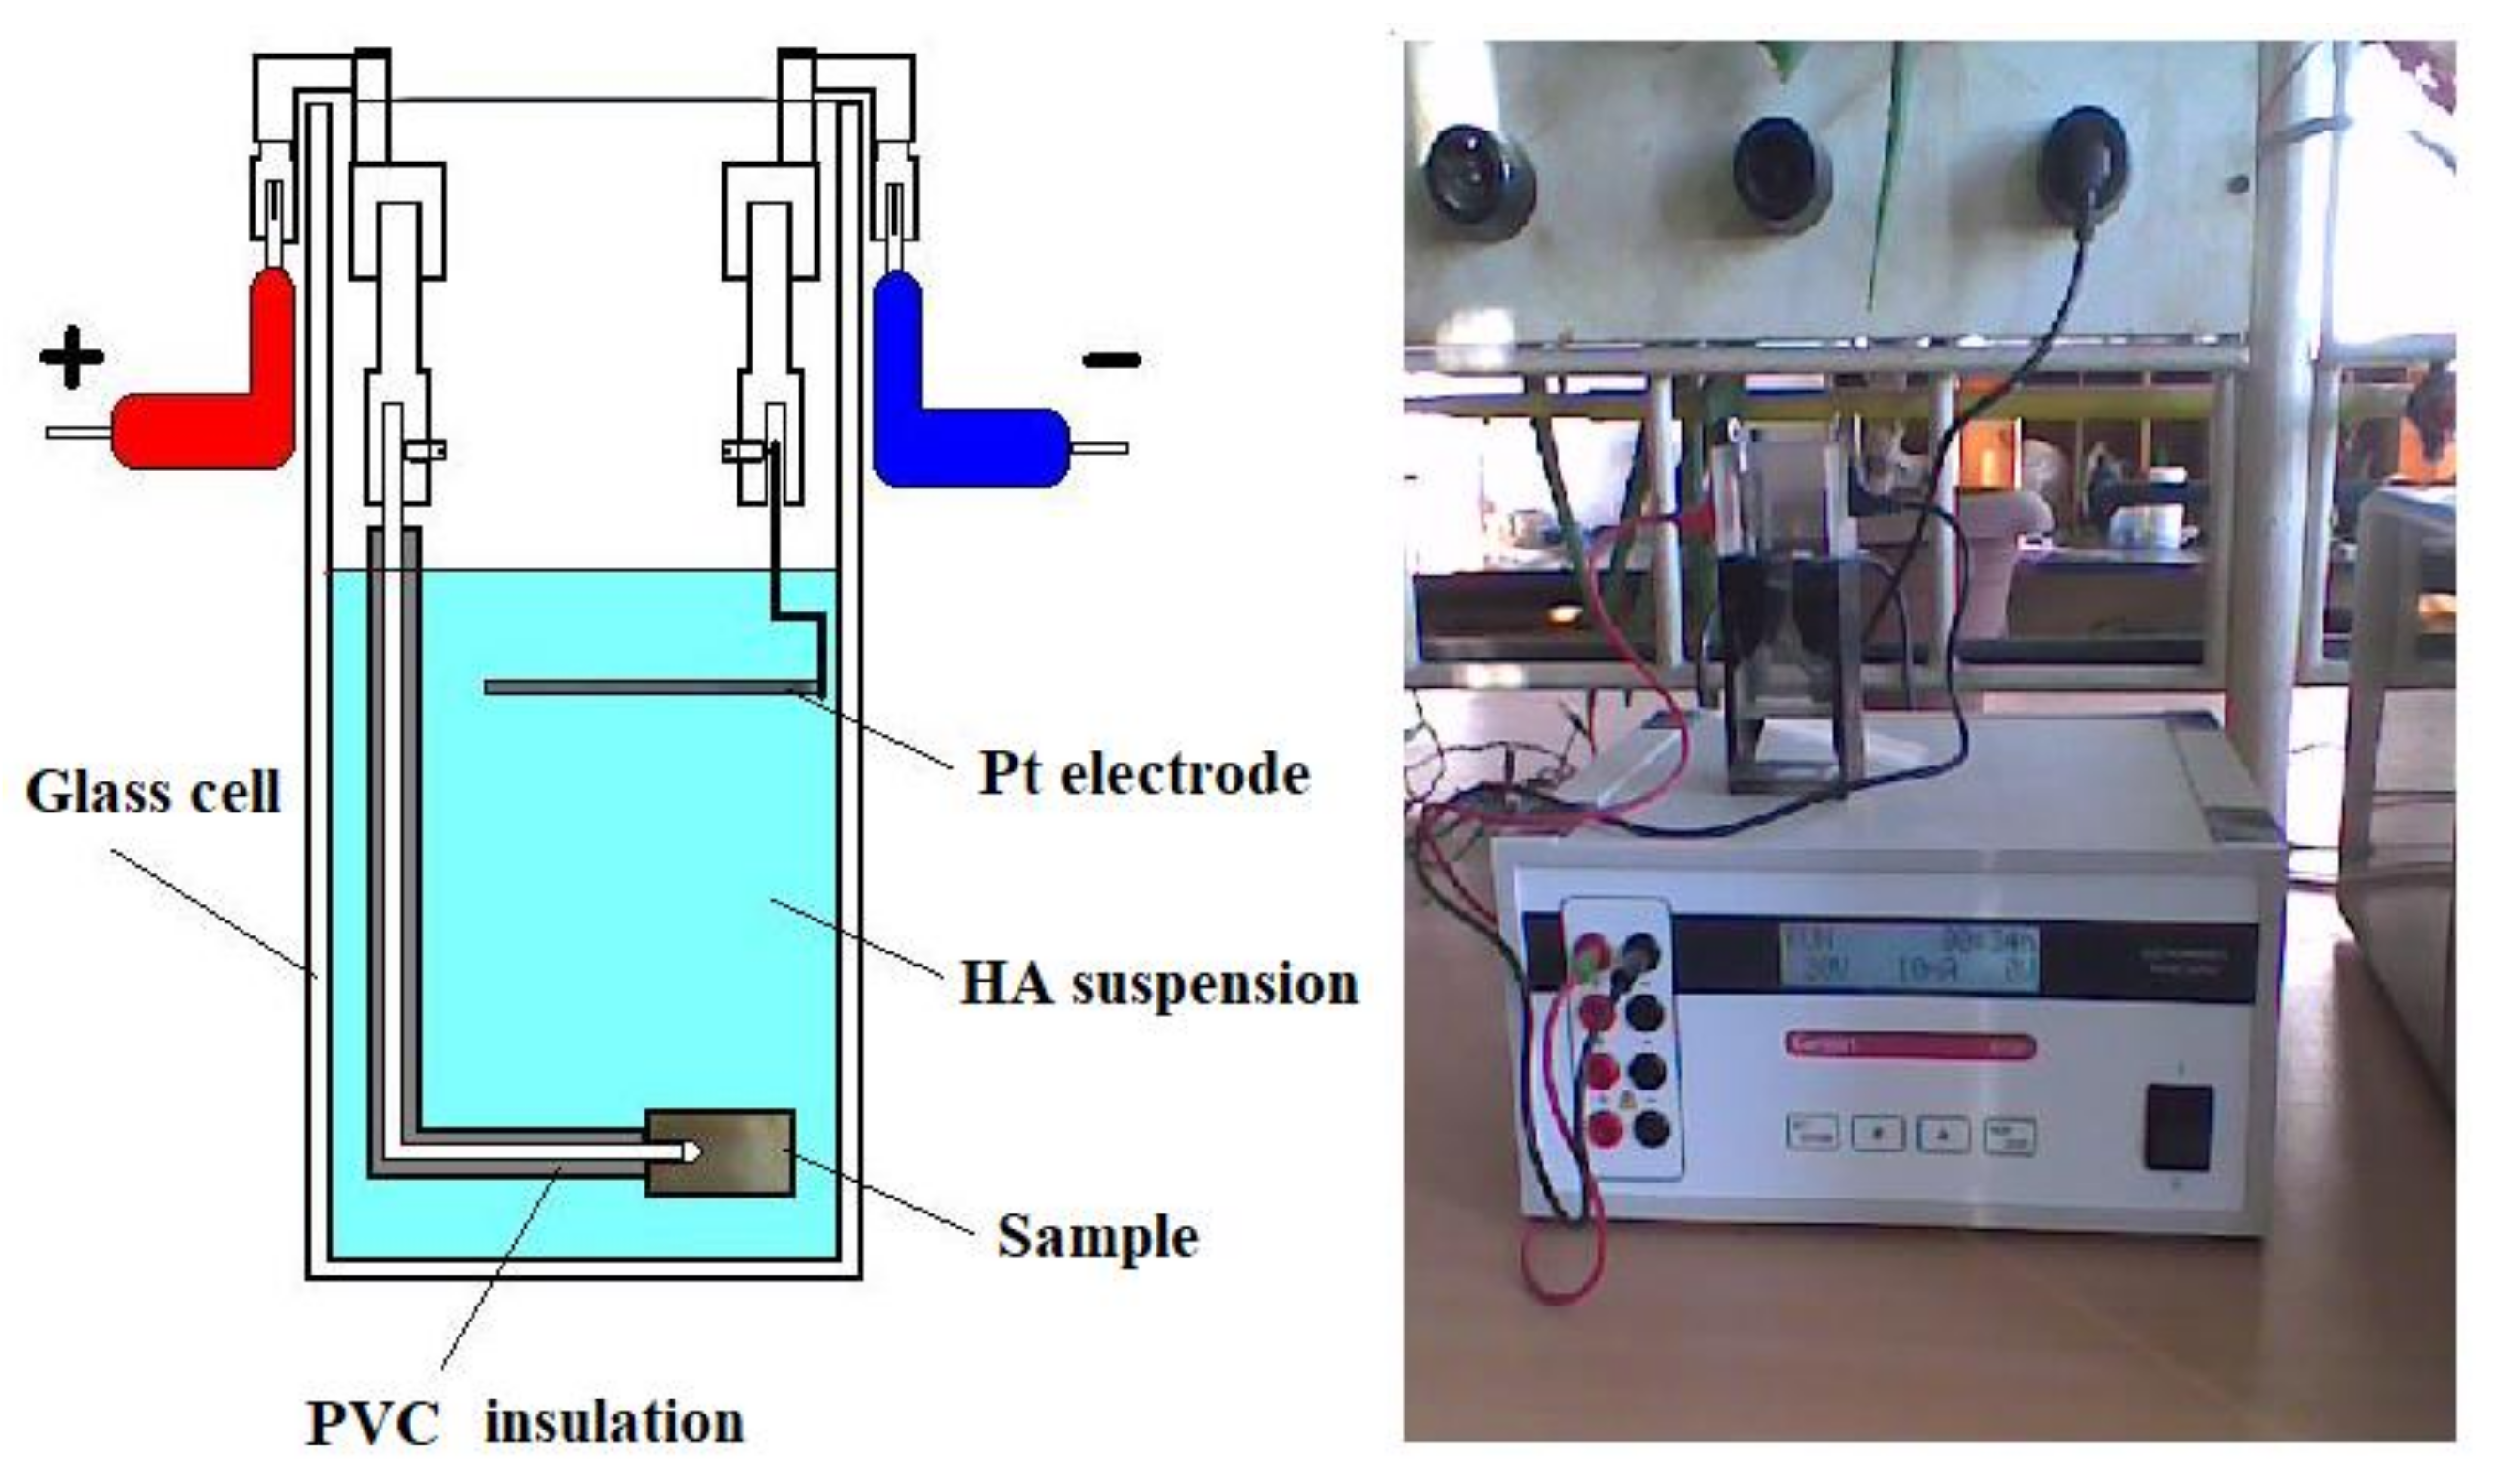
2. Materials and Methods
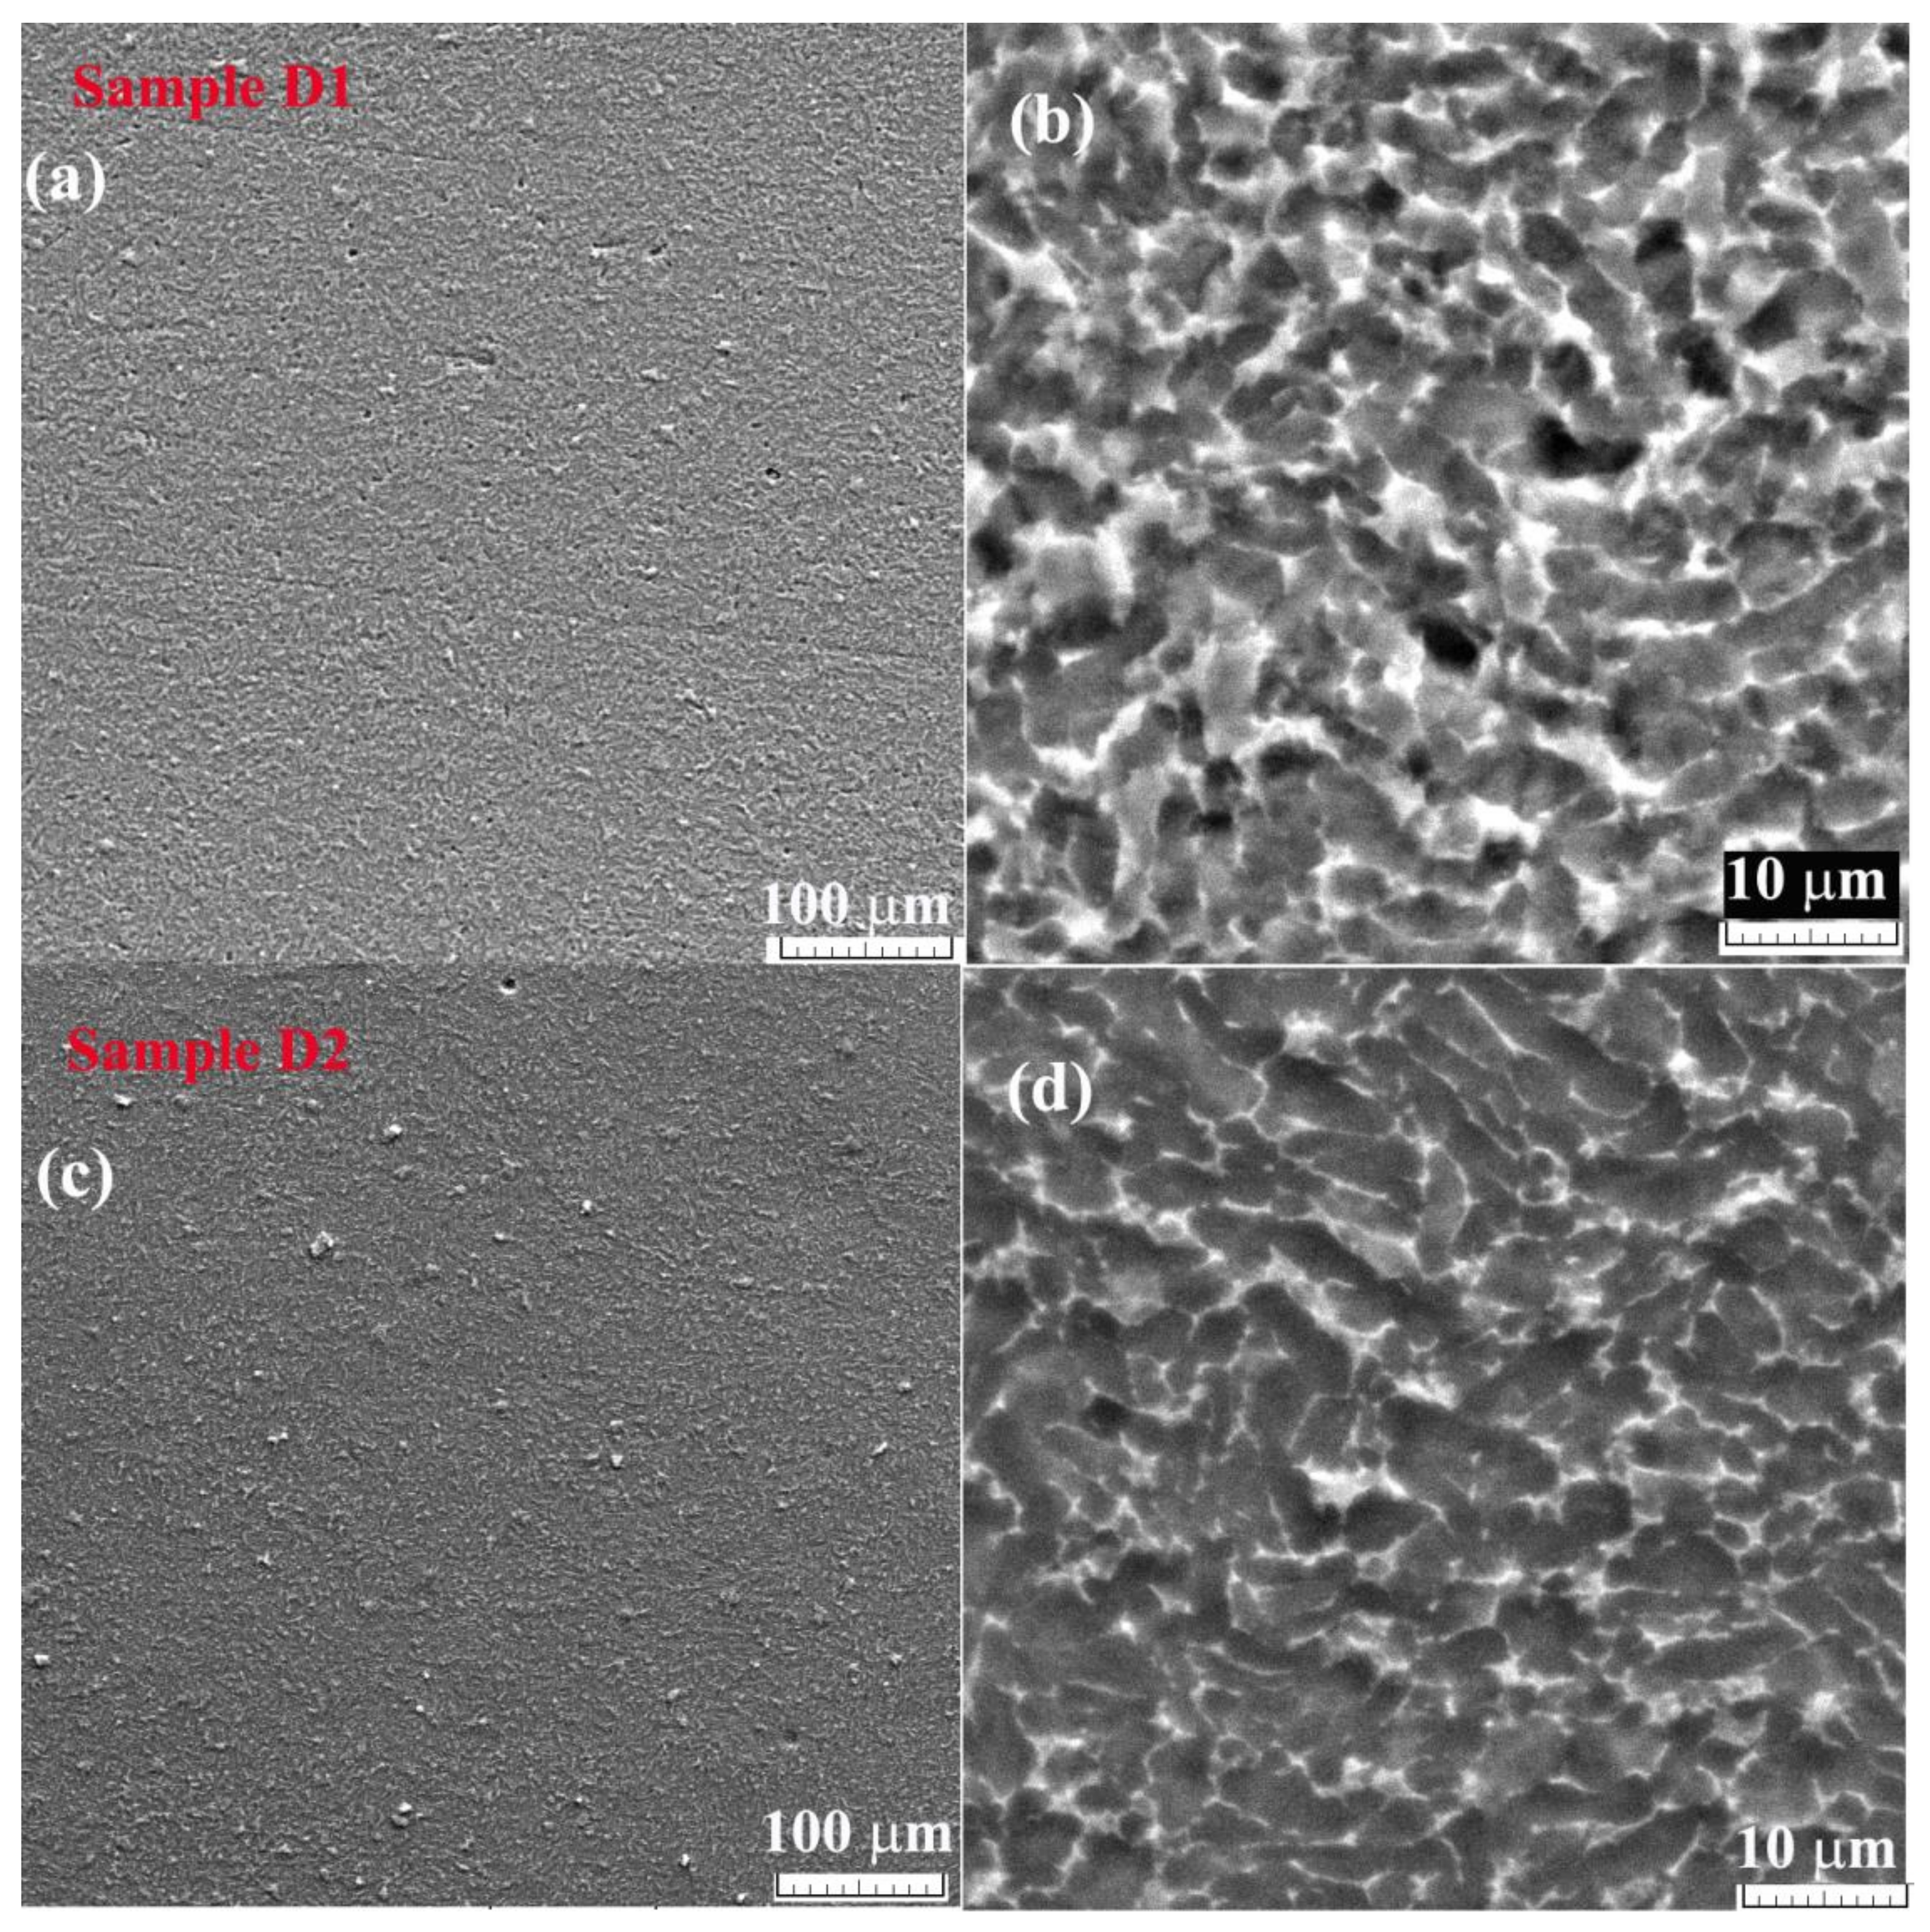
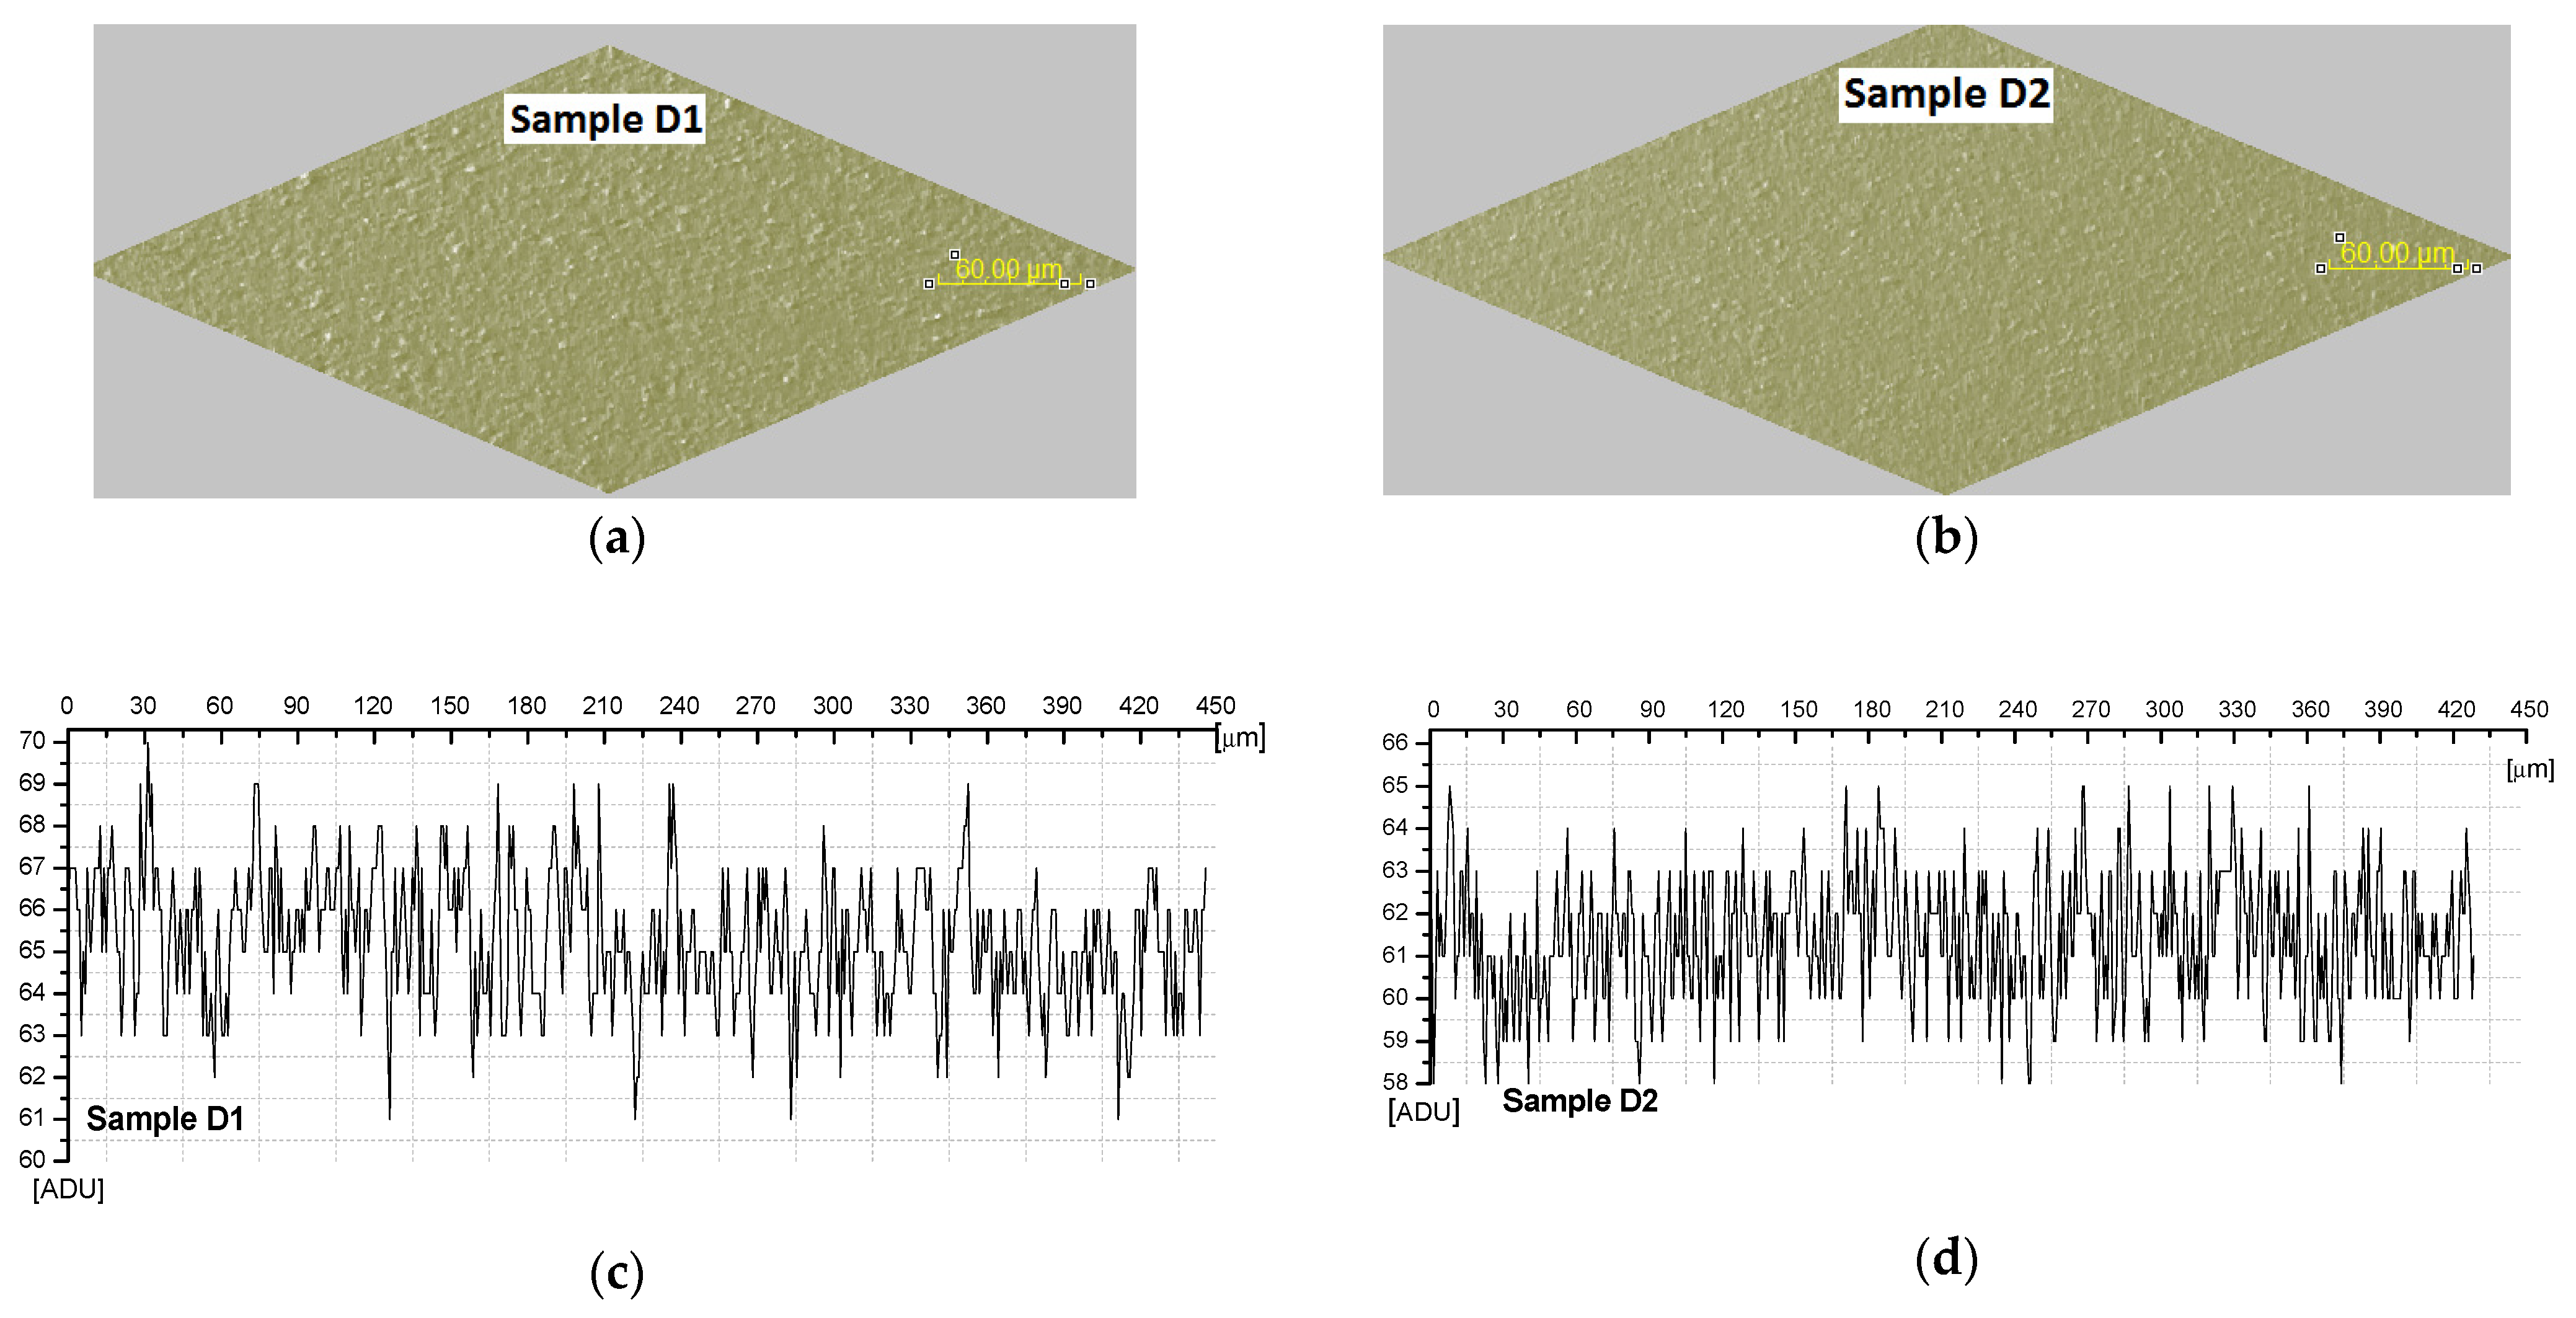
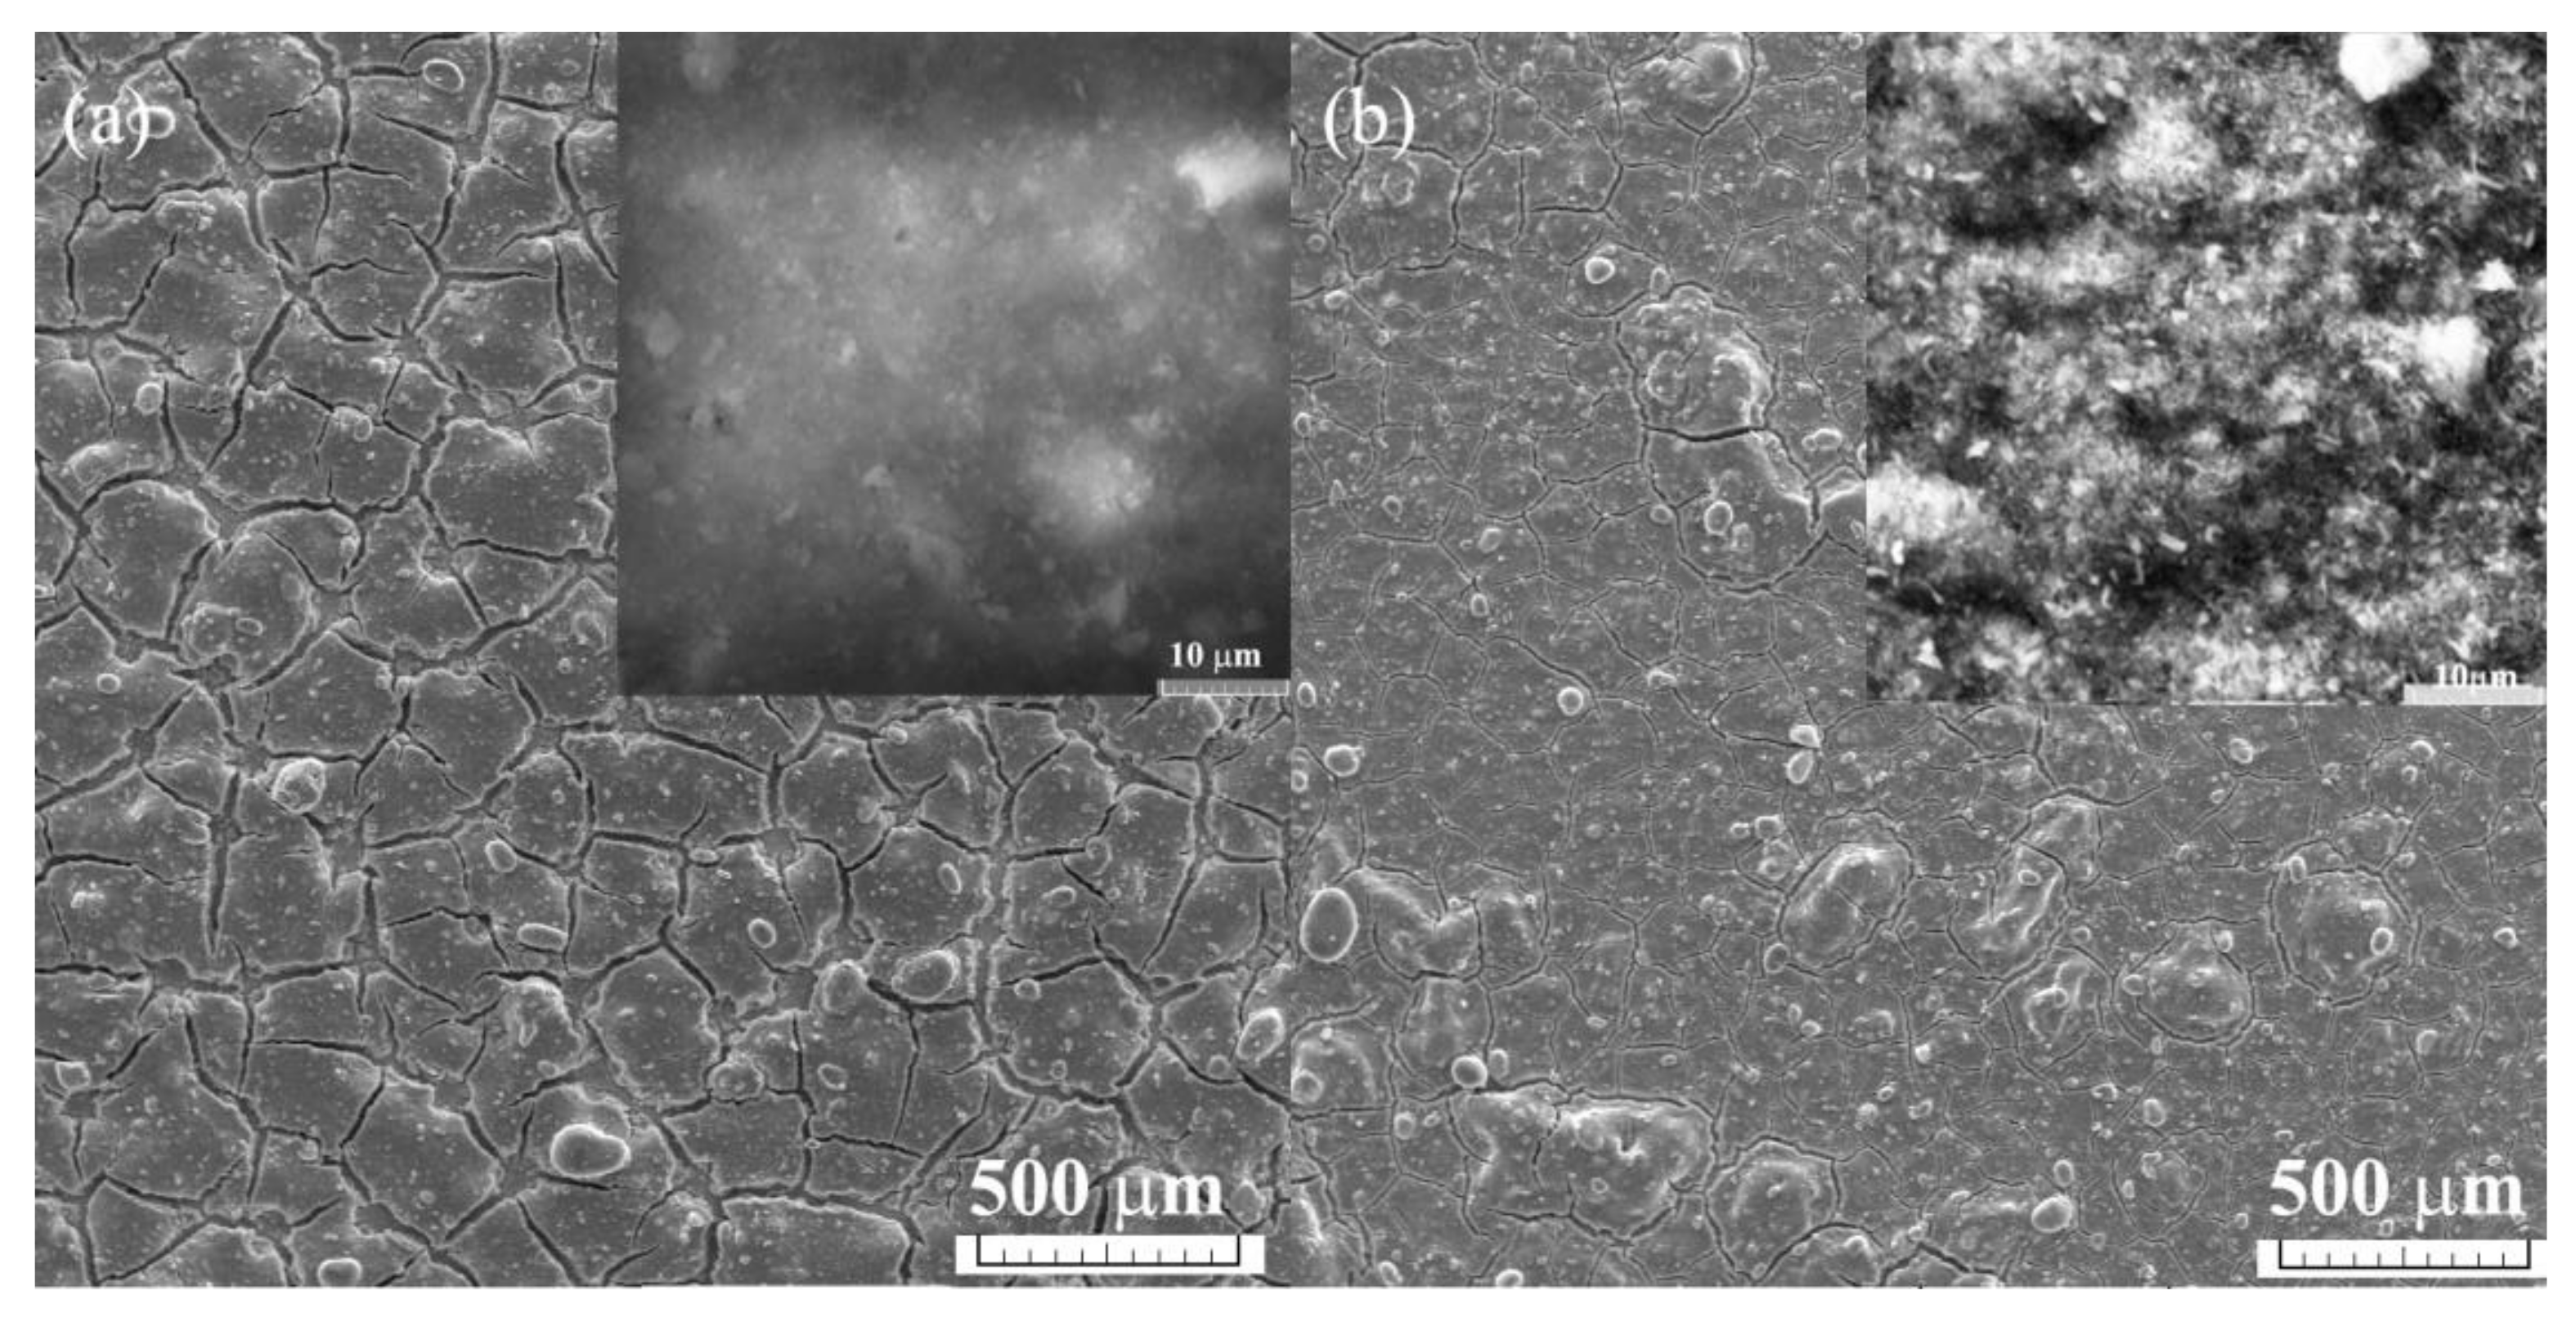
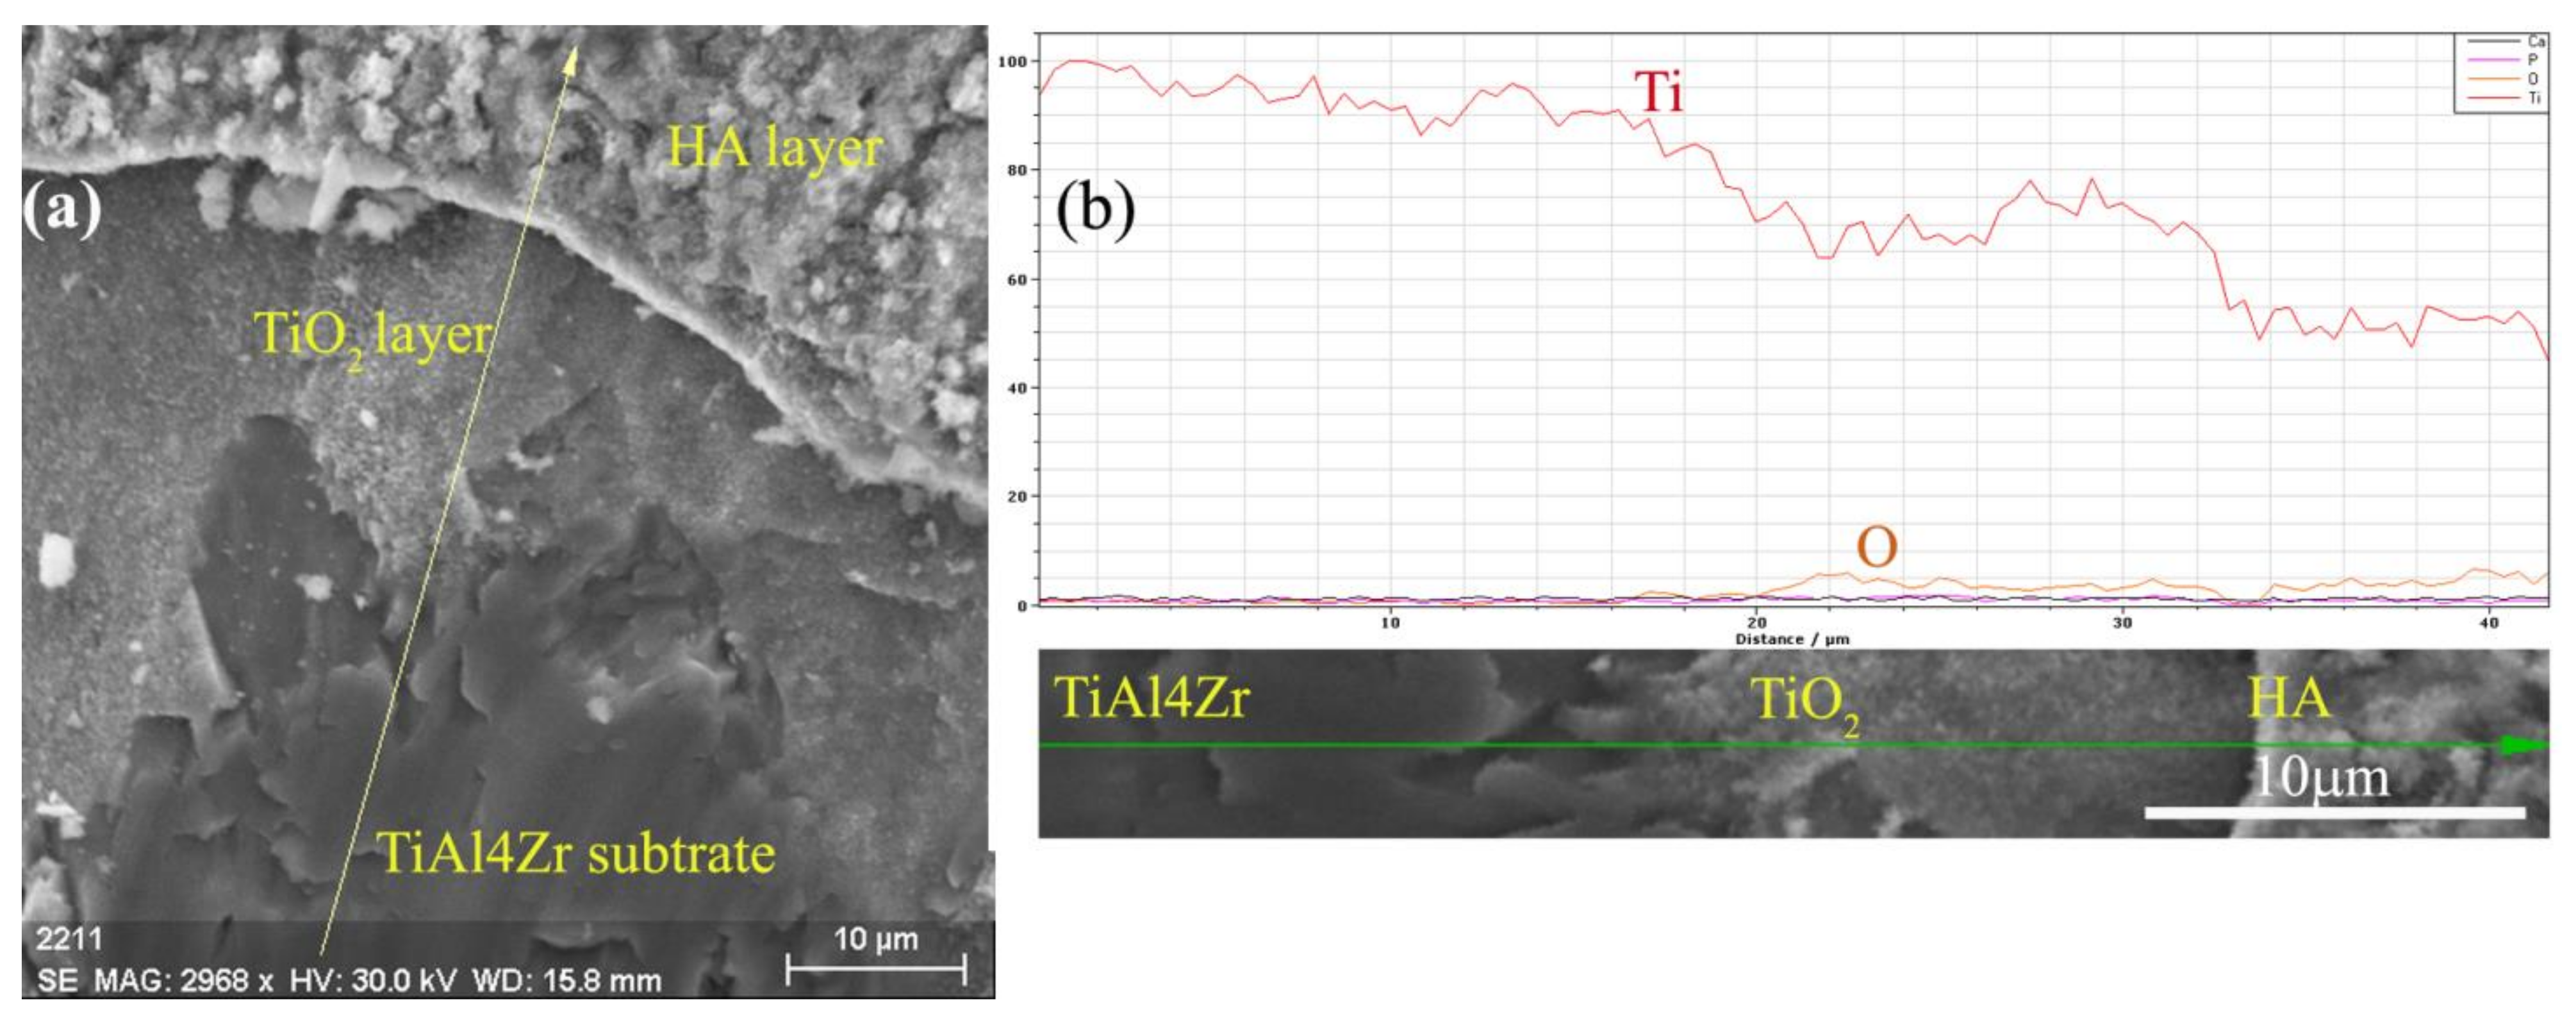
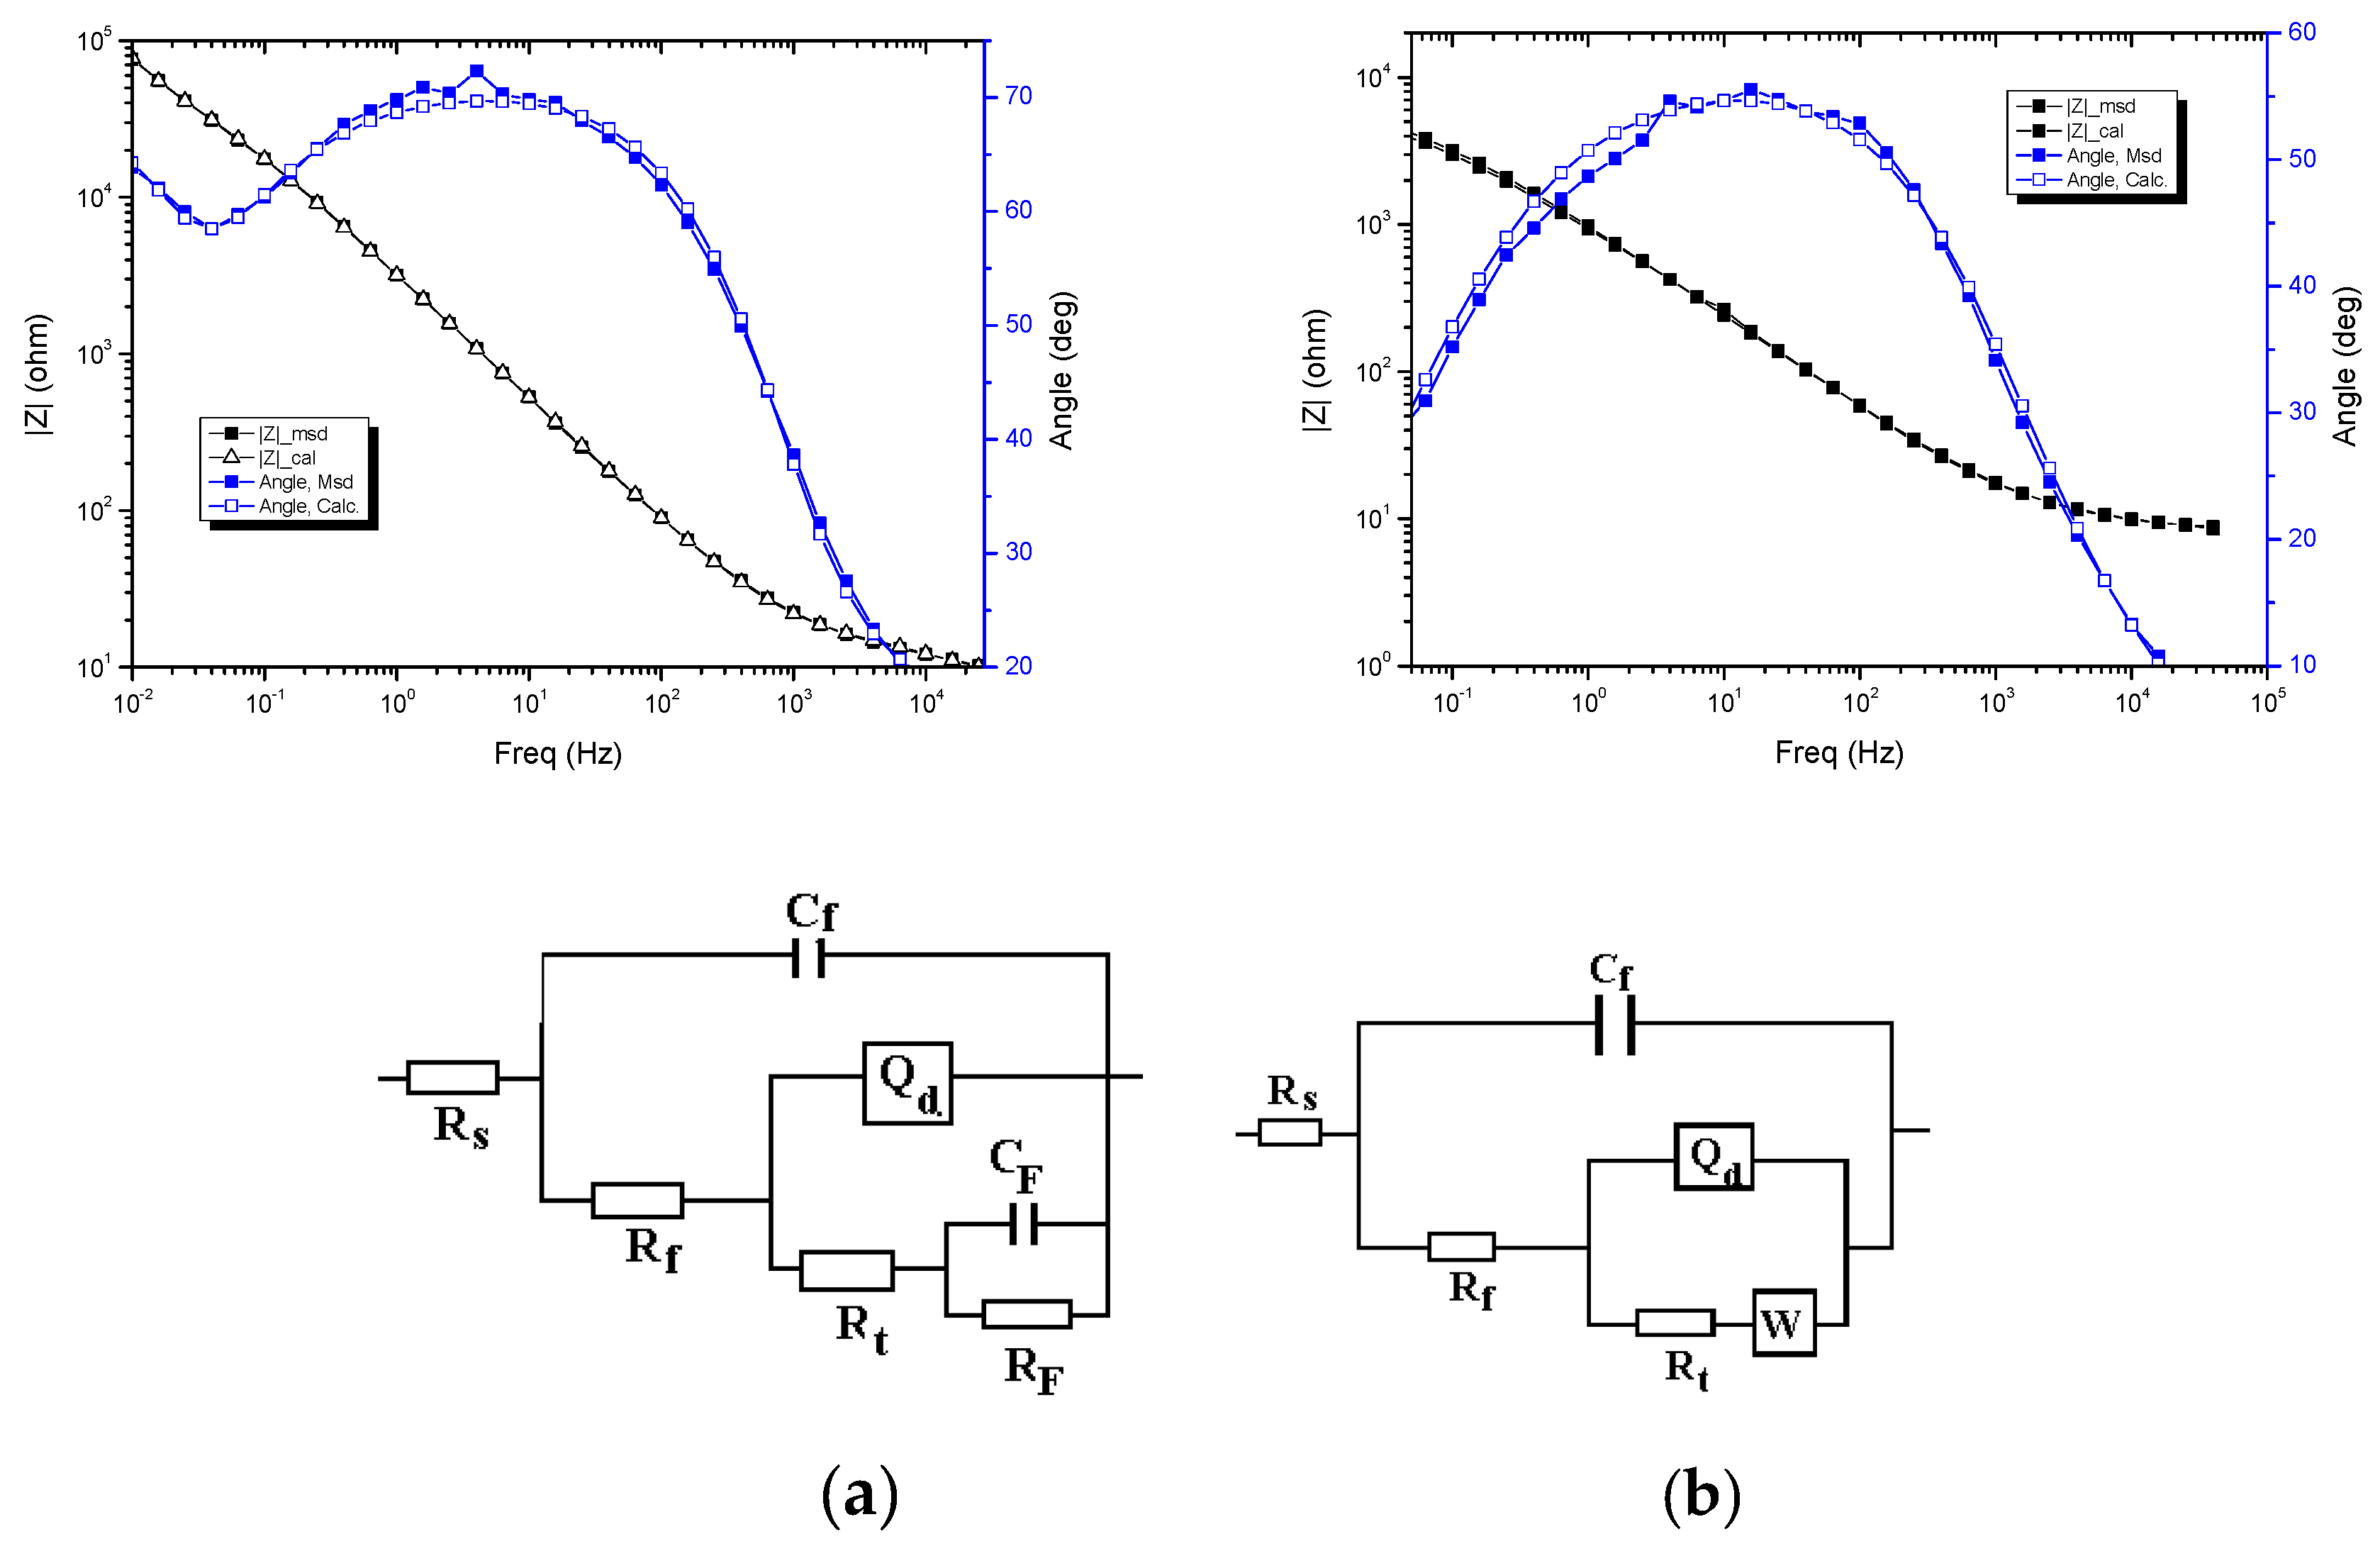
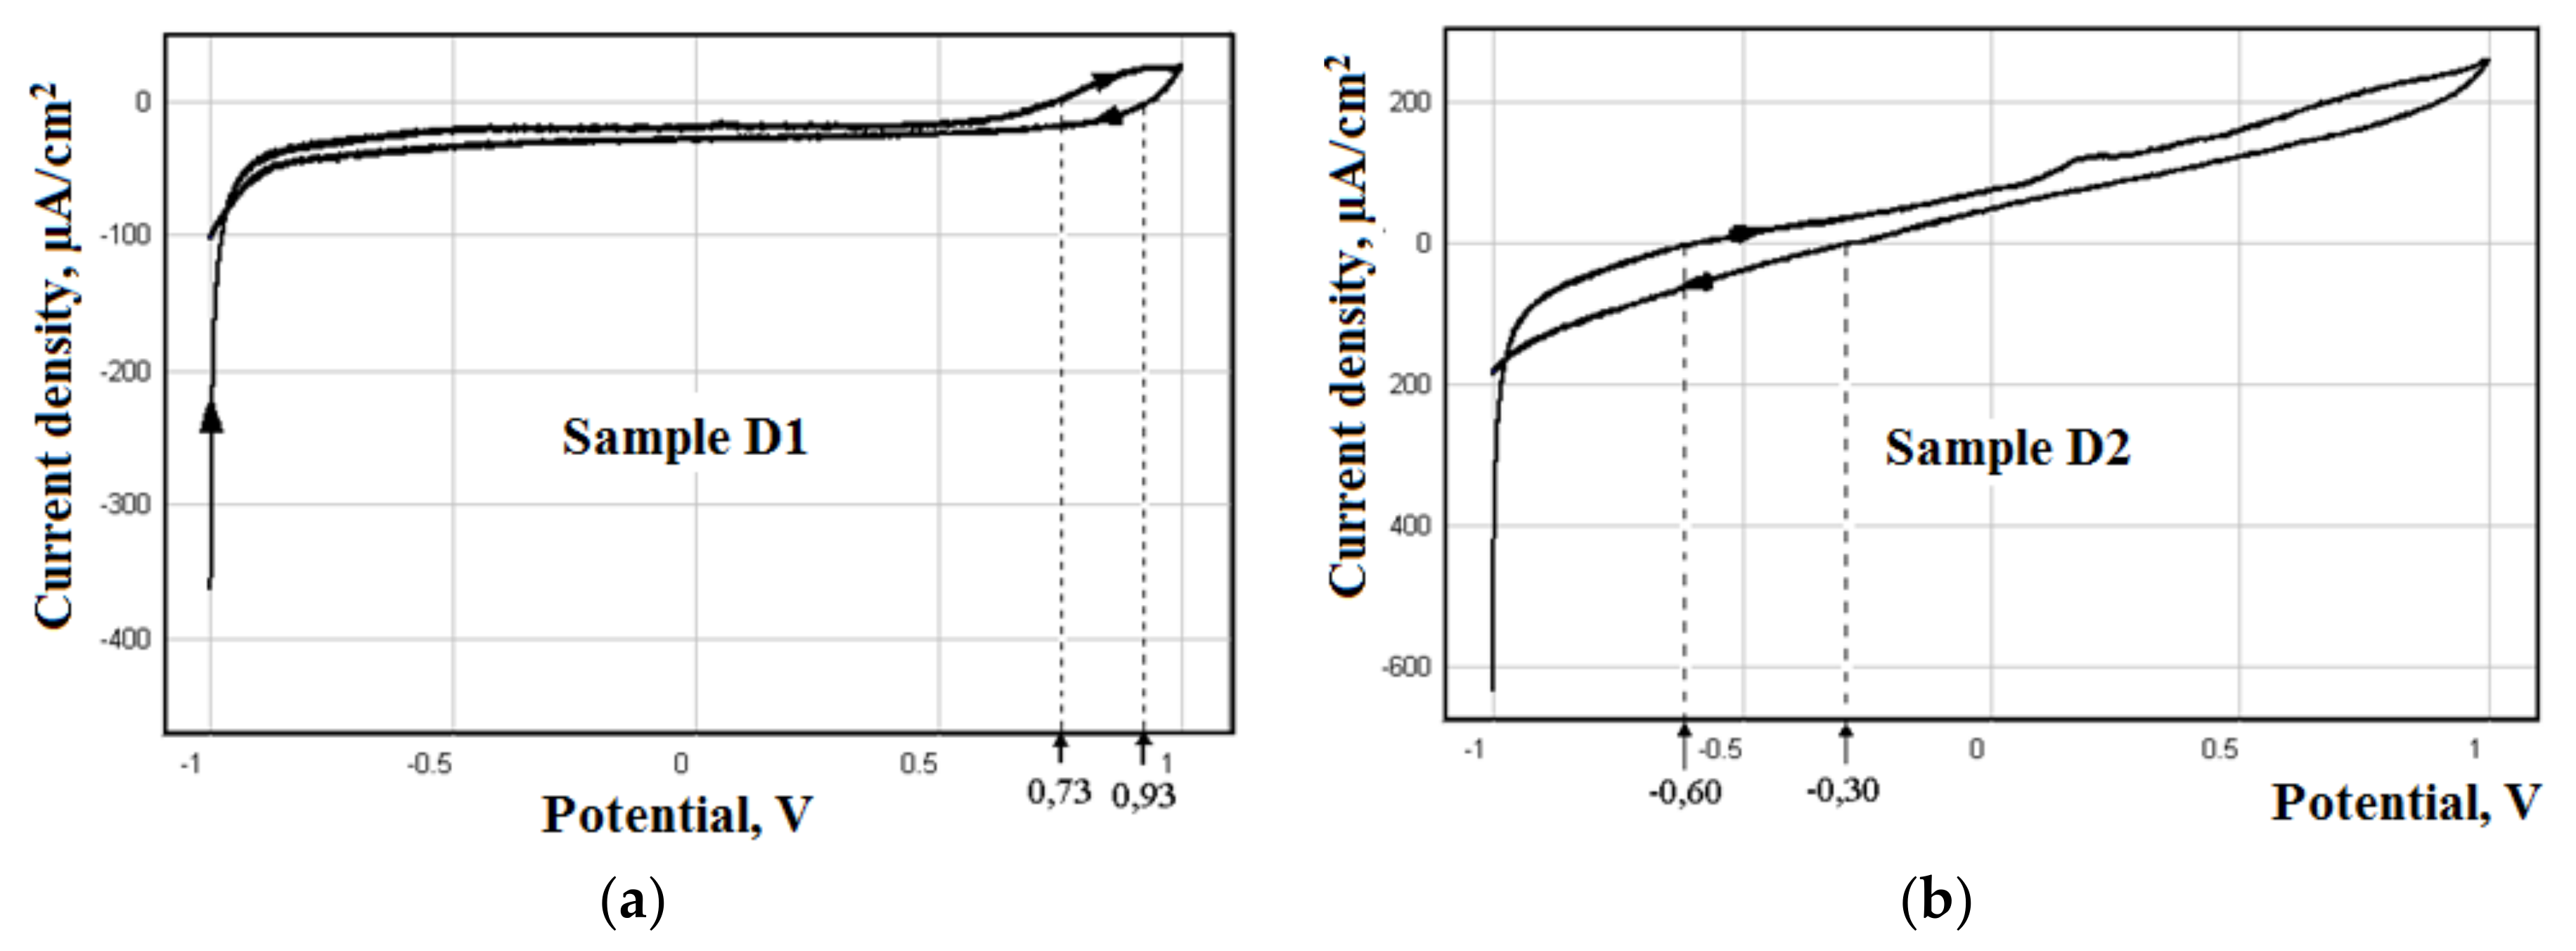
The surface roughness of two cylindrical samples of Ti4Al4Zr, which were acquired from Zirom S.R:L. [20], was modified using a chemical solution of H2SO4 (34%) + HCl (14%) at a temperature of 65 °C for 90 min and 60 min for samples named D1 and D2, respectively. The process of engraving with acid followed by chemical activation with NaOH was performed in a thermo-stated glass tube cell. The thermo-stating was executed in a block of thermo-stated tubes of type BlockTherm MTA Kutesz 660, Hungary, which allowed the temperature to be maintained with a ± 1 °C precision.
For the growth of hydroxyapatite on Ti-based alloys, an electrophoresis laboratory installation was used. The preliminary process for chemical activation involved immersion in NaOH (10M) solution for 3 h at a temperature of 60 °C. After activation, the sample was washed in an ultrasound bath with acetone, ethyl alcohol, and water for 1 h. For the deposition of HA thin films, a Consort EV 261 was used to activate the HA particles. The schematic experimental lab cell for the deposition is presented in Figure 1.
During the process, a voltage of 75 V was applied between the anode (Ti4Al4Zr alloy, S = 3 cm2) and cathode (platinum, S = 6 cm2) for 15 min, with a distance of 20 mm between the electrodes. A suspension of 4 g HA powder (0.61 µm average diameter) in 100 mL isopropyl alcohol, stabilized with 1 mL Tween 80 surfactant, was used in the process. After obtaining the growth film, the sample was washed with water, heated in a furnace at 110 °C for 2 h, and calcinated at 800 °C for 2 h.
The surface state of the samples was investigated via electronic microscopy (SEM; VegaTescan LMH II, SE detector, 30 kV electron gun voltage, VegaTC software) with both 2D and 3D images. The resistance to corrosion was determined using the impedance method, also known as EIS.
The EIS spectra are presented as Bode plots of the logarithm of impedance magnitude and the phase angle as a function of frequency. The EIS spectrum was registered in the frequency range of 10-2–10-5 Hz at an alternate potential with 10 MV amplitude using a potentiostat PGZ 301 (VoltaLab 40). Experimental data were converted using EIS file converter software (EISFC150) followed by Z SimWin.
EIS was realized in a solution of simulated blood serum (SBF) but with a concentration multiplied 5-fold (5 × SBF) in order to observe the specific effects in the human body. The measurements were made at potential in an open circuit in a naturally aerated solution.

3. Results

The surface of the D1 and D2 Ti4Al4Zr samples, processed through chemical roughening, were investigated using electron microscopy; Figure 2 presents the surface of the samples after chemical attack: (a,b) sample D1 and (c,d) sample D2. The samples were also analyzed and characterized from a 3D point of view using the analysis software VegaTescan. These results are presented in Table 1. The software analysis was able to detect modifications of the surface different from those obtainable by mechanical means. The microscopy results revealed partial contamination of the surface with impurities following the chemical attack of the surface, although these impurities were not stable on the metallic surface and were easily removed via alcohol washing.
The chemical analysis of the surfaces did not reveal the contamination of the material surface; the traces of chemical attack were removed via a wash with distilled water. The modifications of the Ti4Al4Zr sample surface through chemical processes can be classified into two types: those that modify the surface at the micron level (D1) and those that modify the surface at the nanometric level (D2).
The layers of HA deposited on the metallic material were of the level of microns (5–10 µm), which led to an influence of its properties at this level. The surfaces engraved at the nanometric level were more appropriate for nanometric layers and those at micron sizes for micron layers, which can cover and homogenize the surface after deposition.
Figure 3 presents the 3D microscopy images of the samples’ chemically treated surfaces. Using the 3D microscopes, the performance of the chemical attack methods was assessed. This information is organized in Table 1 (including the minimum, medium, and maximum depths of the traces on the surface).
The effects of the chemical etching were observed on sample D1 at a maximum 6.33 µm depth in an isolated case, with all the other samples having values between 0.81 and 2.4 µm. The standard deviations were at the submicron level and confirmed a good general homogenization of the sample via the chemical processing applied on the surface. Figure 3c,d presents the surface state in terms of the distribution of luminous intensity (surface roughness indicator) on the chemically processed metallic surface. The associated values are shown in Table 1.
Figure 3 also shows a noticeably compact longitudinal distribution of the surfaces modified through a chemical attack in the case of sample D2, while sample D1 showed deeper effects and a greater roughness. The surface state influences the quality of the deposited HA layers through an electrophoretic process based on the correlation between the surface roughness and the layer thickness [21,22].
The SEM microscopy images of the superficial layer of HA deposited using electrophoresis for (a) chemically processed substrate sample D1 at 150× amplification and (b) D2 with details at 1000× amplification are presented in Figure 4. From the images, we observed a good homogeneity of the layer at the macrostructural level and, in some cases (Figure 4b), cracking in certain areas at the microstructural level, especially after the thermal calcination treatment at 800 °C of sample D2, which served to stabilize the layer of deposited hydroxyapatite.
The type of ceramic structure formed during the electrophoresis process of the TiO2 and HA layers is highlighted in Figure 5, in which the variation of chemical elements on a scratched surface of Ti4Al4Zr are presented. The appearance of a TiO2 layer formed at the interface between the metal substrate and the HA surface layer was determined. The titanium oxide layer identified by SEM–EDS and confirmed by EIS was a very homogeneous and resistant layer with a compact microstructural appearance and submicron dimension.
Biocompatible micro- to nanostructured covering layers play a crucial role in medical applications for the osseointegration capacity of more resistant metallic implants. Both TiO2 and HA layers influence the corrosion resistance of the metallic material, with the former improving the corrosion resistance and the latter offering better biocompatibility.
Using the Z SimWin program, it was found that the EIS data obtained for sample D1 could be described by the equivalent circuit presented in Figure 6, together with a Bode diagram and with the value of the parameter’s characteristic in the elements of the equivalent circuit [23,24].
In the equivalent circuit, Rs is the resistance of solution, Rf and Cf are the resistance and capacity of the superficial layer, Rt is the resistance to the transfer charge, Qd is the element of the phase constant associated with the electric double layer (instead of the capacity of the double electrical layer), and the parallel circuit Rf–Cf is the existence of the Faraday process, the origin of which cannot be explained (a Faraday current is the result of an oxidation–reduction reaction that takes place at the surface of the electrode), but it might exist due to the process of a depositing or dissolving reactions that takes place the surface of the electrode. It also could be the result of a depositing or dissolving reaction that was produced during the measurements [25].
The parameter χ2 from the last column of Table 2 is a measure of accuracy for the model chosen to describe the experimental data to the value χ2 = 9.41 × 10⁻⁴. The value corresponds to a relative error in measuring the current equal to ∑ = 2%, while the process found that this model was satisfactory for interpreting the data. The very small value of superficial flux resistance Rf (almost equal to solution resistance) indicates that this layer had surface defects.
Noting that the layer capacity value Cf was at the level of micro-farads (3.51 µf), which denotes a small thickness of the layer (at the level of hundreds of nanometers, this value was high (98.7 Kohm), the current of corrosion was low (in the order of hundreds of nA), and the process of corrosion in this solution was not significant. The value of the exponent n from the expression of the element of constant phase Qd (n =0.77) was far below 1, corresponding to on ideal condenser, which means that the capacity of the double layer was an imperfect condenser due to the imperfection of the surface alloy support associated with sanding and the nonuniformity of the hydroxyapatite layer deposed through electrophoresis.
The experimental results obtained for sample D2 were processed using the same equivalent circuit as sample D1. The values of the elements of the circuit are shown in Table 3. Analysis of these data indicated that using this circuit to describe the macroscopic structure of the layer deposited on this sample was not acceptable.
It is worth emphasizing the high value of the χ2 parameter (9.41 × 10⁻⁴), representing a relative error of around 3%. If the solution resistance value (Rs) had the same order of dimension as sample D1, we cannot explain why the resistance of the solution would indicate the concentration of the solution. The resistance of the charge transfer had an unacceptable value of around 0. For this reason, the interaction of the metal solution is possible without restriction. The exponent n from the expression of Qd (n =0.6) indicated that the constant phase element could not be assimilated with a capacity of the double layer, being much closer to the 0.5 value characteristic of a corrosion process controlled by diffusion. The Faraday process was also present in this case but of lesser importance.
Due to the imperfection of the model used to process the experimental data obtained for sample D2, another circuit was applied in which the Warburg impedance (w = σ x ½, where w is the angle frequency, σ is the time constant for diffusion, and x is the Warburg coefficient that expresses the mass transfer through the superficial film, as when the corrosion process is controlled partially by diffusion) was introduced. This equivalent circuit is presented in Figure 6b, together with the Bode diagram and the values of the circuit elements are presented in Table 4.
In this condition, like those for sample D2, the superficial layers appeared very permeable to the solution (porous layer imbibed with solution) and could not protect the metal. The resistance for the charge transfer (Rt) was much smaller than in the case of sample D1 (16 times smaller), indicating a much more pronounced tendency of interaction between the electrode and solution.
The significance of the other elements in this circuit is the same as that of the previous equivalent circuit. The values of the solution resistance (Rs) and of the superficial film resistance were similar to those obtained with the previous model and were very close to those obtained for the D1 sample.
The Warburg impedance (W) was very low, so the corrosion process was not significantly influenced by the mass transfer but only controlled by the chemical reaction. The layer deposited through electrophoresis on this sample was much more irregular and less protective than that obtained for sample D1.
The cyclic polarization curves were registered in the interval (−100… + 1000…−1000) mV with a scanning speed of 10 mV/s. The cyclic polarization curves obtained for the two samples are presented in Figure 7a,b.
The cyclic polarization curves obtained differed significantly between samples D1 and D2, and they were in accordance with the results of the electrochemical impedance spectroscopy measurements. Thus, for sample D1, the layer of HA deposited on the alloy surface assured protection against corrosion in the 5 × SBF solution only to overpotentials smaller than 730 mV; above this level, chemical interactions between the metal and solution took place. The corrosion rate was not high; at an overpotential of 1000 mV, the density of the corrosion current was only 27 µA/cm2. On the turning curve (the cathode brand of cyclic voltammograms), re-passivation took place at an overpotential of 930 mV.
The layer deposed on sample D2 did not assure protection against corrosion in the 5 × SBF solution. Thus, the corrosion process occurred at negative potentials: I = 0 at potential E = −600 mV (E0 = −600 mV represents the corrosion potential for this sample). At higher potentials (>E0), the corrosion speed grew proportionally with the overpotential, so that at the potential 1000 mV, the corrosion current reached the value of 264 µA/cm2, which was 10 times higher than that of sample D1. On the turning curve, re-passivation took place at potentials under −300 mV. In these conditions, we conclude that the layer deposited on sample D1 was protective only at overpotentials under 730 mV, while the layer deposited on sample D2 assured no protection to corrosion.

4. Conclusions

The superficial layer obtained on the Ti4Al4Zr alloy after deposition and calcination was represented by a compact layer of TiO2 that was very well adhered, and a less compact, nonhomogeneous, semiporous layer made of hydroxyapatite deposited through electrophoresis. This combination ensures reliable protection for the alloy’s surface as well as good biocompatibility. The layer deposited on sample D2 did not ensure protection against corrosion in a 5 × SBF solution. In these conditions, it can be concluded that the bilayer (TiO2–HA) on sample D1 was protective only at overpotentials below 730 mV, while the layer deposited on sample D2 did not ensure representative protection against corrosion. This difference in the layer’s effect on corrosion resistance is attributed to the state of the metallic material surface.

Author Contributions

Conceptualization, R.C. and P.V.; methodology, N.C.; software, R.C. and M.P.; validation, R.C., P.V., and M.P.; formal analysis, I.Ș.; investigation, N.C. and G.Z.; resources, N.I.; data curation, A.S.; writing—R.C., N.C., and M.P.; writing—review and editing, P.V. and M.P.; visualization, G.Z.; supervision, N.C.; project administration, I.Ș.; funding acquisition, N.C. Please turn to the CRediT taxonomy for the term explanation. Authorship must be limited to those who have contributed substantially to the work reported. All authors have read and agreed to the published version of the manuscript.

Funding

This research was funded by the Romanian Ministry of Education and Research, CNCS-UEFISCDI, project number PN-III-P1-1.1-TE-2019-1921, within PNCDI III.

Institutional Review Board Statement

Not applicable.

Informed Consent Statement

Not applicable.

Conflicts of Interest

The authors declare no conflict of interest.

References

  1. Kaur, M.; Singh, K. Review on titanium and titanium-based alloys as biomaterials for orthopedic applications. Mater. Sci. Eng. C 2019, 102, 844–862. [Google Scholar] [CrossRef]
  2. Luo, H.; Wu, Y.; Diao, X.; Shi, W.; Feng, F.; Qian, F.; Umeda, J.; Kondoh, K.; Xin, H.; Shen, J. Mechanical properties and biocompatibility of titanium with a high oxygen concentration for dental implants. Mater. Sci. Eng. C 2020, 117, 111306. [Google Scholar] [CrossRef]
  3. Ionita, D.; Grecu, M.; Ungureanu, C.; Demetrescu, I. Modifying the TiAlZr biomaterial surface with coating, for a better anticorrosive and antibacterial performance. Appl. Surf. Sci. 2011, 257, 9164–9168. [Google Scholar] [CrossRef]
  4. Ionita, D.; Grecu, M.; Ungureanu, C.; Demetrescu, I. Antimicrobial activity of the surface coatings on TiAlZr implant biomaterial. J. Biosci. Bioeng. 2011, 112, 630–634. [Google Scholar] [CrossRef]
  5. Ungureanu, C.; Pirvu, C.; Mindroiu, M.; Demetrescu, I. Antibacterial polymeric coating based on polypyrrole and polyethylene glycol on a new alloy TiAlZr. Prog. Org. Coatings 2012, 75, 349–355. [Google Scholar] [CrossRef]
  6. Narayanan, R.; Seshadri, S.K. Point defect model and corrosion of anodic oxide coatings on Ti–6Al–4V. Corros. Sci. 2008, 50, 1521–1529. [Google Scholar] [CrossRef]
  7. Demetrescu, I. Passive and Bioactive Films on Implant Materials and their Efficiency in Regenerative Medicine. Mol. Cryst. Liq. Cryst. 2008, 486, 110–119. [Google Scholar] [CrossRef]
  8. Wu, C.; Tang, Y.; Mao, B.; Zhao, K.; Cao, S.; Wu, Z. Rapid apatite induction of polarized hydrophilic HA/PVDF bio-piezoelectric coating on titanium surface. Surf. Coatings Technol. 2021, 405, 126510. [Google Scholar] [CrossRef]
  9. Izquierdo, J.; Bolat, G.; Cimpoesu, N.; Trinca, L.C.; Mareci, D.; Souto, R.M. Electrochemical characterization of pulsed layer deposited hydroxyapatite-zirconia layers on Ti-21Nb-15Ta-6Zr alloy for biomedical application. Appl. Surf. Sci. 2016, 385, 368–378. [Google Scholar] [CrossRef]
  10. Mareci, D.; Cimpoeşu, N.; Popa, M.I. Electrochemical and SEM characterization of NiTi alloy coated with chitosan by PLD technique. Mater. Corros. 2012, 63, 985–991. [Google Scholar] [CrossRef]
  11. Istrate, B.; Rau, J.V.; Munteanu, C.; Antoniac, I.V.; Saceleanu, V. Properties and in vitro assessment of ZrO2-based coatings obtained by atmospheric plasma jet spraying on biodegradable Mg-Ca and Mg-Ca-Zr alloys. Ceram. Int. 2020, 46, 15897–15906. [Google Scholar] [CrossRef]
  12. Vargas-Becerril, N.; Sánchez-Téllez, D.; Zarazúa-Villalobos, L.; González-García, D.; Álvarez-Pérez, M.; de León-Escobedo, C.; Téllez-Jurado, L. Structure of biomimetic apatite grown on hydroxyapatite (HA). Ceram. Int. 2020, 46, 28806–28813. [Google Scholar] [CrossRef]
  13. Zu, X.T.; Liu, Y.Z.; Lian, J.; Liu, H.; Wang, Y.; Wang, Y.H.; Wang, L.M.; Ewing, R.C. Surface modification of a Ti–Al–Zr alloy by niobium ion implantation. Surf. Coat. Tech. 2006, 201, 3756–3760. [Google Scholar] [CrossRef]
  14. Liu, Y.; Zu, X.; Qiu, S.; Wang, L.; Ma, W.; Wei, C. Surface characterization and corrosion resistance of Ti–Al–Zr alloy by niobium ion implantation. Nucl. Instrum. Methods Phys. Res. Sect. B 2006, 244, 397–402. [Google Scholar] [CrossRef]
  15. Bansal, P.; Singh, G.; Sidhu, H.S. Improvement of surface properties and corrosion resistance of Ti13Nb13Zr titanium alloy by plasma-sprayed HA/ZnO coatings for biomedical applications. Mater. Chem. Phys. 2021, 257, 123738. [Google Scholar] [CrossRef]
  16. Gradinariu, I.; Stirbu, I.; Gheorghe, C.A.; Cimpoesu, N.; Agop, M.; Cimpoeşu, R.; Popa, C. Chemical properties of hydroxyapatite deposited through electrophoretic process on different sandblasted samples. Mater. Sci. 2014, 32, 578–582. [Google Scholar] [CrossRef] [Green Version]
  17. Kamitakahara, M.; Kimura, K.; Ioku, K. Synthesis of nanosized porous hydroxyapatite granules in hydrogel by electrophoresis. Colloids Surf. B Biointerfaces 2012, 97, 236–239. [Google Scholar] [CrossRef]
  18. John, A.S.; Sidek, M.M.; Thang, L.Y.; Sami, S.; Tey, H.Y.; See, H.H. Online sample preconcentration techniques in nonaqueous capillary and microchip electrophoresis. J. Chromatogr. A 2021, 1638, 461868. [Google Scholar] [CrossRef] [PubMed]
  19. Hosseini, M.R.; Ahangari, M.; Johar, M.H.; Allahkaram, S.R. Optimization of nano HA-SiC coating on AISI 316L medical grade stainless steel via electrophoretic deposition. Mater. Lett. 2021, 285, 129097. [Google Scholar] [CrossRef]
  20. Zirom-Titanium. Available online: https://www.zirom-titanium.com/ (accessed on 10 October 2020).
  21. Stirbu, I.; Vizureanu, P.; Cimpoesu, R.; Dascălu, G.; Gurlui, S.O.; Bernevig, M.; Benchea, M.; Cimpoeşu, N.; Postolache, P. Advanced metallic materials response at laser excitation for medical applications. J. Optoelectron. Adv. M. 2015, 17, 1179–1185. [Google Scholar]
  22. Afiq Harun, M.; Zamree Abd Rahim, S.; Nasir Mat Saad, M.; Fathullah Ghazali, M. Warpage analysis on front panel housing using response surface methodology (RSM). Eur. J Mater. Sci. Eng. 2016, 1, 9–18. [Google Scholar]
  23. Cimpoeşu, N.; Săndulache, F.; Istrate, B.; Cimpoeşu, R.; Zegan, G. Electrochemical Behavior of Biodegradable FeMnSi–MgCa Alloy. Metals 2018, 8, 541. [Google Scholar] [CrossRef] [Green Version]
  24. Istrate, B.; Munteanu, C.; Lupescu, S.; Chelariu, R.; Vlad, M.D.; Vizureanu, P. Electrochemical Analysis and In Vitro Assay of Mg-0.5Ca-xY Biodegradable Alloys. Materials 2020, 13, 3082. [Google Scholar] [CrossRef] [PubMed]
  25. Cimpoeşu, R.H.; Pompilian, G.O.; Baciu, C.; Cimpoeşu, N.; Nejneru, C.; Agop, M.; Gurlui, S.; Focşa, C. Pulsed laser deposition of poly (L-Lactide) acid on nitinol substrate. Optoelectron. Adv. Mat. 2010, 4, 2148–2153. [Google Scholar]
Figure 1. Deposition cell scheme and experimental set-up.
Applsci 11 04198 g001
Figure 2. SEM micrographs of the sample surfaces: (a) sample D1-500x, (b) sample D1-5000x, (c) sample D2-500x, and (d) sample D2-5000x.
Applsci 11 04198 g002
Figure 3. 3D images of sample surfaces: (a) D1 and (b) D2. Surface roughness distribution: (c) D1 and (d) D2.
Applsci 11 04198 g003
Figure 4. SEM micrographs of superficial HA layer realized through electrophoretic deposition method: (a) sample D1 and (b) sample D2.
Applsci 11 04198 g004
Figure 5. Complex structure identification of HA deposition through line chemical composition mode (a) SEM image of analyzed area; (b) chemical elements line variations
Applsci 11 04198 g005
Figure 6. EIS data, Bode diagram, and equivalent circuit obtained for: (a) sample D1 and (b). sample D2.
Applsci 11 04198 g006
Figure 7. Cyclic polarization curves for samples (a) D1 and (b) D2.
Applsci 11 04198 g007
Table 1. Surface characteristics of samples D1 and D2 (values were obtained from Figure 3 using VegaT software).
Sample/Dimensions
(from 2D images)
Radius (μm)Area (μm2)
minmedmaxStDevminmedmaxStDev
D11.863.194.790.7410.8333.7072.1815.87
D21.242.415.440.714.8719.9192.9713.87
Sample/Dimensions
(from 3D images)
Hmin (μm)Hmed (μm)Hmax
(μm)
StDev
(μm)
Minimum variation (ADU)Maximum variation (ADU)Differences (ADU)
D12.383.906.331.016068.58.5
D21.081.331.870.2159.663.43.8
Table 2. The values of the equivalent circuit for D1.
SampleRS
(Ω cm2)
Cf
(F/cm2)
Rf
(Ω cm2)
Qd
(S sn cm−2)
nRt
(Ω cm2)
CF
(F/cm2)
Rf
(Ω cm2)
χ2
D110.013.51 × 10−68.917.1 × 10−50.779.8 × 1048.51 × 10−59.81 × 1053.96 × 10−4
Table 3. The values of equivalent circuit for sample D2.
SampleRS
(Ω cm2)
Cf
(F/cm2)
Rf
(Ω cm2)
Qd
(S sn cm−2)
nRt
(Ω cm2)
CF
(F/cm2)
Rf
(Ω cm2)
χ2
D28.494.22 ×10−64.573.01 ×10−50.61.0 ×10−73.81×10−66.92×1039.41 ×10−4
Table 4. Values of the equivalent circuit for sample D2.
SampleRS
(Ω cm2)
Cf
(F/cm2)
Rf
(Ω cm2)
Qd
(S sn cm−2)
nRt
(Ω cm2)
W
(S s1/2 cm−2)
χ2
D28.714.28 × 10−63.372.94 × 10−40.636.09 × 1032.25 × 10−35.54 × 10⁻⁴
Publisher’s Note: MDPI stays neutral with regard to jurisdictional claims in published maps and institutional affiliations.

