1. Introduction
Recently in nuclear power plants (NPPs), there have been an increasing number of attempts to replace wired systems with wireless communication systems, because wired monitoring systems that use complex and heavy wire cables have installation and maintenance drawbacks [
1,
2]. However, wireless systems emit electromagnetic fields for communication purposes, which can be a potential hazard to instrumentation and control (I&C) equipment in NPP. This is because electromagnetic fields exceeding the tolerable threshold may cause malfunctions of the I&C equipment. To protect the I&C equipment from these unpredictable electromagnetic fields, the I&C equipment must be safely placed outside the exclusion zone (EZ). A guideline for the EZ is introduced in
Regulatory Guide 1.180 [
3], but as this assumes a free space environment, it may not be suitable for an actual NPP that includes many interior structures. Previous studies have investigated the indoor electromagnetic fields inside the NPP when arbitrary wireless devices are in operation [
4,
5,
6], but there has been no detailed discussion on the EZ. In a recent study, the EZ for the actual indoor environment was examined [
7,
8], but it is very difficult to determine the boundary between the EZ and the safe zone because the indoor EZ boundary is very complicated and irregularly distributed, which makes it difficult to apply in practice. To obtain an EZ that can be used in practice, the boundary of the EZ should not be too complicated, so that the I&C equipment can be easily placed in the safe zone. In addition, the EZ needs to be extended into a 3D volume space, since the EZ in previous studies is limited to a 2D plane with a fixed height.
In this paper, we propose a statistical indoor EZ that can be efficiently applied to an NPP by investigating electromagnetic fields inside the actual NPP. The proposed indoor EZ has much simpler boundaries than those reported in [
7,
8], since the EZ is achieved using a statistical regression analysis for practical use in the NPP. This means that the proposed statistical EZ is more suitable for real NPPs than conventional methods that have a complicated boundary. To obtain the statistical indoor EZ, the indoor environment of the simulator room of the Korea Institute of Nuclear Safety (KINS) is modeled using the Wireless InSite commercial electromagnetic simulation software [
9]. In this simulation model, the transmitting and receiving antennas use the measured radiation patterns of the dipole antenna in order to make the simulation results more consistent with the actual values. The received power at the receiving antenna, caused by the transmitting antenna of the wireless system, is analyzed in all classified indoor observation regions with a 30° angle range. The statistical regression model [
10,
11] is applied to each piece of data included in the observation region. The boundaries of the EZ for each observation region can be achieved using a calculated regression model. Then, the EZ is extended into a 3D volume space by investigating at various heights, which helps us to understand the EZ in a 3D environment. The statistical EZs in the NPP are then compared with those in a free space case. To verify the proposed method, the electromagnetic field strengths according to the azimuth angle and distance from each transmitting antenna are measured, and are confirmed to be in good agreement with the simulation results. The results demonstrate that the proposed statistical indoor EZ can be properly obtained not only from the simulation data but also from the measurement data.
2. Derivation and Analysis for Statistical Indoor EZ
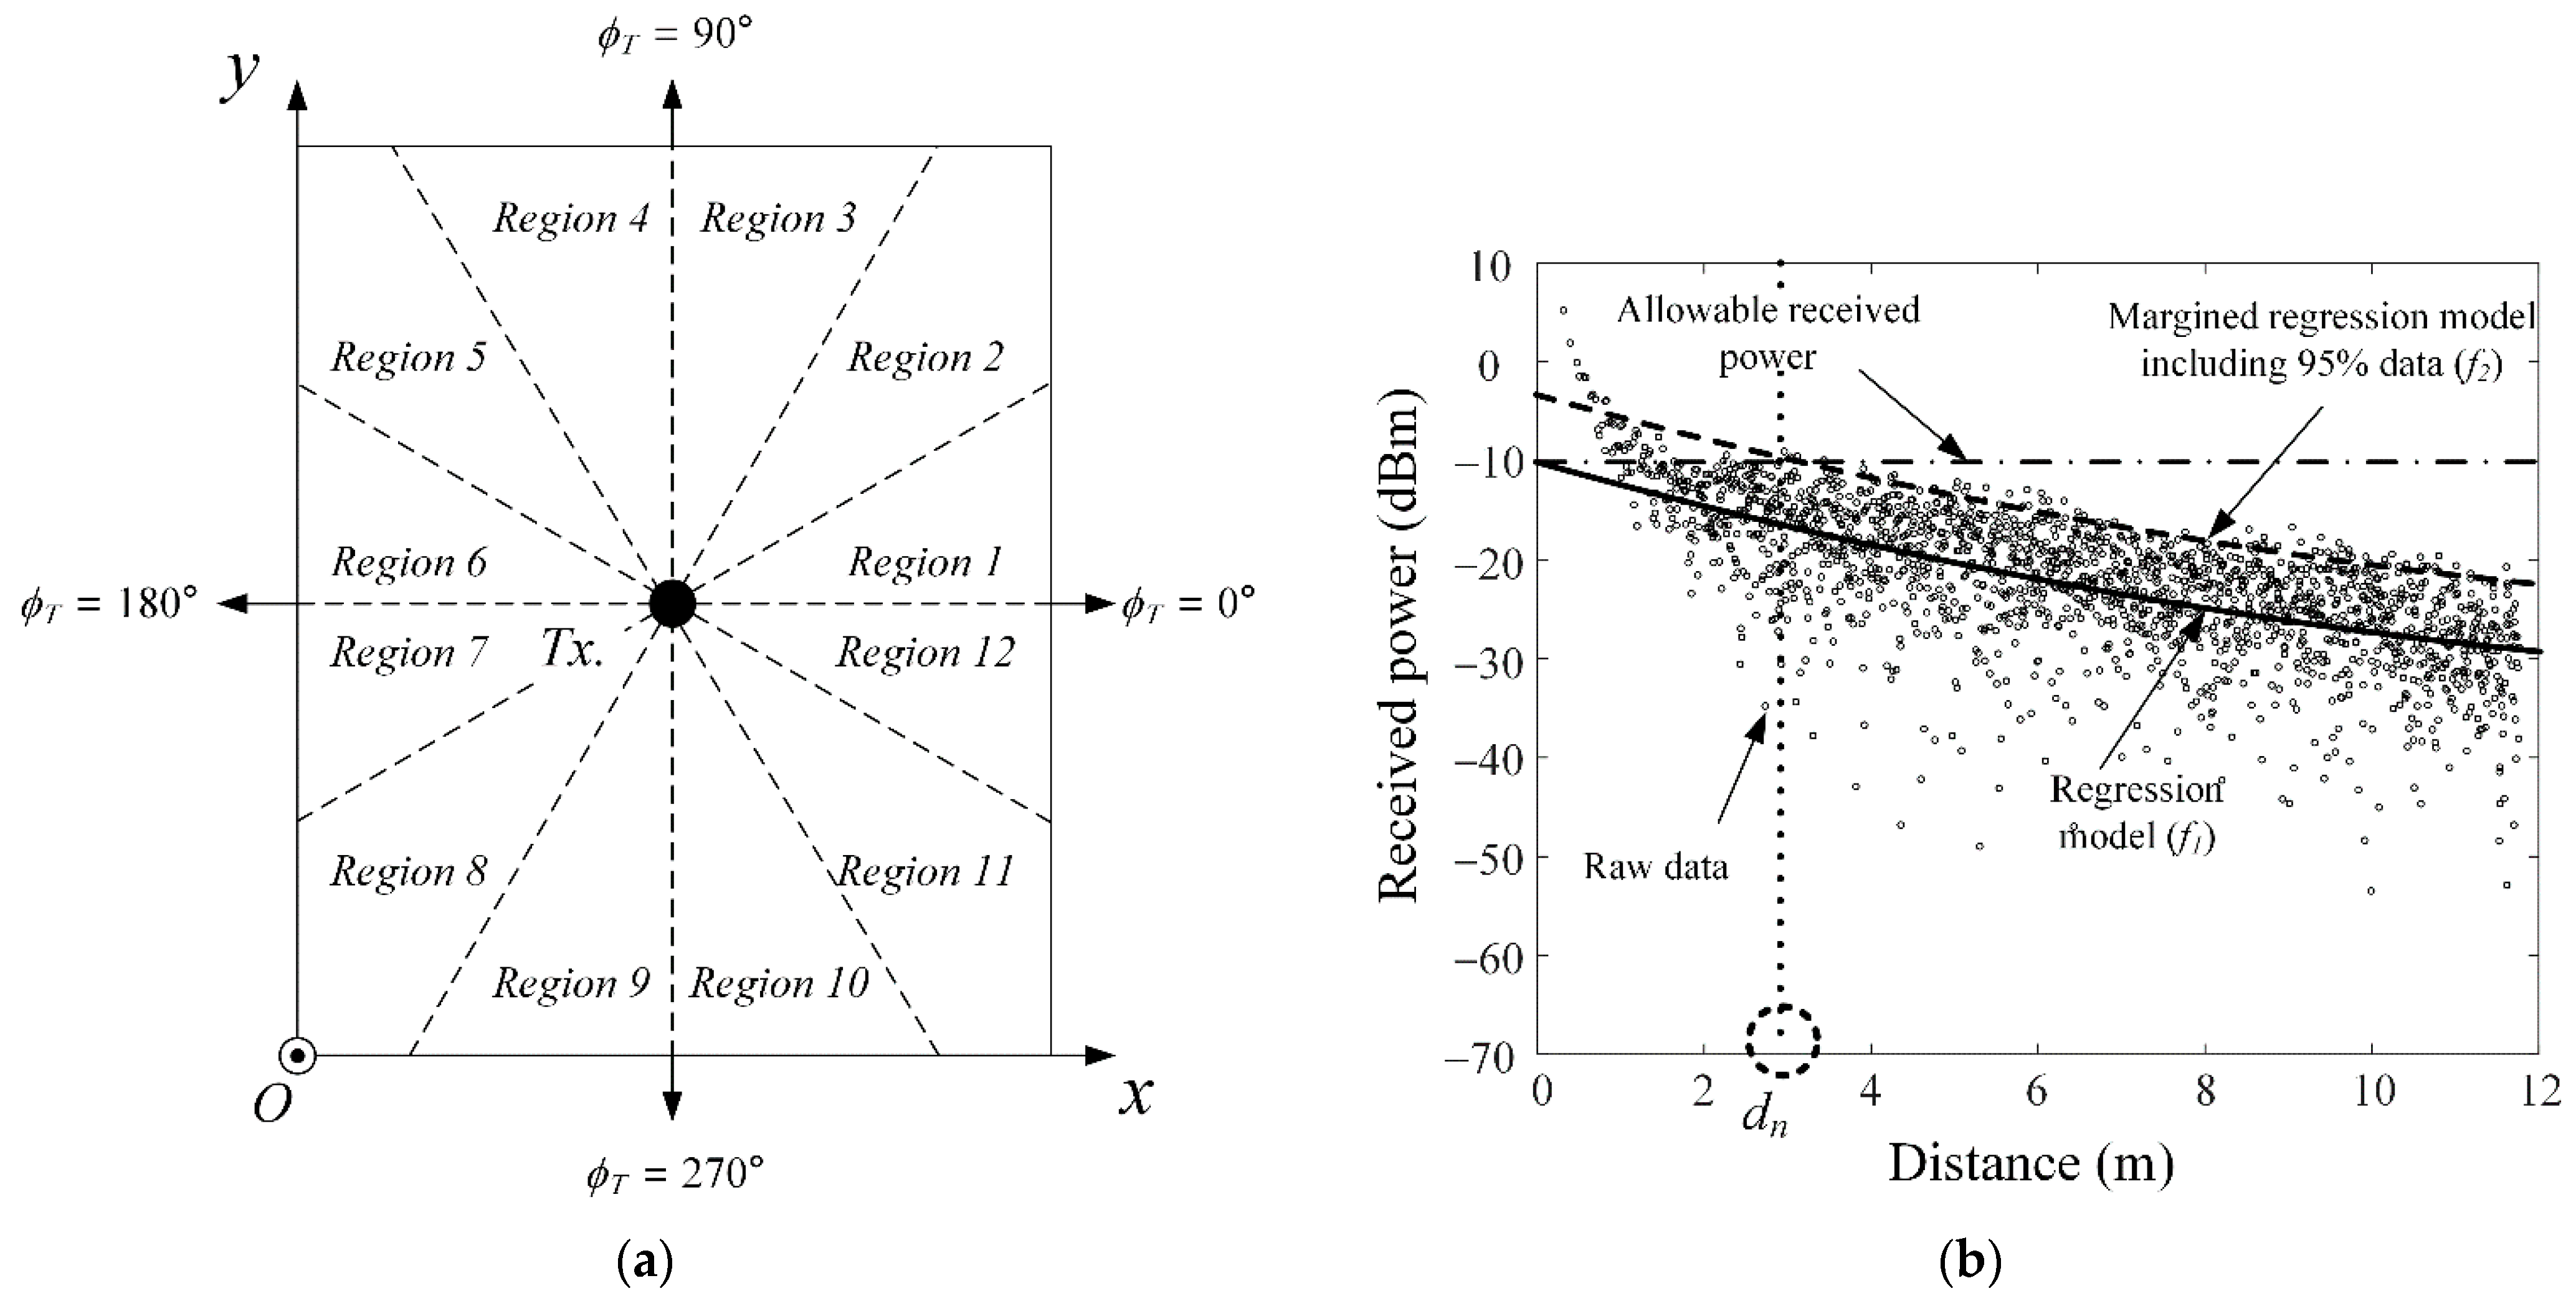
Figure 1 presents the derivation process to obtain the statistical indoor EZ for an actual NPP environment by investigating electromagnetic fields using a statistical method. To examine the indoor electromagnetic fields, the transmitting antenna is placed in an arbitrary location, and the received power is observed in all indoor locations. The proposed statistical indoor EZ is achieved according to the following procedure: first, the indoor space around the transmitting antenna is classified into multiple observation regions. In
Figure 1a,
ϕT is the azimuth angle around the transmitting antenna. At the same time, the indoor space around the transmitting antenna is divided into 12 regions (
Region n from
Region 1 to
Region 12), each with a 30° angle range. EZ boundaries of each region are independently defined within each separate observation region, and the detailed information of each region is listed in
Table 1. Second, the received power (by half wavelength dipoles for Rx. and Tx. antennas) is obtained at as many locations as possible in each region, when the total radiated power of the transmitting antenna is assumed to be 1 W. The received power can be obtained through electromagnetic simulations using the modeled indoor NPP environment or by using actual measurements. Herein, each received power datum within each region is arranged according to the azimuth angle and distance from the transmitting antenna. For example, the obtained received power data in
Region n tend to gradually decrease with distance, as shown in
Figure 1b. Third, the regression model [
10,
11,
12,
13,
14] (
f1) is applied for this stored received power data, which helps us to observe the tendency of the received power according to the distance. The regression model (
f1) is derived based on a quadratic function, as indicated by the solid line in
Figure 1b. The received power typically decreases in inverse proportion to the square of the distance from the transmitting antenna. The quadratic regression model is a general method to fit the data with a curved distribution [
12,
13,
14]. The quadratic regression model can be expressed as below:
where
d is the distance from the transmitting antenna, and
a1,
a2 and
a3 are coefficients that best fit the received power data. However, using the obtained regression model is not suitable for the boundary of the statistical indoor EZ. This is because, when applying the general regression function (
f1) to the statistical indoor EZ, there are too many locations where the received power exceeds the allowable received power (−10.6 dBm according to the
Regulatory Guide 1.180 [
3,
8]). Therefore, the margined regression model (
f2), where 95% of the data lie below the curve, is defined based on the general regression model (
f1), as shown by the dashed line in
Figure 1b. The margined regression model (
f2) can be defined as below:
where
K is the offset of the margined regression model, which makes it possible to determine a reasonable boundary of the statistical indoor EZ. Finally, the boundaries (
dn) of each region (
Region n) are determined by finding the intersection between the allowable received power (−10.6 dBm) and the margined regression model, as indicated in
Figure 1b. This distance
dn is the boundary of the statistical indoor EZ at the specific azimuth range (
Region n). By using the proposed statistical indoor EZ, we can obtain a less complicated EZ that can be easily applied to the actual NPPs. Then, the I&C equipment can be intuitively placed outside the proposed indoor EZ to satisfy safety issues in accordance with
Regulatory Guide 1.180.
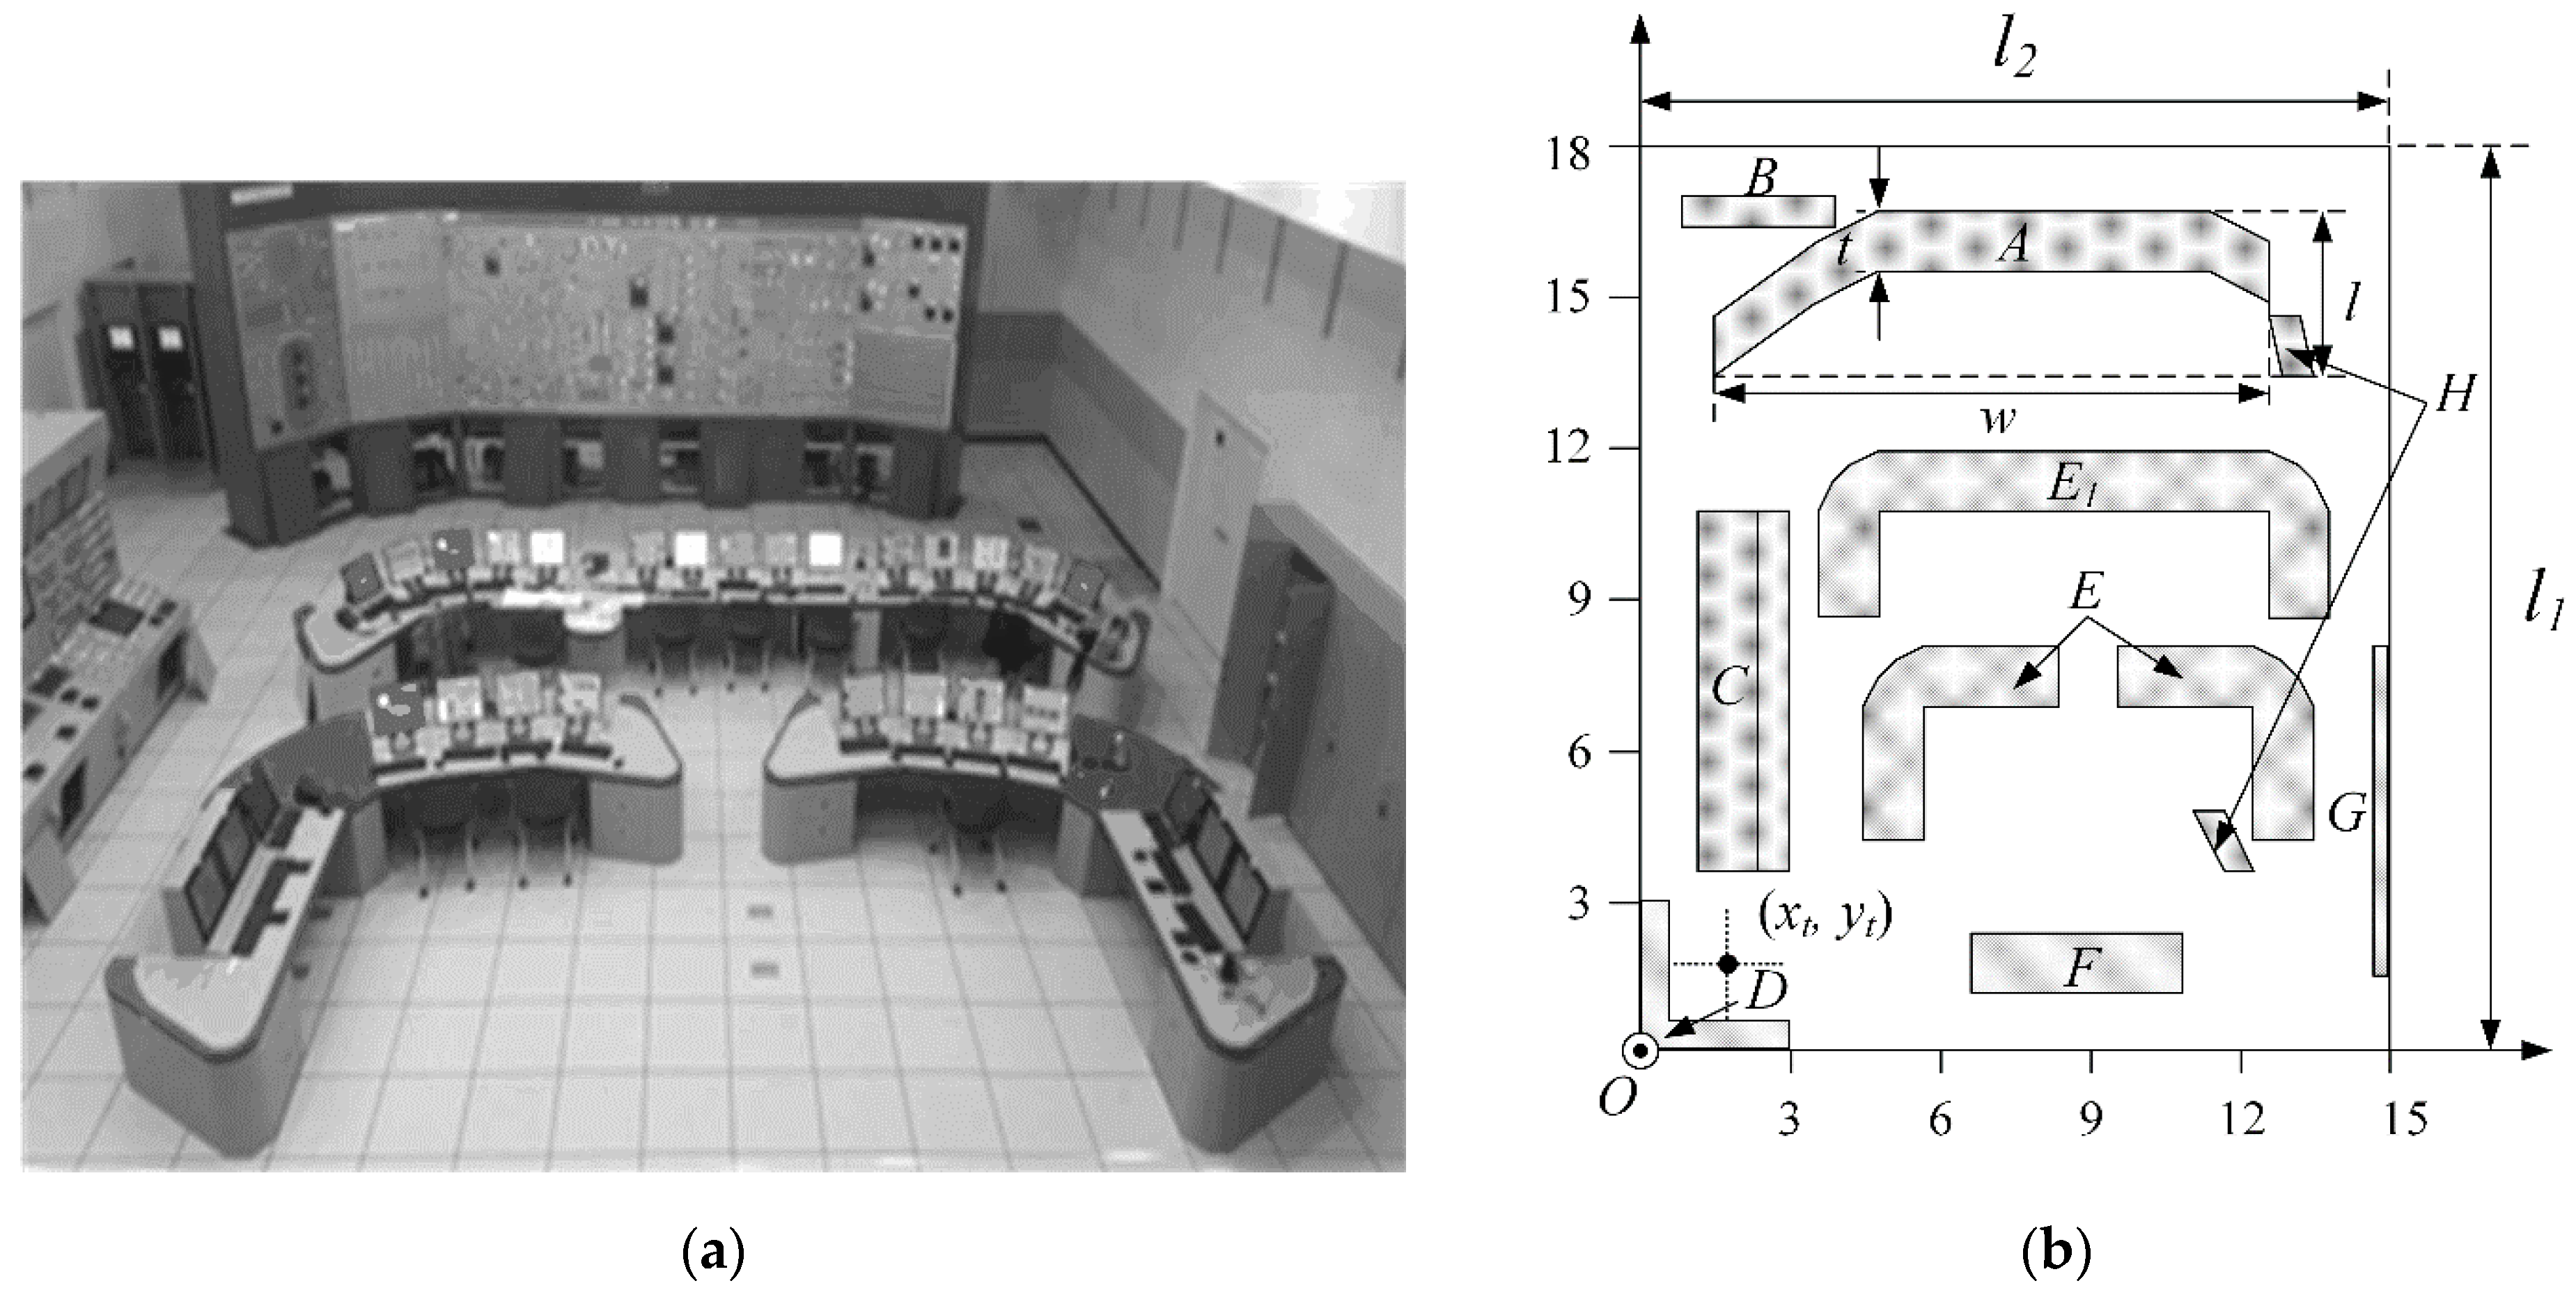
Figure 2 shows the photograph and geometry of the indoor environment of the simulator room of the KINS. The KINS simulator room is similar to the actual control room of the NPP, so it is suitable for examining the indoor electromagnetic fields of the NPP. To investigate the statistical indoor EZ, the indoor environment of the simulator room of KINS is modeled using Wireless InSite electromagnetic simulation software [
9]. The entire simulator room has dimensions of 15 m × 18 m × 6 m. There are some interior structures (monitoring devices, control equipment, cabinets, and tables) in which the internal structures are typically made of metal or wood materials. In
Figure 2b, the monitoring devices and control equipment are marked as
A and
C, while the metallic cabinet and the table are represented by
B and
E, respectively.
D and
G are wooden cabinets, and
F is a wooden table. The coordinates of the transmitting antenna are denoted by
xt and
yt. The dimensions of all interior structures can also be represented by
w m ×
l m ×
h m, where
w and
l are the width and length from the top view,
h is the height, and
t is the thickness of each interior structure. The detailed parameters of all modeled structures are listed in
Table 2.
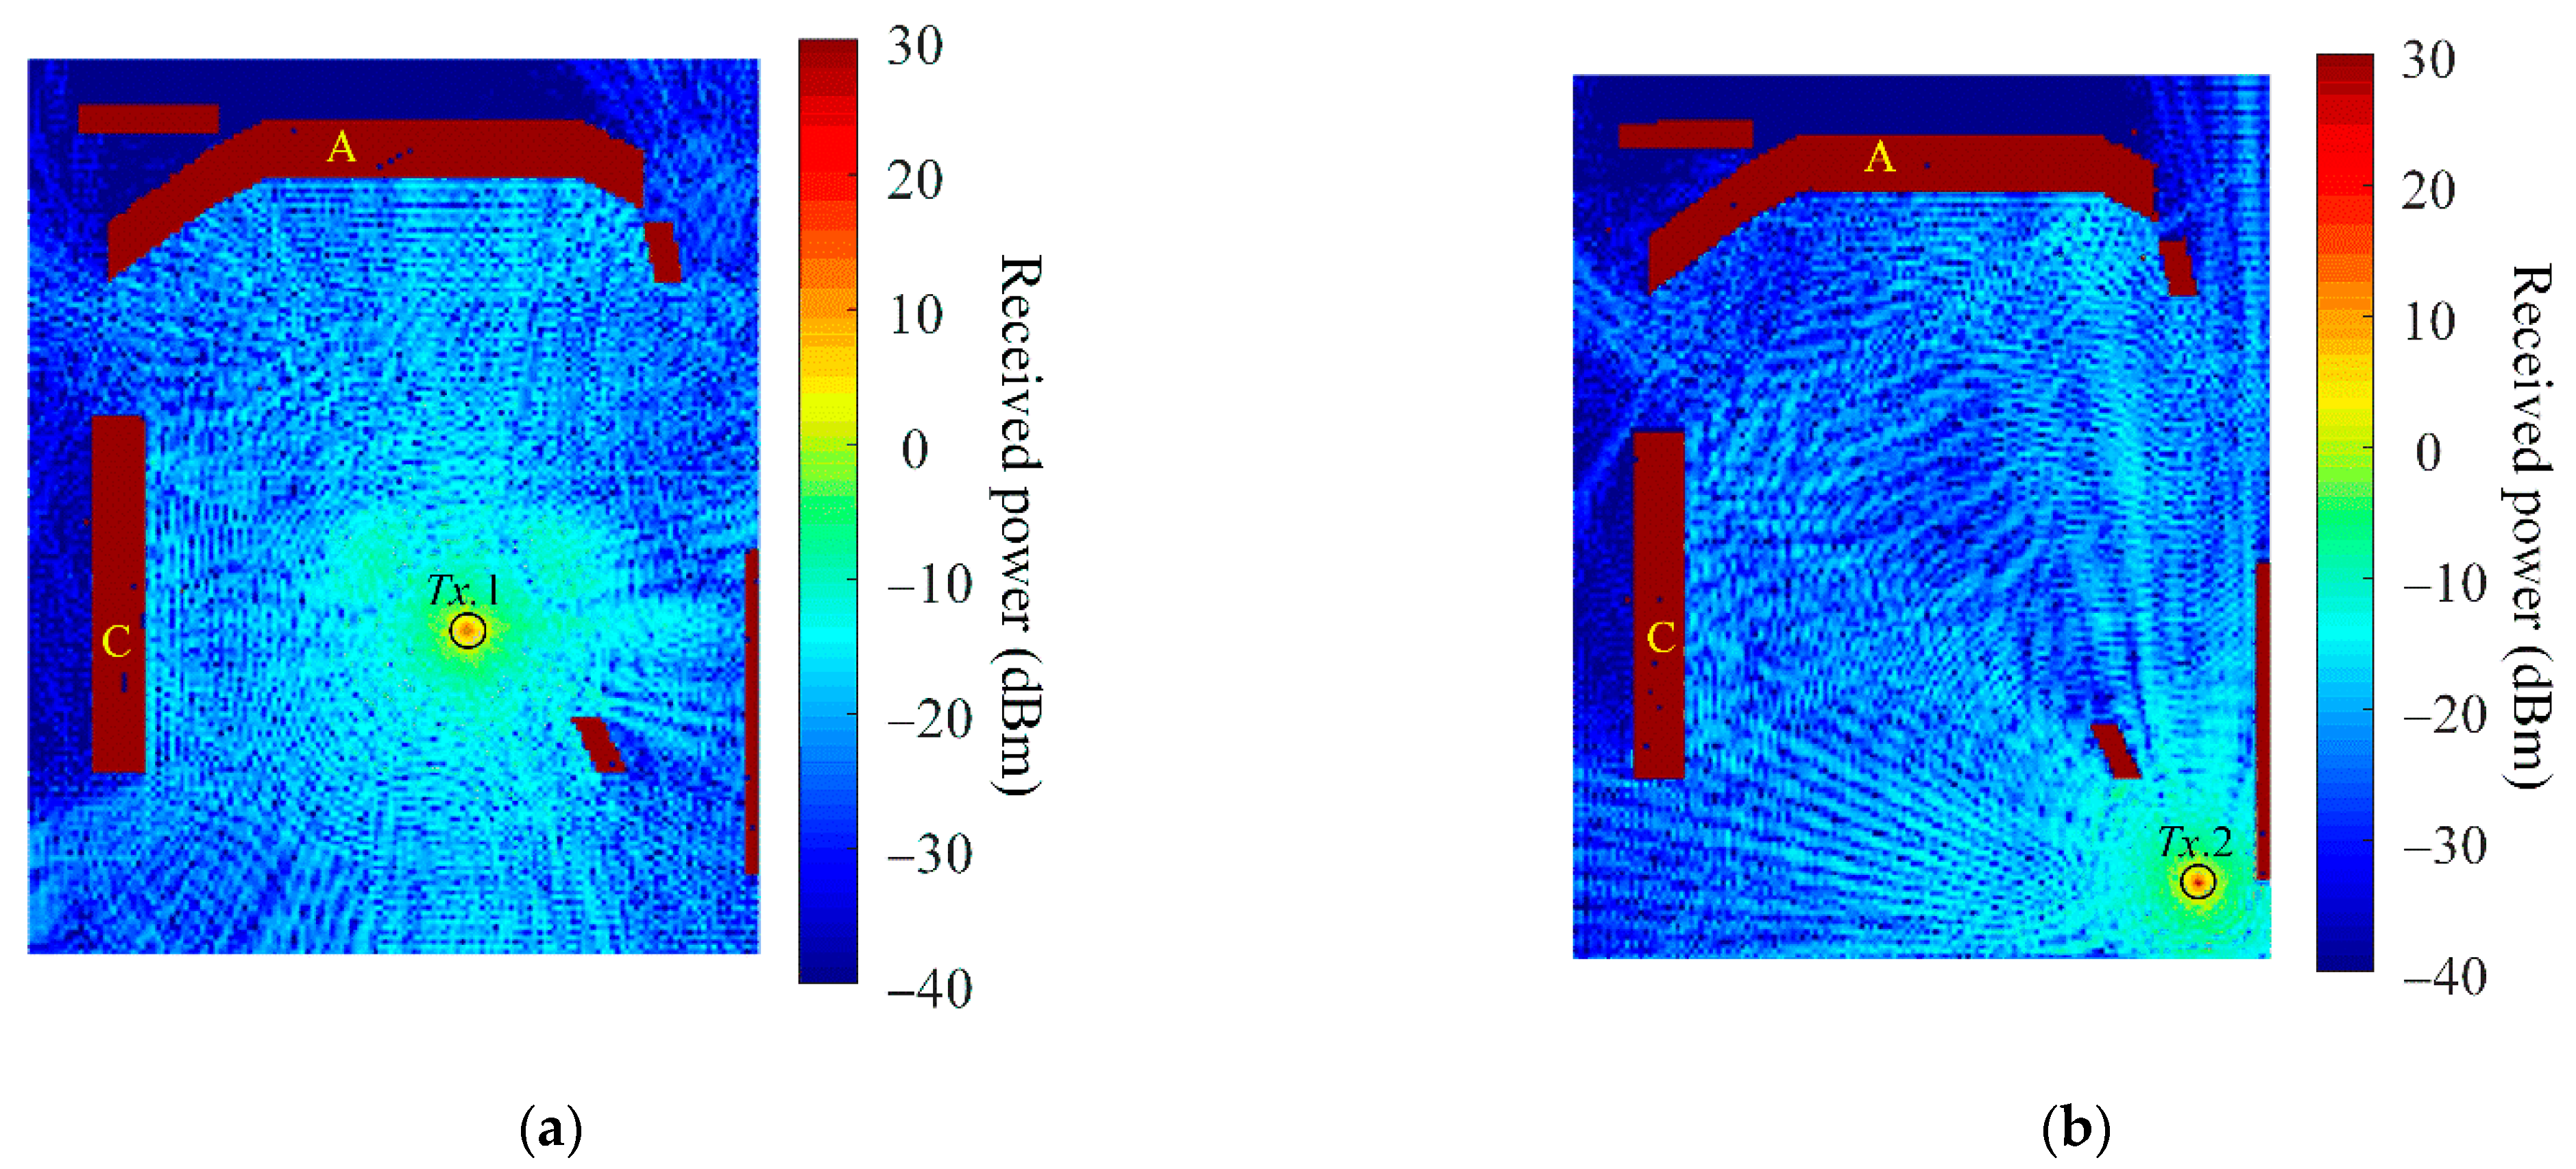
Figure 3 illustrates the received power distributions according to the transmitting antenna position using Wireless InSite electromagnetic simulation software [
9]. The total radiated power and frequency of the transmitting signal are assumed to be 1 W and 2.4 GHz, respectively. Herein, 2.4 GHz is used for observation, since the frequency band is used in various applications such as Bluetooth, Wi-Fi, and WirelessHART [
15,
16,
17]. In order to make the simulation results more consistent with the actual values, the measured radiation pattern of the dipole antenna (for transmitting and receiving antennas) is used as the input for the simulation. Detailed information of the fabricated dipole antenna will be introduced in
Section 3. The position of
Tx. 1 is assumed at
xt = 9.5 m and
yt = 6.5 m. The height of the transmitting antenna is 1.4 m, which is higher than most interior structures in the simulator room. Therefore, the electromagnetic waves produced by the transmitting antenna propagate relatively evenly in all azimuth directions without significant interference from the interior structures as shown in
Figure 3a. However, since the heights of equipment
A and
C are both above 2 m, there is a shaded area on the back of the equipment. On the other hand, when the transmitting antenna is located at
Tx. 2 (
xt = 13.5 m and
yt = 1.5 m), as shown in
Figure 3b, the radiated electromagnetic waves are more affected by the indoor wall than in
Figure 3a. Stronger electromagnetic fields are even observed around equipment
A, which is further away from the transmitting antenna, due to the reflection effect caused by the wall.
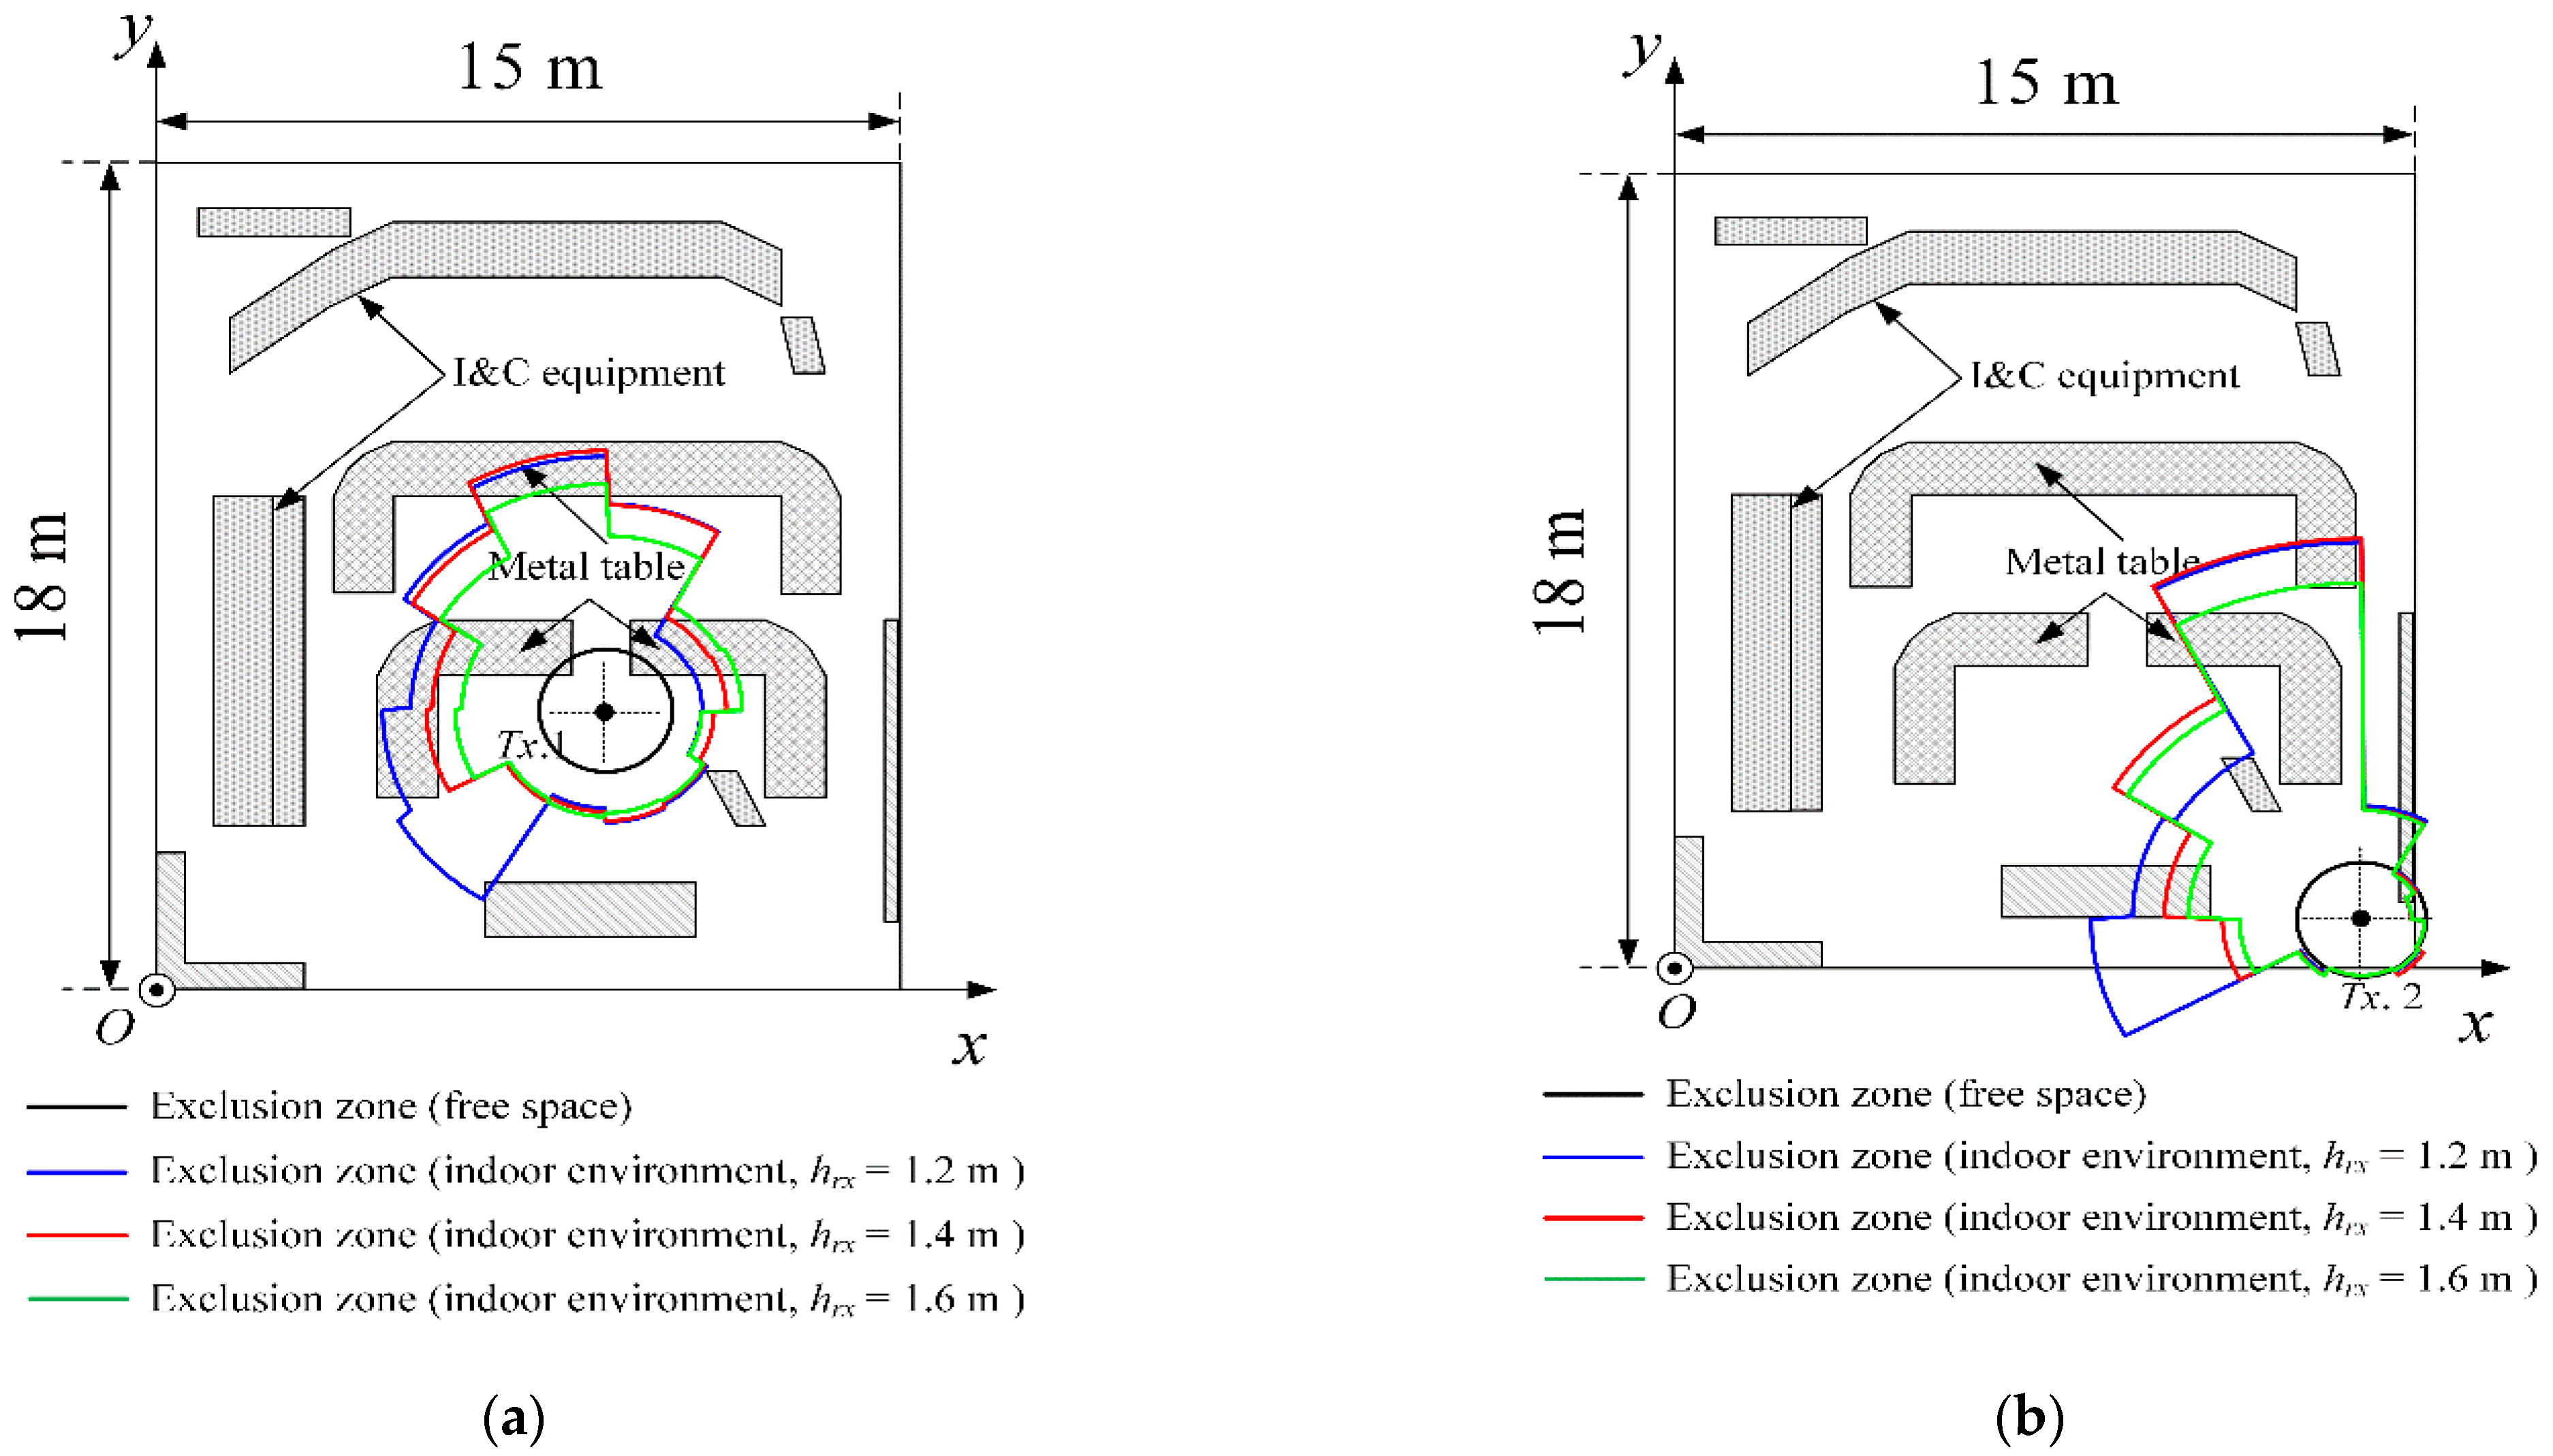
In
Figure 4, the black line is the EZ assuming the NPP as free space, which is reported in
Regulatory Guide 1.180. When the input power and the gain of the transmitting antenna are 1 W and 2.15 dBi, respectively, it has a circular shape with a radius of 1.75 m. On the other hand, the red line indicates the statistical indoor EZ boundary (
dn) in terms of the azimuth angle regions (
Region n) based on the environment in
Figure 3 (the height of the receiving antenna (
hrx) is 1.4 m). In contrast to the free space EZ, it can be seen that the EZ boundary (
dn) differs depending on the directions of the azimuth angle. In
Figure 4a, when the transmitting antenna is placed at
Tx. 1, the EZ boundary (
dn) in all regions is observed from a minimum of 2.8 m to a maximum of 7.4 m. The maximum of 7.4 m (
d4) at
Region 4 (
ϕT = 90~120°) is examined because of stronger electromagnetic fields due to the reflection by the equipment
A. On the other hand, in
Region 12 (
ϕ = 330~360°), there is no structure that generates strong reflections near the transmitting antenna in order for the distance (
d12) of
Region 12 to be shorter than the distance (
d4) of
Region 4. In
Figure 4b, the EZ boundary (
dn) in all regions is observed from a minimum of 1.3 m (at
Region 1) to a maximum of 11.7 m (at
Region 4) when the transmitting antenna is located at
Tx. 2. In this case, the electromagnetic field distribution is affected by equipment
A as well as the indoor wall, and thus the maximum
dn is greater than in the case of
Figure 4a. Additionally, to understand the EZ in a 3D environment, the EZ is extended into a 3D volume space by investigating at various heights. When the height of the receiving antenna (
hrx) is 1.2 m, as shown by the blue line in
Figure 4, the distance (
d7) of
Region 7 is greater than the red line, because the wave reflected by structure
D and
F is stronger than when
hrx is 1.4 m. On the other hand, when
hrx is 1.6 m (the green line in
Figure 4), the EZ boundary is much more reduced than the red line. This is because, in the line-of-sight direction, both the influence of the structure and the antenna gain are reduced.
3. Measurement and Verifications
To verify the statistical indoor EZ in
Section 2, we measured the received power inside the KINS simulator room using the test setup consisting of the dipole antennas, signal generator, power amplifier, and spectrum analyzer.
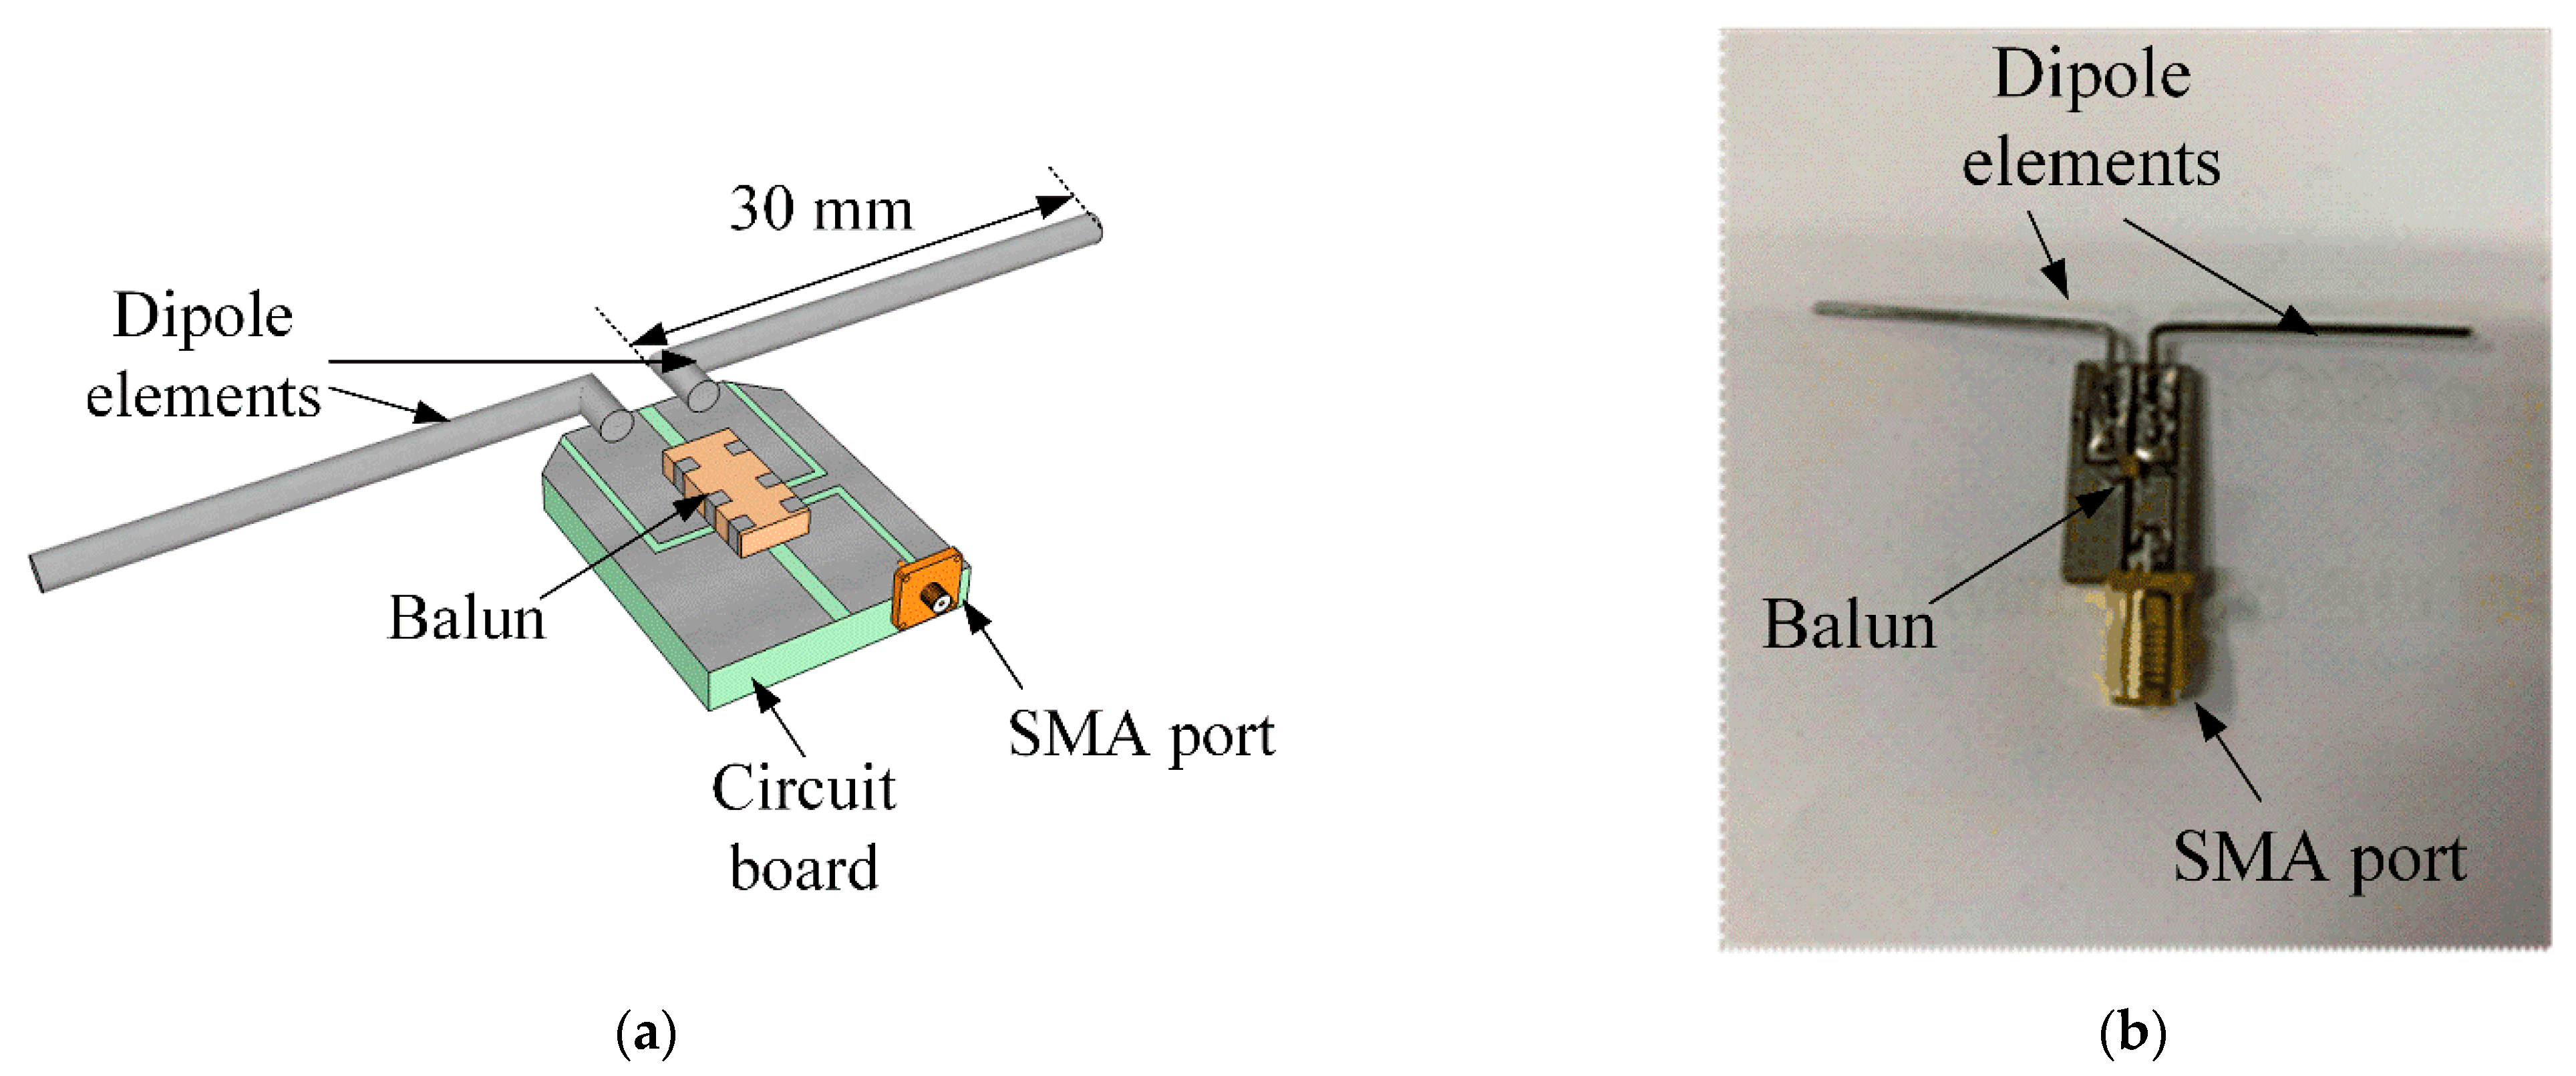
Figure 5 shows the geometry and photograph of the dipole antenna for the received power measurement in the KINS simulator room. The dipole antenna consists of a balun which is embedded in the circuit board to minimize the pattern distortion by the unbalanced current of the coaxial feed. In addition, two metallic wires are connected to the balun through the circuit board with soldering, and each wire’s length is 30 mm, as shown in
Figure 5a. The fabricated dipole is presented in
Figure 5b, which is fabricated as a pair for use as the transmitting and receiving antennas, respectively.
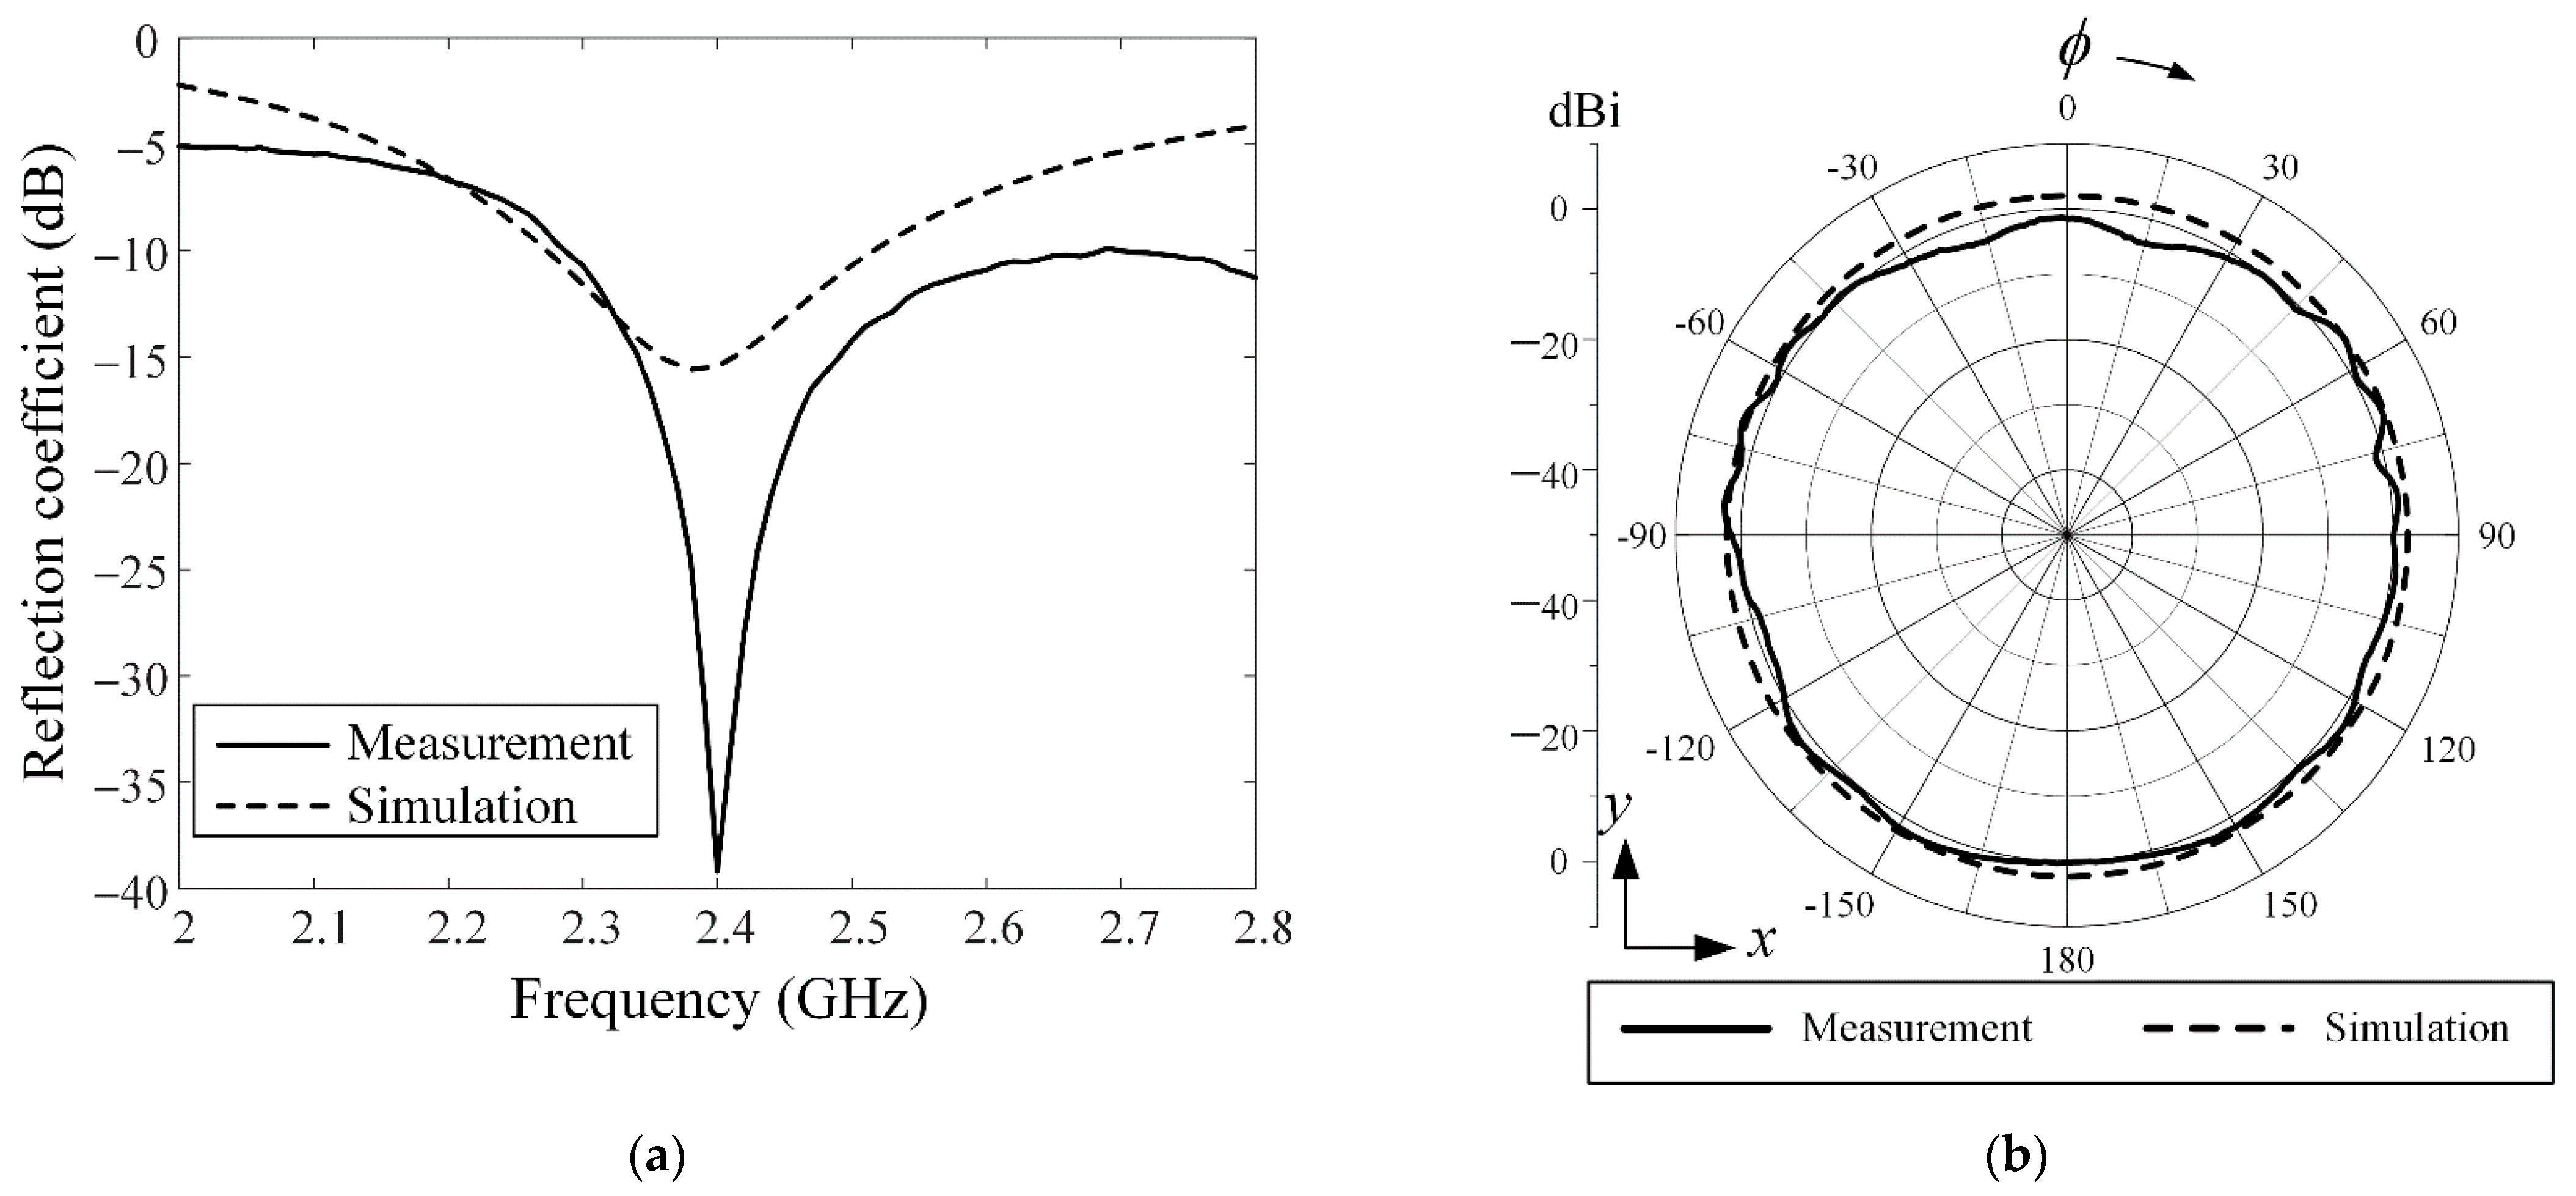
Figure 6 provides the reflection coefficients and radiation patterns of the dipole antenna. In
Figure 6a, the solid line and the dashed line indicate the measured and simulated reflection coefficient, respectively. The measured and simulated reflection coefficients are −30 dB and −17 dB at 2.4 GHz, respectively, which show a low reflection characteristic of less than −10 dB at the operating frequency. In
Figure 6b, the measured radiation patterns have an omni-directional property with an average gain of around 0 dBi in the azimuth plane, which is suitable for use as a probe capable of measuring the received power in all directions.
Figure 7 shows the test setup for measuring the indoor received power. In the test setup, the signal generator capable of creating electromagnetic waves at 2.4 GHz is employed. However, the signal generator does not have enough power to transmit the signal to a faraway receiving antenna. Therefore, the output power (0 dBm) of the signal generator is amplified through a power amplifier with a gain of 30 dB. Then, the input power of 1 W (30 dBm) is finally delivered to the transmitting dipole antenna. Herein, the amplified signal is radiated through the transmitting dipole antenna, and, simultaneously, the spectrum analyzer with the receiving dipole antenna observes the received power.
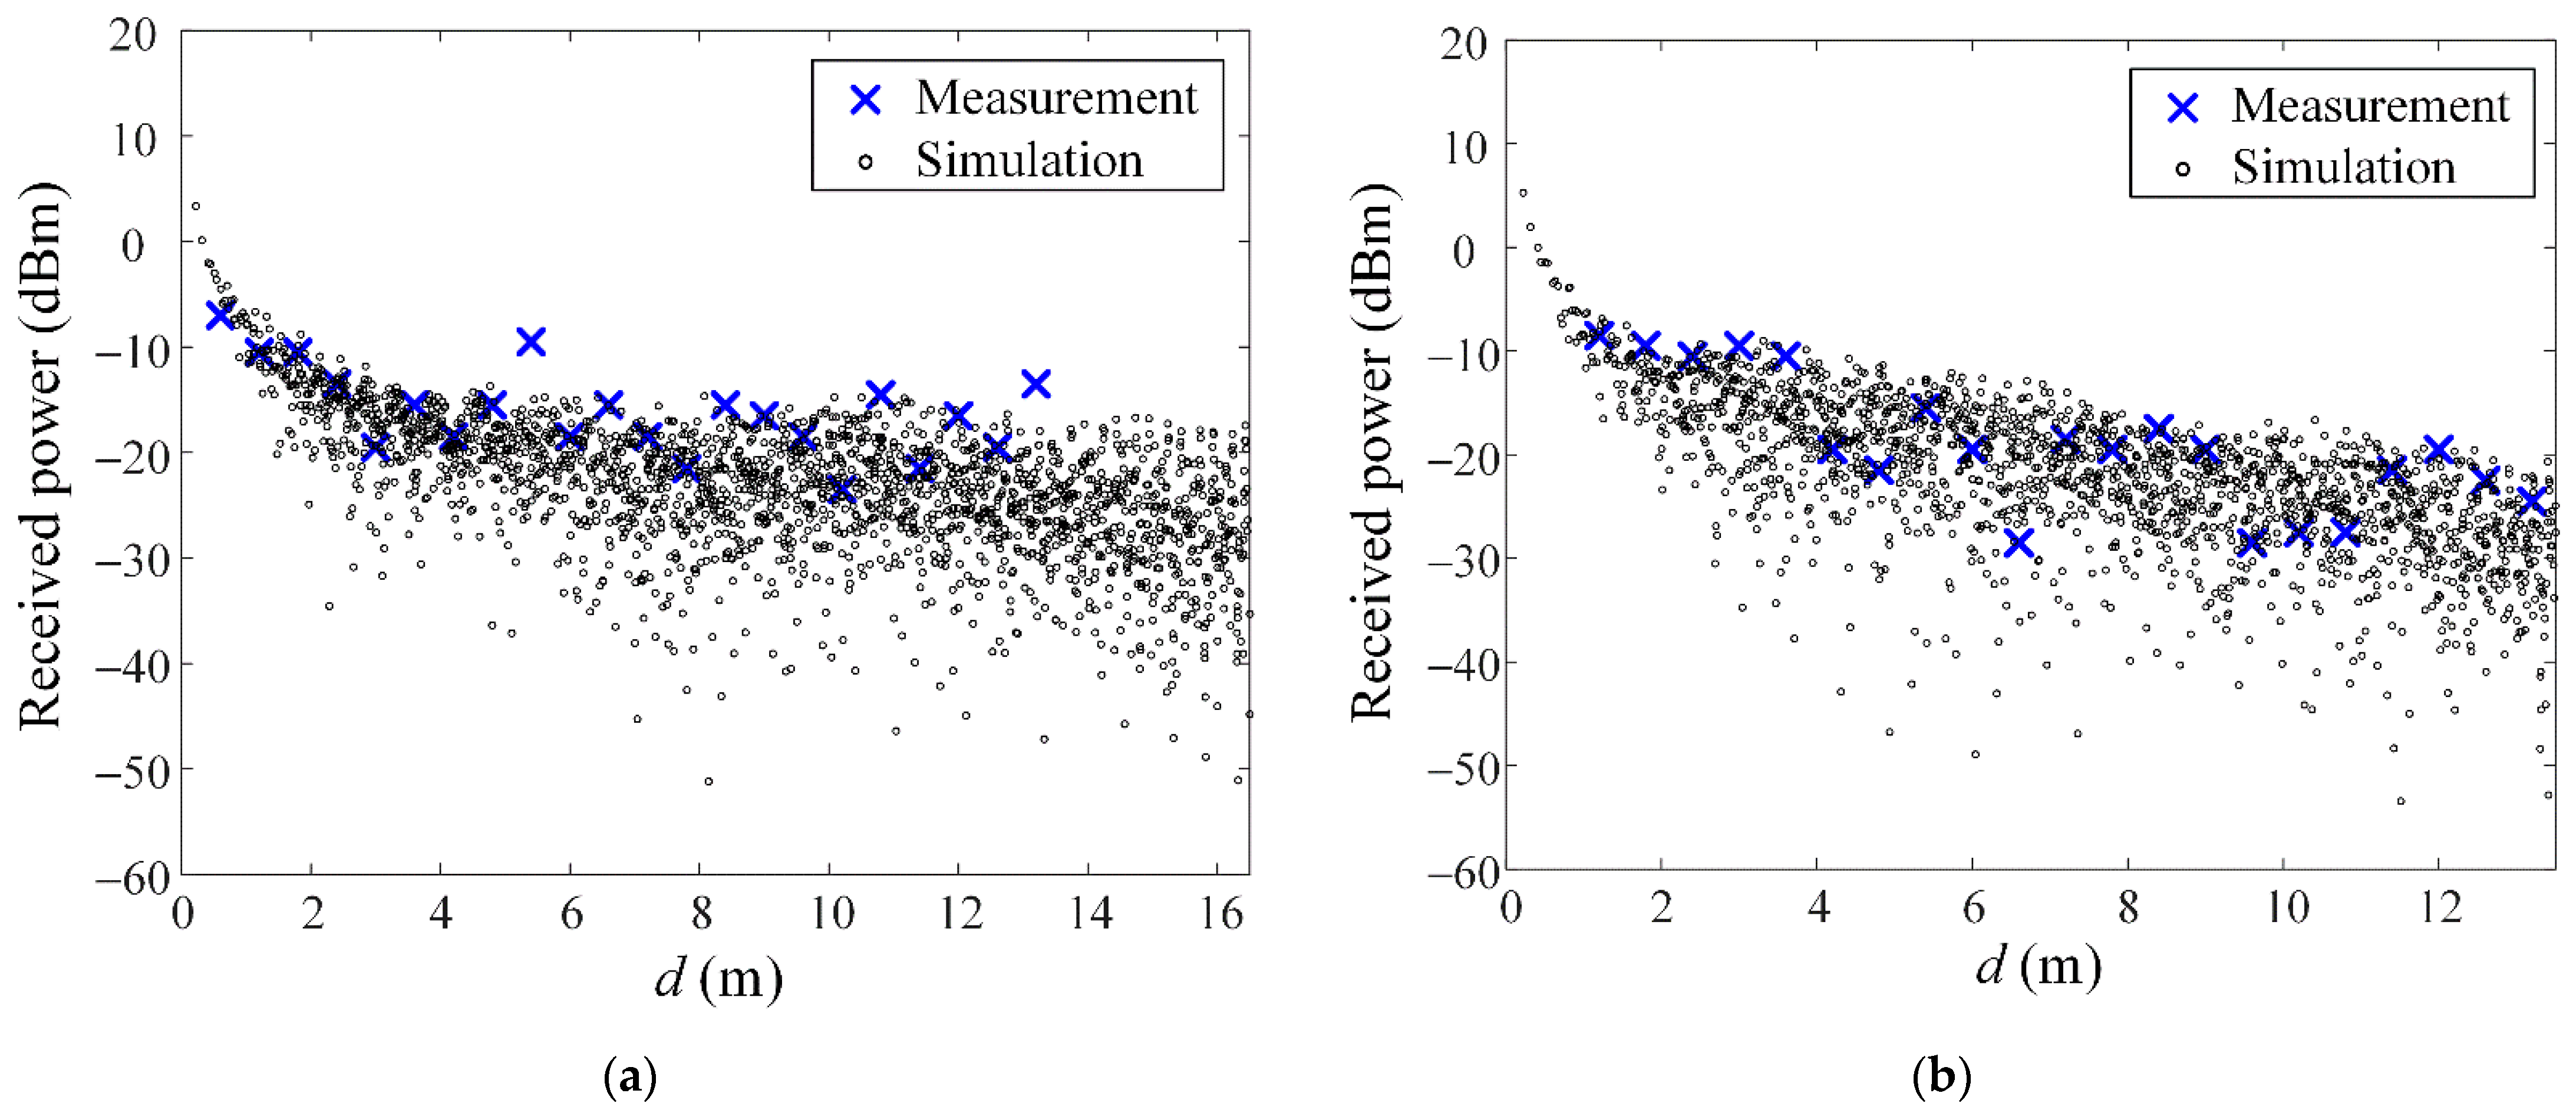
Figure 8 presents the comparison of the measured and simulated received power according to the distance between the transmitting and receiving antenna when the transmitting antenna is placed at
Tx. 2. The blue ‘×’ markers indicate the measured data, and the black ‘ο’ markers are the simulated data. The received power is measured at 60 cm intervals according to the distance from the transmitting antenna (
Tx. 2), and it is examined for two regions of
Region 3 (
Figure 8a) and
Region 7 (
Figure 8b). In
Figure 8a, the measured received power has a distribution range from −23.5 dBm to −7 dBm, which agrees well with the simulated data. The measured received power in
Figure 8b is distributed from −31.5 dBm to −8.5 dBm. The results demonstrate that the proposed statistical indoor EZ can be properly obtained not only from the simulation data but also from the measurement data.
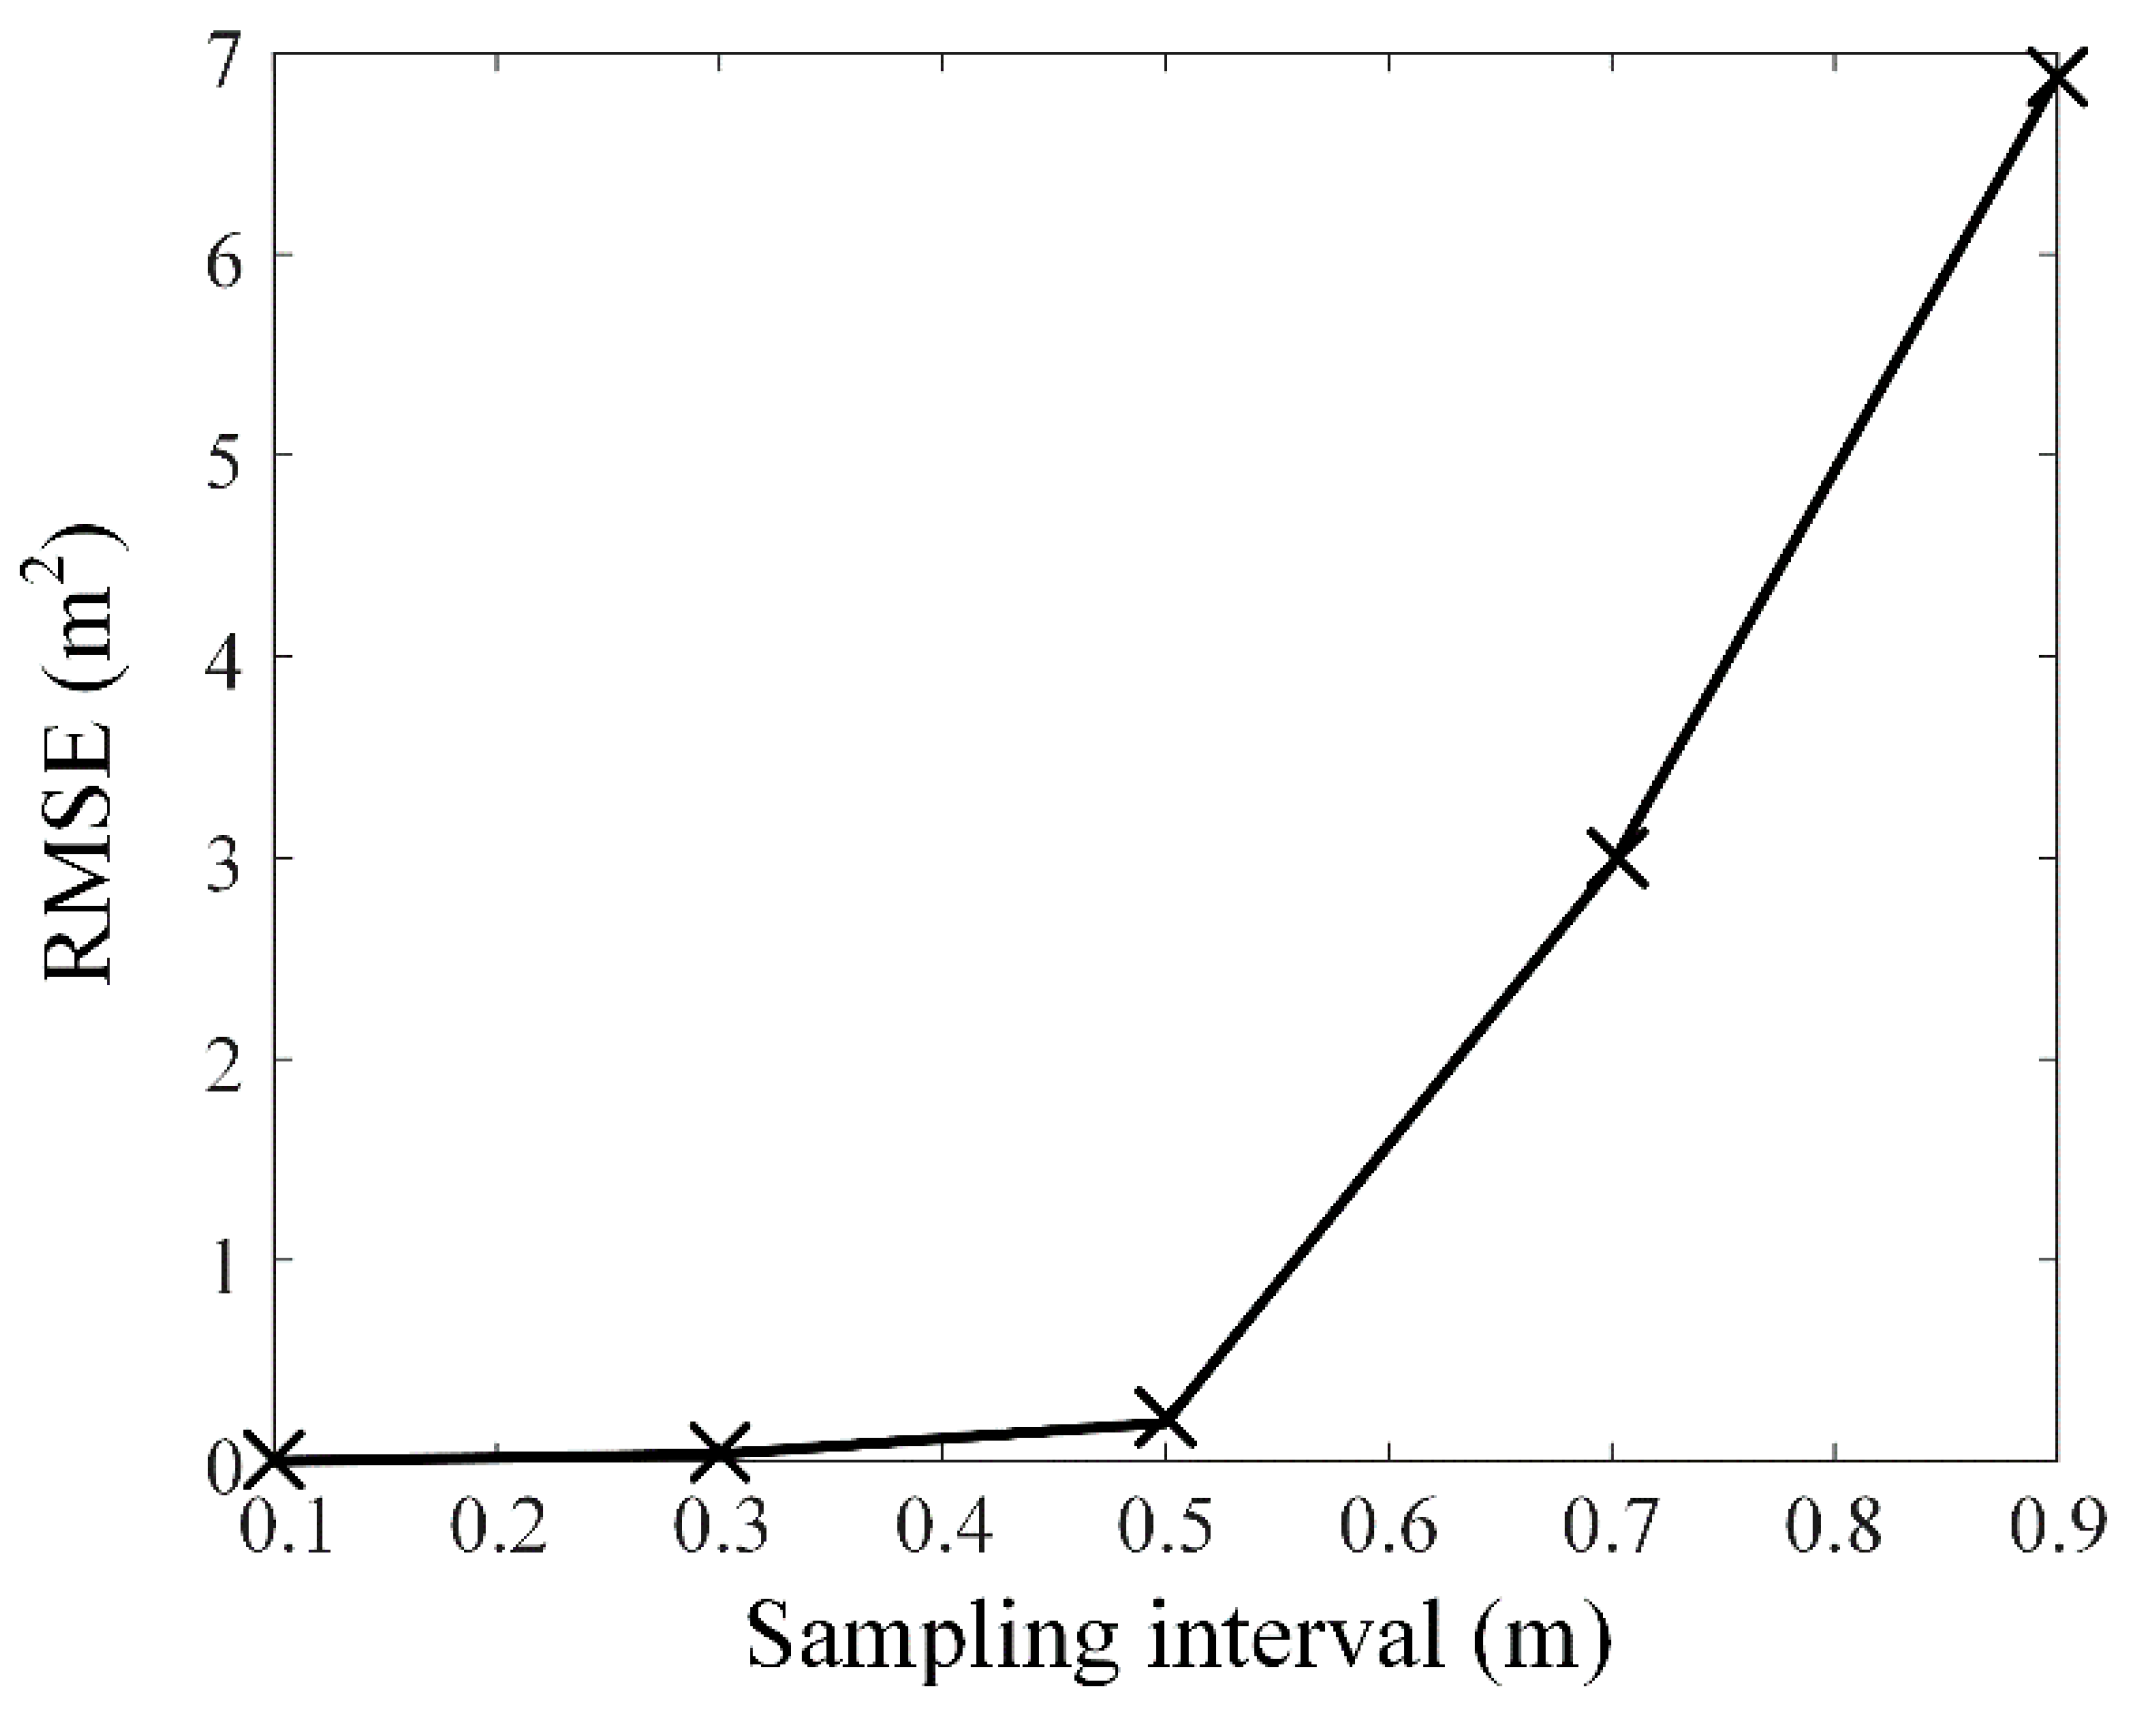
Figure 9 presents an RMSE according to the sampling interval, which can explain how many samples are needed to provide a reliable estimation of the EZ. To obtain this result, we adjusted the sampling interval from 0.1 m to 0.9 m based on the simulation results, where the area of the EZ is calculated for each case. Herein, RMSE is obtained by examining the EZ area difference between the case of
Figure 4 (sampling interval of 0.1 m) and other cases (sampling interval from 0.2 to 0.9 m). The RMSE significantly decreases under 1.6 when the sampling interval is less than 0.6 m.
