Article

Economic Analysis of Potential Secondary Use of Batteries from Electric Vehicles

by
Jozef Živčák
,
Jaroslava Kádárová
,
Michaela Kočišová
,
Laura Lachvajderová
and
Michal Puškár
*
Faculty of Mechanical Engineering, Technical University of Košice, Letná 9, 042 00 Košice, Slovakia
*
Author to whom correspondence should be addressed.
Appl. Sci. 2021, 11(9), 3834; https://doi.org/10.3390/app11093834
Submission received: 27 March 2021 / Revised: 20 April 2021 / Accepted: 20 April 2021 / Published: 23 April 2021
(This article belongs to the Special Issue Advanced Engine Technologies and Innovative Vehicle Driving Systems)

Abstract

:
This article focuses on the practical use of used batteries from electric vehicles also known as 2nd life batteries. The first part emphasizes lithium batteries, which describes the overall life cycle of the battery, its number of charging cycles and secondary use. This part of the article also focuses on implemented projects of 2nd life batteries from electric vehicles and there is an analysis of the market potential for 2nd life batteries mentioned at the end of the chapter. The second part of this study offers a practical proposition of two possible strategies for using 2nd life batteries. The main source of income in both cases is the provision of regulatory energy. Using the formulas and the function of the calculation model created in the MS Excel software, the appropriate price of the battery for car manufacturers will be calculated and from other possible scenarios of individual strategies will be expressed. The first strategy works with large central battery storage and the second strategy uses small, decentralized battery storage with a fast-charging station.

1. Introduction

The first electric vehicles (EVs) were constructed at the end of the 19th century. Inappropriate batteries and the associated low range of the EV postponed their wider use until the beginning of the 21st century. Currently, EVs compete with the range of vehicles with internal combustion engines. For example, the Jaguar I-Pace, introduced in 2018, announces a range of 480 km per charge in normal operation. Its battery capacity reaches 90 kWh. The great boom in electromobility in the last decade is due to CO2 emission limits that are constantly tightening, and many European car manufacturers are unable to meet these requirements with conventional vehicles. For this reason, car manufacturers are offering an increasing number of serial EVs, which can be used to reduce the overall balance of CO2 emissions. CO2 legislation is constantly evolving and changing but can be expected to be tightened in line with the 2015 Paris Climate Agreement [1].
Unfortunately, due to the use of an eclectic vehicle, the capacity of the battery (and the associated range) is gradually reduced, which needs to be removed and replaced after it reaches the end of its life. However, this excluded battery still has sufficient capacity to be used in other applications. For the needs of today’s electric vehicle, there are also other requirements for battery parameters, such as service life, charging speed, maintenance-free, weight and price. It is the requirement of battery life and life cycle that will be the main topic of this analysis. If the batteries are still used after reaching their lifetime, we say that it is a “second battery life” and with this term, we will refer to batteries that are used after their first intended lifetime is over.
The entire electricity system works with the equilibrium power balance (production = consumption). For this reason, experts try to accurately predict both the production and consumption of electricity for each hour. However, it is common that predictions do not correspond to reality, for example, because of unexpected outages of the power unit or poor weather prediction, thus power deviation occurs. In order to ensure the quality and stability of the electrical system, the deviation must be compensated immediately with regulating energy.
As part of the main content of this work, two investment strategies were devised and calculated. Both options work with the premise of offering regulated energy in the form of a frequency containment process (FCP) support service and energy in the balancing market. The first strategy works with the use of excluded batteries for large battery storage. On the contrary, the second strategy envisages a larger number of small battery stores located at the car’s dealerships. A description of all input parameters, assumptions and a description of the calculation is given in the section Economic Analysis.

2. Battery Life Cycle

The battery in an electric vehicle (EV) is one of the most important components of the entire construction. Mostly, it is the battery that decides on the most important parameters of EV, which include the total range per charge and the final price. Lithium batteries with various heavy metal additives (Co, Cd, Ni, Zn, etc.) are mainly used in today’s EVs [2]. The beginning of the battery life cycle begins in the mines with the mining of lithium and heavy metals. The largest deposits of lithium itself are in Australia and Chile, cobalt deposits in the Democratic Republic of the Congo and manganese deposits in China and South Africa [3]. To illustrate the number of used materials and their prices in the Chevrolet Bolt EV battery see Table 1.
According to Table 1, it is obvious that concerning the required number of raw materials, the most expensive is cobalt, followed by graphite and nickel. One ton of lithium is more than a ton of graphite or nickel, but it has a very low percentage in the battery. Aluminum is the most consumed, the price of which is much lower than that of the above-mentioned materials. The actual production of battery cells is currently taking place mainly in China, the USA, Korea and Japan. Examples are the A123 System, Samsung, LG, Panasonic and Tesla. Subsequently, the manufactured batteries are used in various electrical devices around the world. One of the biggest uses is in the field of electromobility. To give an idea of how many batteries are needed in the EU alone to meet CO2 limits, it is worth mentioning EU regulations that require car manufacturers to produce only 95 g of carbon dioxide per kilometer by 2021, otherwise, car manufacturers will be forced to pay a corresponding fine. By 2030, automotive companies should offer at least 35% of EVs from their total manufacturing number [5].
According to [6], it is declared that the battery will reach the end of life if its capacity is reduced by 20% of the original capacity. Maintaining such a high capacity means that some of the materials, most bulk materials, are still active in the battery, so it is appropriate to explore the possibilities for using batteries after the first life cycle. Based on [7], the first life battery can also be briefly defined as the use of the battery until its capacity is reduced from 100% to 80%. As reported by [7], the definition of a second life battery consists in the use of the battery from the time when the capacity goes from 80% to 66–60% of the starting value.
The potential of the battery cells in EV is not used to 100%. This is mainly due to the degradation of capacity and the directly dependent reduction in vehicle mileage. One of the parameters of the battery is the number of charging cycles (CCs), which the battery is capable of before it is taken out of service resp. the battery is exhausted. Battery exhaustion means that the battery drops below 60% of capacity. Some data on traction batteries for EVs show a drop value below 30–50% [8]. Battery life is reduced primarily by loading the battery with high currents. For example, during a drive with repeated rapid acceleration, the actual energy output from the battery is always lower. The chemical structure of the battery fails to emit as much current as if it were discharged slowly. Battery life is also related to operating temperature. During freezing temperatures (below −15 °C) or even at temperatures around 40 °C, lithium batteries have a reduced capacity. The ideal operating temperature for the battery is t approximately 15 °C [9]. As far as traction batteries are concerned, in general, if the discharge cycles are deeper, then the battery life is shorter (see Table 2). This is the exponential decay of dispositional electrical battery work. For example, if the battery is repeatedly discharged to a depth of 80% (DoD 80% = depth of discharge = 80% of the available electrical work is exhausted, only 20% will remain available in the battery), the battery life will be significantly shorter than when discharging to a depth of only 40%. Battery life is given by its actual disposition value of electrical work (kWh) and is in the order of thousands of cycles of full charge and discharge. As soon as it falls below 50%, it ceases to be suitable for EV, because the driving range is reduced and for EV itself it also means too large a share of the so-called “dead weight”.
The number of CCs for EVs is varied, and with a slight exaggeration, it can be said that EV dealers do not want to say it, or they probably cannot determine it exactly. Presently, the numbers of 1000–3000 CCs reported by Panasonic can be considered. With newly manufactured traction batteries, the number of CCs increases. The number of CCs currently has increased, so that the table only informs about the dependence of the discharge level and the number of cycles.
Table 2 shows the relationship between the discharge level and the traction battery life [10]. The number of CCs currently has increased, so that the table only informs about the dependence of the discharge level and the number of cycles.

Secondary Use of Batteries

Due to the fact that the recycling of batteries from EVs is still very expensive and unhelpful for the environment, their reuse is considered to be a much more lucrative option. The continuous improvement of recycling technologies, which also includes secondary use, promises that by the end of 2021, recycling facilities for EVs batteries should be fully operational [11]. The academic community and several large car manufacturers are showing increasing interest in second-life batteries. Partnerships have begun between carmakers and recycling companies to develop the second life batteries market. In accordance with [12] and the case studies, second battery life can be used in many ways. For example, 4R Energy, a joint venture between Nissan and Sumitomo, which was established in 2010, is dedicated to the secondary use of batteries from EVs. The company has carried out several projects using discharged batteries in order to verify technical problems and attempt a business model. The Sumitomo used second-life batteries from EV Nissan Leaf to create the world’s first energy storage system on Yume-Shima Island in Osaka. This prototype consisted of 16 s life batteries (600 kW/400 kWh), which were used to test the soothing effect on the power output from a nearby wind farm. More than that, they collaborated with companies such as Eneres and provided them with second-life batteries for other possible innovative energy storage system solutions.
Another example is FreeWire based in California, which provides innovative solutions in the form of creating a network of intelligent mobile EV chargers, which consist of second-life batteries. The Mobi charger, called the portable charging station, uses discarded Nissan Leaf batteries, and tries to solve the problem of an insufficient number of charging stations for EVs in the regions. It prevents unnecessary time spent searching for or waiting for available places to charge, and instead, the mobile charging station comes directly to the owner of the vehicle [12]. Other similar ventures and their projects are listed in Table 3.
It is practical to replace batteries in EVs before the end of their service life. Based on interviews with industry leaders in the 2nd life battery industry and the expertise of the IDTechEx analytics team, they presented a comprehensive analysis of the used battery industry and how it will evolve over the next ten years. A ten-year forecast of the available capacity of rechargeable batteries from different categories of EVs and electric buses (battery electric vehicles—BEVs and plug-in hybrid electric vehicles—PHEVs) shows the potential size and structure of the 2nd life battery market (see Figure 1). This creates great potential across power engineering, where a large number of such batteries could be used [14].
Secondary use of batteries is based on a wide range of uses. They can be used in commercial, residential and industrial applications. Commercial and residential use is considered a small energy application and industrial applications are large that provide support for renewable energy sources. The limitation and market potential for 2nd life batteries from EVs were analyzed by Heymans et al. (see Table 4) [15].
The amount of surplus energy is reduced by regulated energy pricing. Excess energy is created by buying electricity at a low price and using it at a time when the demand for energy is greatest. The possibility of higher returns due to price fluctuations is provided by an unregulated market. Their economic study shows that reusing EVs batteries for energy storage can provide significant savings to users. The economic studies on various applications were reviewed and summarized by Martinez-Laserna et al. [17] Therefore, the key is to match the “right” batteries with the “right” applications. The main goal of this article is to perform an economic analysis of the possible use of 2nd life batteries based on the studied strategies of automotive companies and to design the calculation itself, which will be the output of an overview of the issue.

3. Economic Analysis

All car manufacturers operating on the European market are intensively involved in the development of new EVs because if the manufacturers do not meet the strict EU emission requirements, they will be forced to leave the European car market by financial restrictions. One of the options to economically help the expensive development of EVs today is the effective use of 2nd life batteries.
Automotive companies are analyzing various strategies for dealing with used batteries from EVs. According to law, they are obliged to ensure the take-back of all batteries, including those from EVs. The simplest option seems to be the take-back and subsequent sale (donation) to recycling centers. In this way, the car manufacturers will ensure a legal obligation, but it will lose potential in the field of power engineering. Almost all large companies are trying to diversify their business activities to increase profits and ensure economic stability. For this reason, car manufacturers are investing in projects that at first glance are not related to car production. For example, the subsidiary of the large Czech car manufacturer ŠKO ENERGO in Mladá Boleslav (Czech Republic), supplies heat to 12,000 households in Mladá Boleslav. However, the main reason for its existence is primarily to provide heat, water and, in part, electricity for the actual production of vehicles. A similar procedure could be used by automotive companies in the area of using 2nd life batteries. For example, they could build a large network of charging stations with solar panels and a sufficiently dimensioned accumulator composed of 2nd life batteries, which would primarily generate a profit from charging. In general, it is known about electromobility that a sufficient infrastructure of charging stations is very important for its massive development. If a sufficient network of chargers is built, the automotive companies will also ensure the sale of its EVs and thus ensure the economic stability of its entire company.
The economic analysis will focus on two possible strategies for using 2nd life batteries. Both will be primarily focused on the provision of regulatory energy in the form of ancillary services and regulatory energy in the balancing market. The first option will be more energetical, where the car manufacturer will build its battery storage on a green field for the needs of the energy network. The second option will be more interconnected with the automotive industry, mainly with the support of the charging station infrastructure. There will be several small battery compartments, which will have central remote control, and which will also include a fast-charging station.

3.1. Input Parameters for the Calculation and 2nd Life Battery Pricing

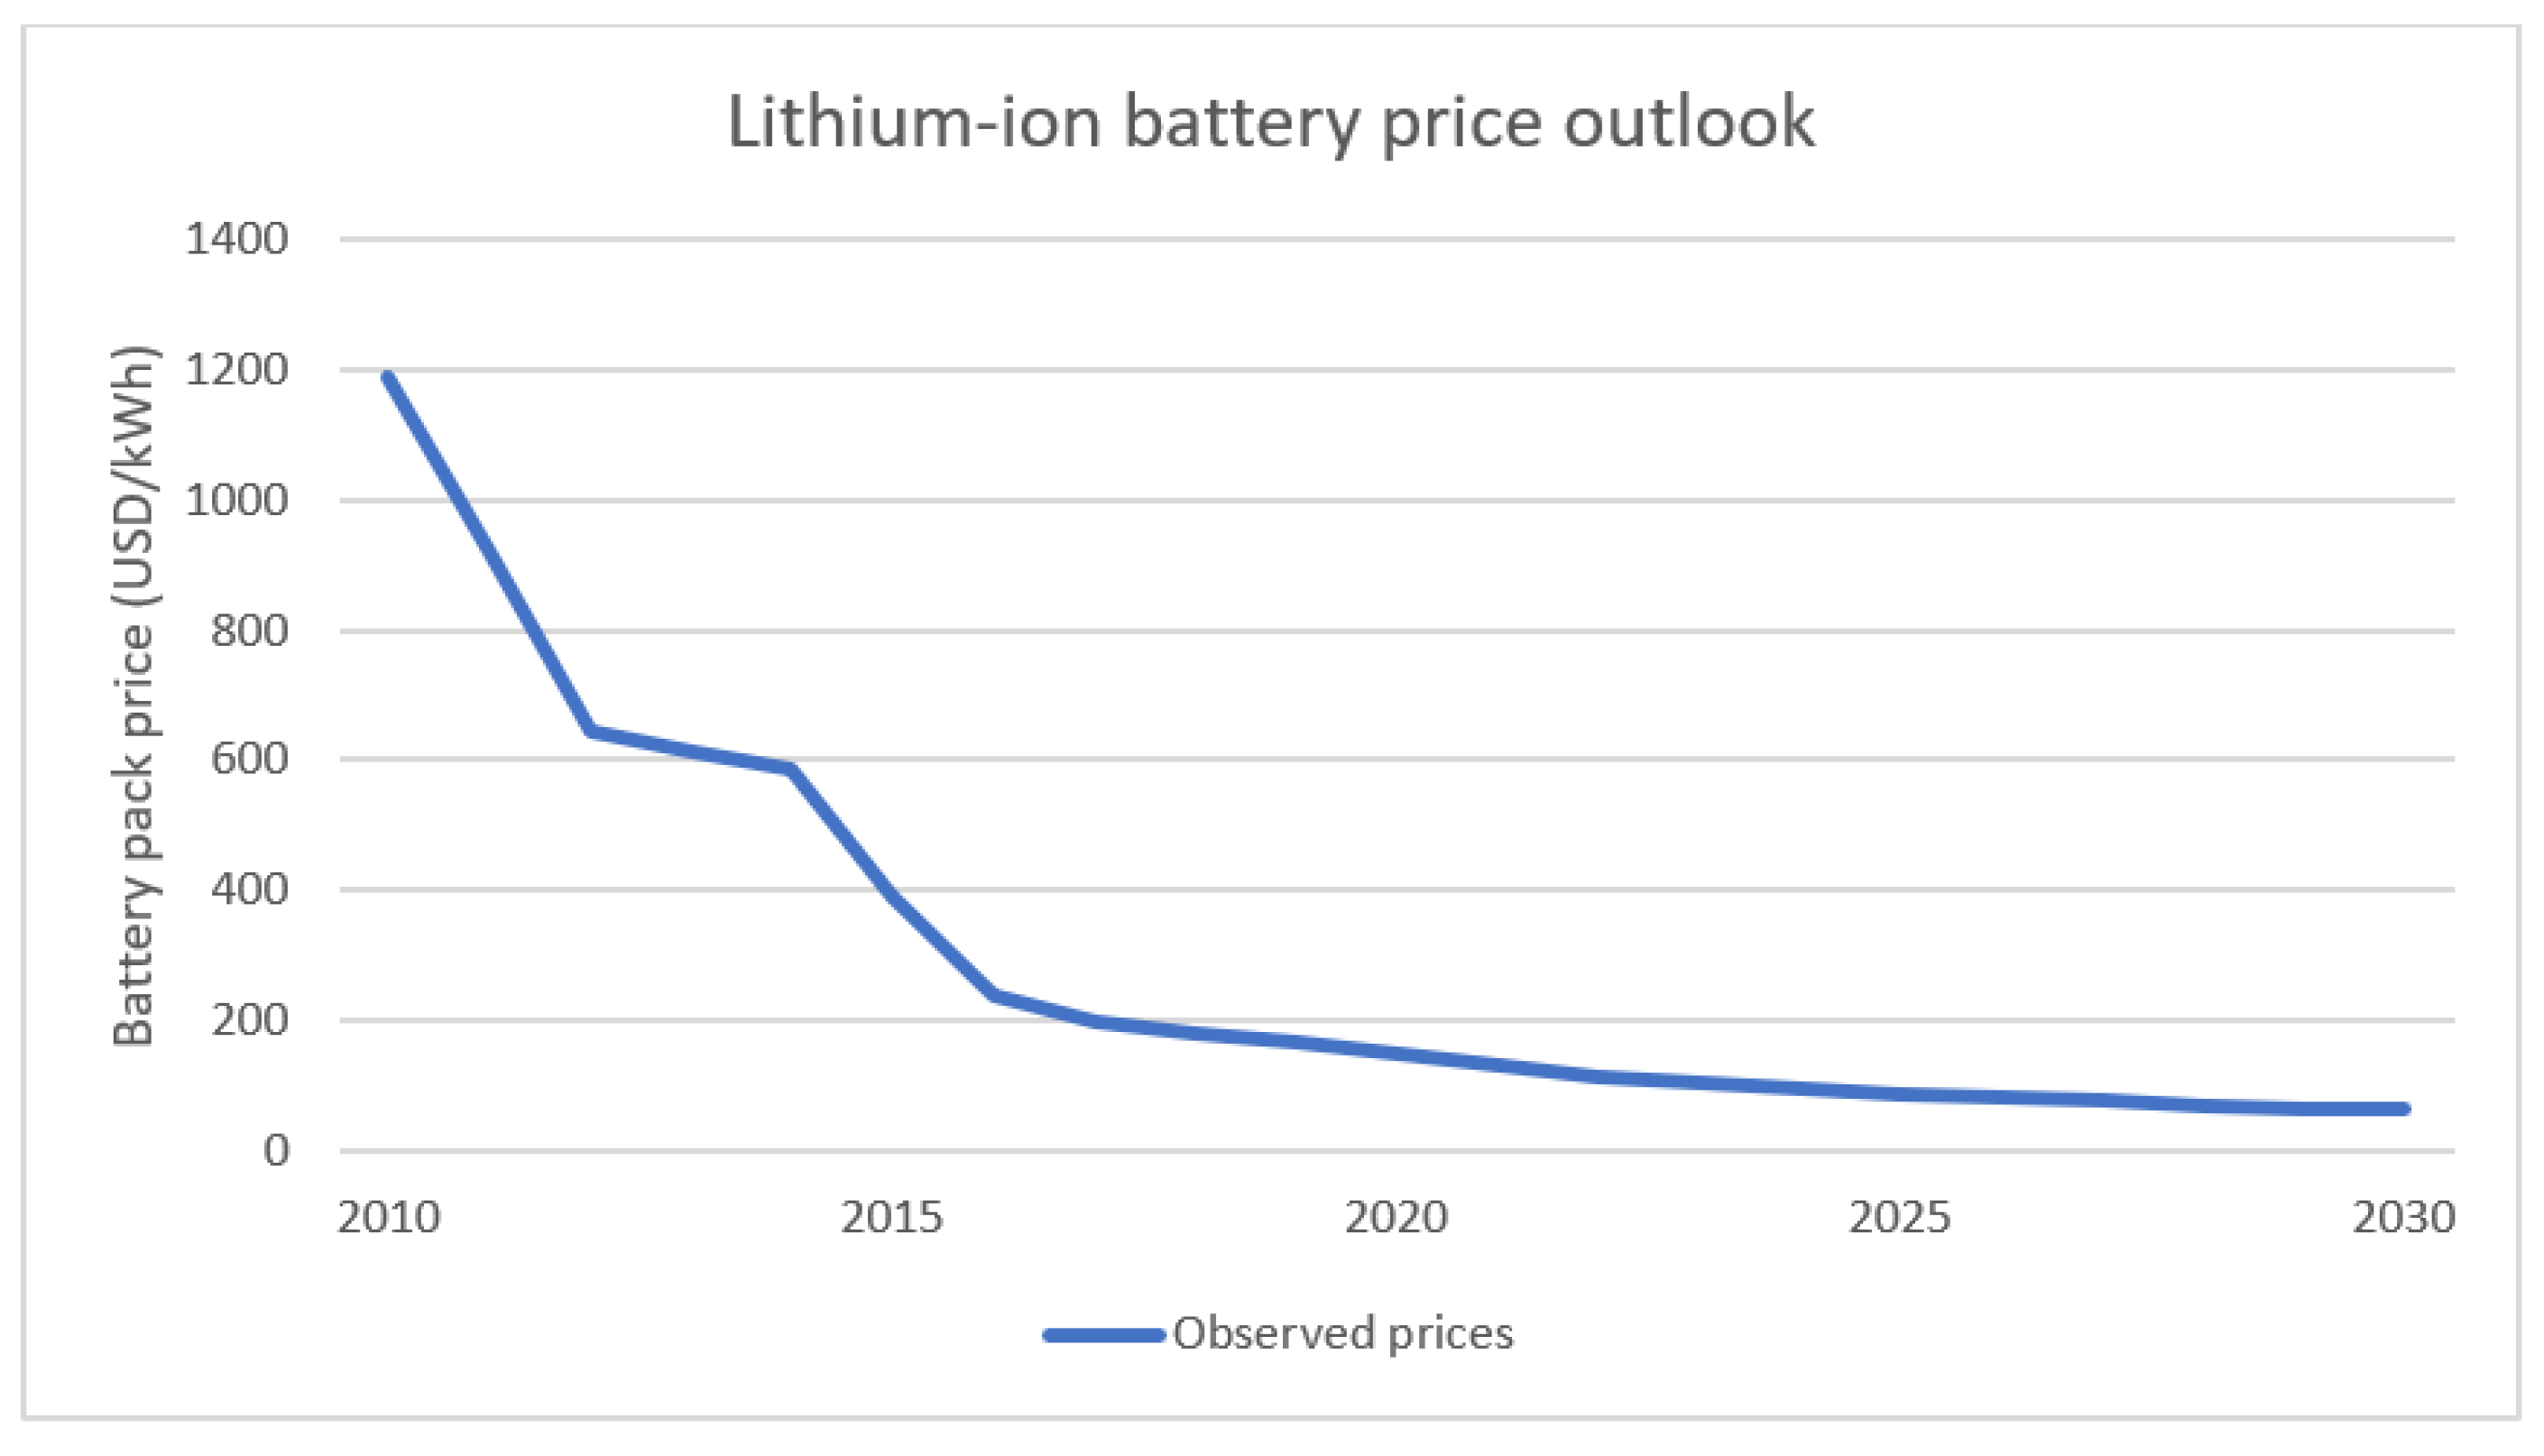
The unit price of the battery is a key expense for most buyers. Due to the technological progress, the production costs of new lithium batteries per 1 kWh have fallen by hundreds of euros in the last decade, but it is still a very expensive item. The development and projection of the unit price of a lithium battery in the future are described in the BloombergNEF chart. The key determinant of this forecast is the relationship between price and volume. From the observed historical values, a learning rate of about 18% was calculated. The learning speed is a hyperparameter that controls the extent to which the model needs to be changed in response to an estimated error each time the model weights are updated. This means that for each doubling of the cumulative volume, an 18% decrease in price was observed. Based on this observation and forecast of battery demand, the price of the average battery is therefore expected to be around 94 USD/kWh by 2024 and 62 USD/kWh by 2030 but this is only the expected average price (see Figure 2). [18]
Back in 2010, when the production of the first middle-class EVs (such as the Nissan Leaf), the unit price per 1 kWh was $1160. At that time, EVs were fitted with a battery with a capacity of 24 kWh, which means that the price of the battery itself reached values of 20 thousand euros. If the base selling price of the Nissan Leaf was $33,000 (€24,000), then the financial unprofitability of the vehicle is evident. Five years later, the price of batteries was already at 377 USD/kWh. The final price in 2030 is still set at 62 USD/kWh, but the final price in the distant future will be affected by the economic advantage of recycling lithium batteries.
The value of the theoretically delivered energy per year is calculated using the entered parameters, such as the DoD, the charging voltage, the capacity degradation of the new battery and the number of CCs. Regarding the dependence of the DoD and the charging voltage on the total number of cycles, a simple example is given lithium-ion batteries at an operating voltage of 3.6 V are usually charged to a voltage of 4.2 V to achieve a nominal value of the battery. Of course, it is also possible to charge higher or lower voltages. However, this change will have a major impact on both the total charge capacity of the battery and the total number of CCs. Reducing the charging voltage by 0.1 V doubles the possible number of cycles, but also reduces the usable battery capacity by approximately 15% [19]. There is still not enough evidence today to accurately determine the dependence of battery degradation on mileage. Data on its batteries are given only by Tesla, which claims to have very low degradation. Other automotive companies do not publish data, so experimental measurements on a limited number of samples must be taken into account. According to publicly available materials, the degradation of the Tesla 100 kWh battery from the S and X models was chosen and also the 40 kWh battery from Nissan Leaf (see Figure 3). Based on these two possibilities, the process of degradation was determined for a computational model with a 43 kWh battery.
The graph shows a significant difference between the batteries from manufacturers. Tesla, which often presents itself as an innovative company in the field of electromobility, has achieved respectable results, probably with a constantly updated control system for charging and discharging in cooperation with a large battery. On the contrary, in a competition that uses a much smaller battery, degradation is noticeable. Therefore, most automotive companies offer a battery replacement guarantee. For example, with a 40 kWh battery, the Nissan Leaf now offers a warranty of 8 years or approximately 160,000 km.
In case that the secondary use of batteries is applied and batteries from EV are used, the question arises: how to properly price these batteries. The calculated price will be paid to the owner of the EV (or dealer), who will reduce the cost of purchasing a new battery. This analysis will work with a slightly modified procedure from the team of authors from the source [22], there is a basic formula for pricing the 2nd battery life:
c 2 n d   l i f e = c n e w · k h e a l t h · k d e m a n d ,  
where c 2 n d   l i f e is the price for 1 kWh of the battery from the EV (USD/kWh), c n e w is the price for 1 kWh of a new battery (USD/kWh), k h e a l t h is the coefficient of the 2nd battery life status <0; 1> (-) and k d e m a n d is the demand coefficient of used batteries <0; 1> (-) [22].
Coefficient k d e m a n d captures the current market demand for used batteries, which cannot be reliably calculated. Neubauer et al. (2012) set this coefficient at 0.75, which will be used in this analysis, and a sensitivity analysis will be performed at the end [22]. The 2nd battery life factor can be calculated as follows:
k h e a l t h = P V B 2 n d   l i f e P V B n e w ,  
where P V B 2 n d   l i f e is the present value of the theoretically possible supplied energy of the selected battery from the EV (kWh) and P V B n e w is the current value of the theoretically possible supplied energy of a new battery (kWh) [22].
The current values are calculated as follows:
P V B x = i = 1 n ( 1 + v ) i ( 1 + r ) i x i ,  
where n is the life of the battery (year), i is a year, x i is theoretically supplied energy per year (kWh), r is discount cash (%) and v is the annual increase in the price of electricity (%).
To determine the price of the 2nd life of the battery, it was necessary to enter the following technical and economic input parameters for the calculation model (see Table 5).
According to Damodaran’s cash flow valuation, this cash discount (r) was chosen in energy production at 7.2% [23]. The annual increase in the price of electricity (v) was set at 3.1% based on historical data. Next, it was necessary to enter the DoD and charging voltage, which the model used to calculate the total number of batteries CCs. The power dependence of the DoD and the charging voltage on the total number of batteries CCs is used. Due to the use of a lower charging voltage, the model corrected the available battery capacity. After dividing the total number of cycles by the number of days in the year, the battery life (n) was obtained. For direct calculation, the DoD was set at 40% and the charging voltage at 4.1 V to increase battery life. Other input parameters include mileage and average EV power consumption, which help determine the residual capacity and remaining CCs of the 2nd battery life. Due to the lack of data, it was not easy to determine the dependence of battery degradation on mileage. Therefore, the battery capacity in EV was fixed at 43 kWh, which corresponds to the weighted average of EV sold in the EU until mid-2019, and the dependence of degradation on mileage was also determined for this value. The battery in an EV is limited by its size and weight, so car companies set DoD to higher values at the expense of life. The computational model works with DoD in EV at 80%. Based on all these values, it was possible to calculate the total EV consumption and the number of CCs used. By back-calculation using the power dependence, the model calculated the remaining cycles of the 2nd battery life at a DoD of 40% and determined the amount of degradation of the capacity of the 2nd life battery. Due to these values, it is possible to determine the theoretically delivered energy per year ( x i ) for the battery from EV. For a new battery, x i is only calculated by multiplying the total battery capacity (43 kWh), DoD and correcting the capacity due to a change in charging voltage. The input values from the model are shown in the following 
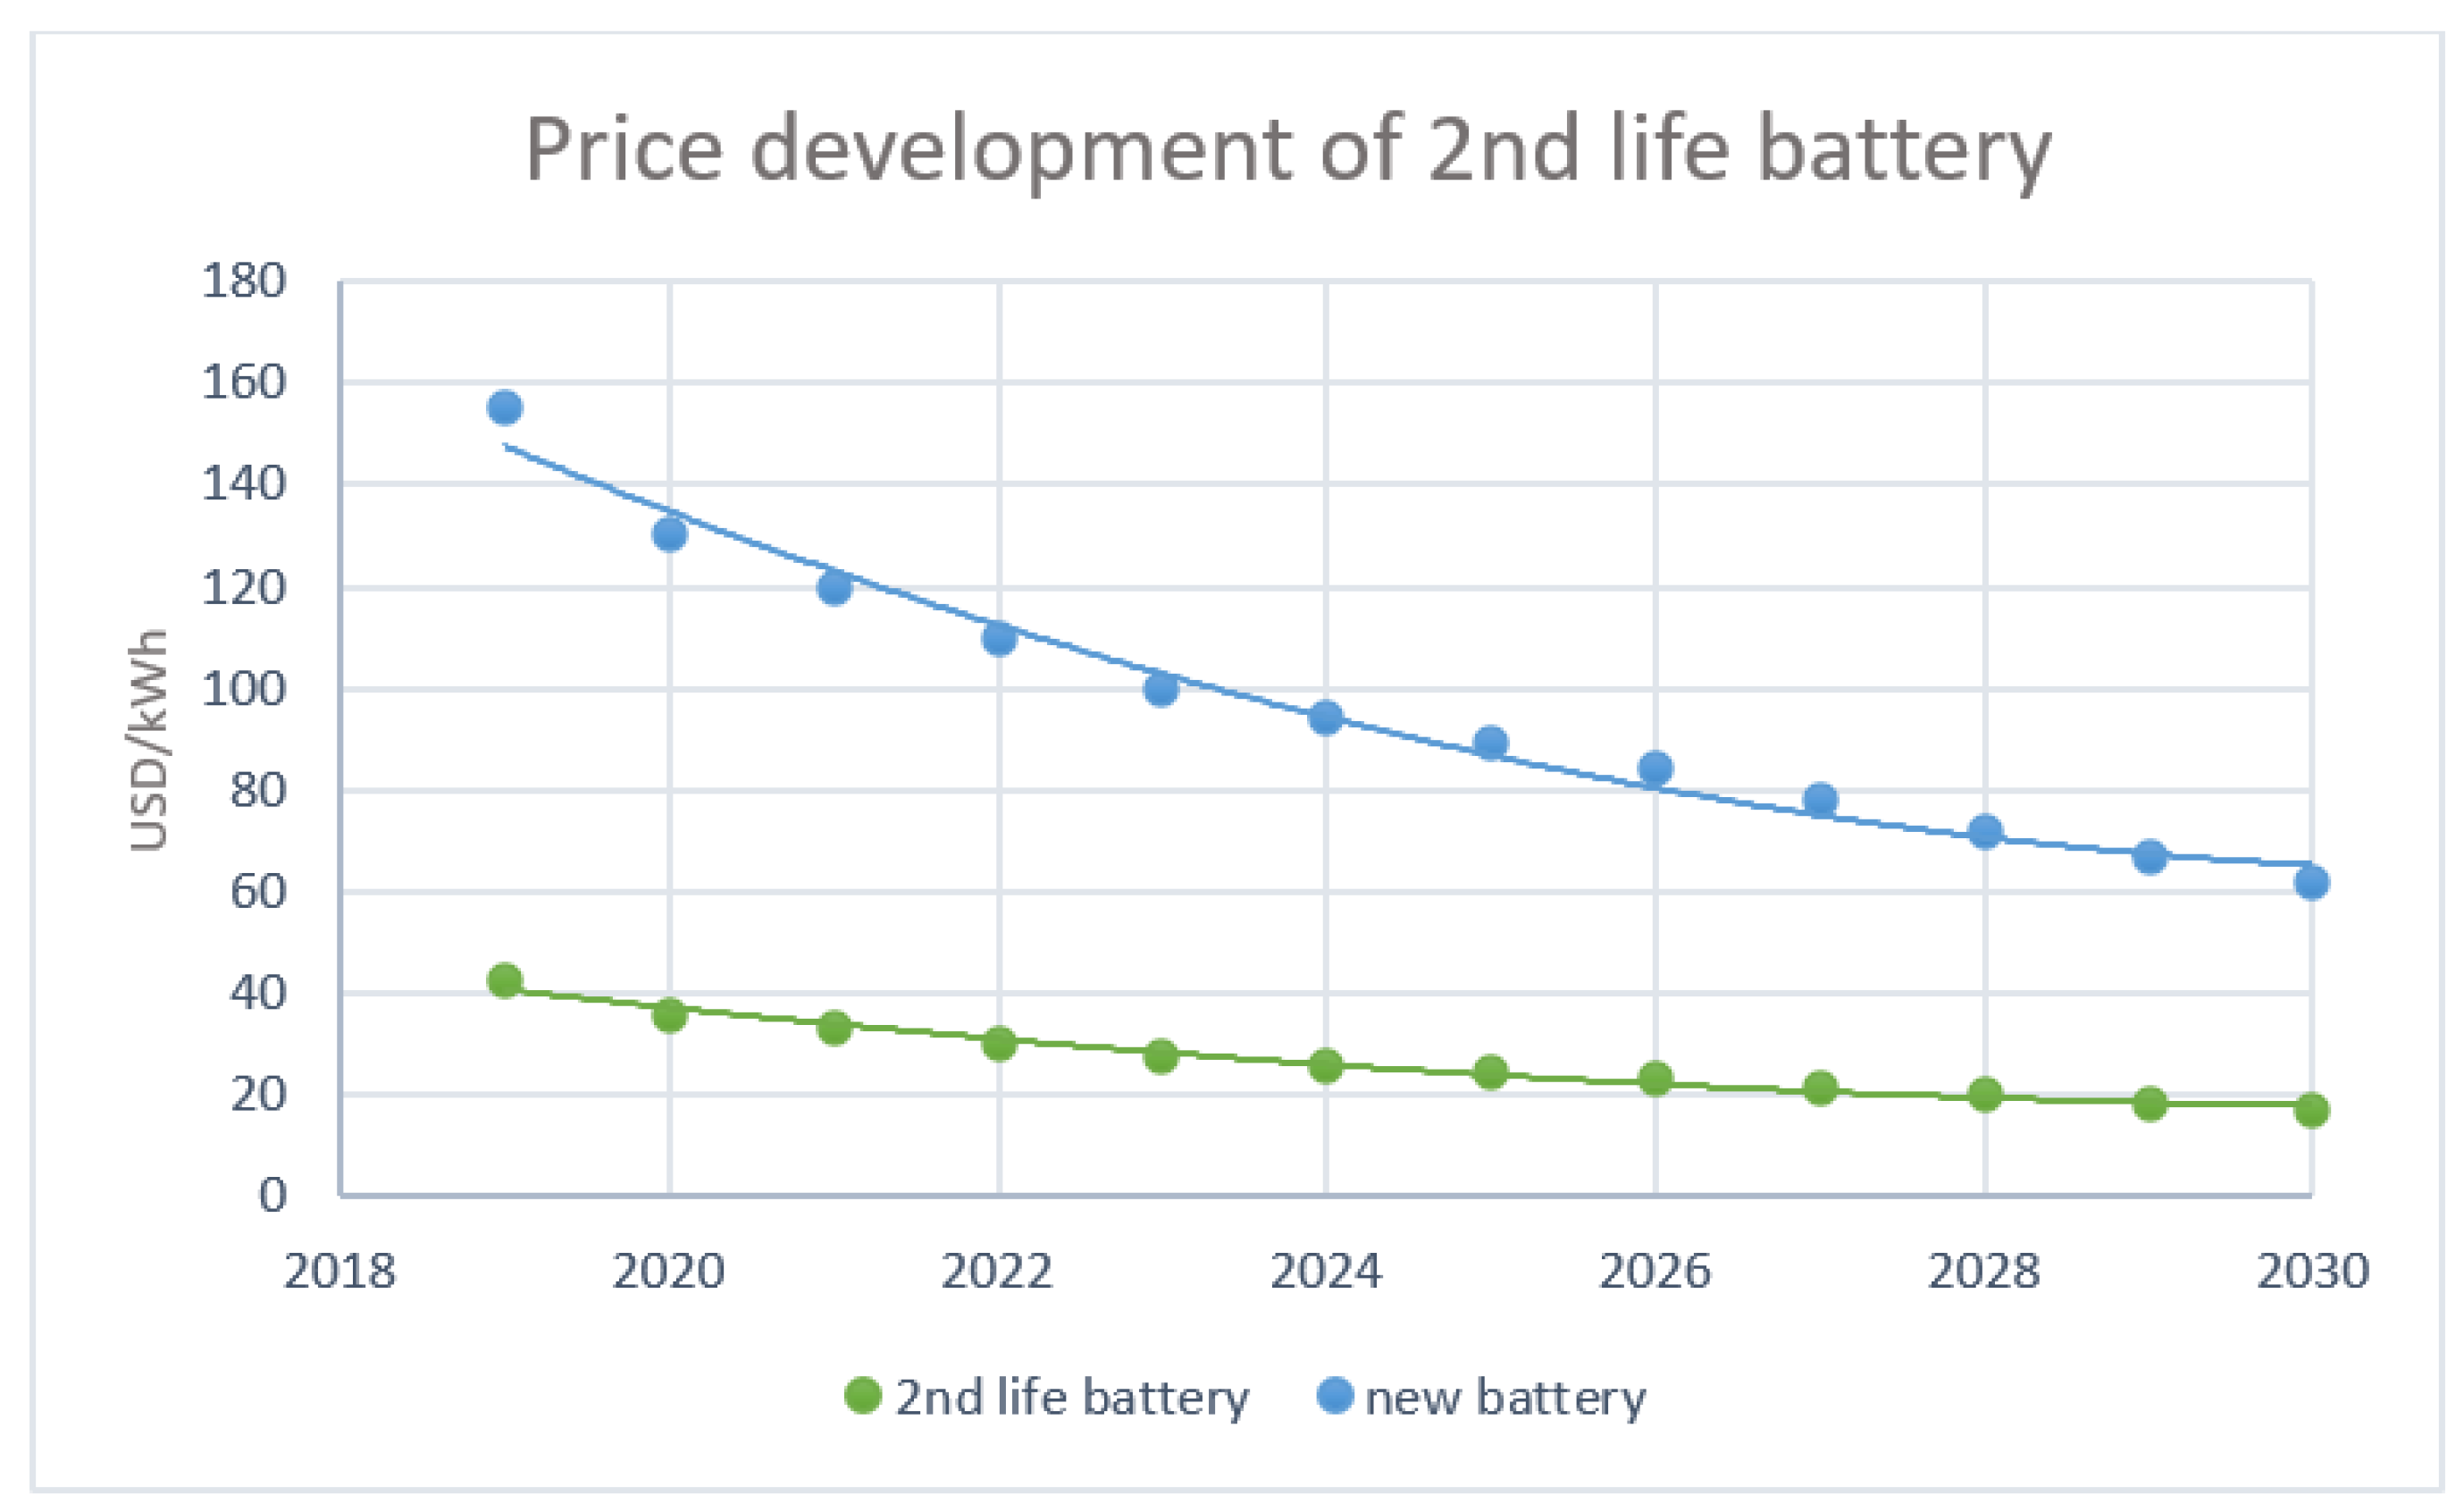
Table 6 and the approximate price development of 2nd life batteries can be seen in Figure 4. Calculations of values cannot be documented in detail in this article, as the calculation was performed in MS Excel software and works with many values and functions. The main task on which the article focuses is to point out the possibility of secondary use of batteries from EVs and this computational model serves as a simulation of possible economic costs in the case of its application.
When using the above calculation to evaluate the 2nd life of the battery, the resulting price changes the most depending on the change in electricity consumption of the vehicle and the total mileage. If you increase consumption by, for example, 4 kWh/100 km and maintain a 100,000-km drive, the unit price of the battery will be reduced to USD 31. However, it should be noted that in this case, the number of remaining cycles for the secondary application of the battery also decreases at a lower cost. A lower number of 2nd life battery cycles can increase the overall cost of the investment, due to more frequent replacement of battery modules and expensive transportation of lithium batteries. The specific values are shown in Table 7.
Other important results-sensitive parameters include the demand coefficient of the batteries used. This coefficient could be determined by a very costly market analysis through direct research. For this reason, it is more appropriate to use only sensitivity analysis (see Figure 5).
Currently, the demand coefficient cannot be determined unambiguously. However, it can be expected to be higher due to the versatile use of lithium batteries. Demand for used lithium batteries in the future can easily reach up to 75%. With the condition 10% smaller (larger), the unit price of the 2nd life battery changed by 5.7 USD/kWh in 2019 and in 2029 it will change by 2.3 USD/kWh accordingly. On the contrary, the smallest dependence was found during the calculation on the selected DoD and charging voltage to evaluate the 2nd life battery. For example, when the DoD changed from 40% to 70%, the price of the battery decreased by approximately USD 1/kWh in 2019 and by less than half a dollar in 2029.
The above-calculated value of the 2nd life battery is the price only for the battery itself. For the calculation model, it is necessary to determine other expenses associated with the battery removed from the vehicle, testing, repair or transport. It will be assumed that most of these tasks can be done in an authorized service of the car company, where the hourly rate of the employee is €50–70 [24]. The first service task corresponds to the actual removal of the battery from the vehicle. It takes approximately 3 h to completely replace the battery of a mid-size vehicle (Nissan Leaf) [25]. From this, it can be deduced that the removal itself will take 90 min. Subsequently, it is necessary to connect the battery to the diagnostic devices and to replace the faulty battery cells. With freely available materials, it is not possible to determine how many cells will need to be replaced to ensure trouble-free reusability. Various analyses show a range from 0.001% to 10% [26]. The 5% variant was chosen for this model. The price of one battery cell was set at EUR 72 per one piece using the portal ev-power.eu. Connection, disconnection and evaluation take 90 min [27]. It takes approximately 18 h to disassemble and reassemble the entire battery [26]. From this number, it can be estimated that it will take a minimum of 1 h and a maximum of 18 h to disassemble approximately 5% of the battery. The middle value that was chosen is 9 h. Packing and manipulation of the battery takes about 45 min for the worker [26]. In total, it will be necessary to spend 12.75 h of work on one battery. Lithium batteries belong to the class of dangerous goods number 9—other dangerous substances and objects. This is mainly due to the possibility of the battery igniting spontaneously due to physical damage. For this reason, transporting these batteries is more expensive than with other components needed for battery storage. After a telephone consultation with Chemtrec, an approximate mileage rate for a 500-kg lithium battery was found. For this calculation, the value has been reduced to €1.25 per km, as a 43 kWh battery weighing approximately 250 kg is expected to be used. The road from Bratislava to Banska Bystrica with a length of 208 km was chosen as the average distance for battery transport in the Slovak Republic. Preparing for shipment takes about 0.75 h for the service worker [26].

3.2. FCP Automatic Frequency Control Process

The main financial income of the model will be the regular payment for the provision of support services (PSS) that are leased by the Czech Electricity Transmission System (CETS). The process of automatic frequency control is a local automatic function, consisting of a precisely defined change in the power of the unit depending on the deviation of the frequency from the set value. A model of annual and multiannual contracts is applied, which are more economically stable than weekly or daily. The annual payment consists of the estimated number of hours of availability and the hourly price of the reservation. In recent years, the price of the reservation has decreased, from 54.45 (2013) to 41.12 EUR/MW/h (2020) [28,29]. The biggest share in the change in valuation has the growing competition in the field of PSS and the arrival of battery storage. For example, in Slovakia, the definition of battery storage in the field of power engineering is not yet fully implemented, but a change is expected in the coming years, specifically in the form of the ELSEA project, which aims to build the largest battery storage in Central Europe [30]. Construction should start as early as 2023 and the last station of the project should be put into operation in 2033. For this reason, the price of the FCP will continue to fall. The lower value of the overflow can be tentatively determined using available data from neighboring countries where battery storage is already used for system services. This model works with the lower limit of the reservation price of 8.5 EUR/MW/h (225 CZK), which was determined using values from Austria [31]. The prices of FCP services used in the model work with three possible development scenarios (see Figure 6).
An obvious break in the process occurs in 2030 when the price reaches the lower limit of 8.5 EUR/MW/h (225 CZK) and the process is still constant. Today, it is not possible to accurately predict the process of development, so two other scenarios work with the lower limit of 4.43 EUR (116 CZK) and 12.80 EUR (335 CZK).

3.3. Balancing Market

Another source of revenue for the battery storage operator may be the trade-in regulated energy through the balancing market. The market closes 30 min before the actual delivery and the minimum traded quantity is 1 MW with a resolution of one decimal place (e.g., 3.4 MW). In order for a closed deal to be advantageous in terms of battery wear, it was necessary to calculate the minimum price using the share of all eligible costs associated with the 2nd life battery and the number of remaining battery cycles. The complete calculation was performed in the MS EXCEL 2019 software. The final price after rounding was 74.5 EUR/MWh. To obtain the number of annual trades, it was necessary to analyze the prices of positive and negative regulatory energy in the balancing market over the last 5 years. It was necessary not only to filter low prices but also successive stores. This means that if the battery storage supplies energy at hour H, it can no longer supply H + 1 or H + 2 on the same day. The resulting revenues for 2020 depending on the free commercial capacity of the repository can be seen in Table 8.
To increase the informative value of the model, three possible scenarios of the development of revenues from regulatory energy in the balancing market were again determined. The middle scenario copies the already mentioned growth of power energy prices, i.e., an annual growth of 3.1%. The low scenario assumes increasing competition, therefore it assumes an annual decrease of 3.1% and the high scenario assumes an annual growth of 6.2% due to the increasing need for regulatory energy.

3.4. Important Investment Equipment

For the proper functioning of the battery storage, not only the batteries themselves are needed but also a substantial number of other devices. These are mainly DC/AC inverters, SCADA remote control system, transformers, storage containers and air conditioning. In the case of small repositories at dealers, it is necessary to include the fast charging station. For the batteries to be connected to the power system, their DC/AC inverters must first be used to change the nature of their energy from DC to AC. A modern three-phase inverter with an output of 50 kW from the manufacturer Kaco, whose supplies, including an integrated control system, was chosen for this calculation model. It can be connected to the superior system of the entire dispatching via USB or LAN port. The device is stored in a separate cabinet measuring 140 cm × 84 cm × 36 cm, which can be placed inside or outside the universal container. According to [32] the market price was set at €3696. Universal storage containers were selected using the company Algeco s.r.o., which builds modular buildings in the Czech Republic with a variety of uses. Two options were considered for this model. The first larger container with dimensions 601 cm × 244 cm × 260 cm for the price of €2900. The basic electrical installation, including the switchboard, costs €192, air conditioning €958 and fire protection, including fire alarm, approximately €3300. Approximately 28 batteries can be accommodated in this container so that there are sufficient gaps between the batteries for airflow and space remains even for a small background for air conditioning, server and computer. The second smaller container with dimensions of 299 cm × 244 cm × 260 cm for the price of €1920. The price of electrical installation and air conditioning remains the same, only fire protection costs less—about €2000. Professional installation of batteries and the connection of other devices inside the battery storage was evaluated using the hourly rate of installation on electrical equipment for 13 EUR/hour [33]. It will take approximately 1 h to install one battery and about 24 h to install the entire container, including inverters and support devices.
The small, decentralized battery storage will belong to the subcategory of production modules A2 (up to 100 kV) or the subcategory B1 (up to 1 MW). All manufacturers from category A2 are connected directly to low voltage. For B1, it depends on the local conditions of the distribution network, and this source can also be connected to low voltage. Due to this, it will not be necessary to install an expensive transformer at the expense of the car company. In the case of a large central repository, the installed capacity will certainly exceed 1 MW, due to which it will fall into the subcategory of production modules B2. This category is only connected to high voltage lines. For direct connection to the mains, it is necessary to change the low voltage inside the device (400 V) to a high voltage (22 kV). Transformers from RTS a.s. with an output of 1000 kVA costs €13,700, including installation. Regular annual inspection and maintenance cost €420, while as part of the simplification of the model, it is paid once during the procurement.
According to the Code, PSS certification is performed regularly at a time interval of 4 years. When determining the price of FCP certification as battery storage, it was found that there is no exact price list for any company yet. However, one of the interviewed experts set the price at €1950.
The fast-charging station was selected to have a communication interface for remote management and to be suitable for public use. The second condition would allow for the drawing of procurement subsidies from the European Union up to 55% of eligible costs. The EVlink Parking station charging station with an output of 2 × 22 kW was chosen for this model. This station is compatible with the Smart EV box, which will allow continuous management of the charging station with the possibility of optimizing the maximum power consumption. According to [34,35], the price including the Smart EV box was set at €4620. The photovoltaic power plant will not be included in the calculation model due to the small installation area on the universal container. It is not easy to determine the potential of this power plant without specifying a predetermined location and thus appropriately assess the price of its energy production.
To ensure trouble-free and reliable operation of the battery system, it is necessary to set up a continuous control dispatching center. The dispatcher will monitor and manage the capacity of the batteries and, in case there is a problem, immediately contact ČEPS. Besides, he will be in charge of shops with free battery capacity in the balancing market and will be involved in the creation of operational preparation. In order to ensure continuous operation and comfort of the operator, it is necessary to hire at least five dispatchers, who will alternate in a 12-h shift. The annual cost per dispatcher was set at €36,000. A simple SCADA system was chosen as the dispatching system, which will control the individual devices using an industrial computer located in the container. The SCADA program was very tentatively priced by the Control System company to €9500. The industrial PC was chosen from Advantech for €490. Although the control system can theoretically be controlled online from anywhere, permanent physical dispatching must also be considered. Therefore, the item office rental appears in the calculation, which was calculated using the unit rental price in Prague (€15 per square meter). The required area was set at 60 square meters to ensure the comfort of five workers. The model also works with a computer system cost of €770 per piece for each dispatcher.

3.5. Large Battery Storage Strategy from 2nd Life Batteries

Large battery storages are already being built both in the Czech Republic and in Slovakia. As a result, supplier companies offer components directly for this application and no costly technological development is required. This fact can be used by the automotive company, which takes over the technology from the suppliers and itself supplies the 2nd life battery. It is obvious from the above chapters that their batteries will significantly reduce the size of the total investment. On the contrary, more frequent battery replacement must be considered, which entails additional costs during operation. However, the cyclic change of batteries during the entire life of the device can also be used for the benefit of the car manufacturer. Depending on the energy market, it may regularly reduce or increase its storage capacity. The entered change in the number of batteries is always due to the default investment. On the contrary, the increase in connected power is based on the last known change. The input investments and parameters of the computational model are given in Table 9 and Table 10.
The main input parameter is the total number of 2nd life batteries used for this application. From this value, the investment costs for the batteries, the number of containers required to store the batteries and the total available commercial capacity of the device was calculated using the current price of the 2nd life battery. The device must have a sufficiently sized network connection to work properly. Therefore, as a second parameter, the user selects the connected power, which allows the two-way transfer of energy from the device to the power system. After that model calculates the investment costs for inverters and transformers. To increase the stability of the control power supply, the model of the transformer considers the required number of N + 1 transformers. During the regular replacement of the batteries, the number of batteries can be operatively increased or decreased, or the connected power can be increased. The last parameter chosen by the user is the discount, which is used to calculate the value of the financial indicator net present value (NPV).
The computational model itself optimizes the amount of FCP service offered. It uses a series of conditions that work with connected power and trading capacity. It always strives to make the provision of PSS the primary source. This means that it will only transfer excess and unused capacity in the balancing market. From the series of conditions for offering FCP service, it is necessary to mention the interval of offering FCR from 3 to 5 MW, sufficiently dimensioned connected to power and sufficient commercial capacity to provide mutual FCP service. The balancing market will use the remaining trading capacity, only in case that several conditions are met. As an example, the condition of a minimum offered power may be 1 MW or a sufficiently dimensioned connected power. The model does not work with a direct dependence of revenues from the balancing market on free trading capacity but corrects the amount of traded energy based on the analysis of historical data of the balancing market. After generating financial flows from investing activities, the model calculates the amount of depreciation for determining the tax base. Depreciation is linear and the economic life was determined as follows: battery 5 years, inverter 15 years, universal container 15 years, transformer 15 years, dispatching 15 years and charging station 15 years. Operating cash flows other than electricity expenditures are not dependent on input parameters. These are personnel expenses and office rental. The electricity consumed was calculated using the number of positive energies sold on the balancing market and the air conditioning’s consumption. Due to the climate in the Czech Republic and Slovakia, the model assumed an annual use of air conditioning of 2232 h (6 months—12 h per day). Power consumption was set at 1500 W. As part of the refinement of the results, three scenarios of revenues from the provision of regulatory energy were worked on. For this reason, we also work with three scenarios of the tax base and subsequently with three scenarios of higher tax. Here, the model recognized whether the amount of depreciation is not higher than the tax base. After that, the model calculated the cash flows for each year and determined the NPV.
For this economic analysis, the entered parameters were calculated using the software Solver in MS Excel so that the resulting NPV was maximized. An evolutionary algorithm with several constraint conditions based on the above assumptions was used. Output investments and parameters can be seen in Table 11 and Table 12.
According to the calculation model, the NPV for this strategy came out in two positive values out of the three scenarios (see Table 13). Based on the definition of a positive NPV, it can be concluded that this investment can be recommended and implemented.

Sensitivity Analysis of Large Battery Storage Strategy

The first sensitivity analysis shows the dependence of the best found NPV on the number of batteries installed in 2021 (see Figure 7). This analysis assumed that there was no certain number of 2nd life batteries in 2021. For this reason, the automotive company should have an idea of how much it will pay to invest in storage. To find the best NPV value of all sensitivity analyzes, the Solver in MS Excel was used, limiting the time to find the best result up to 45 s.
In all three scenarios, the NPV reached a maximum of around 700 installed batteries in 2021. This is a relatively high number for which it is not clear whether the market will offer so many batteries. For possible decision-making, it was recommended to use a medium scenario, which reached a non-negative NPV of 370 installed batteries in 2021.
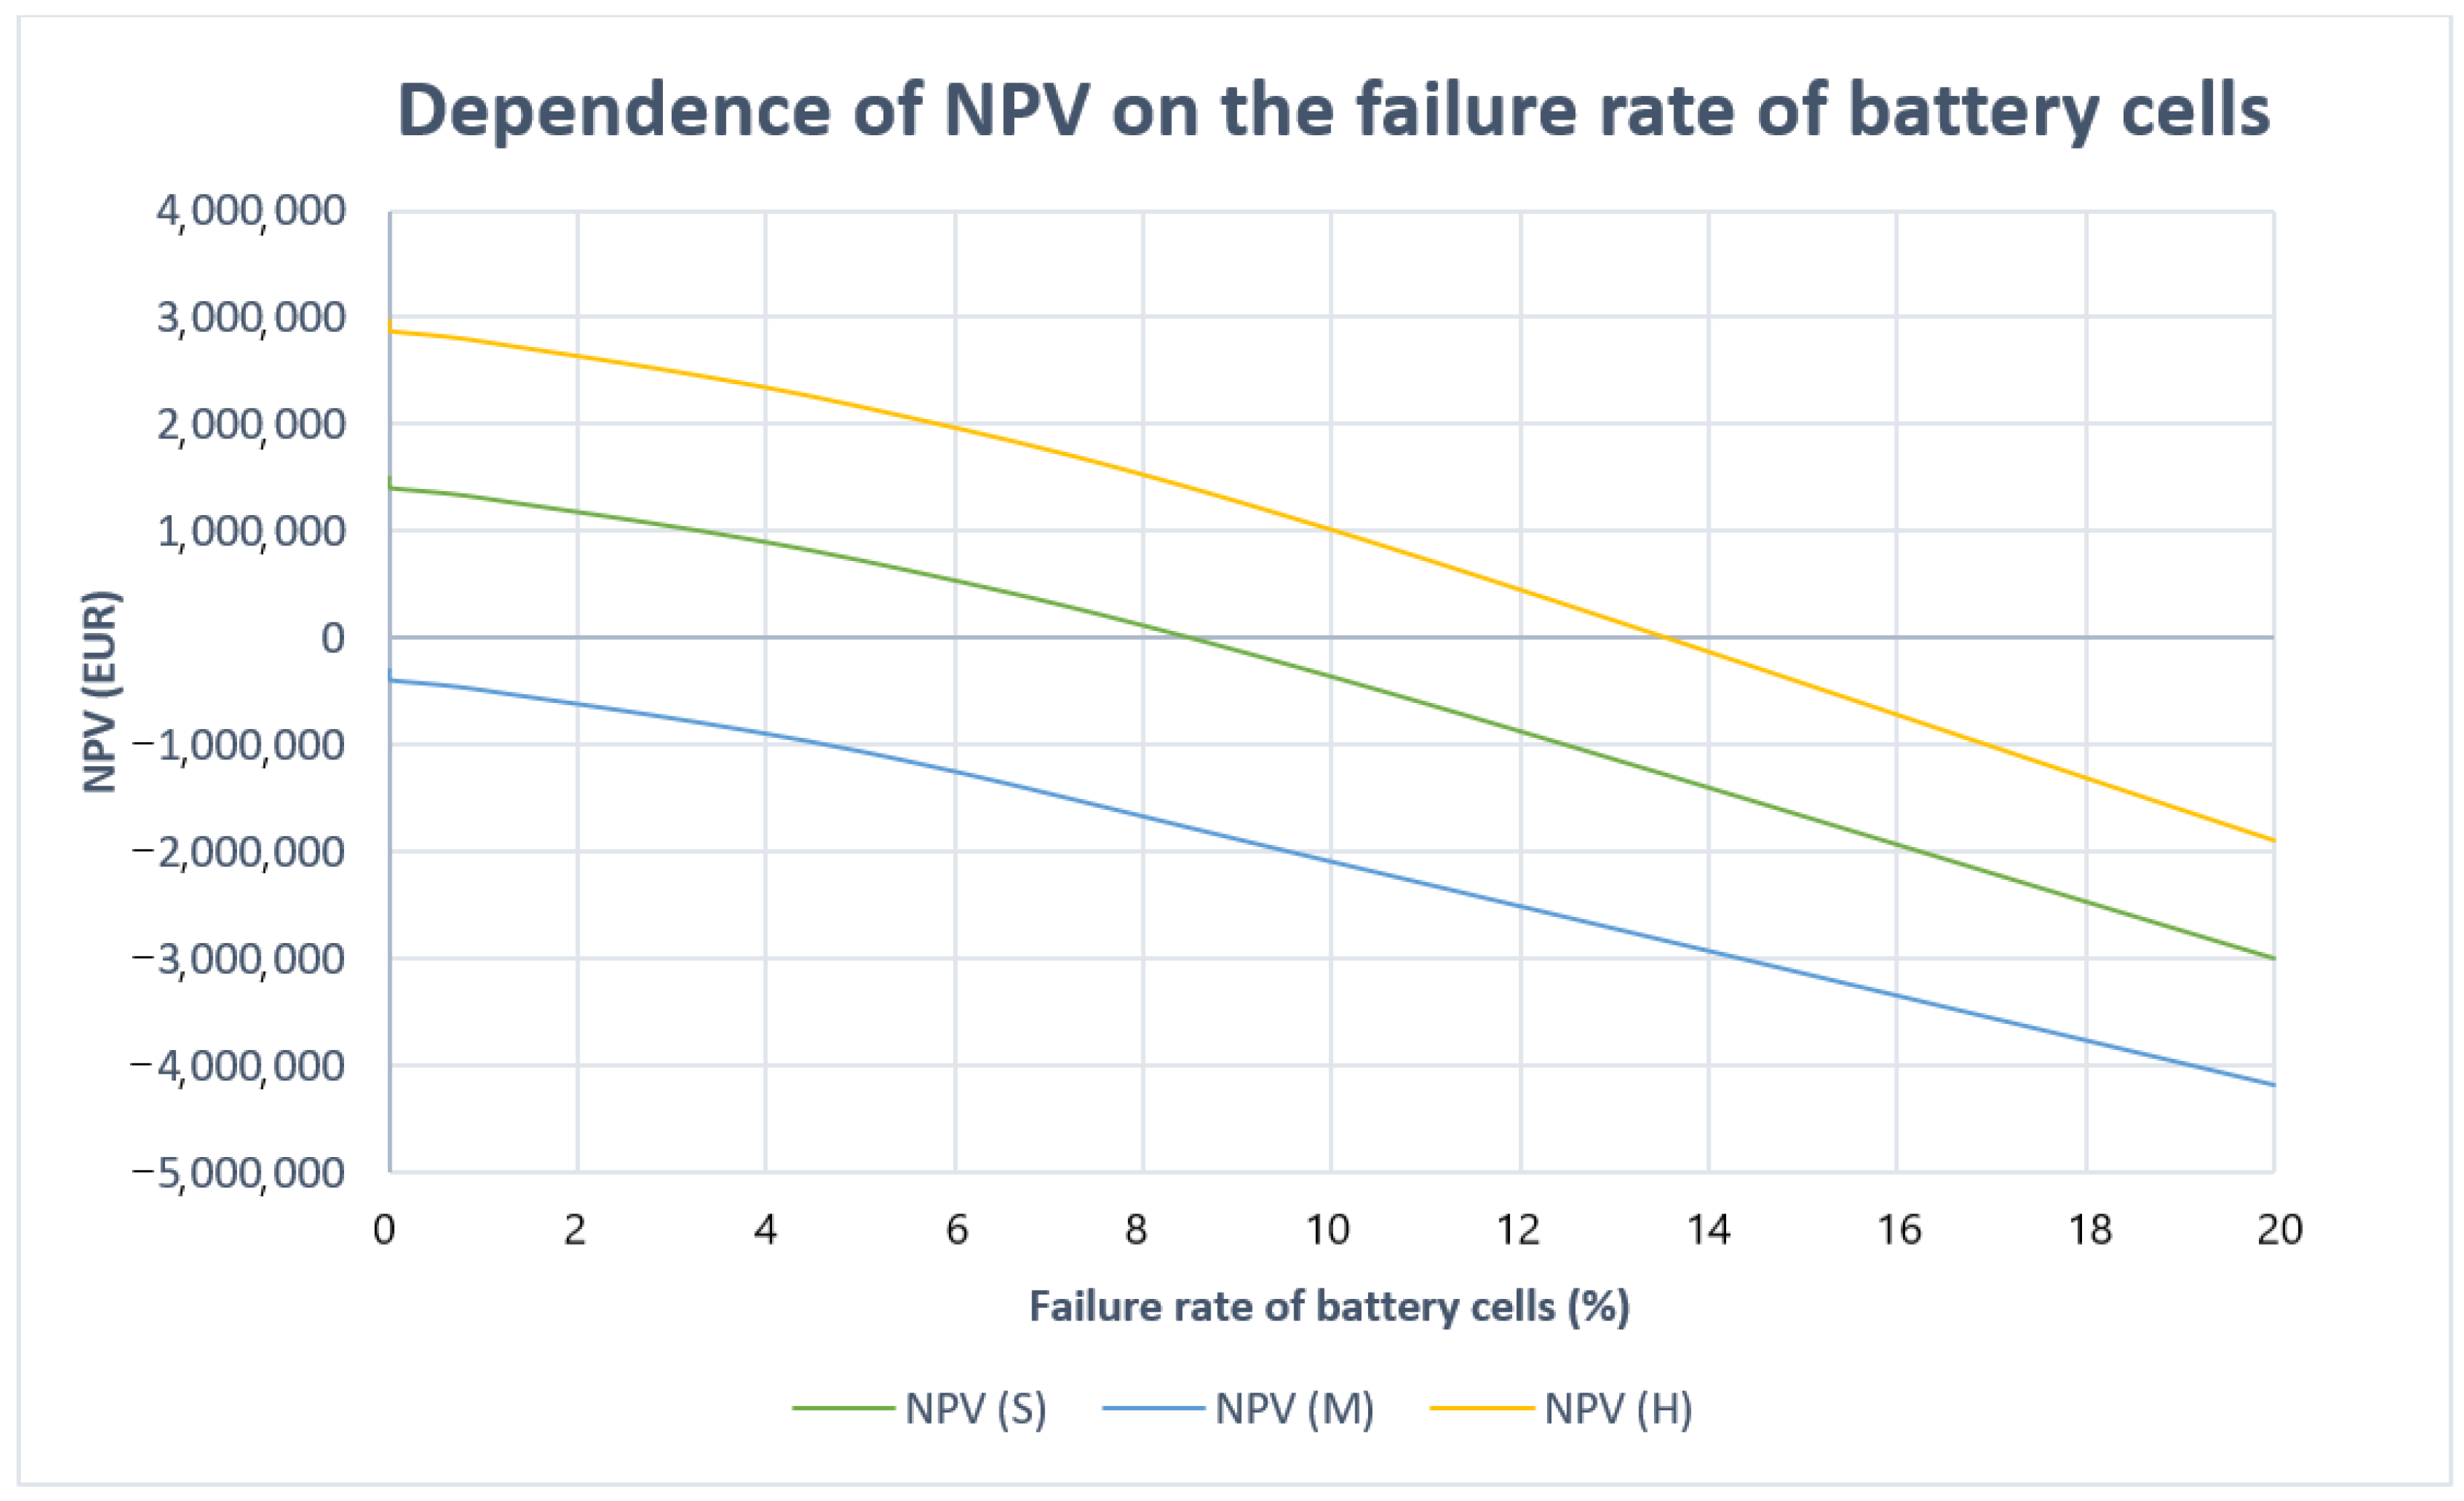
Another important analysis was the dependence of NPV on the failure rate of battery cells (see Figure 8). Currently, it is known exactly how much service 2nd life batteries will need. However, today’s literature estimates that the failure rate of battery cells should be no more than tenths of a percent.

3.6. Small Battery Storage Strategy from 2nd Life Batteries

Every major automotive company has its network of authorized dealerships. There is no difference in the Czech Republic, where, for example, ŠKODA AUTO has approximately 190 branches. That is why a strategy of small battery storage, which places small storage in selected dealerships, were used. Of course, each dealer must first agree to the project because the repository will be installed on their land. In return, the car manufacturer will also build a fast-charging station as part of the project. It will serve not only the public but also the dealers themselves, who will always have one socket reserved for the needs of selling or servicing EVs. It can also be stated that in the case of the construction of a fast-charging station in the vicinity of the store, the demand for EVs will most likely increase.
The main input parameters of this strategy are the number of dealers and the number of 2nd life batteries in individual installations (see Table 14). Input parameters are shown in Table 15. By multiplying these two values, the total number of used batteries can be determined, and all investment costs associated with them. Furthermore, it is assumed that the 2nd life batteries will come from individual local dealerships, so the transport of 2nd life batteries to the storage location was not considered. The number of dealerships themselves was used to calculate the investment costs for universal containers, fast-charging stations, and inverters.
In this model, the power of the inverters was entered directly as an input parameter, mainly due to the possibility of connecting the storage to the low-voltage distribution network. The distribution system operator has different requirements for maximum power connectable to its networks, to which it is appropriate to adapt the model. As a result, in this strategy, it is not necessary to build transformers at the expense of the automotive company.
Another new input parameter is the central reservation. This value determines what percentage of the total usable capacity of individual devices will be used for centrally controlled dispatching for the provision of regulated energy. The remaining part of the capacity will be used for the needs of the fast-charging station, which should have sufficient capacity to charge at least one electric vehicle from batteries only.
The fast-charging station itself plays a significant economic role in this strategy. This is not the investment in the facility itself, but rather the costs and revenues from its operation. For this reason, it was decided to consider three possible scenarios again. In the first small scenario, it will be assumed that all operating costs will cover operating income (not the investment itself). The medium and high scenario is based on predictions of the low and medium scenario of the development of the number of EVs and charging stations from the source [36]. Calculation of revenues and costs of the charging station and the introduction of some parameters was inspired based on [37,38]. Specifically, the following values were taken: the average annual mileage of the EV owner 13,000 km and the utilization coefficient of the public AC station 20%. Furthermore, to determine the yield, the number of charges at one public charging station per year was calculated concerning the total number of EVs and the total number of public charging stations. In the last phase of determining the yield, the time spent by one vehicle at the charging station (with an average battery capacity of 43 kWh) was calculated and multiplied by the selected charging price from the input parameters. The operating costs of the charging station and the revenues are based on the number of charges at one public charging station. However, this time a simplification has been introduced so that the costs will be the same for the medium and high scenarios. Using the number of charges per year and the average battery capacity, the amount of electricity consumed was determined. The distribution tariff for EV c27d on a 3 × 32 A circuit breaker from Czech energy plants (CEZ) was chosen. This tariff has an 8-h (night) low rate, which charges the battery in the storage, from which the next day will primarily draw energy to EVs. Other calculation procedures are like the previous strategy. The output parameters of this strategy can be seen in Table 16 and Table 17.
Additionally, in this strategy, in two out of three scenarios, NPV acquires positive values (see Table 18).

Sensitivity Analysis of Small Battery Storage Strategy

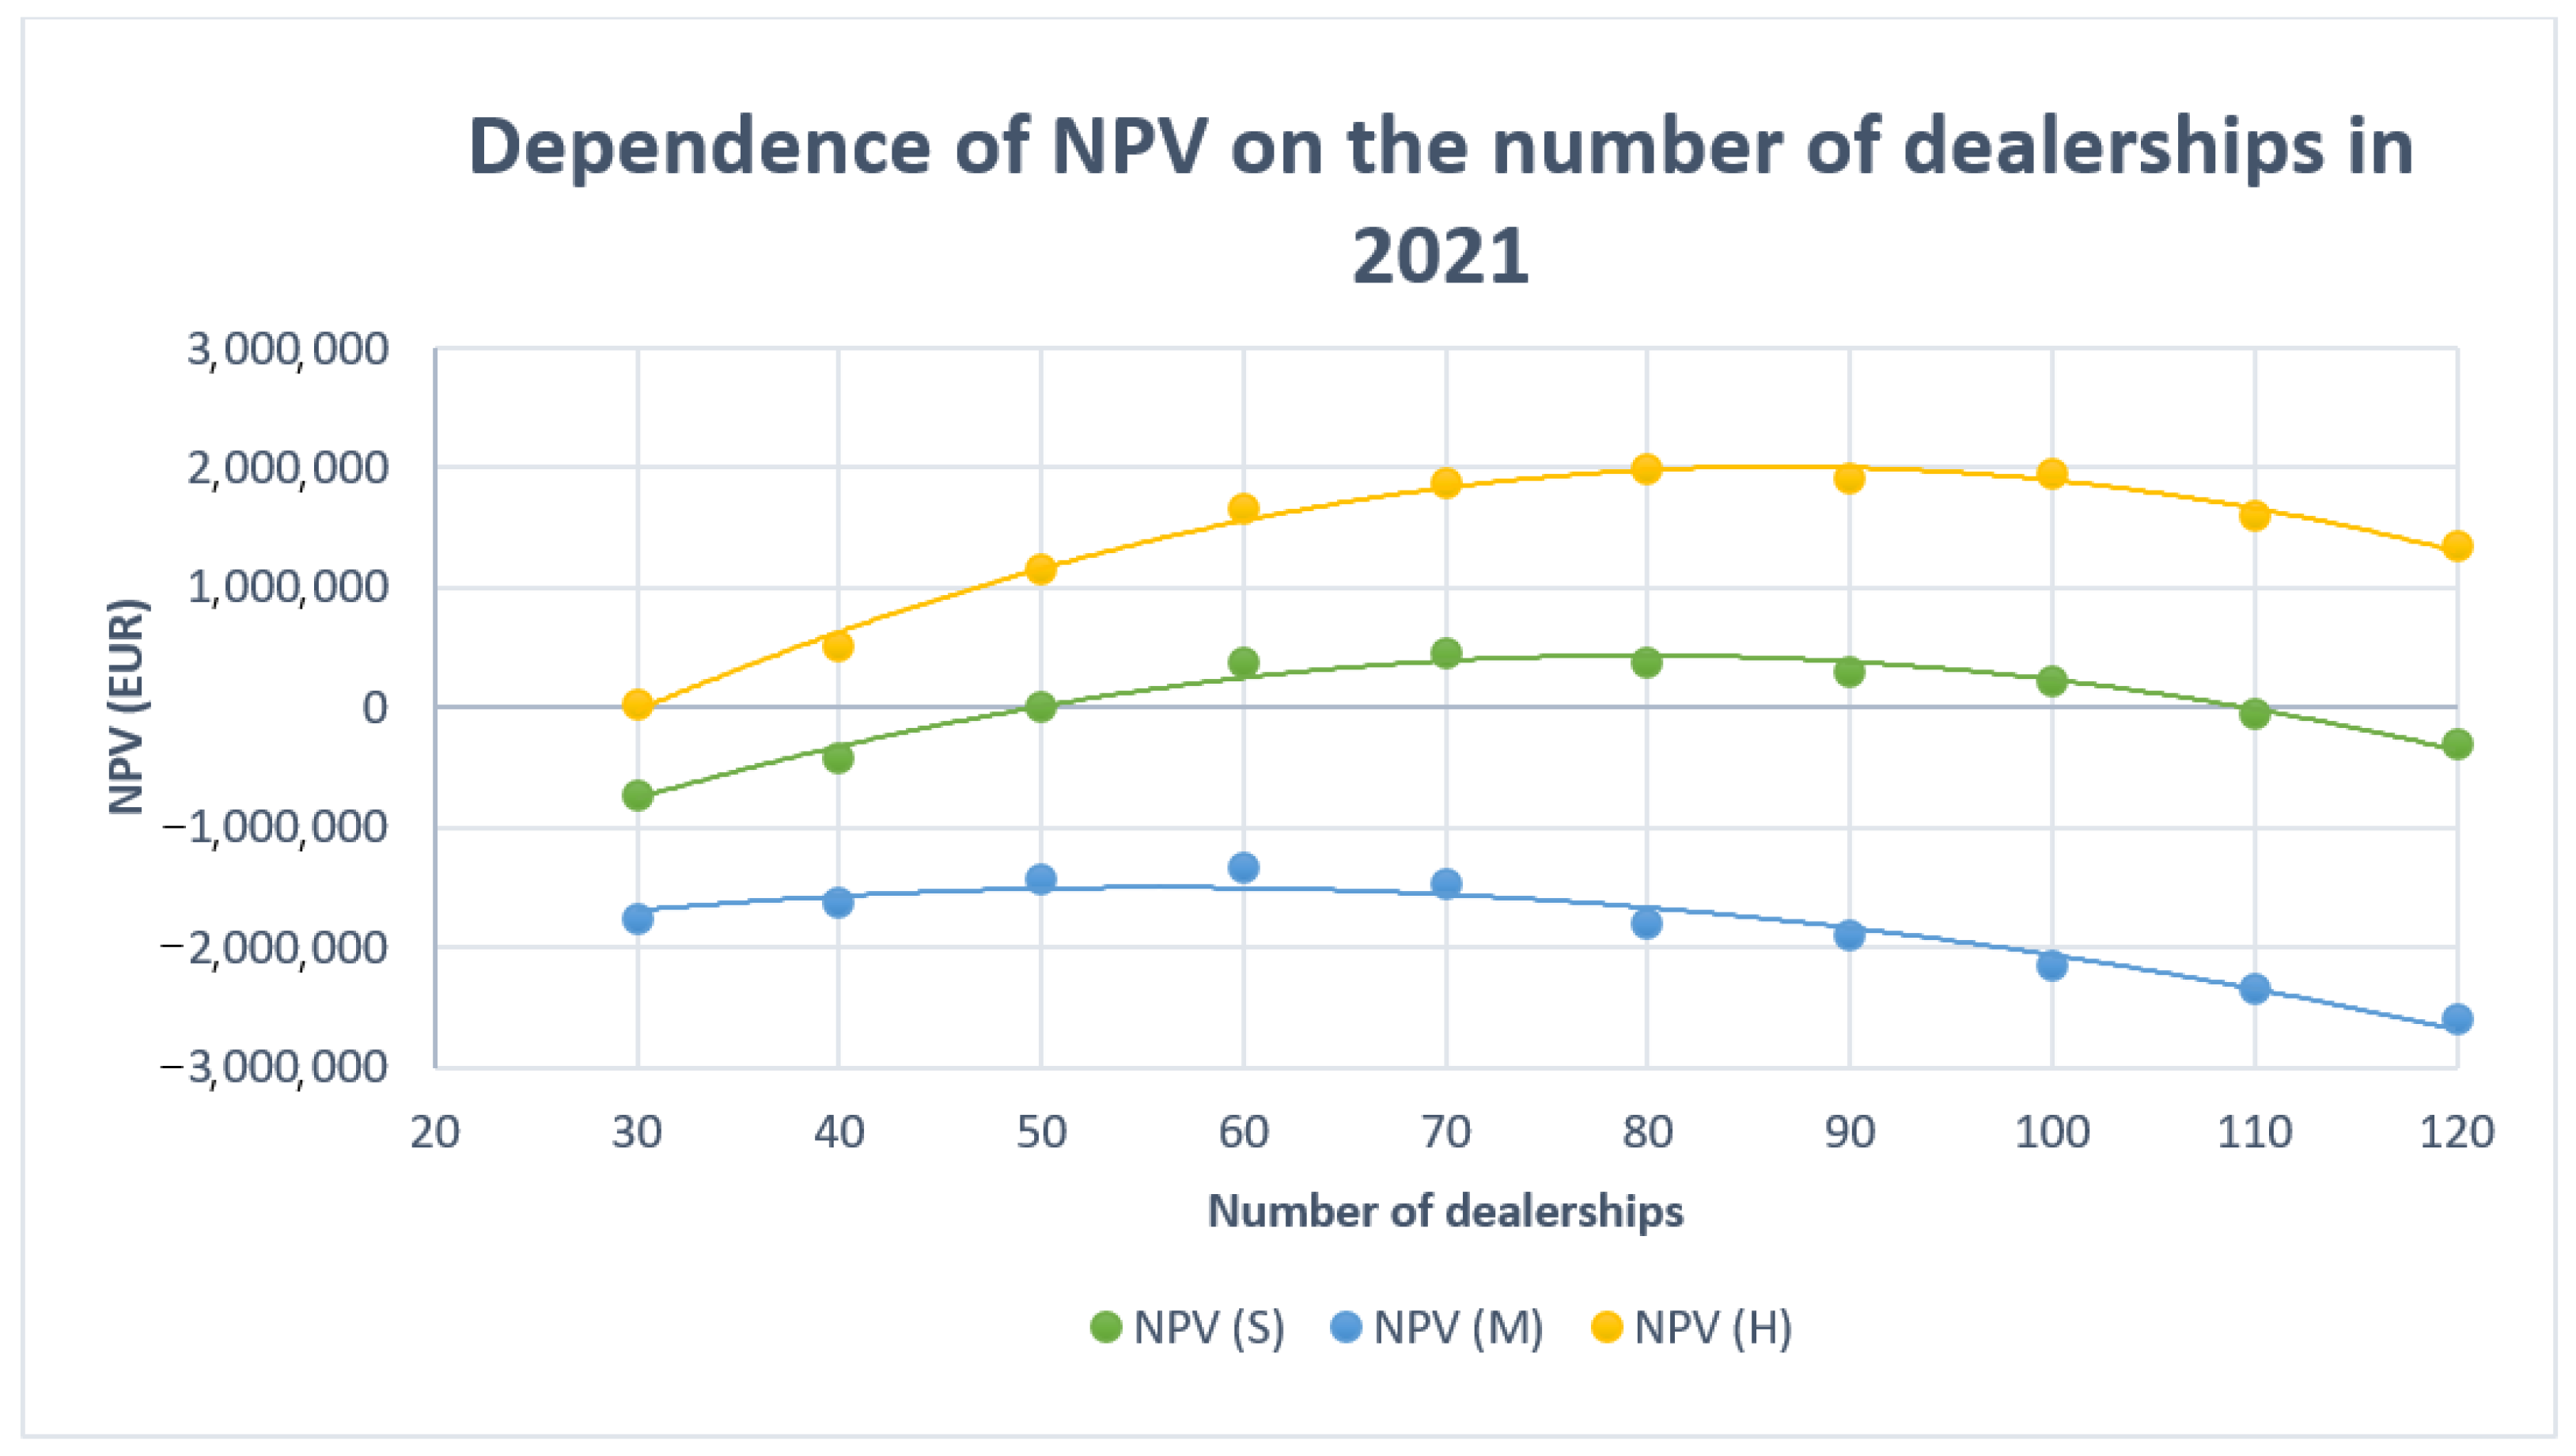
The dependence of the best-found value of NPV on the number of dealerships in 2021 was chosen as the first sensitivity analysis in this strategy. Most car companies have a great influence on what is happening in the dealership. However, they cannot order them to install a “foreign” facility on their land, from which they will not benefit financially. Therefore, for the right investment decision-making, it is necessary to examine the dependence of the initial number of dealerships in 2021 on the NPV.
From Figure 9 it is clear that the right choice of the number of dealerships for this strategy will be crucial for the success of the project. In all three scenarios, the course has the shape of a concave function, which reaches a maximum in values from 60 to 90 dealerships. For the final decision, it is again appropriate to use the middle scenario, which in this case acquires positive values in the range from 50 to 110 dealerships in 2021.
The second sensitivity analysis shows the dependence of the best found NPV on the connected power, which may be limited by the distribution system operator due to the insufficiently dimensioned network (see Figure 10). Therefore, it is appropriate to know the impact of the change in connected power on the NPV before implementation.
When choosing a medium scenario, the NPV strategy achieves positive values only when choosing a power of 100, 150, 200 or 250 kW. Furthermore, the values were negative, mainly due to the limited size of the container located at the dealer and the expensive 50 kW inverter.

4. Conclusions

  • For 2020, 2025 and 2030, the values were calculated at EUR 30, 21 and 14.50 per kWh.
  • In the case of large battery storage, the highest NPV of the middle scenario was €916,300 using 710 batteries from electric vehicles.
  • In the second strategy, the best NPV of the same scenario was only €649,469 using a total of 755 batteries.
  • Both strategies are profitable at the given parameters.
Unfortunately, it is not possible to implement both mentioned strategies at the same time, either due to the initial shortage of 2nd life batteries or the subsequent competitive struggle between projects. Based on the obtained results, a large repository strategy can be recommended for implementation, mainly due to higher profits and lower investment costs. It is also a good idea to consider a smaller number of legislative and implementation assumptions when choosing this strategy. It would be good to postpone the strategy of several small repositories for 5–10 years and later it can be merged with the already functioning project of a large battery repository.
This analysis aimed to open a discussion on the possibilities of economically advantageous secondary use of batteries from EVs. These results offered possible solutions of technical progress associated with the development of electromobility meaningfully in the near future.

Author Contributions

Conceptualization, J.Ž., J.K. and L.L.; methodology, J.Ž. and J.K.; investigation, M.P., M.K. and L.L.; data analysis, J.K. and L.L.; writing—original draft preparation, J.K., M.K. and L.L.; writing—review and editing, M.P. All authors have read and agreed to the published version of the manuscript.

Funding

This paper was developed within the projects implementation: KEGA 009TUKE-4/2020 “Transfer of Digitization into Education in the Study Program Business Management and Economics”. And VEGA 1/0340/21 “The impact of a pandemic and the subsequent economic crisis on the development of digitization of enterprises and society in Slovakia”. This work was supported by the Slovak Research and Development Agency under the Contract no. APVV-19-0328.

Institutional Review Board Statement

Not applicable.

Informed Consent Statement

Not applicable.

Data Availability Statement

The data that support the findings of this study are available on request from the corresponding author.

Conflicts of Interest

The authors declare no conflict of interest.

References

  1. Ministry of Environment of the Slovak Republic. The Paris Agreement Is Already a Reality. Available online: https://www.minzp.sk/tlacovy-servis/tlacove-spravy/tlacove-spravy-2016/tlacove-spravy-oktober-2016/parizska-dohoda-vstupi-do-platnosti-piatok.html (accessed on 10 March 2021).
  2. Elliott, M.; Swan, L.G.; Dubarry, M.; Baure, G. Degradation of electric vehicle lithium-ion batteries in electricity grid services. J. Energy Storage 2020, 32, 101873. Available online: https://www.sciencedirect.com/science/article/abs/pii/S2352152X20317102?via%3Dihub (accessed on 10 March 2021). [CrossRef]
  3. Lachvajderová, L.; Kádárová, J. Emissions in Life Cycle of Electric Vehicle. Perner’s Contacts 2020, 15. Available online: https://pernerscontacts.upce.cz/index.php/perner/article/view/1626 (accessed on 10 March 2021).
  4. Hall, D.; Lutsey, N. Effects of Battery Manufacturing on Electric Vehicle Life-Cycle Greenhouse Gas Emissions. ICCT. 2018. Available online: https://theicct.org/sites/default/files/publications/EV-life-cycle-GHG_ICCT-Briefing_09022018_vF.pdf (accessed on 10 March 2021).
  5. Živčák, J.; Kádárová, J.; Puškár, M.; Kočišová, M.; Lachvajderová, L. Expected Impacts of the Massive Increase in Electric Vehicles in Slovakia. Appl. Sci. 2020, 10, 8945. Available online: https://www.mdpi.com/2076-3417/10/24/8945 (accessed on 11 March 2021).
  6. Wolf, P. An Economic Assessment of “Second Use” Lithium-Ion Batteries for Grid Support. In Proceedings of the 20th Australasian Universities Power Engineering Conference, Christchurch, New Zealand, 5–8 December 2010; pp. 1–6. Available online: https://ieeexplore.ieee.org/document/5710689?arnumber=5710689 (accessed on 15 April 2021).
  7. Torregrossa, D.; Boss, A.; Niederhäuser, E.L. Profitability of Second-Life Lithium-Ion Storage Devices for Smart Buildings. Institute for Applied Research into Energy Systems (ENERGY). 2018. Available online: https://www.iea-shc.org/Data/Sites/53/media/events/meeting-09/second-life_batteries_dresden_boss.pdf (accessed on 15 April 2021).
  8. Tianyi, M.; Xu, D.; Wei, M.; Wu, H.; He, X.; Zhang, Z.; Ma, D.; Liu, S.; Fan, B.; Lin, C.; et al. Study on lithium plating caused by inconsistent electrode decay rate during aging of traction batteries. Solid State Ion. 2020, 345, 115193. Available online: https://www.sciencedirect.com/science/article/abs/pii/S0167273819310033?via%3Dihub (accessed on 11 March 2021).
  9. Lachvajderová, L.; Kádárová, J. Analytical Comparison of Electric and Conventional Engines. Trends Innov. Approach. Bus. Process. 2020, 23, 38–44. Available online: https://tiabp2019.sk/_files/200000060-2fbec2fbee/Zbornik-TIABP-2020_final.pdf (accessed on 11 March 2021).
  10. Dilger, N.; Kaluza, A.; Kiesewetter, A.; Cerdas, F.; Blume, S.; Zellmer, S.; Herrmann, C. Definition and Reference Framework for Life Cycle Technologies in Life Cycle Engineering—A Case Study on All Solid State Traction Batteries. Procedia CIRP 2021, 98, 217–222. Available online: https://www.sciencedirect.com/science/article/pii/S2212827121000561?via%3Dihub (accessed on 11 March 2021). [CrossRef]
  11. Desarnaud, G. Second Life Batteries: A Sustainable Business Opportunity, Not a Conundrum. 2019. Available online: https://www.capgemini.com/2019/04/second-life-batteries-a-sustainable-business-opportunity-not-a-conundrum/ (accessed on 15 April 2021).
  12. Jiao, N.; Evans, S. Secondary use of Electric Vehicle Batteries and Potential Impacts on Business Models. J. Ind. Prod. Eng. 2016, 33, 1–7. Available online: https://www.tandfonline.com/doi/full/10.1080/21681015.2016.1172125 (accessed on 15 April 2021).
  13. Reinhardt, R.; Domingo, S.G.; García, B.A.; Christodoulou, I. Macro environmental analysis of the electric vehicle battery second use market. In Proceedings of the 14th International Conference European Energy Market (EEM), Dresden, Germany, 6–9 June 2017; pp. 1–6. Available online: https://ieeexplore.ieee.org/document/7982031 (accessed on 15 April 2021).
  14. Jiao, N. Second-Life Electric Vehicle Batteries 2019–2029. IDTechEx Research Report. 2018. Available online: https://www.idtechex.com/en/research-report/second-life-electric-vehicle-batteries-2019-2029/626 (accessed on 11 March 2021).
  15. Heymans, C.; Walker, S.B.; Young, S.B.; Fowler, M. Economic analysis of second use electric vehicle batteries for residential energy storage and load-levelling. Energy Policy 2014, 71, 22–30. Available online: https://www.sciencedirect.com/science/article/abs/pii/S0301421514002328?via%3Dihub (accessed on 15 April 2021). [CrossRef]
  16. Kuric, I.; Cisar, M.; Tlach, V.; Zajacko, I.; Gál, T.; Więcek, D. Technical diagnostics at the department of automation and production systems. Adv. Intell. Syst. Comput. 2019, 835, 474–484. [Google Scholar]
  17. Martinez-Laserna, E.; Gandiaga, I.; Sarasketa-Zabala, E.; Badeda, J.; Stroe, D.I.; Swierczynski, M.; Goikoetxea, A. Battery second life: Hype, hope or reality? A critical review of the state of the art. Renew. Sustain. Energy Rev. 2018, 93, 701–718. Available online: https://www.sciencedirect.com/science/article/abs/pii/S1364032118302491?via%3Dihub (accessed on 15 April 2021). [CrossRef]
  18. Goldie-Scot, L. A Behind the Scenes Take on Lithium-Ion Battery Prices. BloombergNEF. 2019. Available online: https://about.bnef.com/blog/behind-scenes-take-lithium-ion-battery-prices/ (accessed on 11 March 2021).
  19. Wenxin, M.; Li, H.; Chunpeng, Z.; Jinhua, S.; Quinsong, W. Numerical study on thermal characteristics comparison between charge and discharge process for lithium ion battery. Int. J. Heat Mass Transf. 2020, 162, 120319. Available online: https://www.sciencedirect.com/science/article/abs/pii/S0017931020332555?via%3Dihub (accessed on 12 March 2021).
  20. Lambert, F. Tesla Battery Degradation at Less Than 10% after over 160,000 Miles, According to Latest Data. Electrek. 2018. Available online: https://electrek.co/2018/04/14/tesla-battery-degradation-data/ (accessed on 12 March 2021).
  21. Larsen, M. Battery Capacity Loss Warranty Chart For 2016 30 kWh Nissan LEAF. InsideEVs. 2016. Available online: https://insideevs.com/news/326563/battery-capacity-loss-warranty-chart-for-2016-30-kwh-nissan-leaf/ (accessed on 12 March 2021).
  22. Neubauer, J.S.; Pesaran, A.; Williams, B.; Ferry, M.; Eyer, J. A Techno-Economic Analysis of PEV Battery Second Use: Repurposed-Battery Selling Price and Commercial and Industrial End-User Value. In Proceedings of the SAE World Congress and Exhibition, Detroit, MI, USA, 24–26 April 2012; Available online: https://www.nrel.gov/docs/fy12osti/53799.pdf (accessed on 12 March 2021).
  23. Damodaran, A. Discounted Cash Flow Valuation. Available online: http://pages.stern.nyu.edu/~adamodar/pdfiles/eqnotes/packet1a2pg.pdf (accessed on 14 March 2021).
  24. Škoda Auto. Price List of Services for ŠKODA Vehicles. Todos. 2021. Available online: https://www.todos.sk/komplexne-sluzby/cennik-autoservisu (accessed on 14 March 2021).
  25. Hanley, S. Nissan LEAF Replacement Battery Cost. CleanTechnica. 2017. Available online: https://cleantechnica.com/2017/10/04/nissan-leaf-replacement-battery-will-cost-5499/ (accessed on 14 March 2021).
  26. Casals, L.C.; Garcia, B.A.; González-Benítez, M.M. A Cost Analysis of Electric Vehicle Batteries Second Life Businesses. In Project Management and Engineering Research; Springer: Cham, Switzerland, 2014; pp. 129–141. Available online: https://link.springer.com/chapter/10.1007/978-3-319-26459-2_10 (accessed on 14 March 2021).
  27. Neubauer, J.; Smith, K.; Wood, E.; Pesaran, A. Identifying and Overcoming Critical Barriers to Widespread Second Use of PEV Batteries. National Renewable Energy Laboratory-Technical Report. 2015. Available online: https://www.nrel.gov/docs/fy15osti/63332.pdf (accessed on 14 March 2021).
  28. Regulatory Office for Network Industries. Analysis of the Volume of Provided Support Services and Costs for Support Services and Regulating Electricity in 2013 and Comparison with 2012. Department of Quality Regulation and Analysis. 2014. Available online: http://www.urso.gov.sk/sites/default/files/URSO_Analyza-PpS-a-RE_09-2014.pdf (accessed on 15 March 2021).
  29. Regulatory Office for Network Industries. Decision. 2019. Available online: http://www.urso.gov.sk:8088/CISRES/Agenda.nsf/0/76B517756AED53CFC12584C5002E1C43/$FILE/0075_2020_E.pdf (accessed on 15 March 2021).
  30. Mališka, R. A Battery Storage Facility Will be Created in Slovakia for Almost the Whole of Central Europe. Techpedia. 2020. Available online: https://techpedia.ta3.com/technologie-pre-biznis/novinky/energetika/8367/na-slovensku-vznikne-bateriove-ulozisko-pre-takmer-celu-strednu-europu (accessed on 15 March 2021).
  31. Entsoe Transparency Platform. Price of Reserved Balancing Reserves. Available online: https://transparency.entsoe.eu/balancing/r2/balancingVolumesReservationPrice/show?name=&defaultValue=false&viewType=GRAPH&areaType=SCA&atch=false&dateTime.dateTime=15.03.2021+00:00|UTC|DAY&dateTime.endDateTime=15.03.2022+00:00|UTC|DAY&contractTypes.values=A13&contractTypes.values=A01&contractTypes.values=A02&contractTypes.values=A03&contractTypes.values=A04&contractTypes.values=A06&reserveType.values=A96&marketArea.values=CTY|10YAT-APG------L!SCA|10YAT-APG------L&reserveSource.values=A04&reserveSource.values=A05&reserveSource.values=NOT+SPECIFIED&dv-datatable_length=10 (accessed on 15 March 2021).
  32. Europe-Solar Store. KACO Blueplanet 50.0 TL3. Available online: https://www.europe-solarstore.com/kaco-blueplanet-50-0-tl3.html (accessed on 16 March 2021).
  33. Slovak Salary Monitor. Electrical Engineering and Energy. Available online: http://www.naseplaty.sk/prehlad-platov/elektrotechnika-a-energetika.html (accessed on 16 March 2021).
  34. SmartEV. Schneider Electric Smart Wallbox. Available online: http://www.smartev.cz/produkt/schneider_electric_smart-wallbox/ (accessed on 16 March 2021).
  35. SmartEV. Schneider Electric EVlink Parkoviste. Available online: http://www.smartev.cz/produkt/schneider_electric_evlink-parkoviste/ (accessed on 16 March 2021).
  36. EUROENERGY, SPOL. S R. O. Partial Study for Work Team A25—Prediction of Eectromobility Development in the Czech Republic. 2018. Available online: https://www.mpo.cz/assets/cz/energetika/konference-seminare/2018/11/Studie-NAPS-SG-A25_Elektromobilita.pdf (accessed on 17 March 2021).
  37. Kott, J. Future Expansion of Charging Infrastructure for Electric Vehicles in the Czech Republic. 2016. Available online: https://dspace.cvut.cz/bitstream/handle/10467/65322/F3-DP-2016-Kott-Jakub-Rozvoj%20dobijeci%20infrastruktury%20pro%20elektromobily%20v%20Ceske%20republice.pdf?sequence=1&isAllowed=y (accessed on 17 March 2021).
  38. Puškár, M.; Jahnátek, A.; Kádárová, J.; Šoltésová, M.; Kovanič, L.; Krivosudská, J. Environmental study focused on the suitability of vehicle certifications using the new European driving cycle (NEDC) with regard to the affair “dieselgate” and the risks of NOx emissions in urban destinations. Air Qual. Atmos. Health 2019, 12, 251–257. [Google Scholar] [CrossRef]
Figure 1. Annual battery capacity for the 2nd life battery [14].
Applsci 11 03834 g001
Figure 2. Development of the price of lithium batteries and the expected price outlook for the next years [18].
Applsci 11 03834 g002
Figure 3. Battery degradation depending on mileage [20,21].
Applsci 11 03834 g003
Figure 4. Price development of 2nd life battery.
Applsci 11 03834 g004
Figure 5. Dependence of the 2nd life battery price on the selection of the demand coefficient.
Applsci 11 03834 g005
Figure 6. FCP service price development [32].
Applsci 11 03834 g006
Figure 7. Dependence of NPV on the number of batteries of the large battery storage strategy.
Applsci 11 03834 g007
Figure 8. Dependence of NPV on the failure rate of battery cells of the large battery storage strategy.
Applsci 11 03834 g008
Figure 9. Dependence of NPV on the number of dealerships of the small battery storage strategy.
Applsci 11 03834 g009
Figure 10. Dependence of NPV on the connected power of the small battery storage strategy.
Applsci 11 03834 g010
Table 1. Representation of materials in the battery and its prices of Chevrolet Bolt EV [4].
MaterialPercent of Battery Cell Mass (%)Cost Per Ton (€)
Aluminum161345
Graphite148408
Steel13504
Iron962
Copper85337
Cobalt622,700
Nickel68408
Manganese51430
Polyester3N/A
Lithium212,612
Other18N/A
Table 2. Relational discharge level and service life in terms of number of traction battery CCs [10].
DoD (Depth of Discharge)Service Life-Number of Cycles
100%150
75%225
50%350
30%700
10%1800
Table 3. Remarkable second life batteries projects [13].
Joint VenturesDescriptionLocation
BMW/Vattenfall/Bosch2600 battery modules from 100 EVs, and provides 2 MW of output and 2.8 MWh of capacityHamburg, Germany
Renault/Connected Energy Ltd.“E-STOR”: on-grid providing energy storage that prevents power grid overload and balances supply and demandUnited Kingdom
Mitsubishi/PSA EDF/Forsee Power/MMCBidirectional battery energy consumption optimization from retired batteriesParis, France
General Motors/ABB5 Chevrolet Volt LIBs, 74 kW solar array and two 2 kW wind turbines to power a General Motors office building siteUSA
Table 4. Markets for 2nd life batteries [14].
Market ApplicationNumber of Repurposed PacksCycle FrequencyPotential for ApplicationLimitations for Applications *
Residential1–2DailyLarge market and small, easy-to-handle units. Market can be incrementally developed.Regulated pricing minimizes savings for the user. Risk and maintenance must be addressed.
Telecommunication towers5–10Daily and back-upMotivated for onsite energy storage, and currently has many sites.High reliability demanded by application and would be difficult to achieve.
Light commercial10–15DailyGreater savings due to unregulated electrical pricing. Have the expertise, location and personnel to support the technology.Safety regulations for storing batteries on site must be determined. More packs are required.
Office building30–40DailyGreater savings due to unregulated electrical pricing. Can complement generator use.Larger application requires significant storage investment. Urban locations may create greater risks.
Fresh food distribution Centers30–40DailyGreater savings due to unregulated electrical pricing. Large electrical demand with highly controllable equipment will work well with technology. Often early adopters if business case can be demonstrated.Larger application requires significant storage investment. Payback must be clearly demonstrated.
Stranded power (renewables)90010–20/monthIntermittent nature of renewable energy justifies energy storage. Have the expertise, location, and personnel to support the technology.Size of application may use up supply or the supply will not be available. Complexity of controlling packs of varying states of health. Increased risk of fire.
Transmission support10001/monthLarge energy needs create larger market for batteries. Currently users of auxiliary electricity services and thus have some comfort with the application.Benefits can still be achieved working with smaller market applications and customers. Increased risk of fire.
* Cready et al. (2003) in Reference [16].
Table 5. Input parameters for calculating the 2nd life battery.
ParameterValue
Cash discount (r)7.2%
Annual increase in electricity prices (v)3.1%
DoD40%
Charging voltage4.1 V
Mileage of EV100,000 km
Average consumption of EV18 kW/100 km
Demand coefficient75.0%
Table 6. Input values for the calculation of the 2nd battery life.
ParameterValue
k h e a l t h from formula (1)36.8%
Remaining capacity of the 2nd battery life76.6%
P V B n e w from formula (3)39,355 kWh
P V B 2 n d   l i f e from formula (3)14,513 kWh
Table 7. Sensitivity analysis-the price of the 2nd battery life.
Price 2nd life (USD)50,000 km75,000 km100,000 km125,000 kmCycles 2nd life50,000 km75,000 km100,000 km125,000 km
14 kWh/100 km8267544214 kWh/100 km2320199716741350
16 kWh/100 km7963483516 kWh/100 km2228185814891119
18 kWh/100 km7659432818 kWh/100 km213517201304888
20 kWh/100 km7354372120 kWh/100 km204315811119658
22 kWh/100 km7050311422 kWh/100 km19511443935427
Table 8. Final revenues for 2020 depending on the free commercial capacity of the repository.
Business capacity (MWh)11.522.533.545
Annual income (€)65,00096,700128,900158,950190,750218,995250,280310,544
Table 9. Input investments.
ParameterValue
Number of 2nd life batteries710
Connected power9.05 MW
Cash discount7.2%
Table 10. Input parameters of the large battery storage strategy after 5 (left) and 10 (right) years.
ParameterValueParameterValue
Change in the number of batteries51Change in the number of batteries68.5
Increased connected power0.96 MWIncreased connected power0.03
Table 11. Output investments.
ParameterValue
Number of 2nd life batteries710
Battery capacity43 kWh
Remaining capacity77%
DoD60%
Inverter—power50 kW
Connected power9 MW
Business capacity14.02 MWh
Offered FCP5 MW
Capacity for the balancing market4 MWh
Number of containers25
Corporate tax19%
Table 12. Output parameters of the large battery storage strategy after 5 (left) and 10 (right) years.
ParameterValueParameterValue
Number of 2nd life batteries758Number of 2nd life batteries777
Increase power0.96 MWIncrease power0 MW
Connected power9.96 MWConnected power9.96 MW
Business capacity14.97 MWhBusiness capacity15.34 MWh
Offered FCP5 MWOffered FCP5 MW
Capacity for the balancing market5 MWhCapacity for the balancing market5 MWh
Number of containers27Number of containers27
Table 13. Eventual net present values of large battery storage strategy.
ScenarioAmount
NPV (S)€916,300
NPV (M)€−887,178
NPV (H)€2,390,256
Table 14. Input investments.
ParameterValue
Number of dealerships59
Number of 2nd life batteries14
Connected power150 kW
Central reservation80%
Charging price€0.06/min
Cash discount7.2%
Table 15. Input parameters of the small battery storage strategy after 5 (left) and 10 (right) years.
ParameterValueParameterValue
Change in the number of batteries1Change in the number of batteries1
Increasing the number of dealerships8Increasing the number of dealerships1
Table 16. Output investments.
ParameterValue
Battery capacity43 kWh
Remaining capacity77%
DoD60%
Inverter—power50 kW
Charger22 kW
Use of a public charger20%
Total number of batteries755
Connected power8.8 MW
Total capacity14.95 MWh
Business capacity11.96 MWh
Offered FCP5 MW
Capacity for the balancing market1.95 MWh
Dealer capacity51.5 kWh
Corporate tax19%
Table 17. Output parameters of the small battery storage strategy after 5 (left) and 10 (right) years.
ParameterValueParameterValue
Number of 2nd life batteries925Number of 2nd life batteries939
Number of dealerships67Number of dealerships68
Connected power9.92 MWConnected power10.07 MW
Total capacity18.29 MWhTotal capacity18.58 MWh
Business capacity14.64 MWhBusiness capacity14.86 MWh
Offered FCP5 MWOffered FCP5 MW
Capacity for the balancing market5 MWhCapacity for the balancing market5 MWh
Table 18. Eventual net present values of large battery storage strategy.
ScenarioAmount
NPV (S)€649,469
NPV (M)€−1,193,879
NPV (H)€2,066,437
Publisher’s Note: MDPI stays neutral with regard to jurisdictional claims in published maps and institutional affiliations.

