Article

Lean Maturity Assessment in ETO Scenario

Department of Civil and Industrial Engineering, University of Pisa, 56122 Pisa, Italy
*
Author to whom correspondence should be addressed.
Appl. Sci. 2021, 11(9), 3833; https://doi.org/10.3390/app11093833
Submission received: 15 March 2021 / Revised: 14 April 2021 / Accepted: 19 April 2021 / Published: 23 April 2021
(This article belongs to the Special Issue Implementing Lean Manufacturing in Engineer-to-Order Industries)

Abstract

:
The obligatory path towards a lean manufacturing organization requires assessment and monitoring. However, a lean assessment framework is not yet available for the engineer to order (ETO) scenario. This work explored ten lean ETO maturity principles—identified from the literature—that take insight from three formally defined sets (Toyota Way, lean construction, and lean product development principles). A practical assessment model was proposed based on the evaluation of ten lean ETO objective criteria (four with mathematical formulation) and was validated on a real industrial case. A problem-solving tool, including a new lean tool, called the Problem Focus Matrix (PFM), was also presented; this tool was aimed toward development of an integrated framework that would include the organization mission, management, and continuous improvement.

1. Introduction

According to Womack’s definition from the 1990s, lean production (or lean manufacturing) is a set of methods and tools to identify and eliminate inefficiencies and waste at the enterprise and manufacturing level without requiring additional resources [1].
This work proposes a theoretical lean maturity assessment model, along with its application to a real case study, in the specific context of engineer to order (ETO).
A graphical representation of the paper structure is provided in Figure 1.
Background information on lean manufacturing and ETO is presented in Section 1.1 and Section 1.2, respectively. The relevant literature on both is reported in Section 1.3, focusing on the ETO lean maturity assessment. Section 2 describes the methods used in the formal definition of the ten lean principles retrieved from the literature and the generation of the ETO lean assessment model using ten relative criteria. In Section 3, the assessment model is further detailed and validated on a real case study. A problem-solving approach based on the evidence, which emerged in the application of the model, is also presented. The main results and research perspectives are exposed in Section 4 and Section 5, respectively. Conclusions can be found in Section 6.

1.1. Lean Manufacturing

The culture of lean manufacturing was conceived and developed in the Toyota production system (TPS), pioneered by Japanese engineers Taiichi Ohno and Shigeo Shingo [2,3].
After World War II, Japanese manufacturers realized that they could not afford the massive investment required to rebuild devastated facilities. In response, they developed methods to produce automobiles with less inventory, human effort, and investment (and fewer defects), introducing a growing variety of products over time [2].
The modern concept of LM/management can also be attributed to the customized, integrated application of TQC [4]. Toyota was one of the first Japanese companies to implement statistical quality control, in 1949 [5].
The many well-known features of lean production include: bottleneck analysis [6], the Kanban system (the just-in-time (JIT) process) [7,8], kaizen (continuous improvement) [9,10], value stream mapping (VSM) [11], lean six sigma [12,13,14], single minute exchange of die (SMED) [15], 5S [16], zero inventory [17], work standardization [18], and lean product development (LPD) [19]. The main goal behind this—and all related tools and techniques—concerns the improvement of the effectiveness and efficiency of the production process through deletion of waste (or muda) [20].
As accepted in the TPS, any manufacturing process is prone to seven types of waste: overproduction, inventory, transport, waiting times, movements, overprocessing, and defects [21,22]. In addition to this set, the underutilization of employee creativity is considered an eighth type of waste; environmental waste is considered a ninth [23].
The speed of Japan’s production system methods’ penetration into manufacturing industries all around the world demonstrated the significant relevance of their philosophy [2]. Half a century after the birth of the lean concept, despite all the context mutations, lean remains a trending phenomenon, often associated with industry 4.0—and certainly included in sustainability [24,25].

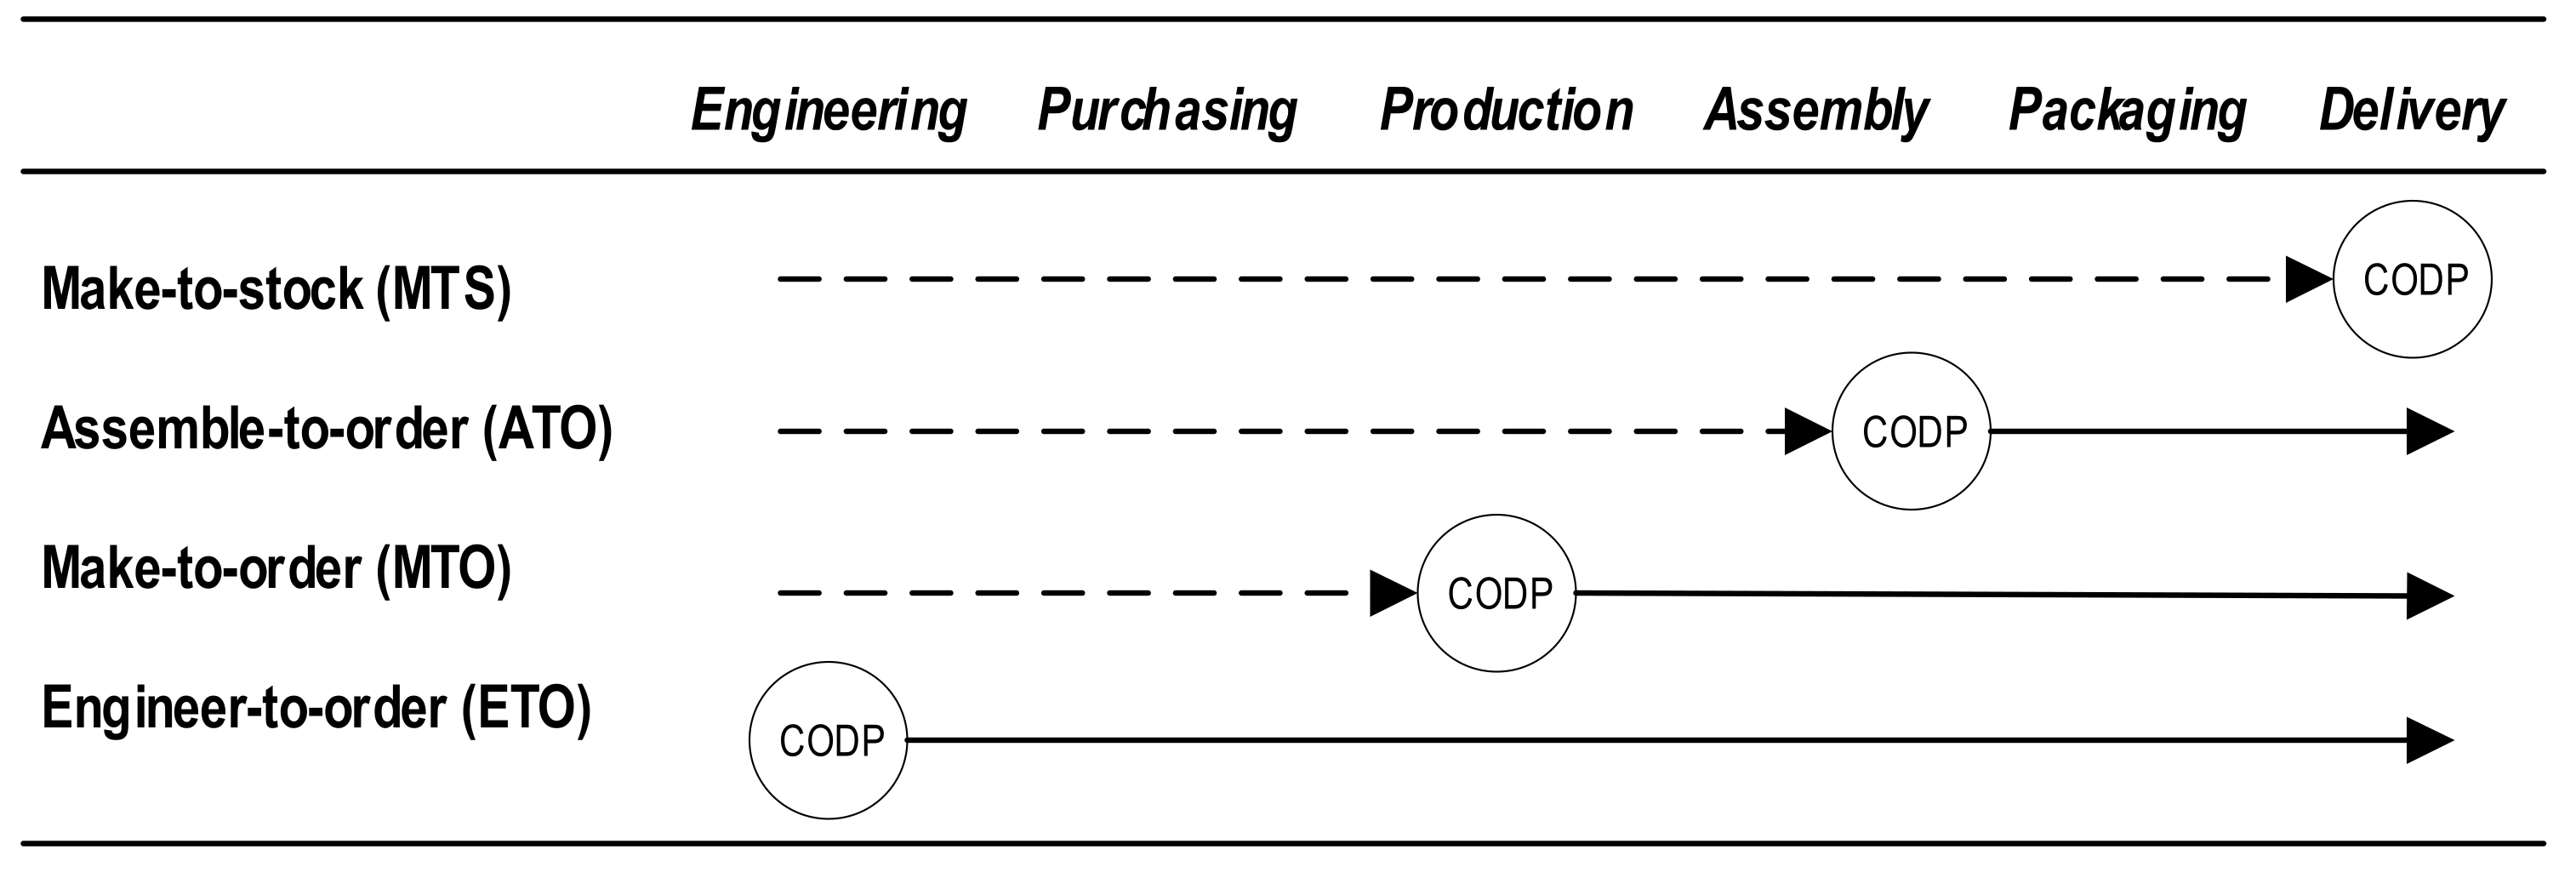
1.2. Engineer to Order (ETO)

Lean manufacturing has been essentially developed in low-mix and high-volume repetitive push-based manufacturing industries (e.g., make to stock (MTS) [26] and assemble to order (ATO) [27]), yielding cost and lead time reduction, along with quality improvements. However, the increase of globalization, along with frequent recessions, has forced many organizations to reduce costs and to be more responsive to customer demands.
As shown in Figure 2, by moving the customer order decoupling point (CODP) to an ETO scenario, the implementation of lean strategies grows more challenging. Additionally, it extends beyond manufacturing alone, into pull-based (not standardized) systems [28], low-volume/high-mix methods, and one of a kind or highly customized parts, e.g., the building, construction, machinery, shipbuilding, aerospace and railway industries.
From mass production to mass customization, the growing degree of personalization in production has focused efforts on selling margins, rather than on volume. This results in efficiency loss, which is unacceptable in highly competitive global markets [29]. This is a contributing factor to the growing interest in lean methods and tools in ETO organizations [29,30,31]. However, some barriers in the implementation of lean practices in an ETO scenario remain [32].
The purpose of this work was to define an assessment framework for the ETO scenario and provide an objective, absolute evaluation of the current lean maturity level. Additionally, the work purposed to monitor the evolution of lean methodologies within individual or multiple organizations.

1.3. ETO Lean Assessment
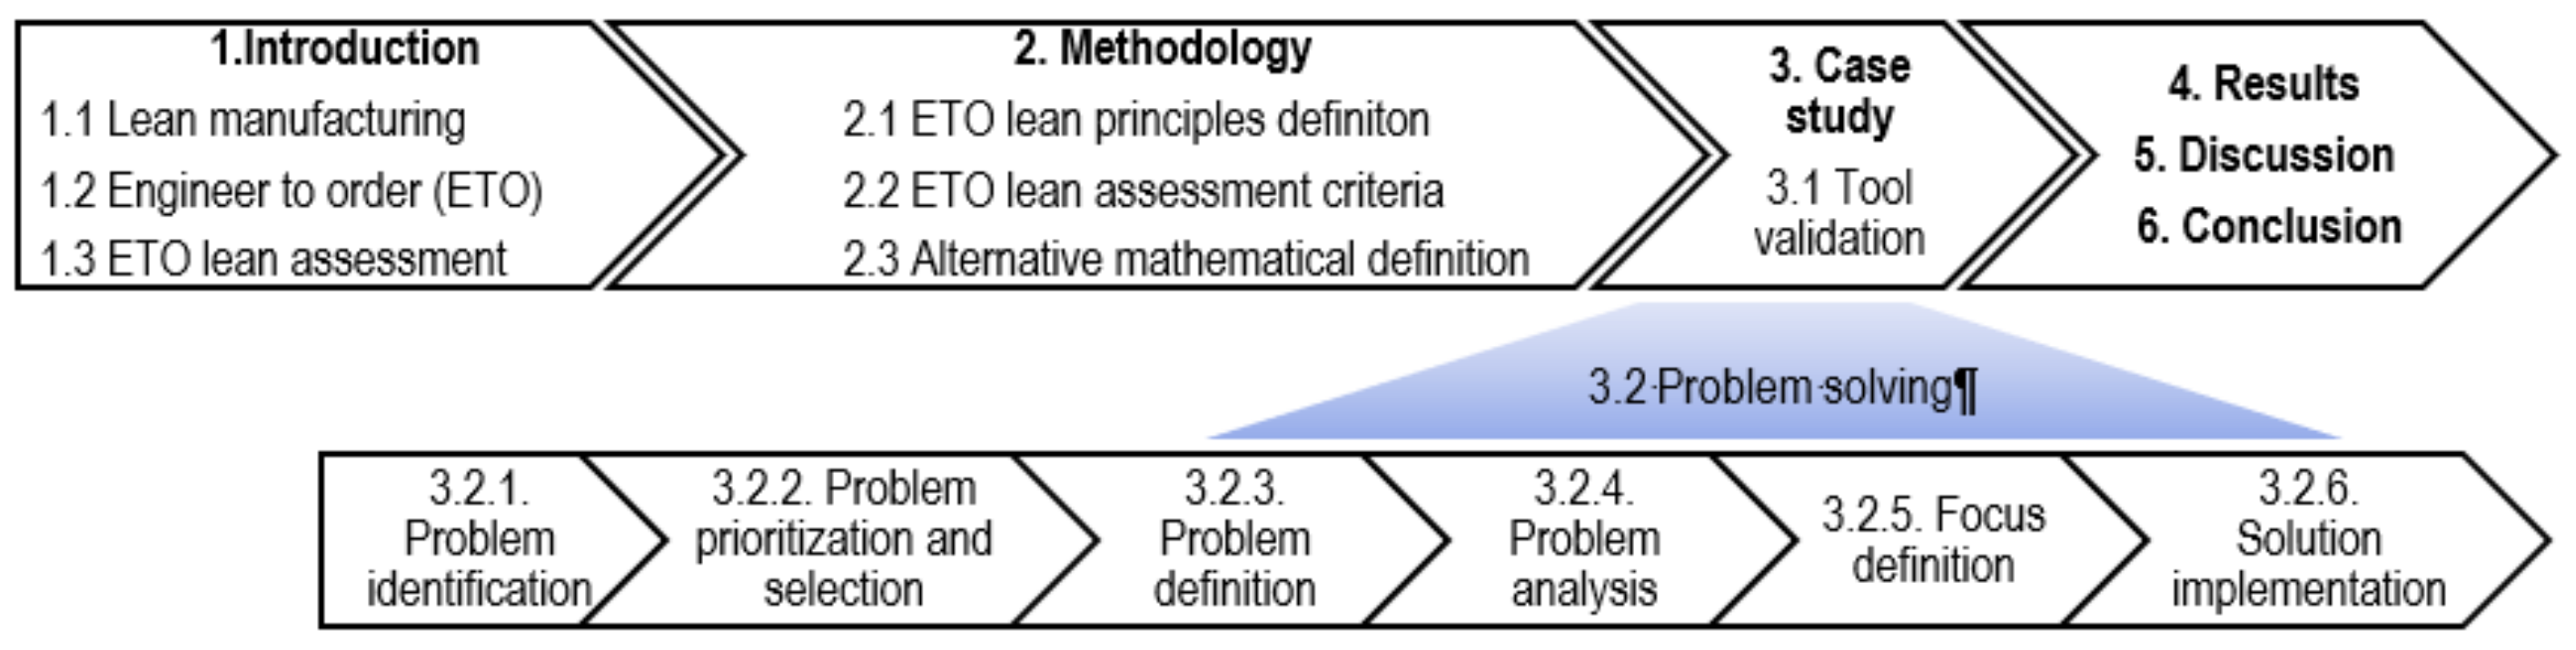
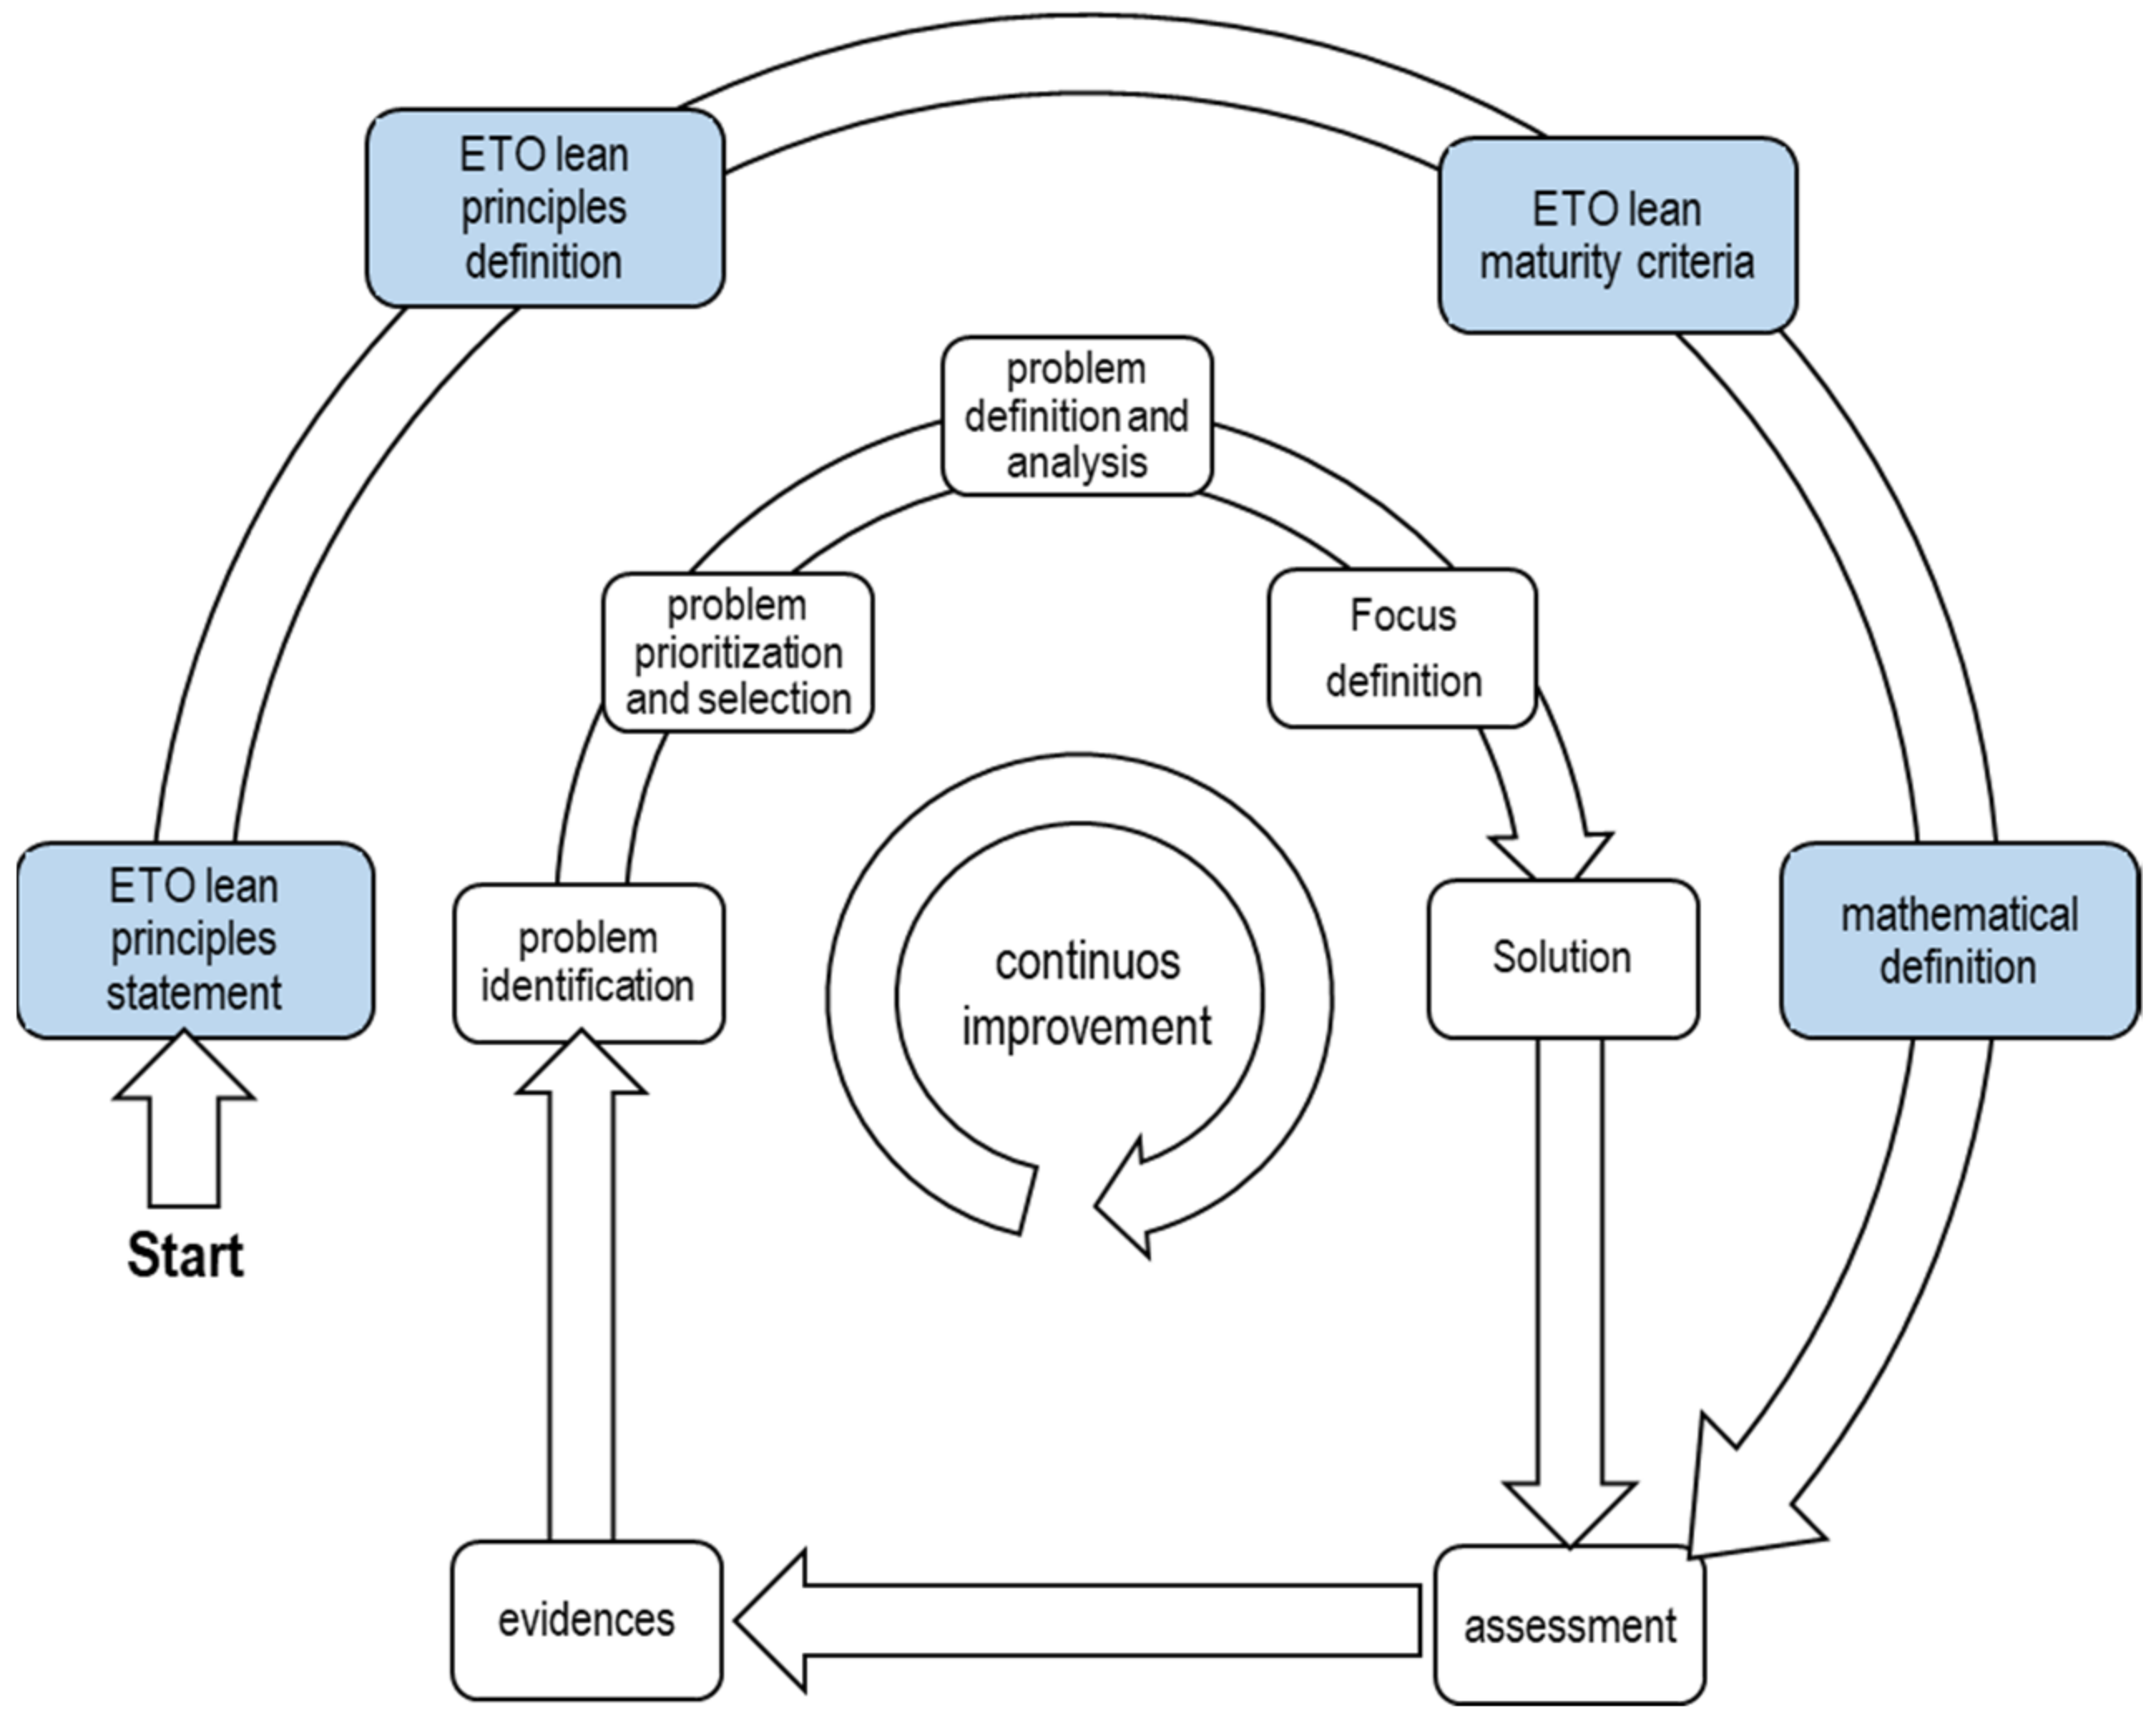
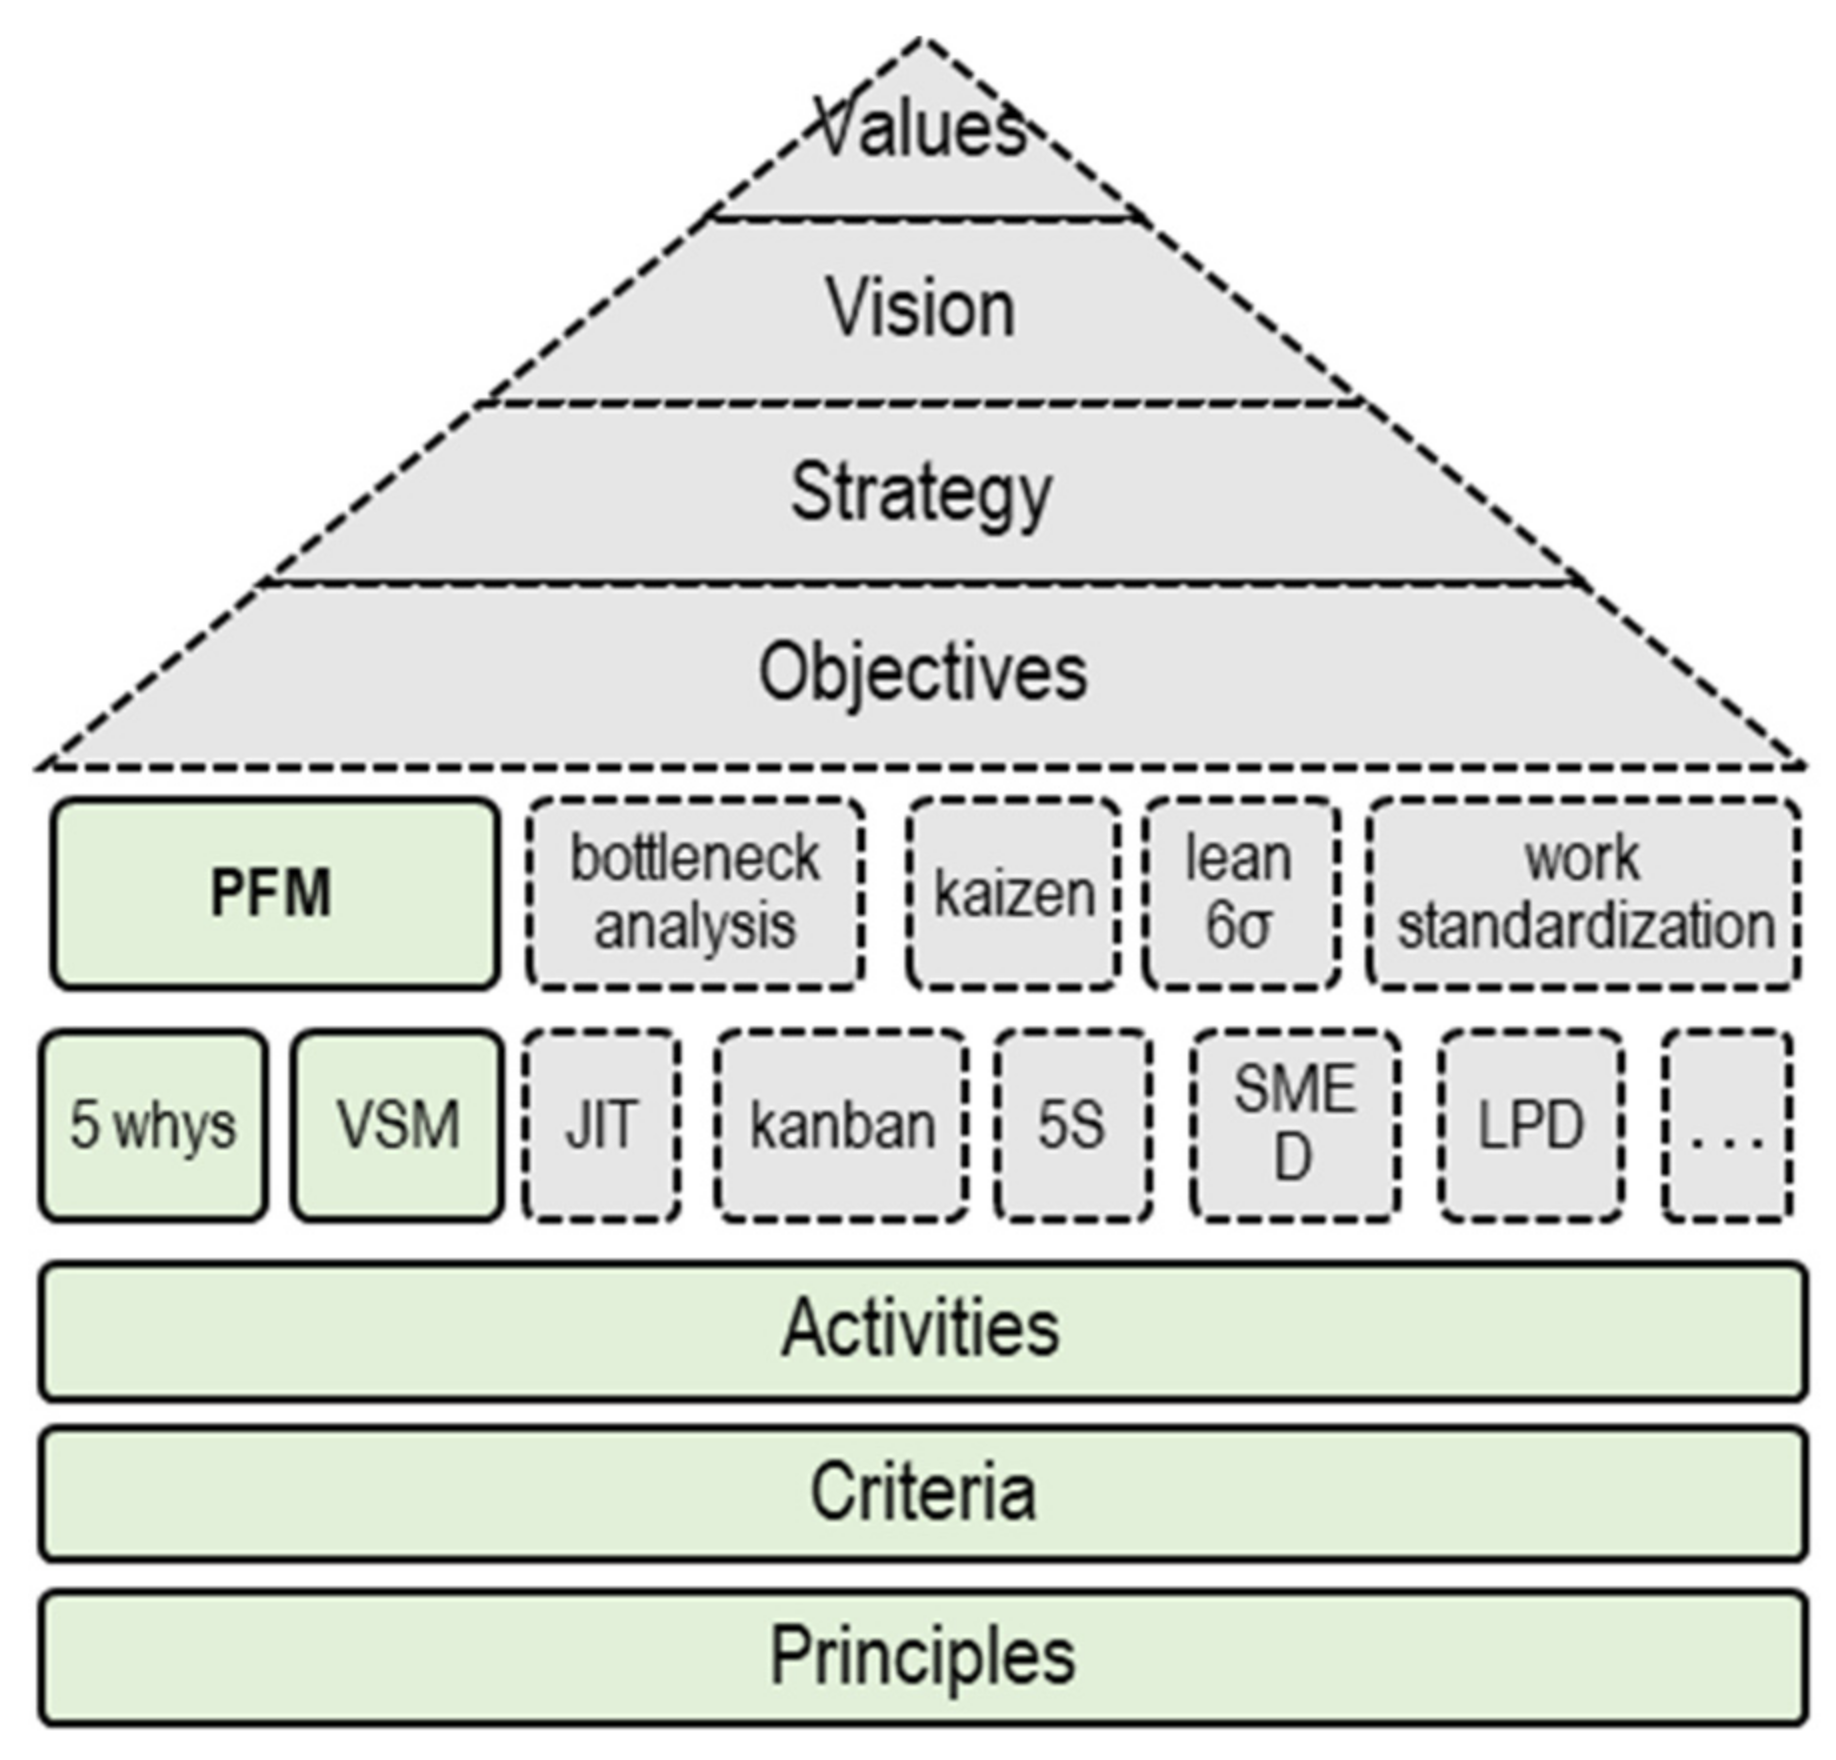
The culture of companywide assessment has grown more and more popular, leading to the diffusion of quality, health, safety, and environmental management protocols. One primary goal of this growing business culture is to measure system status with respect to given criteria, and enhance the system through feedback actions [33,34]. This paper benefitted from and contributes to the development of such culture.
A comprehensive review on the assessment of the implementation of lean practices within an organization can be found in [35]. Remarkable work has been carried out using quantitative, qualitative, and hybrid approaches to assess lean implementation and transformation (see [36,37,38]). The Leanness Assessment Tool (LAT) in [36] provided theoretical implications that helped us define the idea behind our presented model. In this work, the LAT was developed based on lean research, using both quantitative and qualitative dimensions to assess lean implementation. Among other contributions, one of the most rewarding was the Lean Enterprise Transformation Maturity Model (LESAT). This model is focused on assessing the degree of maturity of an enterprise by using lean principles and practices to achieve the best value for the enterprise and its stakeholders [39,40].
In [41], a combination of lean and cloud manufacturing, used to provide a lean monitoring system in a i4.0 contemporary framework, was provided.
However, despite the numerous general assessment tools and theories available in the literature on lean assessment, more research for their application to ETO scenarios is required. In particular, it seems that a practical lean assessment method suited for ETO systems is not yet available.
The aim of this work was to propose a practical model specifically for ETO organizations. The proposed model offers various target uses (e.g., self-assessment, consulting, and third-party auditing) and can be applied at different improvement stages (e.g., identifying and prioritizing areas for improvement, benchmarking with other organizations, progress monitoring over time, and sharing organization-wide learning). The two primary ingredients on which the proposed assessment tool was built up were: the ten ETO principles stated in [30], and the ISO 9004:2018 standard for achieving sustained success self-evaluation tool [42].
As stated in [30], the new set of principles (listed in Table 1) aimed at enabling ETO manufacturers to pursue the lean ideal, gathered insight into lean production from the 14 principles of the Toyota Way [43], the 11 lean construction principles in [44], and the 13 lean product development principles in [45].
In Figure 3, these principles are clustered over Management, Processes, Products, and Stakeholders. It details how those principles concur on delivering value to the customer. In an ETO scenario, the customer demand triggers the system. In this framework, continuous improvement is the engine that feeds the organization, from a dynamic perspective.
The ISO 9004 self-auditing tool is based on five levels of assessment. This tool can clearly outline a high-level overview on management systems’ effectiveness in accordance with regulatory standards. It allows the review of the organization’s performance against specified criteria. It can also identify current maturity levels and determine strengths and weaknesses—with respect to management—in order to facilitate sustained organizational success. A similar approach was adopted within the ETO lean principles previously defined.

2. Methodology

This section describes the methodology used in the generation of the proposed ETO lean assessment tool, which is synthetically represented in Section 2.2.
Section 2.1 formally defines the ten ETO lean principles, identified in Section 1.3. Section 2.2. presents objective evaluation criteria arranged in the assessment tool. Section 2.3, defines mathematical criteria for four of the ten principles. In Figure 4, the logical flow of the methodology is shown, and the main steps are represented by light blue boxes.

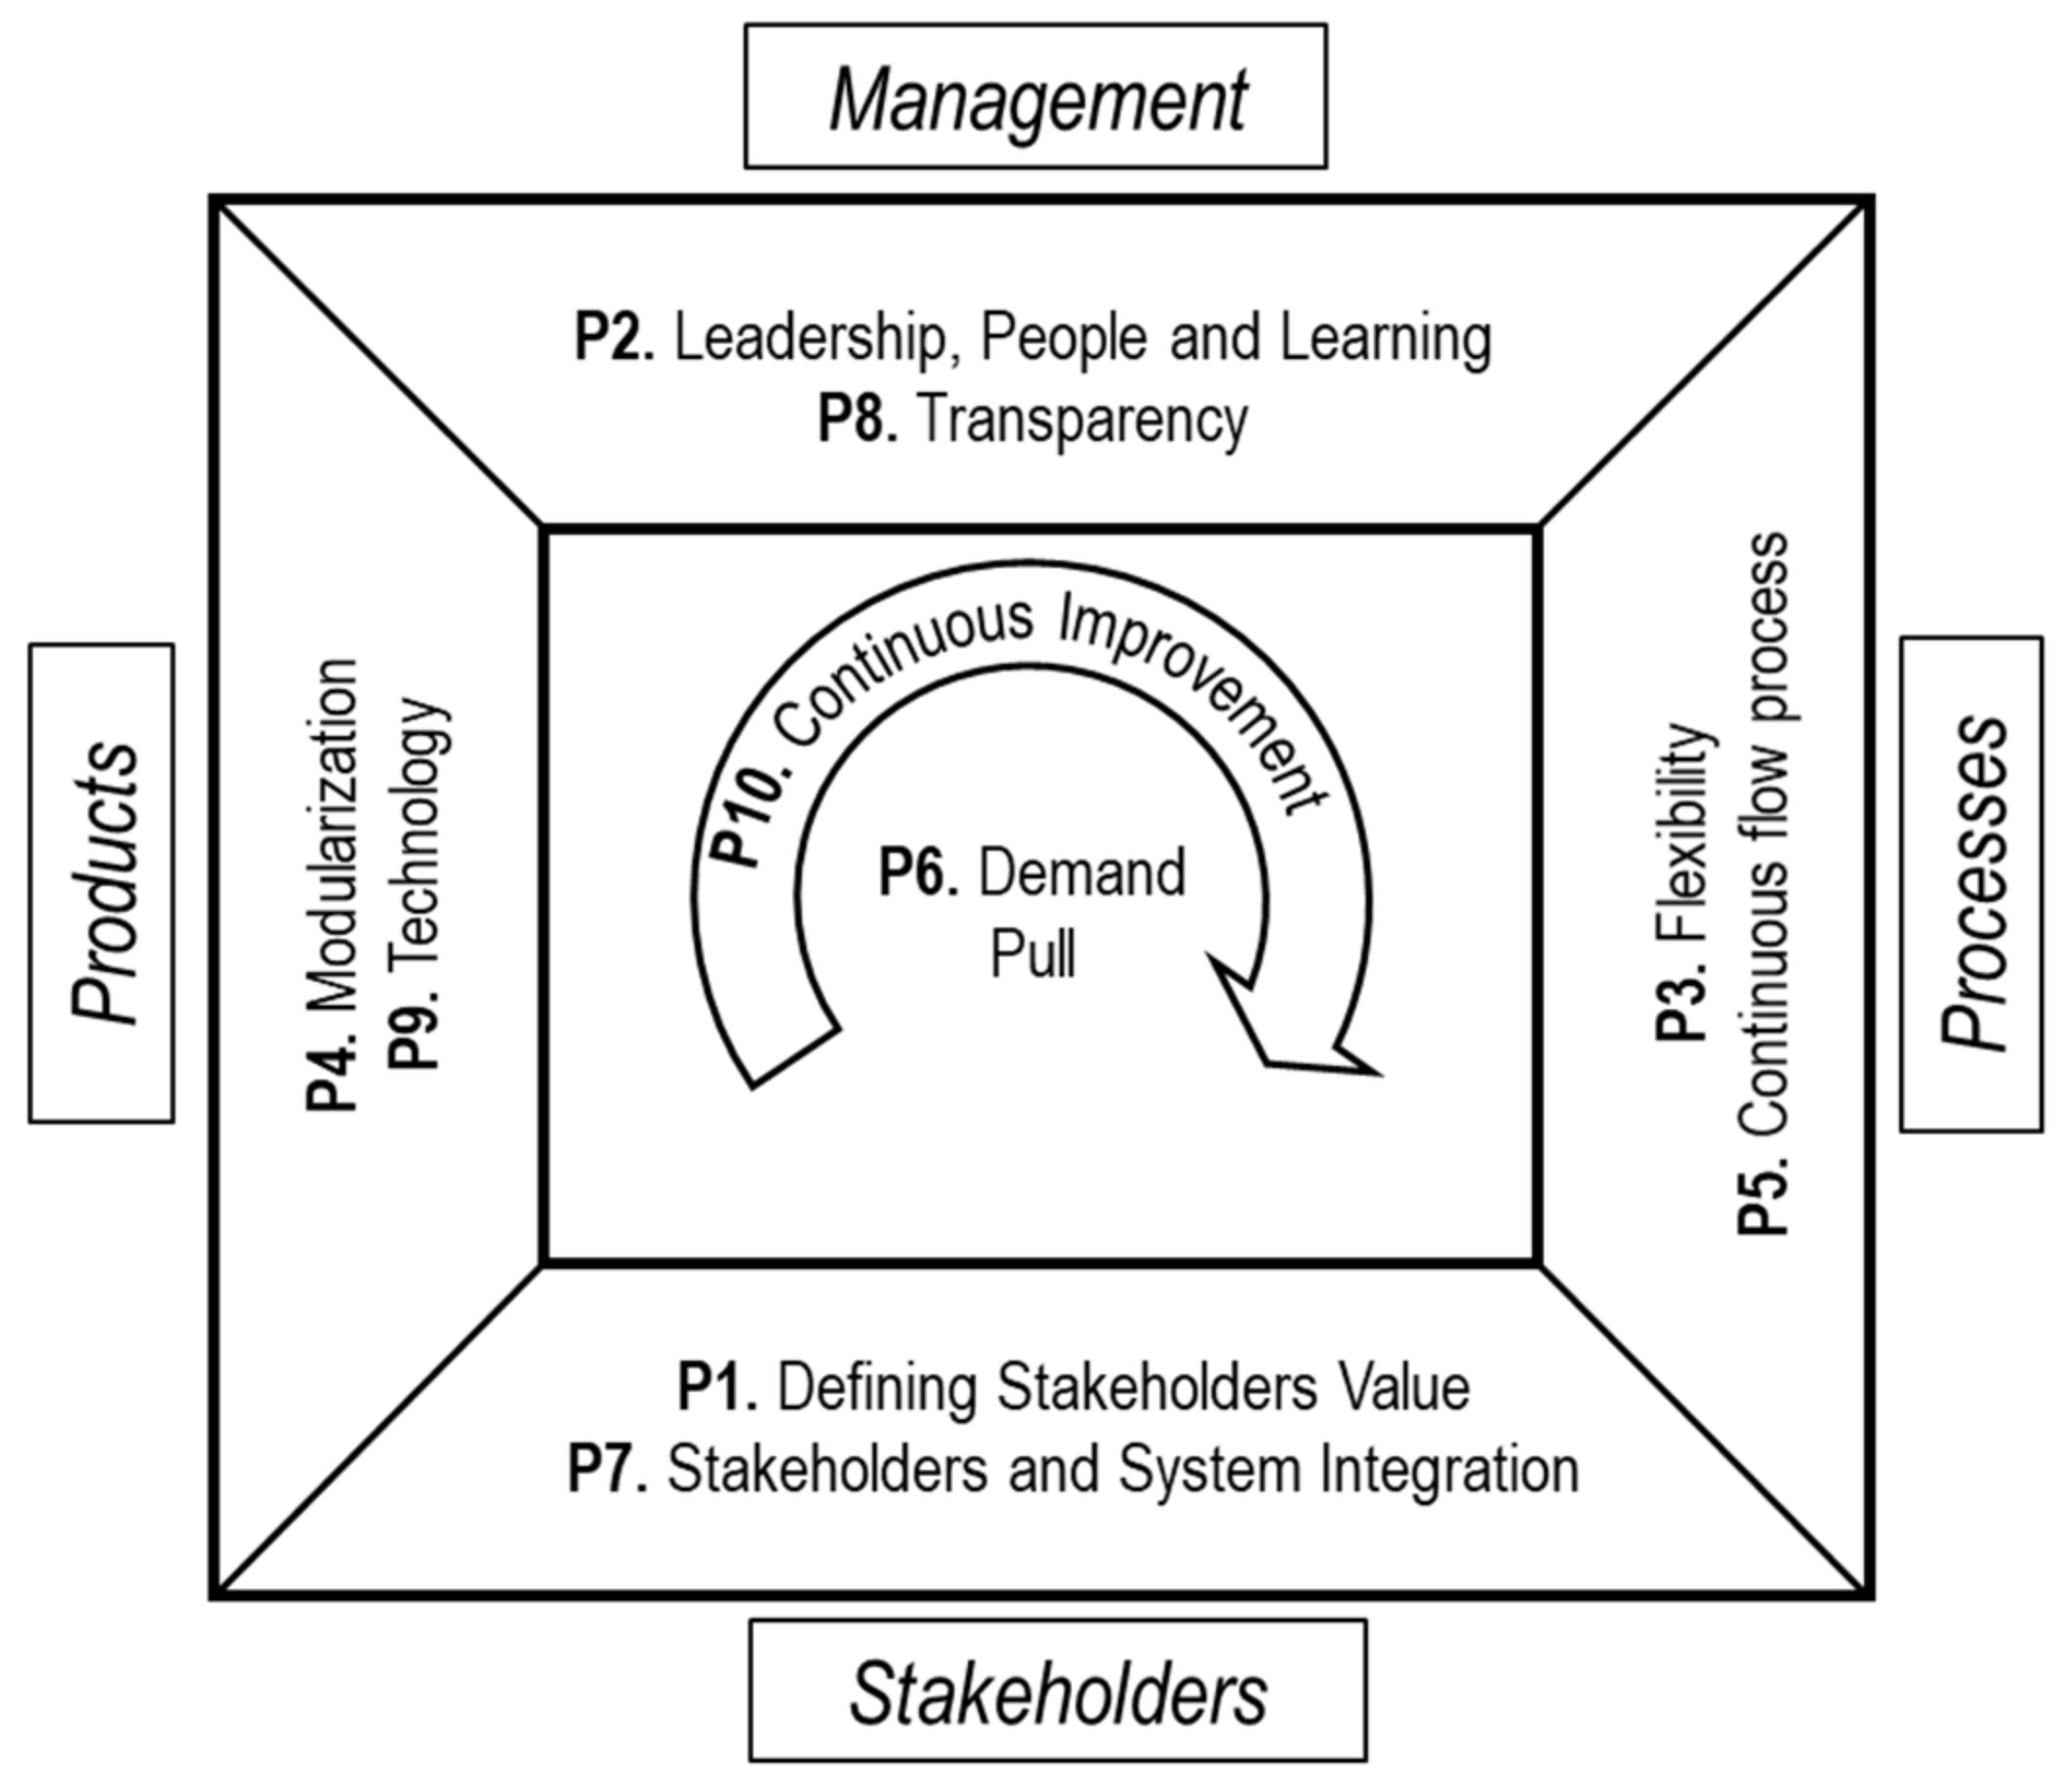
2.1. ETO Lean Principles Definition

Ten principles have been stated and defined. For each of the principles, a synthetic review to extract relevant information for a formal definition has been offered. The purpose of this formal definition lies in the search for objective principles on which it would be possible to base assessments.

2.1.1. P1. Defining Stakeholders Value

The Stakeholders Value Analysis (SVA), developed by [46], is a methodology that provides a mechanism to define, link, and integrate the concerns of all stakeholders into a decision. The main steps characterizing the SVA methodology can be associated to the following five steps:
  • Identification of relevant stakeholders, including external (e.g., customers) and internal (e.g., employees and company owners) stakeholders. The identification process may result in a long list.
  • Identification and assignment of (key) performance attributes, called values, to the stakeholder group. In this step, the main values in which the stakeholders’ groups are interested are defined.
  • Definition of value weights through the pairwise comparison model, stakeholders cluster method, or others. Weights for an attribute are determined simply, by comparing pairs of attributes one at a time.
  • Computation of a total value index for each option being assessed by the analysis. A cumulative score for each option is calculated.
  • Research an option that satisfies most of the main concerns of the stakeholders. Create of a new option, as well, possibly based on those originally considered.
The presented methodology is a representative example of a structured SVA process and can be considered a guideline in the evaluation of the maturity level of this specific principle.

2.1.2. P2. Leadership, People and Learning

Leadership is evaluated by the LESAT methodology [39,40], which is based on the following three macro topics, particularly the dominant one (i):
  • Transformation and change management,
  • Product development, and
  • Procedures for infrastructures.
People and learning is based on [47], in which an evaluation of the maturity level of Malaysian SMEs in industry 4.0 was carried out, strongly considering people’s competences and the acquisition of lean concepts empowered throughout the organization.

2.1.3. P3. Flexibility

In a perfectly lean and flexible production system, the lead time between customer demand and delivery would be zero. To quantitatively evaluate the maturity level of the flexibility principle, see Formula (1) from [48] for a mathematical definition in which the ratio of the deviation and the total demand were weighted by the capacity demand (more details in Section 2.3.1).

2.1.4. P4. Modularization

In [49], the authors presented a mathematical model for the evaluation of the modularization degree for a given product architecture. That definition has been adopted to quantitatively assess the lean maturity of the modularization principle. The amount of modularization is a function of new components, substitutability factor, and interface constraints (more details in Section 2.3.2).

2.1.5. P5. Continuous Process Flow

Numerous parameters for monitoring process flow continuity are available. In order to quantitatively and practically evaluate the lean maturity of the continuous process flow principle, for a mathematical definition, see Work in Progress (WIP) [50] (more details in Section 2.3.3).

2.1.6. P6. Demand Pull

As a matter of fact, ETO systems are pull-based. Moreover, demand pull is a basic lean manufacturing principle. In order to quantitatively evaluate maturity level—with regard to the organization phasing of customer requests—the relation between forward scheduling (push) and backward request (pull) in\product development and production was considered by [51] (more details in Section 2.3.4).

2.1.7. P7. Stakeholders and Systems Integration

Stakeholder integration can be related to either stakeholder management or management of stakeholders. The different forms of interaction between stakeholders and companies is a delicate topic, analyzed in depth in order to identify key factors that provide companies with competitive advantages. There is significant, relevant need for variables that allow the definition of a measurement scale for stakeholder integration [52].
A set of stakeholders’ interaction indicators from [52] was considered. These were: knowledge (of the stakeholders and their demands), interaction (between stakeholders and company), and the adaptational behavior of the company toward their stakeholders.

2.1.8. P8. Transparency

At the organizational level, effective transparency is enacted through a company’s willingness to consistently relay information to internal or external interested parties [53,54]. Thus, transparency assessments (in an organizational context) should consider the nature of the information provided by the organization. Clarity, for example, is identified as the amount of understandability perceived by the information receiver. That fact deserves significant attention [53,55].

2.1.9. P9. Technology

In addition to the previously mentioned ETO lean principles (which serve a strict role in the transition of an organization from a practical hardware/software side), technology is the core of many industrial systems. It is thus, understandably, an important component of the engine of change. It is for this reason that the smart factory paradigm received so much attention [56]. For example, several technology enablers in manufacturing scenarios have penetrated almost every production system in place today, even ETO. These include CAE systems for design and simulation, advanced subtractive/additive manufacturing, sensors, programmable robots for material handling, automated quality control systems, ERP management systems, MES digital twins, and more. [57,58].

2.1.10. P10. Continuous Improvement

One of the quality pillar—continuous improvement—plays a key role in driving an organization toward better performance. It also impacts the creation of new opportunities. Numerous international quality management system standards (e.g., ISO 9001 [59]) have highlighted this concept as the propulsor of the Deming wheel [21,60].
Among continuous improvement assessing models, the capability model proposed by [61] is considered a useful guide in efforts to define lean maturity. This model described continuous improvement in terms of a set of key behaviors or behavioral routines deemed essential for long-term success. In this framework, awareness of the major lean tools (highlighted in Section 1.1) was applied in a problem-solving approach.

2.2. ETO Lean Assessment Criteria

Table 2 summarizes the assessment criteria (over five maturity levels) for each of the ten ETO lean principles defined in Section 2.1. Levels or grades serve as alternatives to a continuous score (percentage), where mathematical expressions are available (Section 2.3).
The maturity level/grade can be inferred by identifying the actual company state for each principle, using Table 2. A fine tuning of the maturity percentage can be defined within each relative 20% discretization range.

2.3. Alternative Mathematical Definition

For four principles, (P3. to P6.) the following mathematical definitions are available in the literature.

2.3.1. P3. Flexibility

To evaluate volume and mix flexibility for each variant in the production system, a definite time frame t must be fixed. During time t for a specific product type i, it is possible to define the market demand dt,i and the quantity produced pt,i. If the production system is not flexible enough to satisfy the customer demand for the product type i during the time t, there will be a difference between dtiI and pt,i. For a portfolio of n different product types, the total deviation in units can be formally described by the Formula (1).
Different product types typically require different specific resources. For this reason, a correction—weighting the deviations in volume according to their impact on capacity—is needed. ci is defined as the capacity demand for one unit of product type i [48].
F L E X t = 1 Σ i = 1 n c i d t , i p t , i Σ i = 1   n c i d t , i

2.3.2. P4. Modularization

The modularization function (2) decreases nonlinearly from a perfectly modular architecture (e.g., only standard, no new components) to a perfectly integral architecture (e.g., no standard components, only new ones).
M u = e u 2 2 N s δ
where M(u) is a modularization function of u, number of new components, N is the total number of components, s, the substitutability factor, δ, the interface constraints [49].

2.3.3. P5. Continuous Process Flow

The continuous process flow (WIP) is calculated in (3) as defined by [50]. The flow time, FT, is the actual amount of time spent, and the cycle time, CT is the ideal time needed. The first term varies, the second is fixed.
W I P = F T C T

2.3.4. P6. Demand Pull

The pull degree, quantified in (4), was defined in [51]. This criterion is closely related to the CODP defined in Figure 1 and quantifies the ratio between the activities after the decoupling point, in contrast with the total number of phases in the product life cycle (Engineering, Purchasing, Assembly, Packaging and Delivery).
P u l l   D e g r e e = P h a s e s   P u l l   N u m b e r P h a s e   T o t a l   N u m b e r

3. Case Study

Further guidelines for the model and method of application are presented here. The assessment tool was developed and tested on an Italian manufacturer of customized woodworking machines and lines in an ETO/MTO scenario.
Section 3.1 offers a validation of the tool, along with a more detailed guide to the practical evaluation of the principles whose mathematical formulas have been defined in Section 2.3.
Based on the evidence in Table 3, P10. *, continuous improvement was the weakest principle. For this reason, a set of steps followed in the continuous improvement path is presented in Section 3.2.

3.1. Tool Validation

The outcome of the application of the proposed tool is presented in Table 3. It shows the assessment evidence and evaluation. With respect to the four principles defined in Section 2.3, the mathematical evaluation and accompanying detailed guide in the use of its formulas can be found in Section 3.1.1, Section 3.1.2, Section 3.1.3 and Section 3.1.4.

3.1.1. P3. Flexibility

As shown in Table 4, the difference between market demands di and product quantity pi is equal to 0 for each product type. Therefore, the Formula (1) results equal to 1.

3.1.2. P4. Modularization

The degree of modularization expressed in (2) was computed by approximating the product (Model A) as a reference for all the product types. The number of new and total components for Model A are, respectively, u = 12 and N = 62. With respect to substitutability, the value can be assumed as s = 1 because of the possibility of replacing any new component with an old one. Finally, the interface constraint factor δ can be divided into two levels. At level 1:
δ 1 = δ c o m p o n e n t + δ s u b _ c i r c u i t
where δ c o m p o n e n t   in   5   has been expressed as:
δ c o m p o n e n t = i = 1 I δ i I
where I in (6) is the number of subcircuits and the interface constraint value is δ i = K c   n c , with K c number of interfaces and n c is the number of components in a subcircuit. Regarding the subcircuits δ s u b _ c i r c u i t :
δ s u b _ c i r c u i t = K s u b _ c i r c u i t I
where K s u b _ c i r c u i t in (7) is the number of subcircuit interfaces. Using the data in Table 5: I = 5; δ s u b c i r c u i t = 1.4; δ c o m p o n e n t = 5; δ 1   = 6.4 .
At level 2:
δ 2 = j = 1 N m δ j
with N m   in (8) is the number of total mechanical components and
δ j = K j N j
where K j in (9) is the number of interfaces for the subcircuits analyzed and N j   is the number of mechanical components at the interface with the subcircuit. Using the data in Table 6, δ 2   = 6.75.
Using the above results, δ t o t   = δ 1 + δ 2 I = 2.63, where δ t o t   represents the interface constraint factor for one base of the product Model A. Therefore, the final δ t o t   is multiplied by 2. The final degree of modularization of the 12 new components, determined by applying (2), is M 12 = 0.8 .

3.1.3. P5. Continuous Flow Process

The Work in Progress (WIP) can be calculated, as in (3). In the present case study, the flow time F T and the cycle time CT are calculated referring to the product Model A.
In Table 7, daily data related to the product Model A (including the actual amount of production time (flow time)) are presented.
Based on the data presented in Table 7, the average F T = 12 , 095 / 60 × 20 = 10.1 [h]. The calculated Cycle Time is   C T = 9   [ h p c s ] . Finally, following (3), W I P = 1.12 [pcs]. To evaluate the maturity level, an experimental conversion table was defined, as shown in Table 8.
The lean maturity score for the WIP in the present case study for the continuous flow process criterion ≅ 88%.

3.1.4. P6. Demand Pull

The pull degree was calculated according to (4), where P N = 3 (assembly, packaging and delivery), the number of pull phases (after the decoupling point) and P T o t = 5, the total number of phases. Therefore, pull   degree   = 60 % . This parameter also shows that the examined company fell between pure ETO and make to order (MTO).

3.2. Problem Solving

As shown in Table 3, the organization had a critical lean maturity level, mainly on continuous improvement. As anticipated in [62], many small and medium-sized enterprises, like the present case study, often prefer to invest in quick high potential improvements (due to their limited resources) in their implementation of lean principles. For these companies, the focus should lie on low hanging fruits, including methods like continuous improvement, that can be introduced with minimal effort and generate maximal benefits.
Section 3.2.1, Section 3.2.2, Section 3.2.3, Section 3.2.4, Section 3.2.5 and Section 3.2.6 describe the main steps followed on the continuous improvement implementation path, based on a systematic problem-solving approach which included some common lean tools. In particular, VSM, the 5 whys, and the new PFM (described in Section 3.2.5) were applied in a DMAIC (define, measure, analyze, improve, control) cycle [63], revised according to the framework in Figure 4 and detailed here.

3.2.1. Problem Identification

To identify all the problems, briefing activities were carried out. These included: (i) procedure definition, (ii) data collection sheet definition, (iii) audit, and (iv) noncompliance (NC) data collection. The most effective tool used in this phase was a noncompliance checklist designed for data collection.

3.2.2. Problem Prioritization and Selection

After listing and prioritizing the identified problems according to a Pareto chart cumulating the recurrence, the most frequent one was selected: incomplete thread of the support housing screw.

3.2.3. Problem Definition

In this phase, regarding the problem (incomplete thread of the support housing screw), the process focusing on the interested station was analyzed. The value stream mapping (VSM) tool was applied to the process flow diagram to detect possible inefficiencies or wastes. It highlighted how the retapping of the thread occurred, after an initial tapping by the supplier. This repeated tapping was identified as a possible source of inefficiency because it added no value.

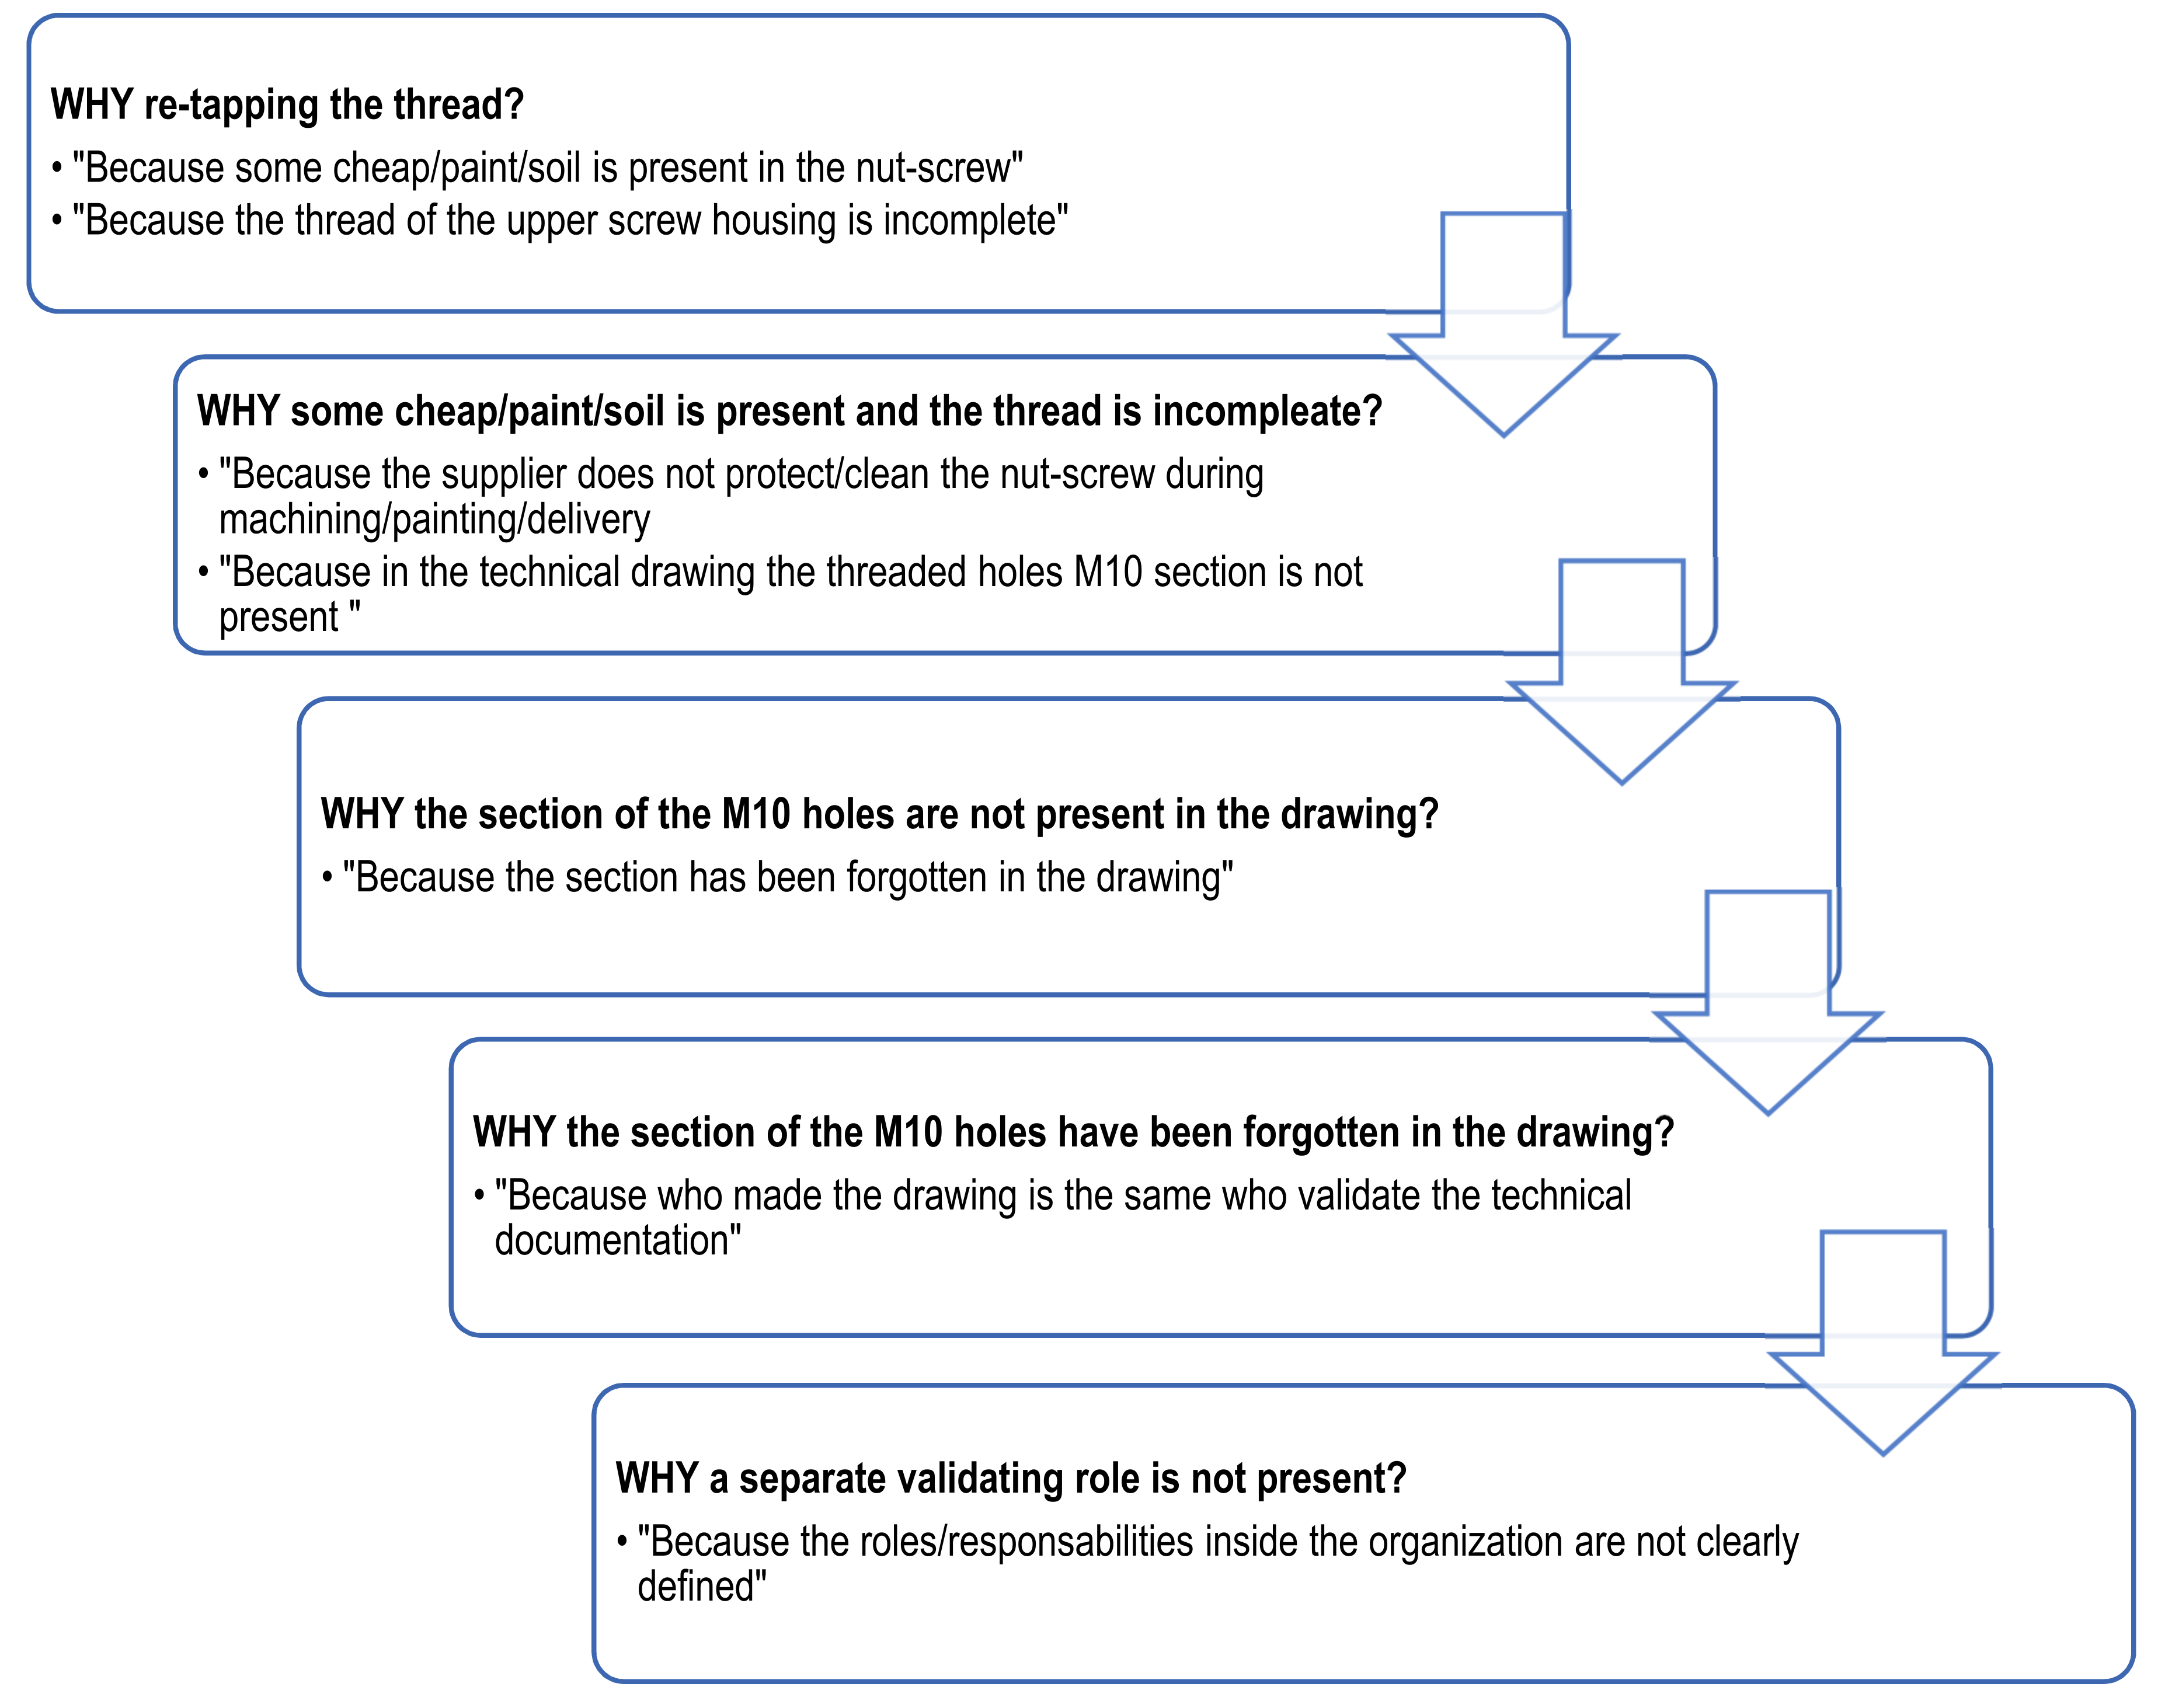
3.2.4. Problem Analysis

In this phase, the causes of the selected NC were investigated by applying the classical lean 5 whys tool, as shown in Figure 5. Starting from the circumscribed problem identified in Section 3.2.3, five “Why?” questions were asked, in an effort to determine the root causes. The first question in the chain was: why re-tapping the thread?
The two identified root causes:
(a)
External: generated by the supplier (because the supplier does not protect/clean properly the nut-screw during manufacturing/painting/delivery).
(b)
Internal: generated by the technical office (because the section of the M10 holes is not present in the technical drawing).

3.2.5. Focus Definition

To face the two identified root causes, a graphic new lean tool for strategy implementation is proposed in Figure 6: the problem focusing matrix (PFM).
In the case of a specific problem, like that in the present case study, the functional area that suggests lighter strategies was considered. If the problem affected the whole organization, systemic action would need to be considered.
For example, in the case of external/cross-functional systemic problems, the theory introduced by Kraljic [64] as well as Olsen and Ellram [65] required more attention, in contrast with smaller, easy-to-solve problems.
Focusing on the two root causes identified in Section 3.2.4,
In cause (a), the team is basically functional and focused on the manufacturing area. The problem is caused by an external issue: the supplier. In this scenario, the suggested strategy is supplier notification.
In cause (b), the team is basically functional and focused on the manufacturing area. The problem is caused by an internal issue. The head of the department decides how to solve and eventually redesign the process/product.

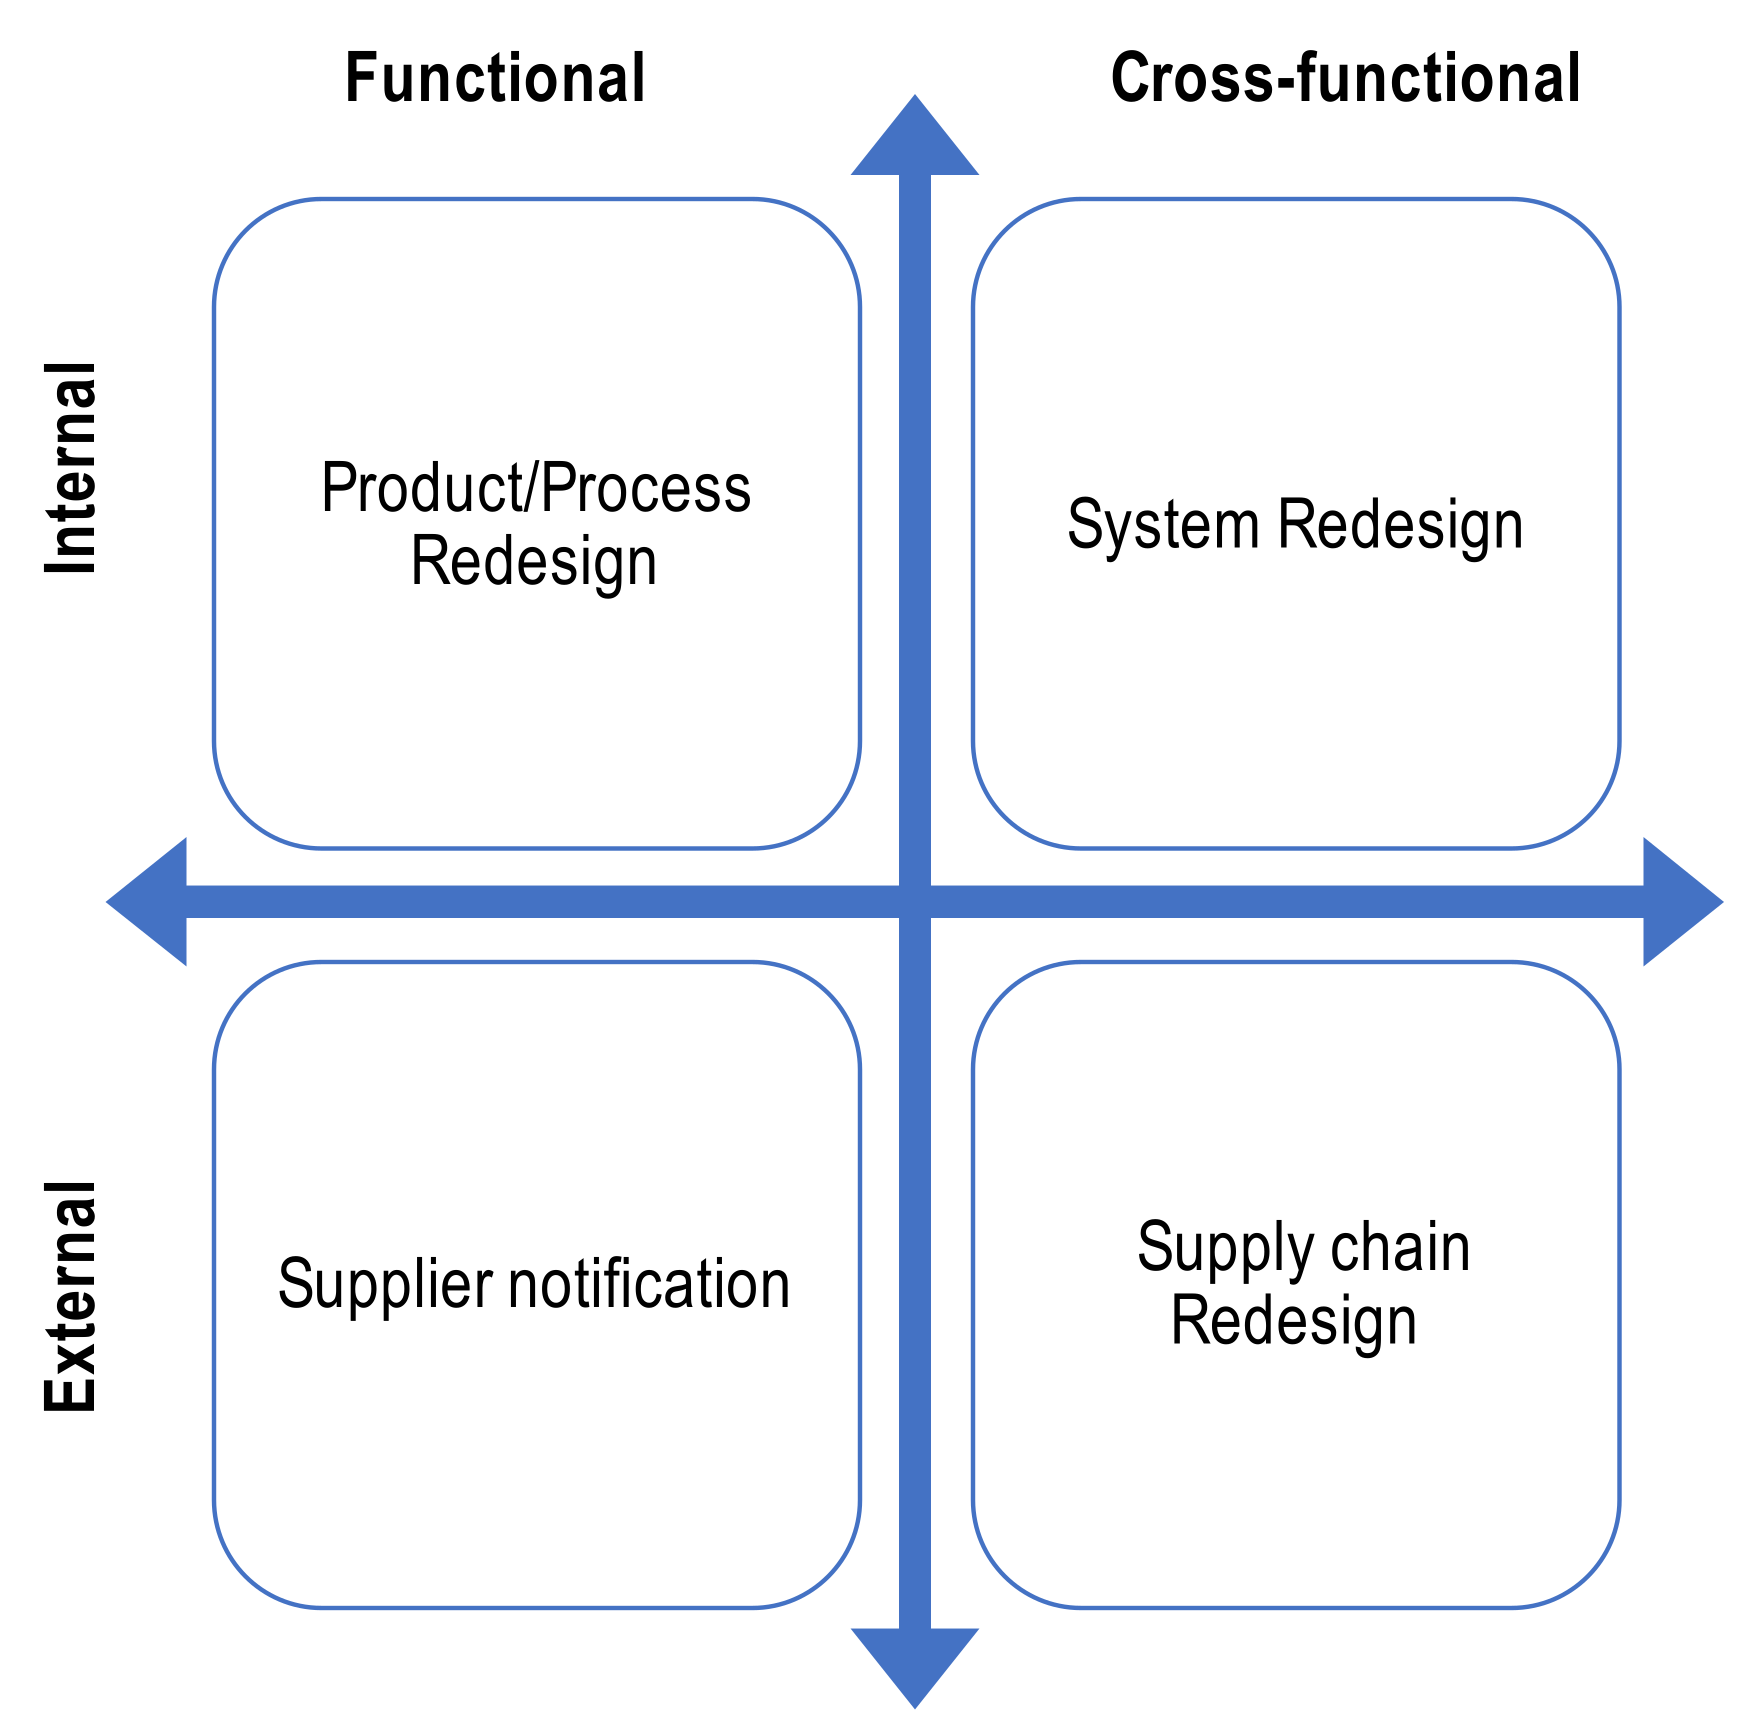
3.2.6. Solution Implementation

To remove the root causes, the PFM defined in Section 3.2.5 can be used as follows:
(a)
“The supplier does not properly protect/clean the nut-screw during manufacturing/painting/delivery”.
Solution: in the case of an external and circumscribed problem like this, the resolution is a simple notification to the supplier to request a preventive action for the regenerating of that NC. Improved communication could help speed up this process.
(b)
“The section of the M10 holes is not present in the technical drawing”:
Solution: Focusing on the internal cause, two actions were adopted: the correction of the technical drawing, and the removal of the root cause—the absence of defined roles/responsibilities. The responsible-accountable-consultant-informed (RACI) tool was a simple and effective way to avoid the repetition of similar issues caused by the absence of formal separation of duties inside the company.
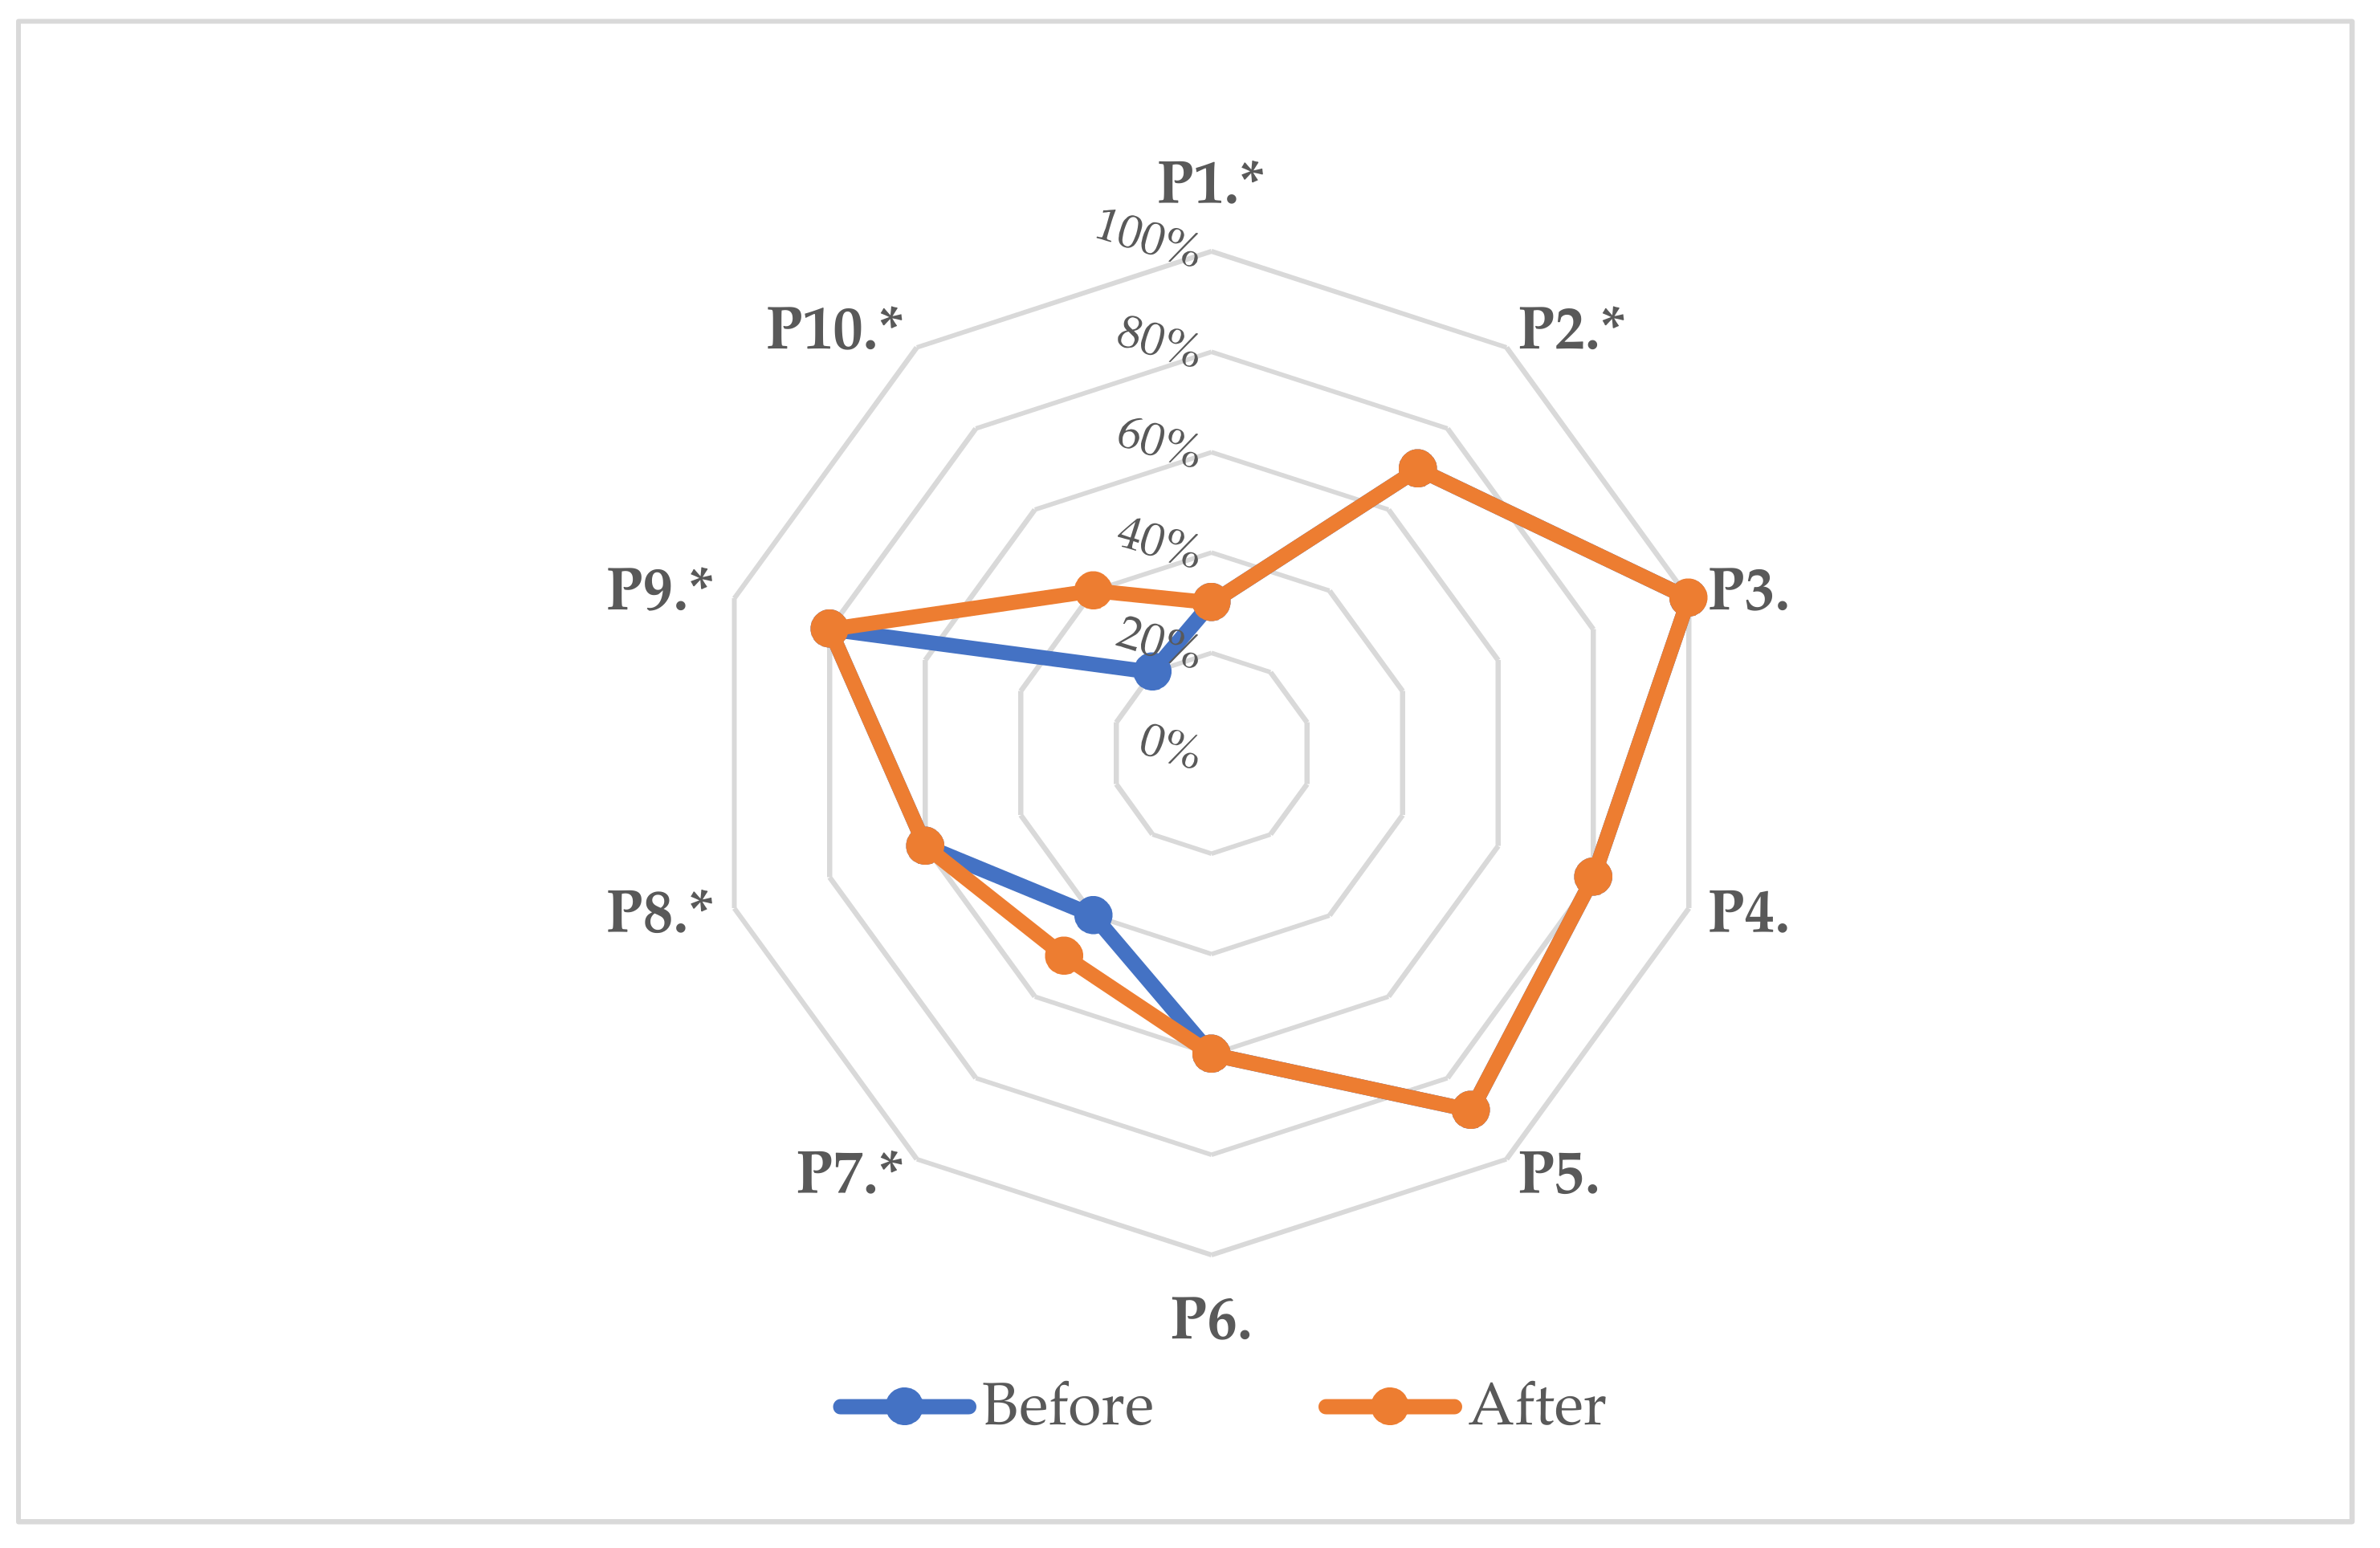
4. Results

The application of the proposed assessment criteria in Table 2 to the examined case provided the evidence and the grades/scores shown in Table 3, and visually represented by a radar graph in Figure 7.
The management of the real ETO industrial company involved in this project identified the priority of investing in the weakest principle, as determined by the analysis in Table 3: continuous improvement.
It was clear that continuous improvement tools and techniques positively affected the following principles:
P10. *: direct effect on continuous improvement, increasing from grade 2 to grade 3 (from 20% to 40%);
P7. *: indirect positive effect on the stakeholders and system integration principles (from 40% to 50%).
Among the numerous lean tools used in the problem-solving process, the VSM and the 5 whys enabled the identification of a source of waste in the production process. By removing the no-value-added activity of retapping, 25 min were deducted from the total station time of ~45 min (or ~55% of the station time).
After the adoption of these improvements, the new overall score on the ten principles increased from 63% to 66%. The objective improvement after repeating the assessment was clear, and can be considered as a validation of the proposed method.

5. Discussion

The presented model is a systematic and easily-implemented tool for ETO companies wishing to move toward lean manufacturing. It offers an objective look at their lean manufacturing maturity level and a way to define improvement paths.
From Figure 7, it can be observed that the ten principles are not completely independent. In particular, continuous improvement indirectly affects stakeholders and system integration (and, to a lesser extent, other principles). Surveys on clusters of ETO manufacturers (e.g., in geographic areas or within specific sectors) may infer statistical evidence to refine the proposed assessment model.
Interferences among other principles were observed, but their low significance did not allow a generalization to be drawn from the examined case. Extensive application in surveys on ETO industrial compartments, company sizes, geographic areas, etc., may infer interferences among lean principles (e.g., leadership and others).
Regarding the stakeholders and system integration principle: the application of the strategies shown in Figure 5 to the two root causes of the proposed matrix enriched a classic problem-solving approach. Namely:
-
In (a), it facilitated collaboration within the company throughout the value chain.
-
The use of the responsible-accountable-consultant-informed (RACI) tool in (b) defined roles and responsibilities within the organization matrix by focusing on the interested parties within the organization.
Regarding lean maturity and the seven kinds of waste [21,22]: the 55% reduction of one production station’s time falls under the waiting time waste class. A formal relationship between the proposed model and the waste to be eliminated is a possible future development.
The current model includes the definition of objective parameters for all the ETO lean principles. Additional mathematical formulas can be included and further refined for a more detailed assessment, e.g., a synthetic method for people management [66], smart sensor outputs [67], and supply chain integration [68].
In Figure 8, a hierarchical representation of the developed model is provided. The principles and criteria have been defined in cascade.
Once the assessment process has been carried out, the resulting evidence can be used as a starting point for improvement activities. The problem-solving approach in Section 3.2 is an example of activity. Figure 8 represents a systematic framework to integrate lean production and the mission of the organization, by exploiting the building blocks represented by the lean tools (exploded in the middle). This area connects the assessment framework and the strategic management.
Further works would help in defining a comprehensive assessment tool focused onto ETO lean practices with direct connections to the elements of the pyramid above. Similar connections were found in the European Foundation for Quality Management (EFQM) model [34,69], the Baldrige award, and the Deming price, which provide a systematic perspective for a future lean ETO award. Such standardized framework may adopt specific lean tools and techniques, e.g., poke-yoke, JIT, SMED, 5S, TPM, and others. An example was provided within the proposed problem-solving approach, including two lean tools (VSM, 5 whys and PFM).
One weak point in the present work is model generalization. The application of the proposed method to a statistically significant number of applications is required.

6. Conclusions

The assessment model presented in this work offered an overall view of lean maturity (from a comprehensive and systematic approach) in an ETO scenario.
The aim of this work was to offer a practical tool that could be easily implemented by ETO manufacturers for as-is mapping and weakness identification. Additionally, the tool would enable monitoring of the manufacturers’ achieved maturity of lean principles.
This work identified ten dominating lean principles from the restricted literature on lean ETO. These principles were further defined through further analysis of the literature that was not specific to ETO. An assessment model for lean ETO maturity was not available and was thus defined by quantitative criteria on five levels, grades, and scores. Four criteria were associated to mathematical formulas.
The real case study presented showed, in detail, the practical application of the lean maturity assessment model, serving as a step toward validation of the proposed model. The problem-solving approach (based on the evidence uncovered during the assessment step) represented a step toward a structured framework to connect the organization mission and management via existing lean tools (VSM and 5 whys) and a newly developed one (PFM).
The proposed method led to more research questions than answers. These have been extensively discussed above.
Among the dominating lean principles in ETO, continuous improvement deserved particular attention, and showed a positive impact on other principles.
A double nested virtual improvement cycle was identified for the proposed model and the lean improvement path.

Author Contributions

Conceptualization, M.L. and M.C.; methodology, F.L. and M.L.; software, M.C.; validation, F.L. and M.L.; formal analysis, F.L.; investigation, M.C.; resources, M.C.; data curation, M.C.; writing—original draft preparation, M.C.; writing—review and editing, F.L., A.R. and M.L.; visualization, F.L.; supervision, M.L.; project administration, M.L. All authors have read and agreed to the published version of the manuscript.

Funding

This research received no external funding.

Institutional Review Board Statement

Not applicable.

Informed Consent Statement

Not applicable.

Data Availability Statement

Not applicable.

Conflicts of Interest

The authors declare no conflict of interest.

References

  1. Womack, J.P.; Jones, D.T.; Roos, D. The Machine That Changed the World; Free Press: Washington, DC, USA, 1992; Volume 35. [Google Scholar] [CrossRef]
  2. Bhamu, J.; Sangwan, K.S. Lean Manufacturing: Literature Review and Research Issues. In International Journal of Operations and Production Management; Emerald Group Publishing Ltd.: Bingley, UK, 2014; pp. 876–940. [Google Scholar] [CrossRef]
  3. Toyota Production System: Beyond Large-Scale Production-Taiichi Ohno. Available online: https://books.google.it/books?hl=it&lr=&id=7_-67SshOy8C&oi=fnd&pg=PR9&ots=YpRxz9wcDZ&sig=UIHS3U_qLIireW7mspYhdunOJ2w&redir_esc=y#v=onepage&q&f=false (accessed on 24 March 2021).
  4. Basu, R. Six Sigma to Fit Sigma. IIE Solut. 2001, 33, 28–33. [Google Scholar]
  5. Dahlgaard, J.J.; Dahlgaard-Park, S.M. Lean Production, Six Sigma Quality, TQM and Company Culture. TQM Mag. 2006, 18, 263–281. [Google Scholar] [CrossRef]
  6. Sundar, R.; Balaji, A.N.; Satheesh Kumar, R.M. A Review on Lean Manufacturing Implementation Techniques. In Procedia Engineering; Elsevier Ltd: Amsterdam, The Netherlands, 2014; Volume 97, pp. 1875–1885. [Google Scholar] [CrossRef] [Green Version]
  7. Sugimori, Y.; Kusunoki, K.; Cho, F.; Uchikawa, S. Toyota Production System and Kanban System Materialization of Just-in-Time and Respect-for-Human System. Int. J. Prod. Res. 1977, 15, 553–564. [Google Scholar] [CrossRef] [Green Version]
  8. Yazdani, B. Toyota Production System: An Integrated Approach to Just-in-Time; CRC Press: Boca Raton, FL, USA, 1995; Volume 8. [Google Scholar] [CrossRef]
  9. Perico, P.; Arica, E.; Powell, D.J.; Gaiardelli, P. MES as an Enabler of Lean Manufacturing. IFAC-PapersOnLine 2019, 52, 48–53. [Google Scholar] [CrossRef]
  10. Susaki, K. New Manufacturing Challenge: Techniques for Continuous Improvement. Available online: https://books.google.it/books?hl=it&lr=&id=6EHtJE8NHD0C&oi=fnd&pg=PR11&ots=BMlbLEXGjX&sig=a-iDbwTHa5JFKRHhku40ABGBc0s&redir_esc=y#v=onepage&q&f=false (accessed on 24 March 2021).
  11. Acero, R.; Torralba, M.; Pérez-Moya, R.; Pozo, J.A. Value Stream Analysis in Military Logistics: The Improvement in Order Processing Procedure. Appl. Sci. 2020, 10, 106. [Google Scholar] [CrossRef] [Green Version]
  12. Kumar Sharma, R.; Gopal Sharma, R. Integrating Six Sigma culture and TPM framework to improve manufacturing performance in SMEs. Qual. Reliab. Eng. Int. 2014, 30, 745–765. [Google Scholar] [CrossRef]
  13. Ikumapayi, O.M.; Akinlabi, E.T.; Mwema, F.M.; Ogbonna, O.S. Six Sigma versus Lean Manufacturing—An Overview. In Materials Today: Proceedings; Elsevier Ltd: Amsterdam, The Netherlands, 2019; Volume 26, pp. 3275–3281. [Google Scholar] [CrossRef]
  14. Sodhi, H.S.; Singh, D.; Singh, B.J. A Conceptual Examination of Lean, Six Sigma and Lean Six Sigma Models for Managing Waste in Manufacturing SMEs. World J. Sci. Technol. Sustain. Dev. 2020, 17, 20–32. [Google Scholar] [CrossRef]
  15. Monteiro, C.; Ferreira, L.P.; Fernandes, N.O.; Sá, J.C.; Ribeiro, M.T.; Silva, F.J.G. Improving the Machining Process of the Metalworking Industry Using the Lean Tool SMED. In Procedia Manufacturing; Elsevier B.V.: Amsterdam, The Netherlands, 2019; Volume 41, pp. 555–562. [Google Scholar] [CrossRef]
  16. Leming-Lee, T.S.; Polancich, S.; Pilon, B. The Application of the Toyota Production System LEAN 5S Methodology in the Operating Room Setting. Nurs. Clin. N. Am. 2019, 54, 53–79. [Google Scholar] [CrossRef]
  17. Lyu, Z.; Lin, P.; Guo, D.; Huang, G.Q. Towards Zero-Warehousing Smart Manufacturing from Zero-Inventory Just-In-Time Production. Robot. Comput. Integr. Manuf. 2020, 64, 101932. [Google Scholar] [CrossRef]
  18. Amrani, A.; Ducq, Y. Lean Practices Implementation in Aerospace Based on Sector Characteristics: Methodology and Case Study. Prod. Plan. Control 2020, 31, 1313–1335. [Google Scholar] [CrossRef]
  19. Marodin, G.; Frank, A.G.; Tortorella, G.L.; Netland, T. Lean Product Development and Lean Manufacturing: Testing Moderation Effects. Int. J. Prod. Econ. 2018, 203, 301–310. [Google Scholar] [CrossRef]
  20. Domingo, R.T. Identifying and Eliminating the Seven Wastes or Muda; Asian Institute of Management: Makati, Philippines, 2003. [Google Scholar]
  21. Realyvásquez-Vargas, A.; Arredondo-Soto, K.C.; Carrillo-Gutiérrez, T.; Ravelo, G. Applying the Plan-Do-Check-Act (PDCA) Cycle to Reduce the Defects in the Manufacturing Industry. A Case Study. Appl. Sci. 2018, 8, 2181. [Google Scholar] [CrossRef] [Green Version]
  22. Vinodh, S.; Arvind, K.R.; Somanaathan, M. Tools and Techniques for Enabling Sustainability through Lean Initiatives. Clean Technol. Environ. Policy 2011, 13, 469–479. [Google Scholar] [CrossRef]
  23. Gehin, A.; Zwolinski, P.; Brissaud, D. A Tool to Implement Sustainable End-of-Life Strategies in the Product Development Phase. J. Clean. Prod. 2008, 16, 566–576. [Google Scholar] [CrossRef]
  24. Yadav, G.; Luthra, S.; Huisingh, D.; Mangla, S.K.; Narkhede, B.E.; Liu, Y. Development of a Lean Manufacturing Framework to Enhance Its Adoption within Manufacturing Companies in Developing Economies. J. Clean. Prod. 2020, 245, 118726. [Google Scholar] [CrossRef]
  25. Henao, R.; Sarache, W.; Gómez, I. Lean Manufacturing and Sustainable Performance: Trends and Future Challenges. J. Clean. Prod. 2019, 208, 99–116. [Google Scholar] [CrossRef]
  26. Melton, T. The Benefits of Lean Manufacturing: What Lean Thinking Has to Offer the Process Industries. Chem. Eng. Res. Des. 2005, 83, 662–673. [Google Scholar] [CrossRef] [Green Version]
  27. Azzi, A.; Battini, D.; Faccio, M.; Persona, A. Mixed model assembly system with multiple secondary feeder lines: Layout design and balancing procedure for ATO environment. Int. J. Prod. Res. 2012, 50, 5132–5151. [Google Scholar] [CrossRef]
  28. Olhager, J. Strategic Positioning of the Order Penetration Point. In International Journal of Production Economics; Elsevier: Amsterdam, The Netherlands, 2003; Volume 85, pp. 319–329. [Google Scholar] [CrossRef]
  29. García, J.G.; Gallego-García, S.; García-García, M. Development of a Pull Production Control Method for ETO Companies and Simulation for the Metallurgical Industry. Appl. Sci. 2020, 10, 274. [Google Scholar] [CrossRef] [Green Version]
  30. Powell, D.; Strandhagen, J.O.; Tommelein, I.; Ballard, G.; Rossi, M. A New Set of Principles for Pursuing the Lean Ideal in Engineer-To-Order Manufacturers. In Procedia CIRP; Elsevier B.V.: Amsterdam, The Netherlands, 2014; Volume 17, pp. 571–576. [Google Scholar] [CrossRef] [Green Version]
  31. Wang, W.; Khalid, Q.S.; Abas, M.; Li, H.; Azim, S.; Babar, A.R.; Saleem, W.; Khan, R. Implementation of POLCA Integrated QRM Framework for Optimized Production Performance—A Case Study. Sustainability 2021, 13, 3452. [Google Scholar] [CrossRef]
  32. Schulze, F.; Dallasega, P. Barriers to lean implementation in engineer-to-order manufacturing with subsequent assembly on-site: State of the art and future directions. Prod. Plan. Control 2021, 1–25. [Google Scholar] [CrossRef]
  33. Moradi-Moghadam, M.; Safari, H.; Maleki, M. A Novel Model for Business Process Maturity Assessment through Combining Maturity Models with EFQM and ISO 9004: 2009. Int. J. Bus. Process Integr. Manag. 2003, 6, 167–184. [Google Scholar] [CrossRef]
  34. Bou-Llusar, J.C.; Escrig-Tena, A.B.; Roca-Puig, V.; Beltrán-Martín, I. An Empirical Assessment of the EFQM Excellence Model: Evaluation as a TQM Framework Relative to the MBNQA Model. J. Oper. Manag. 2009, 27, 1–22. [Google Scholar] [CrossRef]
  35. Doolen, T.L.; Hacker, M.E. A Review of Lean Assessment in Organizations: An Exploratory Study of Lean Practices by Electronics Manufacturers. J. Manuf. Syst. 2005, 24, 55–67. [Google Scholar] [CrossRef]
  36. Pakdil, F.; Leonard, K.M. Criteria for a Lean Organisation: Development of a Lean Assessment Tool. Int. J. Prod. Res. 2014, 52, 4587–4607. [Google Scholar] [CrossRef]
  37. Ali Almomani, M.; Abdelhadi, A.; Mumani, A.; Momani, A.; Aladeemy, M. A Proposed Integrated Model of Lean Assessment and Analytical Hierarchy Process for a Dynamic Road Map of Lean Implementation. Int. J. Adv. Manuf. Technol. 2014, 72, 161–172. [Google Scholar] [CrossRef]
  38. Cil, I.; Turkan, Y.S. An ANP-Based Assessment Model for Lean Enterprise Transformation. Int. J. Adv. Manuf. Technol. 2013, 64, 1113–1130. [Google Scholar] [CrossRef]
  39. Nightingale, D.; Mize, J. Development of a Lean Enterprise Transformation Maturity Model. Inf. Knowl. Syst. Manag. 2002, 3, 15–30. [Google Scholar]
  40. Initiative, L.A. LAI Enterprise Self-Assessment Tool (LESAT) V.2 Facilitator’s Guide; MIT: Cambridge, MA, USA, 2012. [Google Scholar]
  41. Kumar, M.; Vaishya, R. Real-Time Monitoring System to Lean Manufacturing. In Procedia Manufacturing; Elsevier B.V.: Amsterdam, The Netherlands, 2018; Volume 20, pp. 135–140. [Google Scholar] [CrossRef]
  42. International Standard ISO Quality Management—Quality of an Organization—Guidance to Achieve Sustained Success. Available online: https://www.iso.org/obp/ui/#iso:std:iso:9004:ed-4:v1:en (accessed on 7 February 2021).
  43. Krijnen, A. The Toyota Way: 14 Management Principles from the World’s Greatest Manufacturer. Action Learn. Res. Pract. 2007, 4, 109–111. [Google Scholar] [CrossRef]
  44. Koskela, L.J. Application of the New Production Philosophy to Construction Construction Management in Refurbishment Projects View Project Energy and Cost Efficient Design of Buildings View Project; Stanford University: Stanford, CA, USA, 2018. [Google Scholar]
  45. The Toyota Product Development System: Integrating People, Process, and ... -James Morgan, Jeffrey, K. Liker-Google Libri. Available online: https://books.google.it/books?hl=it&lr=&id=K0EHEAAAQBAJ&oi=fnd&pg=PT12&ots=viri-SUuWu&sig=p-tbKsDErG504m7WBTMZRqVTops&redir_esc=y#v=onepage&q&f=false (accessed on 27 March 2021).
  46. Earl, G.; Clift, R. Stakeholder Value Analysis: A Methodology for Intergrating Stakeholder Values into Corporate Enviromental Investment Decisions. Bus. Strateg. Environ. 1999, 8, 149–162. [Google Scholar] [CrossRef]
  47. Hamidi, S.R.; Aziz, A.A.; Shuhidan, S.M.; Aziz, A.A.; Mokhsin, M. SMEs Maturity Model Assessment of IR4.0 Digital Transformation. In Advances in Intelligent Systems and Computing; Springer: Berlin/Heidelberg, Germany, 2018; Volume 739, pp. 721–732. [Google Scholar] [CrossRef]
  48. Mettemich, J.; Böllhoff, J.; Seifeimami, S.; Beck, S. Volume and Mix Flexibility Evaluation of Lean Production Systems. Procedia CIRP 2013, 9, 79–84. [Google Scholar] [CrossRef] [Green Version]
  49. Mikkola, J.H. Mdoularization Assesment of Product Architecture. In Proceedings of the DRUID Winter Conference, Frederiksberg, Denmark, 7–8 January 2000. [Google Scholar]
  50. Storch, R.L.; Lim, S. Improving Flow to Achieve Lean Manufacturing in Shipbuilding. Prod. Plan. Control 1999, 10, 127–137. [Google Scholar] [CrossRef]
  51. Karlsson, C.; Hlström, P. Assessing Changes towards Lean Production. In International Journal of Operations and Production Management; MCB UP Ltd: Bingley, UK, 1996; pp. 24–41. [Google Scholar] [CrossRef]
  52. Plaza-Úbeda, J.A.; de Burgos-Jiménez, J.; Carmona-Moreno, E. Measuring Stakeholder Integration: Knowledge, Interaction and Adaptational Behavior Dimensions. J. Bus. Ethics 2010, 93, 419–442. [Google Scholar] [CrossRef]
  53. Holland, D.; Krause, A.; Provencher, J.; Seltzer, T. Transparency Tested: The Influence of Message Features on Public Perceptions of Organizational Transparency. Public Relat. Rev. 2018, 44, 256–264. [Google Scholar] [CrossRef]
  54. Kundeliene, K.; Leitoniene, S. Business Information Transparency: Causes and Evaluation Possibilities. Procedia Soc. Behav. Sci. 2015, 213, 340–344. [Google Scholar] [CrossRef] [Green Version]
  55. Christensen, L.T.; Cheney, G. Peering into Transparency: Challenging Ideals, Proxies, and Organizational Practices. Commun. Theory 2015, 25, 70–90. [Google Scholar] [CrossRef]
  56. Zhong, R.Y.; Xu, X.; Klotz, E.; Newman, S.T. Intelligent Manufacturing in the Context of Industry 4.0: A Review. Engineering 2017, 3, 616–630. [Google Scholar] [CrossRef]
  57. Vinodh, S.; Kuttalingam, D. Computer-Aided Design and Engineering as Enablers of Agile Manufacturing: A Case Study in an Indian Manufacturing Organization. J. Manuf. Technol. Manag. 2011, 22, 405–418. [Google Scholar] [CrossRef]
  58. Powell, D.; Riezebos, J.; Strandhagen, J.O. Lean Production and ERP Systems in Small- and Medium-Sized Enterprises: ERP Support for Pull Production. Int. J. Prod. Res. 2013, 51, 395–409. [Google Scholar] [CrossRef]
  59. ISO-ISO 9001:2015-Quality Management Systems—Requirements. Available online: https://www.iso.org/standard/62085.html (accessed on 13 February 2021).
  60. Jagtap, M.; Teli, S.N. PDCA Cycle as TQM Tool-continuous improvement of warranty. Int. J. Recent Technol. Mech. Electr. Eng. (IJRMEE). 2015, 2, 1–5. [Google Scholar]
  61. Caffyn, S. Development of a Continuous Improvement Self-Assessment Tool. Int. J. Oper. Prod. Manag. 1999, 19, 1138–1153. [Google Scholar] [CrossRef]
  62. Rauch, E.; Dallasega, P.; Matt, D.T. Critical Factors for Introducing Lean Product Development to Small and Medium Sized Enterprises in Italy. In Procedia CIRP; Elsevier B.V.: Amsterdam, The Netherlands, 2017; Volume 60, pp. 362–367. [Google Scholar] [CrossRef]
  63. De Mast, J.; Lokkerbol, J. An analysis of the Six Sigma DMAIC method from the perspective of problem solving. Int. J. Prod. Econ. 2012, 139, 604–614. [Google Scholar] [CrossRef]
  64. Montgomery, R.T.; Ogden, J.A.; Boehmke, B.C. A Quantified Kraljic Portfolio Matrix: Using Decision Analysis for Strategic Purchasing. J. Purch. Supply Manag. 2018, 24, 192–203. [Google Scholar] [CrossRef]
  65. Olsen, R.F.; Ellram, L.M. A Portfolio Approach to Supplier Relationships. Ind. Mark. Manag. 1997, 26, 101–113. [Google Scholar] [CrossRef]
  66. Lanzetta, M.; Rossi, A.; Puppato, A. Modelling activity times by hybrid synthetic method. Prod. Plan. Control 2016, 27, 909–924. [Google Scholar] [CrossRef]
  67. Rossi, A.; Vila, Y.; Lusiani, F.; Barsotti, L.; Sani, L.; Ceccarelli, P.; Lanzetta, M. Embedded smart sensor device in construction site machinery. Comput. Ind. 2019, 108, 12–20. [Google Scholar] [CrossRef]
  68. Faccio, M.; Persona, A.; Sgarbossa, F.; Zanin, G. Multi-stage supply network design in case of reverse flows: A closed-loop approach. Int. J. Oper. Res. 2011, 12, 157–191. [Google Scholar] [CrossRef]
  69. Wongrassamee, S.; Simmons, J.E.L.; Gardiner, P.D. Performance measurement tools: The Balanced Scorecard and the EFQM Excellence Model. Meas. Bus. Excell. 2003, 7, 14–29. [Google Scholar] [CrossRef]
Figure 1. Graphical paper outline. The assessment model described in Section 2 is developed, starting from the background in Section 1. It is further detailed and validated on a real case study in 3, using an improvement process based on problem solving.
Applsci 11 03833 g001
Figure 2. CODP, also known as freeze point or order penetration point. This refers to the point in the value chain at which a customer triggers a company’s activities [28]. All activities before the CODP share a forecast-driven, push-based approach (dotted lines/arrows). Activities after the CODP are characterized by a customer-driven, pull based approach (continuous lines/arrows).
Applsci 11 03833 g002
Figure 3. Map of ten ETO lean principles.
Applsci 11 03833 g003
Figure 4. The two concentric virtuous loops concerning the (external) assessment model and the (internal) interested organization, respectively.
Applsci 11 03833 g004
Figure 5. The lean 5 whys tool, applied. The answers collected during the interview sessions are shown below each question.
Applsci 11 03833 g005
Figure 6. Proposed problem focusing matrix (PFM): the focus can be internal or external to the organization and it can be focused (functional/operative) or defocused to include multiple functions (cross-function/systemic action).
Applsci 11 03833 g006
Figure 7. Radar graph with the lean maturity grades/scores for the present case study. Before data are taken from Table 4 (blue); After data resulted from the application of the solutions in Section 3.2.6 (orange). (*) denotes a principle whose mathematical definition is lacking.
Applsci 11 03833 g007
Figure 8. The proposed model is the base to achieve the organizational mission by lean tools enablers. The principles and the assessment tool allow the definition of improvement activities. Light green items have been developed in this work, including the new (bold) PFM lean tool, while grey and dotted areas can be addressed in future research.
Applsci 11 03833 g008
Table 1. The ten ETO lean principles from [30] with their Px. Abbreviation in bold font.
ETO Lean Principles
P1.Defining Stakeholders Value
P2.Leadership, People and Learning
P3.Flexibility
P4.Modularization
P5.Continuous flow process
P6.Demand Pull
P7.Stakeholders and System Integration
P8.Transparency
P9.Technology
P10.Continuous Improvement
Table 2. The ETO lean assessment 10 × 5 matrix. For each principle, the lean maturity level, grade, and score range (percentage) are compared in the table header. The criteria and mathematical formulas are derived from the definitions in Section 2.1 and Section 2.2, respectively, according to the references, and are presented in the sections indicated in the last column. The principles labeled with (*) denote a lack of a mathematical definition.
ETO Lean PrinciplesLean Maturity Criteria[Ref.],
(Section)
Grade1234 5
Score[0–20%)[20–40%)[40–60%)[60–80%)[80–100%)
LevelNegligibleLowMediumHighFull
P1. *(i) Stakeholders identification(i) Identification and assignment of the (key) performance attributes or values to the stakeholder group.(i) Definition of value weights through Pairwise Comparison Model, Stakeholders Cluster Method, or others.(i) Calculation of a total value index for each option being assessed by the analysis.(i) Satisfaction of the main concerns of the stakeholders as well as the creation of a new option, possibly based on those originally considered.[46],
(Section 2.1.1)
P2. *(i) Level of commitment among senior leaders and management is variable. Some endorse, while others may actively resist. (ii) Employee competencies are at beginner level and call for theoretical training. (i) Senior management buys into group commitment and engages in the transformation process. (ii) Minimum knowledge of lean philosophy with applications in standard parts of the production process. (i) Senior managers personally and visibly lead enterprise transformation. (ii) Complete knowledge of lean principles with application over entire production process, including training on the job.(i) Senior leaders are championing the transformation within the enterprise. (ii) Conclusion training on the job and beginner implementation of lean techniques across the entire company.(i) Senior leaders and management mentor and foster transformation champions internally and throughout the extended enterprise. (ii) Complete knowledge of lean techniques at all the company levels.[39,40,47],
(Section 2.1.2.)
P3.Formula (1)[48],
(Section 2.1.3.)
(Section 2.3.1.)
(i)Long lead times for customization
(ii) Low capacity of adaptation for customers’ needs.
(i) Moderate lead times for customization.
(ii) Limited capacity of adaptation for customers’ needs.
(i) Average lead times for customization (high volumes and mix).
(ii) Average capacity of adaptation for customers’ needs.
(i) Limited lead times for customization
(ii) Moderate capacity of adaptation for customers’ needs.
(i) The lead time between customer demand dates
and production dates are zero
(ii) Complete flexibility of volumes and mix.
P4.Formula (2)[49],
(Section 2.1.4.)
(Section 2.3.2.)
Product architecture is composed of new components with low replacement, allowing customer minimum mixing and matching.Product architecture is composed of higher numbers of new components and lower numbers of standard components, with limited replacement degrees.Product architecture is composed of both new components and standard components with average replacement degrees.Product architecture is composed of lower number of new components and higher numbers of standard components, with moderate replacement degrees.Product architecture is composed of standard components with higher replacement degrees, allowing clients higher opportunities for mixing and matching.
P5.Formula (3)[50],
(Section 2.1.5.)
(Section 2.3.3.)
Elevated WIP and defects.Moderate level WIP and defectsAverage level WIP and defects.Low level WIP and defectsNo WIP. The process flow is continuous without obstacles or waste.
P6.Formula (4)[51],
(Section 2.1.6.)
(Section 2.3.4.)
Order triggers delivery. The prior activities are forecast-based.Order triggers packaging. The prior activities are forecast-basedOrder triggers assembly. The prior activities are forecast-basedOrder triggers purchasing. The prior activities are forecast-basedOrder triggers engineering; zero activities are forecast-driven
P7. *(i) The company identified all the stakeholders.
(ii) The company frequently has meetings with thestakeholders.
(i)The company consults the stakeholders and asks them for information before making decisions.(i) The company’s formal or informal cooperation with the stakeholders is intense (commitments, collaboration agreements, etc.)(i) Stakeholder participation in the company’s decisions is formal and includes quantitatively relevant information. The company: (i) strives to develop new contacts with all stakeholders, and (ii) dedicates time and resources to assessing and prioritizing the demands of the different stakeholders.[51,52],
(Section 2.1.7.)
P8. *(i) Information divulgations are lacking. (ii) Stakeholders lack a clear message and comprehension.(i) Starting communication between various stakeholders and departments of the company (exchange of elementary information). (i) Average level of information disclosure, clarity, and accuracy among all the interested parties.(i) High level of information disclosure, clarity, and accuracy among all the interested parties (informal).(i) Formal disclosure to all stakeholders through complete clarity as well as accuracy of information.[53,54,55],
(Section 2.1.8.)
P9. *(i) Understand i4.0 enablers.
(ii) Research on technology applications.
(i) Promotion and implementation of i4.0 project for digitalization (hardware/software)(i) Average digitalization of the processes through the product life cycle (CAE).(i) Managerial systems (e.g., ERP).
(ii) Smart factory systems (MES)
(i) Avant-garde technology, as well as a degree of automation. (ii) Extensive cover of i4.0 enablers [56,57,58],
(Section 2.1.9.)
P10. *(i) Senior leaders and management understand the continuous improvement philosophy.
(ii) Awareness of current situation
(i) Study of tools and techniques proposed by continuous improvement and lean methodologies as well (e.g., problem-solving).(i) Structured objective, goal-oriented continuous improvement. (i) Proactive continuous improvement, including application and monitoring of lean tools and methodologies.(i) Senior leaders spread the continuous improvement philosophy and methodologies throughout the organization.[51,59,61],
(Section 2.1.10.)
Table 3. The ten criteria, evaluated on a manufacturer of woodworking machines and lines in an ETO/MTO scenario. Maturity grades and scores are shown. In addition, all evidence for each principle has been summarized. (*) denotes principles where a mathematical formula is not defined.
ETO Lean PrincipleEvidencesLean Maturity
GradeScore
P1. *Little clarity in the stakeholders’ roles in the company emerged. Absence of an organizational chart.230%
P2. *The management is responsibly committed to the achievement of goals and promotes active training on the job.470%
P3.The company adapts to customer requests easily. Result from (1)
F L E X t = 1
5100%
P4.The reuse of standard solutions or parts to produce special machines is common practice. Result from (2)
M u = 0.8
580%
P5.Result from (3)
W I P = 88 %
588%
P6.For the machines analyzed, the assembly process starts after receiving the customer orders. Result from (4)
P u l l   D e g r e e = 60 %
460%
P7. *The company consults the interested parties before making decisions. Meetings are by department, not collective. 340%
P8. *Average level of disclosure. There is no standard, tested system for information disclosure.460%
P9. *The company uses a specific management software (anonymized). The management software includes the customer orders, insertion of the bills of materials and the purchase of the materials necessary for production. Commercial CAD software is implemented.580%
P10. *Senior leaders and management are aware of the continuous improvement philosophy, but lean tools and methods are not actually implemented.220%
OVERALLTen criteria average value463%
Table 4. Four anonymized product types over a period of 2 months for the present case study. Market demand (di) [count], quantity produced (pi) [count].
Product Typedipi
Model A1313
Model B1616
Model C1010
Model D1515
Table 5. Manufacturing data collected for Model A at level 1. Number of interfaces (Kc) [count], number of components in a sub-circuit (nc) [count], interface constraint value ( δ i ) [count], number of sub-circuit interfaces ( K s u b _ c i r c u i t ) [count].
Subcircuits K c n c δ i K s u b c i r c u i t s
Micro4141
Vacuum Switch3133
Sensor3131
Big Case110101
Motor5151
Table 6. Manufacturing data collected for the product Model A at level 2. Number of interfaces for the analyzed subcircuits ( K j ) [count], number of mechanical components at the interface with the subcircuit ( N j ) [count].
Mechanical Components K j N j δ j
Forward Head26132
Rear Head15101.5
Vacuum Switch Support21171.25
Micro Support34172
Table 7. Daily flow time (FT) [min] data collected for 20 days for the product Model A.
Day1234567891011121314151617181920
FT 560 600 605 660 590 585 540 705 645 580 650 560 565 575 555 710 540 625 565 685
Table 8. Conversion table of 1.12 in 88%. The maturity is assumed as a linear with FT, maximal when the FT = CT and minimal when FT = 2 CT.
Percentage [%]WIP [pcs]
1001
801.2
601.4
401.6
201.8
02
Publisher’s Note: MDPI stays neutral with regard to jurisdictional claims in published maps and institutional affiliations.

