Electric vehicles are referred to as vehicles that do not produce any harmful emissions during operation. This is a key factor why electromobility might be a solution to reduce air pollution and the share of unwanted emissions, especially carbon dioxide. The goal of increased representation of EVs in the transport system is the transition to low-emission and non-emission forms of transport, which is a trend strategically defined at the level of the European Commission and is part of a low-carbon economy. Transport is currently responsible for a quarter of greenhouse gas emissions and is the dominant polluter, especially in urban areas. Road transport alone, in which electromobility is to be promoted the most, is responsible for 70% of greenhouse gas emissions in the transport sector. The goal of increased representation of EVs in the transport system is the transition to low-emission and non-emission forms of transport, which is a trend strategically defined at the level of the European Commission and is part of a low-carbon economy. Transport is currently responsible for a quarter of greenhouse gas emissions and is the dominant polluter, especially in urban areas. Road transport alone, in which electromobility is to be promoted the most, is responsible for 70% of greenhouse gas emissions in the transport sector. Emissions from car internal combustion engines also contribute to high concentrations of solid pollutants, which have a major impact on public health and the environment, and are a risk factor for the development of cardiovascular and respiratory diseases especially. The smallest fractions of solid particles especially are demonstrably the cause of many premature deaths in Europe and Slovakia. In Slovakia, transport accounts for more than 40% of total nitrogen oxide (NOx) emissions. The operation itself can be described as ecological, but the actual production of the EV and its components and the way in which electricity is produced is not. It is the energy mix that primarily determines how electromobility will more or less help to improve the overall ecological and emission situation.
3.1. The CO2 Emissions
Transport is responsible for 30% of all carbon dioxide emissions in the EU, with road transport accounting up to 72%. The EU has therefore set the target of reducing CO
2 emissions from transport by 60% by 2050 (compared to 1990 levels). This is a very ambitious plan, especially given that, while CO
2 production is falling in other sectors, emissions in transport are rising with increasing mobility. The trend of developing higher fuel efficiency of new cars has also stopped. After a permanent decrease in the emissions produced by newly manufactured cars, new cars were measured for higher CO
2 emissions in 2017—on average 0.4 g per kilometer more compared to vehicles manufactured in 2016. The European Union is therefore introducing new targets for reducing carbon dioxide emissions. Emission limits should fall by 37.5% for new passenger cars and by 31% for vans by 2030. On 18 April, 2019 members of the European Parliament (MEPs) also approved a proposal to reduce CO
2 emissions from new trucks—by 2030 they should fall by 30% compared to 2019 [
14].
In terms of emissions of new vehicles, compared to other countries of the EU, Slovakia has nothing to boast about. In 2019, Slovakia occupied the second-worst place. Average CO
2 emissions for new cars have risen to 133.4 g/km this year, while the EU average is 121.8 g/km [
14]. At first glance, this is a small difference, but it is abysmal because the rest of the EU is fleeing to lower emissions. The lower share of diesel vehicles in Slovakia was also contributed to higher emissions by 25% compared to 32% in the European Union. While in 2018 they still had a share of 30.1% in registrations, last year their share decreased to 25.1%. Petrol, which has lower emissions of nitrogen oxides (NO
x) but produces more CO
2 due to lower efficiency, was more successful. Their share increased from 66.49% to 69.9%. Of the alternative drives, only hybrids have succeeded with only 4.24%. BEVs, even though they were a big topic last year due to state subsidies for their purchase, they occupied only 0.16% of the market. According to an EU regulation, a car manufacturer after 2021 must produce only 95 g of carbon dioxide emissions per kilometer, otherwise, the car manufacturers will be forced to pay a corresponding fine. By 2030, car manufacturers should be offering at least 35% BEVs and PHEVs. Electromobility is therefore one way of reducing ever-increasing emissions. [
14] In order to calculate an EV’s impact on the environment, it is necessary to consider the energy mix that is characteristic of the country. Emissions from the manufacture and disposal of a vehicle are higher for an EV than for an internal combustion EV (ICEV) [
15] (
Figure 5).
If energy were produced only in coal-fired power plants, the emissions associated with fuel production would far outweigh internal combustion engines, in which case electromobility would be meaningless. In contrast, the energy obtained mainly from renewable sources is taken as the most ecological way that countries, not only in Europe, should apply. In particular, Asian countries such as India, China and Indonesia are facing this problem because much of their energy production comes from coal-fired power plants, which is why carbon dioxide emissions are highest in these countries. By contrast, France or Sweden, which use mainly nuclear sources, where electricity is mainly produced from renewable sources, has a satisfactory level of emissions from EVs. A more detailed description of the emission load for each country is shown in
Table 2 [
16].
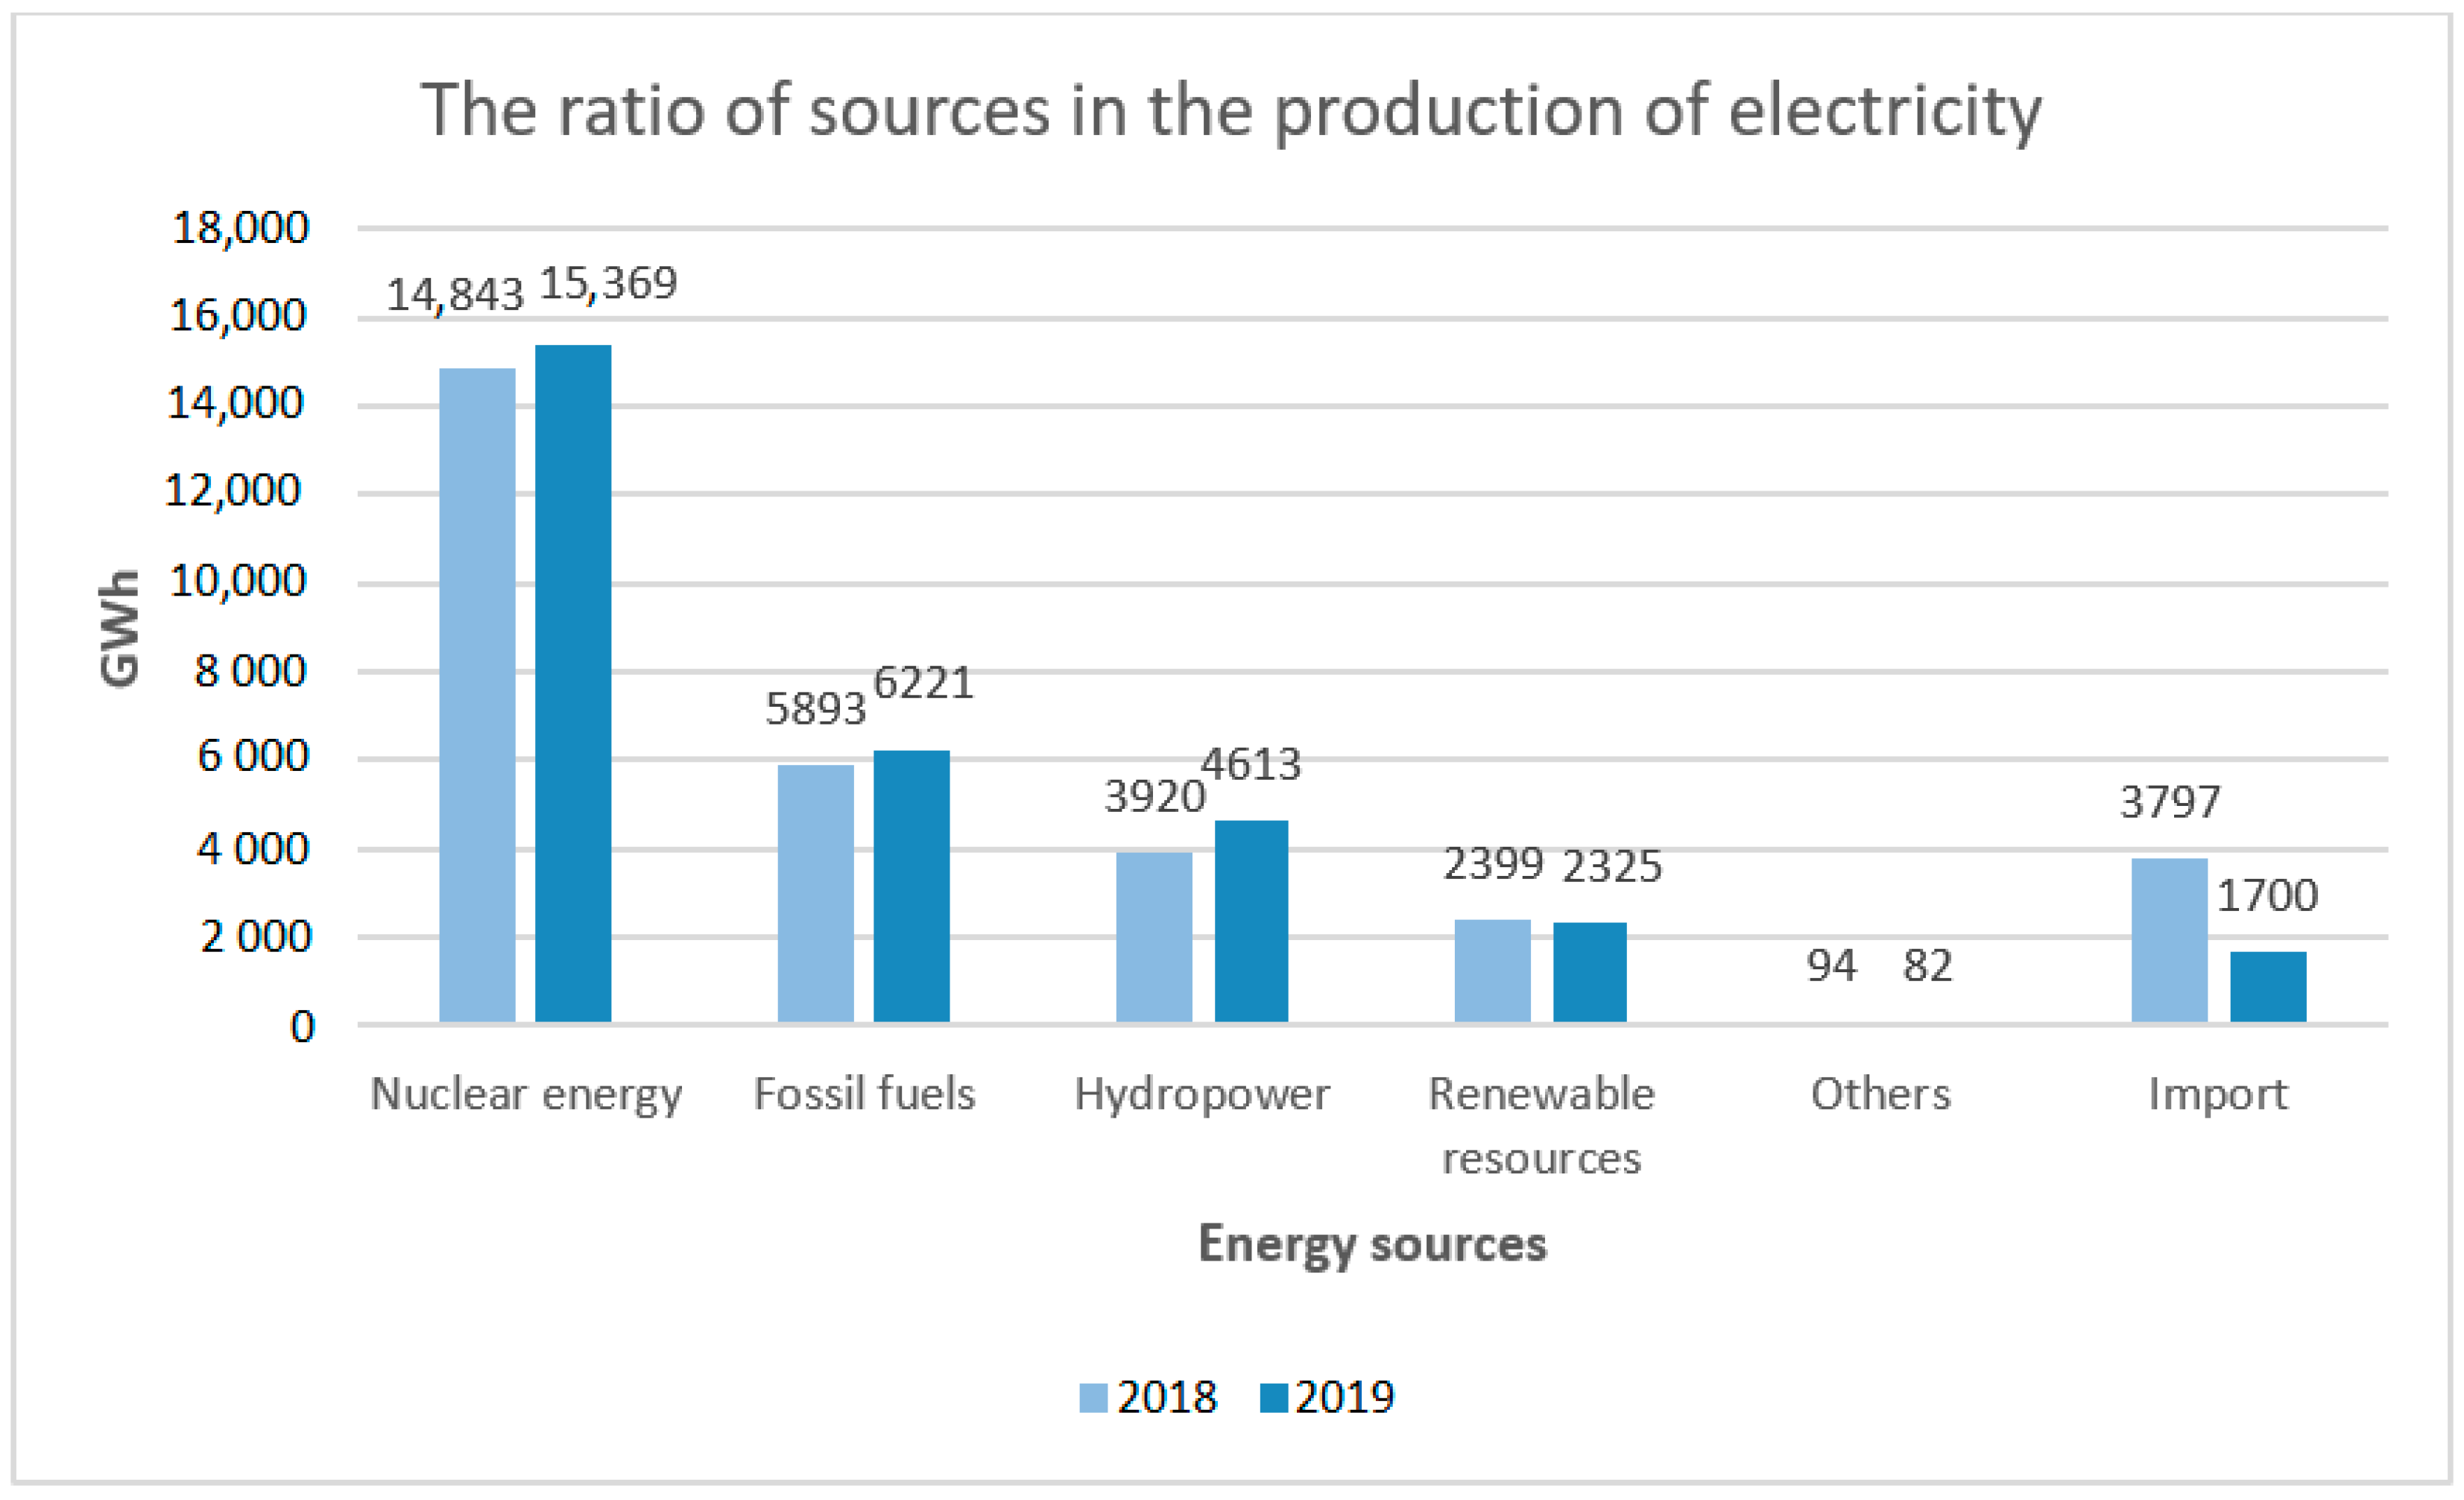
To calculate CO
2 emissions in the Slovak Republic, it is first necessary to take into account the energy mix of the country (
Table 3). More than half of the electricity supplied (55%) comes from nuclear power, about a quarter (26.9%) from fossil fuels and less than a fifth (18%) from renewable energy sources (RES).
It is also necessary to indicate the emissions that will be produced by power plants using individual fuels (
Table 4) related to the kWh produced. In the case of hydro, solar, wind and nuclear power plants, emissions from the production of these power plants are also included and are therefore not considered to be completely emission-free. For coal-fired power plants, calculations were performed to determine the exact values of carbon dioxide emissions.
The CO
2 emissions that result from the production of 1 kWh by burning a corresponding amount of brown coal can be quantified by the following calculation, in which the amount of coal needed to produce 1 kWh is first determined and then the carbon dioxide emission value is calculated for this amount. The first step in the calculation is to determine the output of brown coal power plants:
where
is electricity produced by brown coal power plants (GWh/year),
is total electricity production in 2019 (GWh/year) and
is the ratio of brown coal in the energy mix of the Slovakia [
10].
The conversion obtains:
where
is the average power of brown coal power plants (MW) and
is number of hours per year.
It is also necessary to consider the heat value of brown coal, which is commonly used in Slovakia. At present, brown coal in Slovakia has an average heat value of 11 MJ/kg. Furthermore, the thermal efficiency in the production of energy in coal-fired power plants is considered, which is around 38% [
18].
where
is amount of brown coal consumed in coal-fired power plants per one hour (kg/h),
is the average power of brown coal power plants (kW),
is thermal efficiency of coal power plants and
is heat value of brown coal (kJ).
In order to determine the amount of brown coal needed to produce 1 kWh, the following calculation is used:
where
is amount of brown coal to produce 1 kWh (kg/kWh).
From this value, the amount of CO
2 produced by burning a specified number of brown coals is then determined. First, the proportion of carbon in this fuel is determined. The composition of coal is commonly stated as:
where
C, H, S, O, N corresponds to the percentage of flammable components of each element (%),
W is water content (%) and
A is ash content (%).
Carbon is represented by about 26.4%. Thus, one kilogram of brown coal corresponds to 0.264 g of carbon [
19].
If ideal combustion is considered, the following equation is used:
Based on the determined molar masses (see
Table 5), the molar mass of carbon dioxide can be determined and then the amount of carbon dioxide produced by burning 1 kg of carbon can be determined.
where
is molar mass of carbon dioxide (g/mol),
and
is the molar mass of carbon and oxygen (g/mol), respectively, then:
where
is amount of carbon dioxide produced by burning 1 kg of carbon (kg).
This value multiplied by the carbon content of brown coal according to [
18] determines the amount of CO
2 produced by burning 1 kg of brown coal, as follows:
where
is amount of carbon dioxide produced by burning 1 kg of brown coal (kg) and
is percentage of carbon in brown coal.
The resulting value of carbon dioxide produced by burning the amount of brown coal needed to produce 1 kWh will be:
where
is the value of carbon dioxide released during the production of 1 kWh (kg/kWh).
Such a structured calculation can also be performed to determine CO
2 emissions from the combustion of black coal. It is necessary to recalculate all formulas with the corresponding coefficients, consider the ratio of black coal in the energy mix, its heat value and the percentage of carbon. An almost identical calculation with the changed values results in 1.306 kg of carbon dioxide, which is produced by burning the amount of black coal needed to produce 1 kWh. From these data it is possible to calculate carbon dioxide emissions corresponding to one kilowatt hour produced based on the following formula:
where
represents the total mass of CO
2 related to the production of 1 kWh (g/kWh),
represents the mass of CO
2 according to the type of fuel (n) per 1 kWh (g/kWh) and
represents the percentage ratio of individual energy sources in the energy mix of Slovakia.
In order to be able to use this value, it must be converted to CO
2 emissions per kilometer. First, it will be based on ADAC’s measured consumption of EVs from
Table 1, which is multiplied by a coefficient including charging losses. This value is 25.73 kWh/100 km and is further calculated as follows:
where
is the amount of CO
2 emissions driven per kilometer (g/km) and
is the average consumption of EVs based on
Table 1 (kWh/100 km).
In the current energy situation, the value of carbon dioxide emissions per kilometer of EV is almost 50 g more than allowed by the prescribed standard for 2021. This value is mainly influenced by fossil fuels, which are now still abundant in the domestic energy sector. It is expected that their use will decrease in the future and low-emission energy sources, especially renewables and nuclear sources, will be preferred. In such an expected course, emissions from EVs would fall significantly and, from an ecological point of view, electromobility would help to eliminate these emissions. To illustrate, following example explains: if the ratio of fossil fuels in the energy mix of the Slovak Republic was halved and the ratio of renewable energy sources increased proportionally, the EV would reach a value of approximately 66 g of carbon dioxide per kilometer.
3.2. The Rest of the Emissions
Other significant emissions are nitrogen oxides, commonly referred to as NO
x, most commonly referred to as nitric oxide NO and nitrogen dioxide NO
2. Due to these and other pollutants, EURO emission standards have been introduced in the European Union since 1992. These standards control and regulate the amount of not only nitrogen oxides, but also carbon monoxide (CO), hydrocarbons (HC) and particulate matter (PM) per kilometer driven. These standards are gradually being modernized, adjusted and new ones are being published at intervals of about five years. Newly issued standards are numbered depending on the type of vehicles for which they are intended. For passenger vehicles and light commercial vehicles, the standard is given in Arabic numerals and for buses and heavy trucks, the standards are indicated by Roman numerals. It is important to mention that the standard only applies to vehicles that are newly introduced on the market. The latest valid standard is EURO 6, which came into force in 2015 (see
Table 6), which was later further tightened by version 6.2. A new emission measurement methodology has started to be applied, which is more demanding, more accurate and better suited to real driving style. It is a method of laboratory testing WLTP (worldwide harmonized light vehicle test procedure). In addition to laboratory testing, the RDE (real driving emissions) cycle is also used to measure emissions, so measurements are made directly on the road. The new standard applies to all manufactured vehicles, including older models. For car manufacturers, this means modifying selected engines [
21,
22,
23,
24,
25,
26,
27,
28].
The emissions of the EV will be related to the value of emissions released into the air by the power plants in the production of the required electricity, similarly as it was for the determination of carbon dioxide emissions. In the calculation, it is necessary to know the emission factor of different types of power plants producing harmful emissions in relation to the amount of electricity produced, which is shown in
Table 7.
where
,
,
are the amounts of NO
X, CO and PM emissions from selected types of power plants (g/kWh),
is the emission factor of the power plant (g/MWh) and
represents the percentage ratio of individual energy sources in the energy mix of Slovakia.
These values relating to the NO
X, CO and PM emissions generated during the production of 1 kWh will be converted into emissions generated during driving an EV, per 1 km:
where
,
,
are the amounts of CO
2 emissions per 1 km of ride (g/km) and
is the average consumption of electric vehicles based on
Table 1 (kWh/100 km).
It is obvious from
Table 8 that the emission values recalculated for the electric vehicle are not in all cases in favor of electromobility. For nitrogen emissions, the value per kilometer driven by an electric vehicle exceeds the prescribed European standard for diesel engines by almost three times, the standard for petrol engines by almost four times. The higher value of these emissions is caused mainly by the significant ratio of coal-fired power plants in our territory, which are among the major sources producing these pollutants. Emissions of carbon monoxide are forty times lower than allowed by the standard for petrol engines, and since transport, in particular, contributes to the production of this greenhouse gas, it can be said that electromobility would make a significant contribution to the improvement of this issue. In addition, particulate matter (PM) emissions are significantly lower for electric vehicles than for diesel engines. All values are compared to the EURO 6 standard, which represents the worst permissible pollution. It can be assumed that many vehicles exceed this standard many times over.
In summary, electromobility can be a tool not only for new vehicles to comply with emission requirements and standards, but also to improve the environmental situation and reduce overall emissions and pollutants.


