Abstract
The oil pollution of seas is increasing, especially in local areas, such as ports, roadsteads of the vessels, and bunkering zones. Today, methods of monitoring seawater are costly and applicable only in the case of big ecology disasters. The development of an operative and reasonable project for monitoring the sea surface for oil slick detection is described in this article using drones equipped with optical sensing and artificial intelligence. The monitoring system is implemented in the form of separate hard and soft frameworks (HSFWs) that combine monitoring methods, hardware, and software. Three frameworks are combined to fulfill the entire monitoring mission. HSFW1 performs the function of autonomous monitoring of thin oil slicks on the sea surface, using computer vision with AI elements for detection, segmentation, and classification of thin slicks. HSFW2 is based on the use of laser-induced fluorescence (LIF) to identify types of oil products that form a slick or that are in a dissolved state, as well as measure their concentration in solution. HSFW3 is designed for autonomous navigation and drone movement control. This article describes AI elements and hardware complexes of the three separate frameworks designed to solve the problems with monitoring slicks of oil products on the sea surface and oil products dissolved in seawater. The results of testing the HSFWs for the detection of pollution caused by marine fuel slicks are described.
1. Introduction
The volume of sea pollution by oil products as a result of sea transport and the operation of technical facilities is constantly increasing. Global disasters do not happen often, but they lead to considerable volumes of pollution and severe damage to the environment. Such disasters attract general attention, and huge funds are allocated for their elimination. In the case of a global-scale disaster, all possible methods are used, including satellite, aircraft, and vessel approaches. They are starting points for the development of technologies for preventing such disasters and methods for monitoring them. However, less noticeable regional-scale pollution occurs almost daily, and, to date, pollutions of such scale account for 30% to 50% of the total volume of ocean pollution [1,2]. The main sources of such pollution include the discharge of bilge water by vessels, incidents related to the bunkering of vessels, malfunctions of oil pipelines, and other technical facilities. In most cases, they are local and difficult to detect.
There is a lack of relatively cheap equipment for operatively monitoring such local incidents, and this is a problem. Methods and equipment, which are used for global disasters, are impossible to use in this case due to their cost and spatial resolution. The most probable places where small-scale pollution occurs are the water areas of ports, port roadsteads, bunkering areas of vessels, water areas with the most intensive shipping, and places of extraction and transportation of oil or oil products. The dimensions of the water areas that must be inspected in such cases, as a rule, do not exceed some kilometers.
In the case of pollution on such a scale, it is necessary to register not only the presence of slicks on the sea surface from oil products but also the excess of permissible concentrations of dissolved oil products in seawater, which are contained in the bilge waters of vessels. According to the MARPOL Convention, the maximum permissible concentration of oil products in bilge waters is 15 ppm [3]. However, an oil slick is not formed on the water surface above the water discharge point in all cases when the concentration of dissolved oil products exceeds the value of 15 ppm. The formation of slick depends on the concentration of oil products in the bilge waters and the hydrological parameters of the seawater into which the discharge is made.
Thus, monitoring tools should not only ensure the detection of slicks of oil products on the sea surface, determine their volume, and provide the ability to measure the concentration of dissolved oil products in the subsurface layer, but also determine the types of oil products in slicks or solutions to identify sources of pollution.
All possible monitoring methods that exist to date [4,5,6,7,8,9,10,11], as well as the capabilities of drones that can be used as carriers of hardware and software monitoring systems, were analyzed, thus allowing the determination of methods used to develop a hardware and software monitoring framework for drones. The method of computer vision was used to monitor the slicks of oil products on the sea surface; thus, slicks were the objects of detection and classification. The method of laser-induced fluorescence (LIF) was developed to identify the types of oil products and to measure the concentration of the oil product solution. Thus, a combination of a passive optical monitoring method (computer vision) and an active laser-induced fluorescence spectroscopy method was used in this work.
The first task was to adapt the computer vision method for monitoring oil slicks. The process of slick monitoring itself is divided into two stages. The first stage is detecting the slick on the sea surface. Appropriate datasets for computer vision learning were collected for detection. In the case of thin slicks formed by different types of fuel, it is important to determine with a high probability that this spot is oil pollution, i.e., that the observed slick is not a biogenic slick or is not caused by hydrophysical processes in the ocean (internal waves, upwelling, etc.) [12,13,14,15]. To solve this problem, the deep learning procedure was carried out for real images of marine fuel slicks, which were detected at different times in the coastal zone of Peter the Great Bay. The second stage of adaptation of the computer vision method for monitoring oil slicks on the sea surface is the development of an artificial intelligence (AI) element for autonomous segmentation and classification of slicks. In this work, we consider only thin slicks of oil products, because the method of the oil appearance code (BAOAC) may be applied and was adopted in the Bonn Agreement for such slicks [16,17]. Estimates of slick thickness and pollution volumes can be made by dividing real thin slicks into color-coded segments. This approach is only valid for thin slicks of oil products and cannot be used to monitor crude oil slicks, unlike an AI element for slick detection.
The second task was to adapt the LIF method for a drone. The method should provide the possibility of measuring the LIF spectrum when the drone hovers overhead the slick and of measuring the LIF spectrum in the subsurface layer to register dissolved oil products in seawater and measure their concentration. A small-sized laser LIF spectrometer was developed, which can be used on a small-sized drone, to solve this task. The AI element is necessary for an autonomous determination of the type of oil products contained in a slick or a dissolved state, as well as a determination of the concentration of solutions in the latter case. Collection of appropriate datasets, including LIF spectra from various oil products, and appropriate calibrations are required to determine the concentration of solutions of oil product in seawater.
The third task of this work was to develop the carrier itself—a drone that adapts to monitoring tasks and should provide monitoring in various modes: passive optical monitoring of the sea surface using computer vision, active laser sensing of the sea surface, or subsurface sensing using LIF spectroscopy. The specificity of such a drone is autonomy of the monitoring mission, including in areas remote from the coastal zone, and a vessel. Therefore, the software (drone artificial intelligence) is designed for autonomous navigation and motion control, the ability of autonomous landing on water, and a moving object.
Thus, all three tasks were combined in the development of a hardware and software framework for the drone (HSFW), which includes all hardware for passive and active monitoring, software that provides autonomous monitoring, autonomous navigation, and flight control of the drone, and the drone itself—the carrier of this hardware and software framework. Due to the complexity of the hardware and software parts, the framework was divided into three separate but interacting sub-frameworks, which include hardware and software, combined according to their functionality: the hardware and software sub-framework of passive optical monitoring (drone computer vision)—HSFW1, the hardware and software sub-framework of active LIF spectroscopy—HSFW2, and the hardware and software sub-framework of navigation and drone motion control—HSFW3.
Here and below, the term framework includes hardware, since the hardware is combined into complexes to reach one functional purpose, but which can change and expand depending on the specific conditions and monitoring tasks. Thus, for example, in the simplest version of the autopilot, when there is a stable GNSS signal, there is no need for a camera to determine the drone position. However, in the case of a poor GNSS signal, which often occurs in shelf waters, far from ports (and especially in high latitudes), a local positioning system is necessary to be installed on the drone for an autonomous monitoring mission (SLAM system [18]). This system is based on linking to any image, for example, to a vessel from which a drone takes off. In this case, an additional camera and corresponding software are necessary to be added to the HSFW3, which is functionally designed for autonomous navigation. The same is true for hardware and software intended directly for the monitoring process.
Therefore, in this work, the adaptation of active sensing using LIF spectroscopy and passive sensing, which is based on the analysis of an optical image of oil product slicks on the sea surface, to a specialized carrier, i.e., a drone, was carried out. The drone itself was also designed for autonomous monitoring of marine pollution using the optical sensing method.
The article includes the following sections: Section 2 describes the results of the development of HSFW1—passive optical monitoring. Section 3 presents the main results of the development of HFSW2 and the LIF spectroscopy method for determining the types of oil products in slicks and solutions, as well as measuring the concentration of solutions of oil products contained in seawater using a drone. Section 3 shows the design and parameters of the laser LIF spectrometer for a drone. A short overview of the works in which the LIF spectroscopy method was used for monitoring water areas on drones is given. Section 4 describes the basic principles of developing the navigation and flight control sub-framework—HSFW3. The main characteristics of a specialized drone, which was developed specifically for the mission of monitoring oil pollution at sea, are presented. Section 5 is a description of the structure and principles for the development of the HSFW complex. Section 6 contains descriptions of the main results obtained from testing the HSFW and discusses the results. Section 7 is the conclusion.
2. Hardware and Software Sub-Framework for Passive Optical Sensing of Oil Slicks on the Sea Surface (HSFW1)
The hardware part of the offshore oil slick monitoring sub-framework (HSFW1) includes a video camera and a computer. The software part of the HSFW1 consists of an AI detection element, which only detects the presence of a slick on the sea surface, and an AI element of segmentation and classification of slick, allowing the slick to be classified on the basis of a certain oil appearance code, thus enabling an estimation of the slick thickness. The first element is applicable to all slicks regardless of their thickness, including crude oil slicks. The second element works only with thin slicks of oil products.
The learning procedure for the first element was carried out on real images of slicks of oil products obtained at different periods when monitoring real pollution using a drone. The Python programming language was used to create this software component. A library of computer vision algorithms, image processing, and general-purpose numerical algorithms with open-source OpenCV was used to work with images. The neural network architecture YOLOv3-tiny [19], implemented using the Keras library with the Tensorflow framework, was chosen as a system with an object detection component. This architecture can be used on low-performance microcomputers such as the Raspberry pi 3, which are quite suitable for a small-sized drone. The performance of this element was tested on real pollution in Peter the Great Bay. The sources of pollution were accidents during bunkering. Figure 1 shows a fragment of the operation of the element for recognizing oil slicks. The element gives the probability that the registered slick is a slick formed by oil products. The probability value for the two slicks is shown in the images. In this case, these values are 0.9 and 0.8, interpreted as slicks of oil products. During the learning, the detection criterion was used; thus, the slick was fixed on the sea surface at a probability value of 0.65. The element can estimate the area of pollution after detecting a slick formed by oil products on the sea surface.
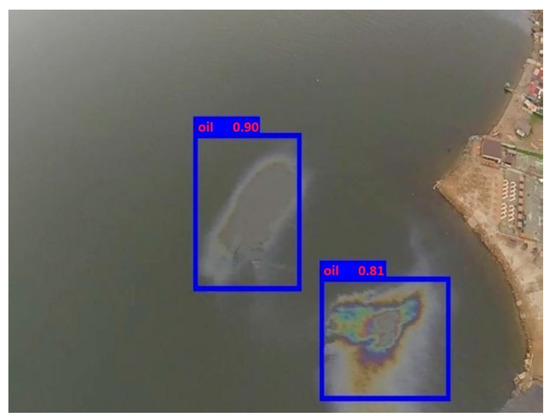
Figure 1.
Oil slick detection using the AI elements of HSFW1.
It should be noted that we did not have a sufficient number of images of crude oil slicks on the sea surface. Therefore, the dataset for learning the neural network to detect crude oil slicks contained a small number of slick images. A significant collection of images for the dataset of crude oil slicks on the sea surface is required to provide the reliable operation of this element.
This software element for the recognition of oil slicks on the sea surface is a complete product and may already be used separately if the measurement of slick thickness is not required. The measurement of the slick area may also be done with no necessity to determine the types of oil products. In this case, autonomous optical remote sensing is realized with one video camera and the raspberry pi 3 microcomputer, and it represents a very reasonable option for detecting oil slicks on the sea surface.
An AI element was developed as a software component with appropriate neural network architecture for image and video analysis to solve a more complex problem of thin slick (semantic segmentation) classification. The Python programming language was used to create this software component. To work with images, a library of computer vision algorithms, image processing, and general-purpose numerical algorithms with open-source OpenCV was used. The Mask R-CNN neural network architecture [20], implemented using the Keras library with the Tensorflow framework, was chosen as a system with an object segmentation component. The component was taught to detect and analyze images of marine fuel slicks on the water surface using deep learning methods. The Mask R-CNN architecture is a further development of the Faster R-CNN architecture with an additional branch that predicts the position of the mask covering the found object and, thus, solves the segmentation problem in this method. This also applies to image recognition. Datasets with real pollution monitoring of bunkering accidents were used for learning.
The operation of the element is based on the system of codes proposed in the Bonn Agreement. Each code identifies a slick that has a specific color and can be assigned to a specific range of thicknesses. Table 1 shows the correspondences of codes and slick thicknesses taken from [16].

Table 1.
The Bonn Agreement oil appearance code.
The operation of the element was verified in the process of autonomous monitoring of a marine fuel slick that occurred during bunkering of the vessel. When an oil slick is detected, which can be attributed to thin slicks of oil products, the area in the image is outlined along the contour of the detected object and, hence, segmentation is carried out. The analyzed spot is represented as a highlighted area in the image. The area already selected by segmentation can be divided into several others related to different codes (rainbow, sheen, metallic, etc.), has along with its thickness. The pixels of the image related to the rainbow are highlighted, and the area of the rainbow slick is determined. The remainder of the program element refers to other codes (sheen, metallic, etc.). Having selected the spots, one can make an approximate estimate of the slick area and assign certain thicknesses to all the spots that were previously assigned to the color codes. The oil slick volume is estimated using the percentage of these areas and their area.
Figure 2a,b show an image of a marine fuel slick, which was recorded by the detection element (Figure 2a) and the result of the operation of the AI element according to the classification of an oil slick (Figure 2b). In Figure 2b, colors show different fragments of the spot, which are classified as different types of slick in terms of thickness and assigned to different codes. The dark gray color marked “a” corresponds to code 3—“metal”, green fragment of the slick, “b” corresponds to code 2—“rainbow”, fragment, and “c” corresponds to code 1—“silver-gray”.
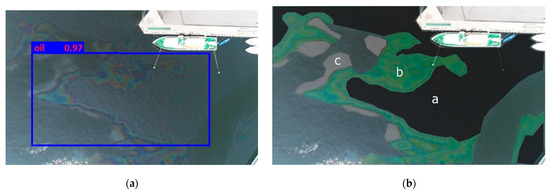
Figure 2.
(a) The result of the operation of an artificial intelligence element HSFW1 for detecting an oil slick; (b) the result of oil slick segmentation and classification by different codes.
A computer that is more productive than the raspberry pi 3 is required to implement this kind of remote sensing. Here, we used NVIDIA Jetson TX2, which can also be installed on a small-sized drone.
3. Hardware and Software Sub-Framework for Active LIF Spectroscopy Sensing (HSFW2)
The application of the LIF spectroscopy method for the seawater detection of pollution by oil and oil products has a long history and was described in many works, for example, [21,22,23,24]. However, articles using LIF spectroscopy on drones appeared recently [25,26,27,28]. The use of the LIF method on small-sized drones has become possible due to the emergence of small-size laser sources, especially LED [29].
References [30,31] described the development of the LIF spectroscopy method for monitoring oil products dissolved in seawater. According to the results of these studies, a small-sized LIF spectrometer was developed, the 3D model and assembled version of which is shown in Figure 3a,b. In the case of a slick, it is necessary to carry out an autonomous identification of the type of oil product that formed the slick; in this case, the volume of pollution is estimated by the HSFW1. In the case of monitoring bilge water, it is necessary either to identify the oil in the solution or to measure its concentration; thus, the HSFW2 is used in this case.
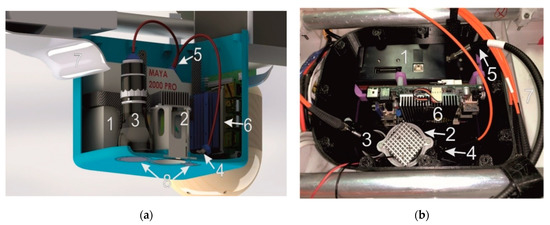
Figure 3.
(a) 3D model of the LIF spectrometer, and (b) photo of the LIF spectrometer in the drone body. 1—LIF spectrometer; 2—LED; 3—collimator of the first channel (slick of oil products); 4—collimator of the second channel (solutions of oil products); 5—optical fiber; 6—computer; 7—drone body; 8—light filters and optical windows.
High efficiency of fluorescence emission in dissolved oil products is observed in the range 310–360 nm when excited by radiation at wavelengths less than 290 nm. The use of lasers as a source of excitation of the fluorescence signal leads to a significant increase in the mass and size characteristics of the LIF spectrometer, which is difficult to use on drones. Currently, with the advanced technologies, LED ultraviolet sources with high conversion efficiency and with power characteristics appropriate for efficient excitation of the fluorescence emission signal are possible to use. In the developed HSFW, the LED LEUVA66H70HF00—2 (LG, Seoul, South Korea) with a central wavelength of 277.7 nm and average power of 70 mW, mounted on a cooling radiator and installed in a special holder, was chosen as an excitation source. This holder also has an integrated optical lens system for the formation of quasi-parallel radiation from the LED. The emission spectrum is shown in Figure 4. The vertical axis is the value of the LED intensity in relative units, while the horizontal axis is the wavelength in nm. A small-sized highly sensitive spectrometer Maya 2000 Pro—1 (Ocean Insight, Orlando, FL, USA) was used to measure the spectral distribution of LIF with the ability to record radiation in the range from 200 to 1100 nm, with low power consumption, a wide temperature range of operation, soft development kit tools, and control via USB port.
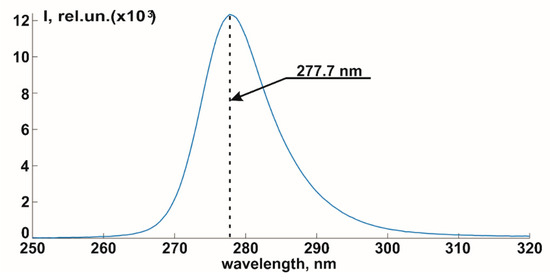
Figure 4.
The emission spectrum of LED LEUVA66H70HF00.
According to the proposed concept, the developed complex should provide the ability to measure the fluorescence spectra of slicks of oil products by hovering the carrier above the surface. Traces of dissolved oil products are detected by the drone landing on the water. Hence, the receiving system of the spectrometer was implemented in a two-channel design. The first channel provides the possibility of recording the backscattered signal from the slick from a distance of more than 1 m.
The registration in the second receiving channel is performed at an angle close to 60° to the direction of radiation of the LED and is carried out in the immediate vicinity of the receiving window submerged in water.
Radiation in the first channel is registered by a 74-uv quartz collimator (Ocean Insight, Orlando, FL, USA)—3. In the second channel, registration is carried out by a 74-ud collimator (Ocean Insight, Orlando, FL, USA)—4. The registration channels are separated by a shutter that closes the first channel at the moment of splashdown and directs the radiation collected in the underwater channel to the spectrometer.
Collimator—3 is installed in such a way that its optical axis is brought together with the radiation axis of the source of inducing radiation—2 at a distance of 1.2 m from the receiving window for remote registration of fluorescence from slicks on the water surface. The optical axes of the receiving collimator—4 and the LED—2 are oriented in such a way as to ensure the registration of radiation scattered by water at the shortest possible distance. Radiation is directed to the spectrometer by a UV/Visible Fiber Splitter (OceanInsight, USA). To suppress the frequency of elastic scattering of LED radiation in water, 10CGA-295 filters (Newport, Irvine, CA, USA)—8 are used. To control the parameters of the elements included in the measuring complex, a Jetson Nano processor board (Nvidia, Santa Clara, CA, USA)—6 is used. The interaction of the computer with the spectrometer—1 is carried out by the installed libraries Seabreeze and PyUSB. The spectrometer is integrated into the sealed drone body—7.
Software components with elements of artificial intelligence were developed to identify the types of oil products contained in the form of slicks or solutions on the sea surface. They automatically classify the fluorescence spectra of solutions according to their types.
Initially, sequences of spectra were obtained for each type of oil slick with a thickness of about 100 microns and the solution under study with different concentrations in laboratory. The total number of spectra obtained for the formation of training datasets for slick and the solutions of oil product was more than 8000 units. Python with scikit-learn, NumPy, and matplotlib libraries was used as a means of implementation. The spectra were preprocessed, normalized, and reduced to a single format. Furthermore, arrays of spectra of various types of oil products were used to compile datasets to extract features from them. The data matrix formed from the feature descriptions was used to train the linear support vector classification (linear SVC) method [32]. Thus, the resulting models can be used to classify the spectra of eight types of heavy and light types of marine fuel solutions and slicks. The spectral classification dataset is a matrix of spectral values and class labels, which contains sequences of values of the normalized intensities of the LIF spectrum for each type of fuel (a sequence of 83 spectra for each concentration for solutions and 900 spectra for slicks), in the range from 200 to 900 nm, measured in the spectral interval 0–47 nm (in Figure 5, the distance between the points of the horizontal axis corresponds to 0.47 nm). As a demonstration example of the work of the created model, Figure 5a shows a dataset that includes 83 different spectra for five concentrations of DMA solution (in the upper right part), obtained in the laboratory. Figure 5b shows a dataset that includes 300 different spectra for DMA slicks with a thickness of about 100 microns, also obtained in the laboratory and used in the training process. The vertical axis is the value of the fluorescence intensity in relative units, while the horizontal axis is the wavelength in nm.
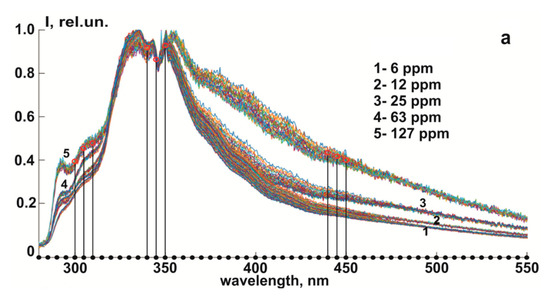

Figure 5.
Examples of datasets —(a) dataset of LIF spectra for five concentrations of DMA solution in seawater; (b) example of dataset of LIF spectra for DMA slicks with a thickness of about 100 microns.
It is necessary to collect proper datasets for the training procedure to automatically identify the type of oil slick type. The LIF spectra from slicks and solutions of the same products may differ [31].
4. Hardware and Software Sub-Framework Navigation and Flight Control (HSFW3) Design
The HSFW3 directly controls and manages the flight and navigation of the drone, and includes all elements related to the drone, as well as the drone itself. The functional purpose of HSFW3 assumes the control of a number of functions, for which special sensors are installed in the drone and an additional software is being developed. To perform a drone mission, the drone should be equipped with the ability to provide certain operations, in addition to those provided by the flight controller. These operations are as follows: autonomous correction of the route (based on the results of the HSFW1operation), autonomous water landing and takeoff from the sea surface (to ensure the measurements for the HSFW2), and autonomous landing on a moving object (to complete the mission and board the vessel).
The choice of a drone scheme with four carrier propellers as the carrier of the HSFW is due to the small-size solution, the energy efficiency of the layout, and the simplicity of design for manufacturing a hermetic version for the LIF spectrometer. The hardware part of the HSFW3 includes a controller, sensors that provide measurement of parameters for autonomous navigation, and motion control. The drone is powered by a Pixhawk Cube model controller that uses open-source software, and it is composed of three redundant IMUs (accels, gyros, and compass), two redundant MS5611 barometers, two GPS/GLONASS receivers, a flight control microcontroller 32-bit ARM Cortex M4 core with FPU, and a 32-bit failsafe co-processor. All sensors are combined on a vibration-damping platform and have built-in heating; therefore, operation in bad weather conditions is possible.
In addition to the controller’s sensors, a TFmini Plus lidar is included in the HSFW3, with a range of up to 12 m and a measurement accuracy of 1%. The use of a lidar is necessary for landing on a vessel and waved water surface. In this case, the height of the drone should be constantly adjusted. An active landing mark (IR light) is activated [33] for autonomous landing on a moving vessel. A modulated signal is emitted at a wavelength of 940 nm. The signal is modulated to cut off possible sun glare, and a camera with machine vision elements is installed on the drone, visually captures the mark, and sends the displacement values of the drone hull relative to the hull of the vessel to the microcomputer. Thus, autonomous landing is carried out with a decrease in altitude and accurate positioning. HSFW3 can also use QR codes for landing.
The hull of the HSFW hardware is hermetic and designed concerning the buoyancy of the drone for landing on the water surface and measuring the concentration of dissolved hydrocarbons. The total volume of the hull is 16.1 L, whereas the volume of the hull, which is below the waterline, is 11 L. Floats are fixed at the points of attachment of the motors to give stability on the water surface; they also give additional buoyancy. The windows of the LIF spectrometer are immersed in water to a depth of 15 cm in the mode of landing on water. Figure 6 shows a drone landing on water.
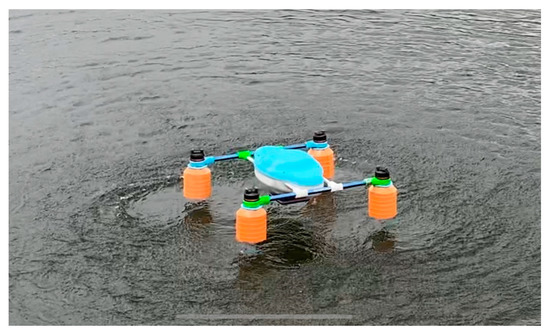
Figure 6.
Drone flooding.
The total payload of the HSFW for the monitoring mission was designed (including batteries and drone hull) to be up to 10 kg. The net flight time is 30 min with a total power consumption of 50 W. The main features of the drone developed as an HSFW carrier are described in the Table 2.
Table 2.
Main features of the drone for oil pollution monitoring.
The programs below were adapted for use in the HSFW3. The mission planner program is used for an autonomous program along a given route. The Precision landing and ArUcoMarker programs are used to follow the visual mark and board a moving vessel by IR light. Soft, which ensures the operation of computer vision for navigation, adapts to the elements of artificial intelligence for the detection and classification of oil slicks. The software package for estimating the speed and position of the drone, recognition, and flying around obstacles on the drone’s route consists of Opticalflow, Visual Intertial Odometry (VIO), and ObstacleAvoidance. These programs are also adaptable to interact with Priority HSFW.
The autonomy of the monitoring mission is very important, whether for the availability of the method (no need to have a qualified operator) or for increasing the effectiveness of monitoring. The latter is ensured by the most efficient decisions that AI elements make concerning numerous factors, including residual battery power and weather conditions. Control of the drone manually, concerning all necessary factors, is almost impossible. The preparation of the flight task is completely carried out by the operator on the basis of required flight route, in the following mission planner programs: qGround Control, Mission planner, DroidPlanner, and custom-made software (custom firmware). The program window (PX4) with the compiled flight task for monitoring the water area is shown in Figure 7. The operator has the ability to select the territory of the overflight, the step size of the drone’s movement during the overflight, and the overflight height.
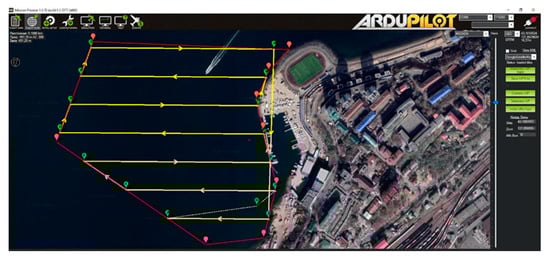
Figure 7.
Program window with a compiled flight task for water area monitoring.
The flight step is calculated as a function of the flight altitude and the camera’s field of view, such that, for each drone pass, the camera captures 15–20% of the territory surveyed in the previous pass. The flight altitude is selected according to the estimated size of the oil slick. For the RPI-CAM-V2 camera, the average monitoring height is in the range from 50 to 100 m above the water level. The operator can select the point of automatic takeoff and landing of the drone. In the case of a situation where takeoff is made from a moving vessel, the choice of a fully automatic mode of landing is available.
Landing on a moving object is a necessary operation to complete the monitoring mission. For its implementation, the capabilities of the flight controller, due to its interaction with a computer, an artificial intelligence element of the HSFW3, and Priority HSFW needed to be expanded. Priority HSFW generates the corresponding commands for the HSFW3, after analyzing all the data necessary for landing on a moving object.
Several resistive sensors were installed inside of the drone for water leakage. When water gets inside the hull, the takeoff function is automatically turned on, and landing on water is prohibited until the end of the mission is turned on. Control of the flight controller when landing on water is carried out by a computer installed in the drone. Resistive sensors for the presence of liquid in the body (hull) are also connected.
All interactions of the computer with the flight controller of the drone are carried out through the Robot Operating System—the MAVROS package, via the UART bus. The computer can both request any data that the flight controller operates and change the waypoints of the flight task, as well as directly control the inclination, the altitude, and other actions of the flight controller.
5. The Concept of HSFW Development
A wide range of tasks should be solved to provide proper autonomous oil pollution monitoring at sea using a drone. The concept of project development was based on a combination of hardware and software into corresponding separate sub-frameworks concerning the functional purposes. All hardware and software related to navigation and motion control were combined into the HSFW3 sub-framework. Hardware and software of the LIF were combined into HSFW2. HSFW1 is a collection of computer vision equipment and software for monitoring oil slicks. Each of the three frameworks may be considered separately. However, since they were combined into one general framework as constituent parts, we use the term sub-framework to identify them. The sequential inclusion of each of the sub-frameworks into the joint HSFW expanded the monitoring mission’s capabilities. Accordingly, slicks on the sea surface can be detected if only HSFW1 is installed. Moreover, if the task of classifying the slick and no decisions are made with respect to changing the flight route, then the use of a Raspberry computer is sufficient to accomplish such a mission. A more efficient computer such as Jetson nano can be installed if the monitoring mission includes the classification of slicks.
The types of oil products may be determined and the concentration of dissolved oil products may be measured when the HSFW2 is added. The HSFW3 may be added for autonomous flight and move control, including autonomous re-routing, water landing of the drone, and landing on a moving vessel. The software structure and hardware connections are designed in such a way that adding or removing the abovementioned sub-frameworks does not require any changes to the drone design.
Therefore, the development of three separate, interacting hardware and software sub-frameworks, endowed with the ability to make decisions considering their functional purpose, represented the most optimal structure to ensure the autonomy of the monitoring mission. Sub-frameworks may be used separately by means of proper hardware and software. Thus, the drone can be equipped with a different number of sub-frameworks and solve individual monitoring tasks. These sub-frameworks are combined into a joint framework (HSFW = HSFW1 + HSFW2 + HSFW3), which ensures implementation of the entire monitoring mission to fulfill the general monitoring mission. In this case, the interaction of the sub-frameworks is ensured. Each of the sub-frameworks is provided with elements of artificial intelligence to make decisions within its functional affiliation. Another level related to making priority decisions (Priority HSFW) is highlighted in the software to determine the priorities of these decisions. Priority decisions refer to those situations that require importance in the sequence of mission tasks, termination of the mission, and return of the drone to the location of deployment, in cases when priority should be chosen between the definition of monitoring modes. A block diagram of the HSFW is shown in Figure 8. All elements are divided into levels. The first (highest) level is occupied by the Priority HSFW artificial intelligence element, which makes priority decisions concerning the implementation of the monitoring mission. The decisions of Priority HSFW are prioritized for each of the sub-frameworks.
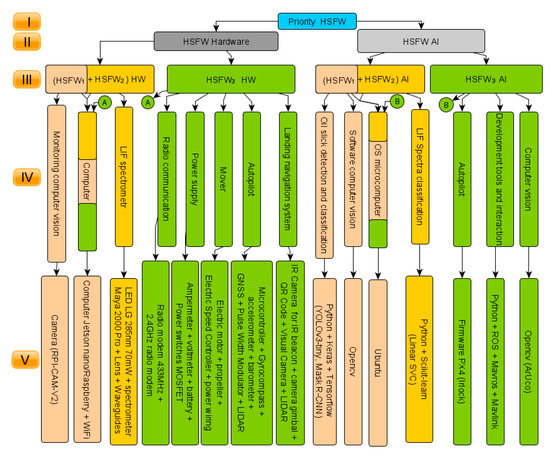
Figure 8.
Block diagram of HSFW for monitoring pollution of marine areas with oil products.
The hardware and software of the HSFW are separated in the second level in Figure 8. These are further divided into the hardware and software parts of the HSFW1, HSFW2, and HSFW3, which are shown in the third level. Due to the fact that the functional purpose of HSFW1 and HSFW2 is the monitoring process itself, they are combined in the diagram. These functional purposes are indicated in the fourth level for each of the sub-frameworks. The fifth level in Figure 8 contains information about the major hardware, software, or artificial intelligent tools of the sub-frameworks. The technical elements of HSFW1 consist of a computer (Jetson nano or Raspberry), a video camera, and a gyro-suspension of the camera. The HSFW2 hardware includes elements of the LIF spectrometer, which were described in Section 3.
The HSFW3 equipment includes radio communication equipment, sensors, a battery, engines, a flight controller, autopilot, and autonomous landing equipment.
The AI of the drone is represented by the AI elements of the three subframeworks and a priority decision-making element. AI of HSFW1 consists of software computer vision, as well as AI elements of slick detection and classification. AI of HSFW2 consists of the AI element of the LIF spectrum classification and determination of the concentration of dissolved oil products in seawater, as well as software to ensure the operation of the LIF spectrometer. AI of HSFW3 includes the AI element of the autopilot, including software for landing on a moving object, splashdown, and takeoff from the water surface, as well as AI element of computer vision for the purpose of autonomous navigation.
Figure 9shows a diagram of the HSFW functions.
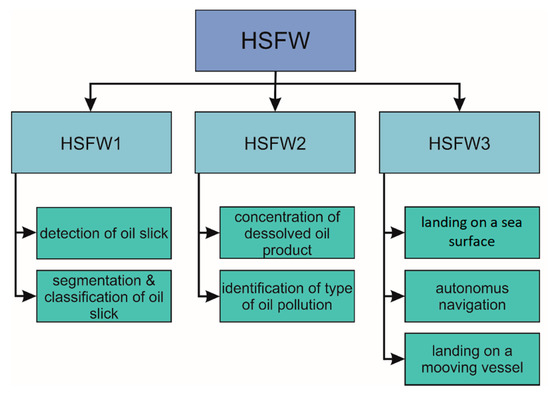
Figure 9.
Diagram of HSFW functions.
The functional purpose of HSFW is an autonomous monitoring mission. HSFW includes three independent sub-frameworks (HSFW1, HSFW2, and HSFW3) and the priority artificial intelligence element. The functional purpose of the priority element is to make the most important decisions regarding the monitoring mission according to the results of the three sub-frameworks. These decisions are a priority for implementation.
HSFW1 consists of computer vision hardware and artificial intelligence elements for the analysis and interpretation of video images of oil slicks on the sea surface. The functional purpose of HSFW1 is the detection of slicks on the sea surface, the segmentation of the detected slicks, and their classification. This task is performed by two elements of artificial intelligence in HSFW1: the “detection of oil slick” element and the “segmentation and classification of oil slick” element. The result of HSFW1 is the probability that the observed slick belongs to the dataset of oil product slicks, which was used in training, and segmentation of the entire slick into separate slicks with the same thickness according to the oil appearance code. The latter result makes it possible to estimate the volume of pollution.
HSFW2 consists of LIF spectrometer hardware and the following artificial intelligence elements: “identification of the type of oil product” and “concentration of dissolved oil product”. The functional purpose of the first is to determine the probability that the pollution belongs to one of the types of oil product in the dataset. This element determines the probability that the LIF spectrum comes from a slick of an oil product or a solution of oil product in seawater. The result of HSFW2 is the probability that the investigated pollution is related to one of the types of oil product (for both slick and solution) and the concentration of the dissolved oil product (in the case of a solution).
HSFW3 consists of drone hardware and drone navigation and motion control software. The functional purpose of HSFW3 is to carry out autonomous flight of the monitoring mission. It includes the drone equipment needed to navigate and fly. HSFW3 software consists of standard programs that ensure the operation of the controller and the following artificial intelligence elements: “autonomous navigation” for changing the route, “landing on a moving vessel” for landing on a moving vessel, and “landing on a sea surface” for landing and takeoff of the drone from the sea surface.
6. Testing and Results
HSFW1 and HSFW3 were tested in the city. HSFW2 was tested in a laboratory pool. HSFW1 testing was conducted while monitoring actual marine fuel slicks that occurred during bunkering. The AI elements for detecting and classifying slicks were tested. The detection element was tested during the flight in autonomous mode. The calculation of the contaminated area and determination of the slick thickness by the HSFW1 classification element were carried out only for thin slicks formed by DMA marine fuel.
Some of the most important functions of HSFW3 were tested. The functions of landing on a moving object, water landing, and autonomous flight with route correction were tested. Simulating solutions of oil products of various concentrations was required to calibrate the spectrometer when HSFW3 was tested. Therefore, the tests were carried out in a laboratory pool.
The interaction functions of the sub-frameworks, their decision-making, and priority decisions by the priority framework are under development and testing, including testing on the GAZEBO simulator and in situ testing.
6.1. Testing of HSFW1
The HSFW1 test results reported in this article were obtained by monitoring three different fuel slicks that occurred while refueling vessels. In all cases, measures were taken to eliminate slicks, but part of the fuel passed through boom barriers and ended up in open-water areas. Drone monitoring was carried out on the next day after the slicks. We were able to track the dynamics of the slicks and estimate the amount of fuel remaining after disposal operations.
In all cases, monitoring was carried out in the daytime in the absence of rough seas. There was a stable reception of GNSS signals for autonomous navigation and flight control using GNSS. The flight route and the initial altitude (from 50 to 100 m, depending on weather conditions) of the copter were set by the operator before departure.
In the process of flying around the water area, the HSFW1 element detected all spots visited by the copter along the route. The flight route (see Figure 7) was organized in such a way that the entire water area planned for monitoring was analyzed by the HSFW1 detection element.
Then, the classification element determined the thickness of the slicks on the basis of the color codes and calculated the corresponding areas of the slick segments. Next, the total volume of marine fuel in slicks was calculated. Determination of the effectiveness of those measures will allow eliminating pollution with light types of marine fuel while the drone is flying. Approximately 15% to 20% of the total volume of pollution fell into open-water areas after the initial response to the slick.
The main problems faced by the HSFW1 shell during autonomous detection were associated either with an insufficient number of images in the dataset used to train the neural net or with the fact that the characteristics of the camera and computer did not allow reducing the image processing time. Thus, the detection element of HSFW1 recognized spots well when they were observed directly under the drone or at a small angle to the surface normal. Figure 10a shows the spot at an angle of observation to the normal to the surface of about 45°. HSFW1 determined the probability of detecting a slick as only 0.5, i.e., below the threshold we set. HSFW1 detected a slick with a probability of 0.95 (Figure 10b) when the image of the same slick region was analyzed, at a very small angle to the vertical to the surface.
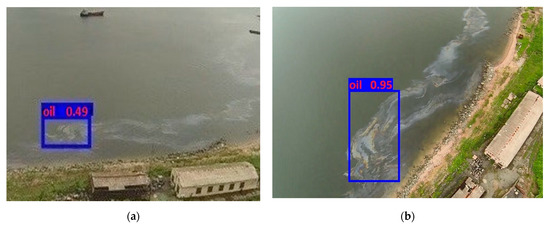
Figure 10.
Detection: (a) spot detection at an observation angle of about 45°; (b) probability of detection when a slick is located directly under the drone camera (nadir).
Thus, oil slicks, which were away from the flight path and observed at angles greater than 45%, were usually skipped by the HSFW1 element. As a consequence, HSFW3 did not adjust the flight route. A significant replenishment of datasets with images captured from different angles to the normal to the surface is necessary for the correct use of HSFW1. This also applies to the classification element HSFW1, where, in addition to the abovementioned difficulties, factors that affect the surface color add significant complexity. A large expansion of datasets is necessary due to the images of slicks in different lighting conditions and different weather conditions for a more correct operation of the classification element of HSFW1.
6.2. Testing of HSFW2
HSFW2 was tested in a laboratory pool. The experiments were carried out on a thin slick of various types of marine fuel. To test the underwater channel of the LIF spectrometer, a pool with a capacity of 50 L was filled with marine fuel solutions of various concentrations. In experiments with slick, the drone with a spectrometer hovered over the surface at a height of 1.2–1.5 m. This height was optimal in order to ensure the maximum signal ratio from the LIF to the daytime background in sunny conditions, on the one hand, and to ensure the minimum impact of the drone propellers on the slick, on the other hand. The experiments were carried out under conditions excluding the ingress of sun glare into the receiving channel of the spectrometer when studying the slick. In experiments with solutions, the drone was in a flooded state, such that the receiving lens was under the surface at a depth of about 15 cm.
The operation of the fuel type identification element of HSFW2 in an aqueous solution and a slick state was determined using the example of the DMA identification. In Figure 11, the spectrum from a DMA solution with a concentration of 12 ppm and the LIF spectrum from a DMA slick with a thickness of about 100 μm are presented. The vertical axis is the value of the fluorescence intensity in relative units, while the horizontal axis is the wavelength in nm.
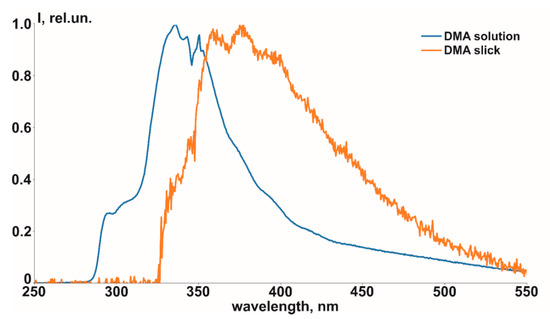
Figure 11.
LIF spectra of DMA marine fuel of solution (blue) and slick (orange).
The LIF spectra obtained during testing were analyzed by the HSFW2 recognition element according to the method described in Section 3. The result of determining the fuel type is shown in Figure 12. The horizontal axis shows eight types of oil products, the LIF spectra of which were placed in the dataset. The vertical axis represents a probability of about 0.8, which means that the measured LIF spectrum likely represented the spectrum of the DMA marine fuel.
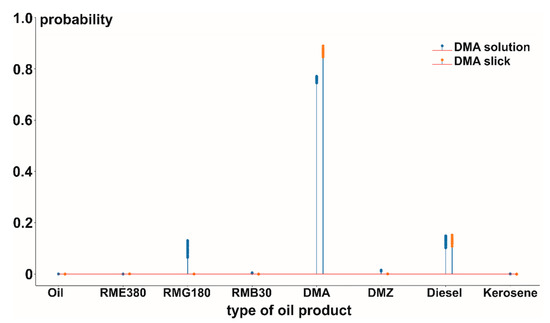
Figure 12.
Demonstration of AI HSFW2 element for recognition of marine fuel type by LIF spectrum.
The ability to measure the concentration of the dissolved oil product in water-flooded mode allowed us to assess the concentration of the solution under the slick. Thus, the concentration of dissolved DMA in the surface layer (at a depth of 15 cm from the surface) under a slick with a thickness of about 100 μm, 2 days after its formation, was 11 ppm.
6.3. Testing HSFW3
Landing on a moving vessel was tested in two ways. The first used the IR beacon landing method, whereas the second used a QR code (the code was made in the form of a contrasting black-and-white image (50 × 50 cm2)). The purpose of the experiments was to determine a more reliable and faster method of landing, which would simultaneously provide the possibility of landing on an object moving at a higher speed. Previously, the landing options for both methods were simulated using the GAZEBO simulator.
The experiments were carried out in the daytime with a weak wind (no more than 4 m/s) and in the presence of a stable GNSS connection. The initial convergence was carried out using a GNSS signal, which came from a moving platform. The drone descended to a height of 2 m and then continued approaching until the IR beacon radiation was captured by a camera or until the QR code was captured by computer vision, with a distance of about 10 m between the drone and the platform. HSFW3 made the decision on its own to start boarding during testing, without interacting with HSFW Priority.
The main landing criteria in this case were the distance between the drone and the landing site (about 15 cm) and the location of the drone relative to the center of the landing site. In the case of autonomous landing using an IR beacon, the maximum speed was 1.3 m/s for stable landing. The maximum speed was 2 m/s for landing using the QR code. Autonomous landing on a moving vessel, even at such speeds, greatly facilitates the work in real monitoring missions and makes it more efficient.
Testing of drone landing and takeoff from the water surface was carried out in the absence of waves and at wind speeds of about 3 m/s. The decision of HSFW Priority regarding the necessity of landing was simulated. Then, HSFW3 analyzed the lidar data and issued a command to the controller to carry out a water landing.
7. Conclusions
HSFW can already be used for practical purposes of drone monitoring according to results previously established. However, the structure of HSFW is modifiable and may include several frameworks to improve monitoring. The functions of sub-frameworks realized in this project allow oil pollution monitoring at sea by drones. Significantly, artificial intelligence and hardware development as separate interacting sub-frameworks may be applied for any type of robot.
Testing sub-frameworks in real conditions showed the difficulties that arise during a monitoring mission. The test results determined the directions for further improvement of the HSFW. First of all, problems were caused by an insufficient number of video images of slicks of various types of oil products for training. The HSFW1 slick detection element exhibited less sensitivity to the type of marine fuel. The main problem in its use was the strong dependence of the spot detection probability on the observation angle.
However, the segmentation and classification element of HSFW1 was more dependent on the types of oil products. In addition, there was a stronger dependence on the presence of sun glare and the position of the camera relative to the sun. We used the simplest color-coded spot separation principles based on the analysis of RGB pixel values. The number of images of various types of thin slicks and the images obtained under different lighting conditions in the data sequence on which the training was performed should be raised to increase the reliability of the classification results. A special archive of slick images, where it is possible to upload and download images of real oil slicks for detection, segmentation, and classification of slicks using deep learning, is necessary since images of real slicks are needed.
The results of the identification of types of marine fuel solutions by the HSFW2 element were less dependent on the conditions under which monitoring was performed. There were a relatively large number of spectra for solutions representing the most probable types of fuel that can cause pollution. Reference spectra were obtained for various concentrations. Thus, at present, this dataset may be used as it is for reliable identification. The drone body significantly shields solar radiation; thus, identification showed good results in daytime conditions when the LIF spectra from solutions were measured.
The method for identifying fuel types in a slick based on LIF spectra should be improved. The dataset of spectra from slicks of various types should also be expanded. Furthermore, the training methodology for recognizing spectra from slicks and tools to increase ratio values of the LIF signal to sun background can be improved. The latter is possible if short laser pulses and a time gate are used for LIF registration. However, the experiment at the laboratory pool showed that it is possible to identify types of fuel in the slick if there is no direct sun radiation (cloudy weather, in the evening when the contribution of solar radiation in the spectral range of 320–450 nm does not exceed the fluorescence intensity from the slicks).
In this study, the individual HSFW3 elements most important for autonomous navigation and motion control were developed and tested. However, testing these elements, as well as testing the interaction of individual elements of the sub-frameworks (including the Priority HSFW element) demonstrated the correctness of the chosen framework approach. In the future, a demanded element is one that provides autonomous navigation of the drone in the absence of GNSS signals. The element should provide autonomous navigation through the video image of an object in the monitoring area (localization and mapping element of the system).
The simplest and most affordable option for standalone monitoring is the use of HSFW3 in conjunction with only the HSFW1 slick detection element. This option has the prospect of combining the procedures for monitoring slicks and eliminating local slicks in a small area. Thus, the method of using dispersants for oil slick response works well on thin slicks, and their successful use is associated with dispersant spraying into certain sectors of the slick [34,35]. The latter is difficult to spray with dispersants from vessels. The experience of using drones to spray fertilizers and chemicals in agriculture [36,37] can be used in the development of methods for eliminating sea pollution from drones. Further development of HSFW will be facilitated by improvements in hardware which will combine monitoring with dispersant application on detected slicks. Moreover, the software will be improved by AI and dispersant application methods on the exact parts of the slicks.
The development of HSFW involves not just sensing but the sensitivity of robots, i.e., perception of the external environment in the sense that it occurs in living objects, when the perception of the external environment turns into a specific action that the robot performs. In this case, a specific case of sensitivity to oil pollution at sea was demonstrated. The development of a complex, which consists of simpler sub-frameworks, may reproduce the following sequence: “perception–analysis–decision-making–action”. Developing simple hardware and software sub-frameworks and combining them into interacting sub-frameworks are ideal methods to equip robots with sensitivity to the external environment.
Author Contributions
Conceptualization and investigation, O.B.; formal analysis and investigation, D.P.; validation and data curation, D.K.; software and draft preparation, A.C.; writing—original draft preparation, review, and editing, V.Y.; resources and investigation, I.B. All authors read and agreed to the published version of the manuscript.
Funding
This research was funded by the Federal Agency for Maritime and River Transport (applied research and technical development) and Grant # 19-72-00107 by the Russian Science Foundation (fundamental research of LIF spectrum formation and artificial intelligence development).
Institutional Review Board Statement
Not applicable.
Informed Consent Statement
Not applicable.
Conflicts of Interest
The authors declare no conflict of interest.
References
- Maes, F. National Research Council, Oil in the Sea III: Inputs, Fates, and Effects. Int. J. Environ. Pollut. 2003, 22, 743–744. [Google Scholar]
- Bollmann, M. World Ocean Review: Living with the Oceans; Maribus: Hamburg, Germany, 2010; pp. 92–99. [Google Scholar]
- Julian, M. MARPOL 73/78: The International Convention for the Prevention of Pollution from Vessels. Marit. Stud. 2000, 2000, 16–23. [Google Scholar] [CrossRef]
- Hafeez, S.; Wong, M.S.; Abbas, S.; Kwok, C.Y.T.; Nichol, J.; Lee, K.H.; Tang, D.; Pun, L. Detection and Monitoring of Marine Pollution Using Remote Sensing Technologies. In Monitoring of Marine Pollution; BoD—Books on Demand: Norderstedt, Germany, 2018. [Google Scholar]
- Verfuss, U.K.; Aniceto, A.S.; Harris, D.V.; Gillespie, D.; Fielding, S.; Jiménez, G.; Johnston, P.; Sinclair, R.R.; Sivertsen, A.; Solbø, S.A.; et al. A review of unmanned vehicles for the detection and monitoring of marine fauna. Mar. Pollut. Bull. 2019, 140, 17–29. [Google Scholar] [CrossRef] [PubMed]
- Fingas, M.; Brown, C.E. A review of oil spill remote sensing. Sensors 2018, 18, 91. [Google Scholar] [CrossRef] [PubMed]
- El Mahrad, B.; Newton, A.; Icely, J.D.; Kacimi, I.; Abalansa, S.; Snoussi, M. Contribution of remote sensing technologies to a holistic coastal and marine environmental management framework: A review. Remote Sens. 2020, 12, 2313. [Google Scholar] [CrossRef]
- Migliaccio, M.; Nunziata, F.; Buono, A. Sar polarimetry for effective sea oil slick observation. In Proceedings of the 2018 Ieee/Oes Baltic International Symposium (Baltic), Klaipeda, Lithuania, 12–15 June 2018. [Google Scholar]
- Jones, C.E.; Holt, B. Experimental L-band airborne SAR for oil spill response at sea and in coastal waters. Sensors 2018, 18, 641. [Google Scholar] [CrossRef]
- Laure, R.; Françoise, V.R.; Véronique, M. Oil slick volume estimation from combined use of airborne hyperspectral and pool experiment data. In Proceedings of the IGARSS 2019—2019 IEEE International Geoscience and Remote Sensing Symposium, Yokohama, Japan, 28 July–2 August 2019; pp. 5776–5779. [Google Scholar]
- Chu, J.; Zhao, J.; Gao, N.; Song, D.; Fan, J.; Wang, X. Application of Domestic Satellite Image Fast Ortho-Rectification Method in Dynamic Remote Sensing Monitoring of Sea Area. In Proceedings of the 2018 Ninth International Conference on Intelligent Control and Information Processing (ICICIP), Wanzhou, China, 9–11 November 2018; pp. 134–138. [Google Scholar]
- Gade, M.; Alpers, W.; Hühnerfuss, H.; Masuko, H.; Kobayashi, T. Imaging of biogenic and anthropogenic ocean surface slicks by the multifrequency/multipolarization SIR-C/X-SAR. J. Geophys. Res. Ocean. 1998, 103, 18851–18866. [Google Scholar] [CrossRef]
- Salberg, A.B.; Larsen, S.Ø. Classification of ocean surface slicks in simulated hybrid-polarimetric SAR data. IEEE Trans. Geosci. Remote Sens. 2018, 56, 7062–7073. [Google Scholar] [CrossRef]
- de Laurentiis, L.; Jones, C.E.; Holt, B.; Schiavon, G.; del Frate, F. Deep Learning for Mineral and Biogenic Oil Slick Classification with Airborne Synthetic Aperture Radar Data. IEEE Trans. Geosci. Remote Sens. 2020, 12, 3416. [Google Scholar] [CrossRef]
- Danilicheva, O.A.; Ermakov, S.A.; Kapustin, I.A.; Lavrova, O.Y. Characterization of surface currents from subsequent satellite images of organic slicks on the sea surface. In Remote Sensing of the Ocean, Sea Ice, Coastal Waters, and Large Water Regions; International Society for Optics and Photonics: Bellingham, WA, USA, 2019; Volume 11150, p. 111501R. [Google Scholar] [CrossRef]
- Lewis, A. The development and use of the Bonn Agreement oil appearance code (BAOAC). In Proceedings of the Interspill Conference, Cedre, France, 12–14 May 2009. [Google Scholar]
- Fingas, M. Visual Appearance of Oil on the Sea. J. Mar. Sci. Eng. 2021, 9, 97. [Google Scholar] [CrossRef]
- Jiang, G.; Yin, L.; Jin, S.; Tian, C.; Ma, X.; Ou, Y. A Simultaneous Localization and Mapping (SLAM) Framework for 2.5D Map Building Based on Low-Cost LiDAR and Vision Fusion. Appl. Sci. 2019, 9, 2105. [Google Scholar] [CrossRef]
- Redmon, J.; Farhadi, A. Yolov3: An incremental improvement. arXiv 2018, arXiv:1804.02767. [Google Scholar]
- He, K.; Gkioxari, G.; Dollár, P.; Girshick, R. Mask r-cnn. In Proceedings of the IEEE International Conference on Computer Vision, Venice, Italy, 22–29 October 2017. [Google Scholar]
- Frank, U. A review of fluorescence spectroscopic methods for oil spill source identification. Toxicol. Environ. Chem. Rev. 1978, 2, 163–185. [Google Scholar] [CrossRef]
- Raymond, M.L. Remote Sensing: Fundamentals and Application; Krieger Publishing Company: Malabar, FL, USA, 1984; pp. 127–282. [Google Scholar]
- Sun, L.; Zhang, S.; Tian, Z.; Gong, Y.; Zhang, Y. Remote sensing of the aquatic environment by semiconductor laser-induced fluorescence lidar. In Seventh Symposium on Novel Photoelectronic Detection Technology and Applications—International Society for Optics and Photonics; The International Society for Optics and Photonics: Bellingham, WA, USA, 2021; Volume 11763, p. 1176312. [Google Scholar]
- Gu, Y.; Zuo, Z.; Shi, C.; Hu, X. Feasibility Study for Spatial Distribution of Diesel Oil in Contaminated Soils by Laser Induced Fluorescence. Appl. Sci. 2020, 10, 1103. [Google Scholar] [CrossRef]
- Milas, A.S.; Cracknell, A.P.; Warner, T.A. Drones—The third generation source of remote sensing data. Int. J. Remote Sens. 2018, 39, 7125–7137. [Google Scholar] [CrossRef]
- Zarco-Tejada, P.J.; González-Dugo, V.; Berni, J.A. Fluorescence, temperature and narrow-band indices acquired from a UAV platform for water stress detection using a micro-hyperspectral imager and a thermal camera. Remote Sens. Environ. 2012, 117, 322–337. [Google Scholar] [CrossRef]
- Raimondi, V.; Palombi, L.; Lognoli, D.; Masini, A.; Simeone, E. Experimental tests and radiometric calculations for the feasibility of fluorescence LIDAR-based discrimination of oil spills from UAV. Int. J. Appl. Earth Obs. Geoinf. 2017, 61, 46–54. [Google Scholar] [CrossRef]
- Duan, Z.; Li, Y.; Wang, J.; Zhao, G.; Svanberg, S. Aquatic environment monitoring using a drone-based fluorosensor. Appl. Phys. A 2019, 125, 108. [Google Scholar] [CrossRef]
- Kneissl, M.; Seong, T.Y.; Han, J.; Amano, H. The emergence and prospects of deep-ultraviolet light-emitting diode technologies. Nat. Photonics 2019, 13, 233–244. [Google Scholar] [CrossRef]
- Bukin, O.; Proschenko, D.; Chekhlenok, A.; Golik, S.; Bukin, I.; Mayor, A.; Yurchik, V. Laser Spectroscopic Sensors for the Development of Anthropomorphic Robot Sensitivity. Sensors 2018, 18, 1680. [Google Scholar] [CrossRef]
- Bukin, O.; Proschenko, D.; Alexey, C.; Korovetskiy, D.; Bukin, I.; Yurchik, V.; Sokolova, I.; Nadezhkin, A. New Solutions of Laser-Induced Fluorescence for Oil Pollution Monitoring at Sea. Photonics 2020, 7, 36. [Google Scholar] [CrossRef]
- Cristianini, N.; Ricci, E. Support Vector Machines. In Encyclopedia of Algorithms; Kao, M.Y., Ed.; Springer: Boston, MA, USA, 2008. [Google Scholar]
- MarkOne Beacon V3.0. Available online: https://irlock.com/collections/ir-markers/products/markone-beacon-v3-0-beta (accessed on 20 March 2021).
- The Use of Dispersants to Combat Oil Spills in Germany at Sea. Available online: https://www.bfr.bund.de/cm/350/the-use-of-dispersants-to-combat-oil-spills-in-germany-at-sea.pdf (accessed on 20 March 2021).
- Liu, Z.; Callies, U. Implications of using chemical dispersants to combat oil spills in the German Bight—Depiction by means of a Bayesian network. Environ. Pollut. 2019, 248, 609–620. [Google Scholar] [CrossRef] [PubMed]
- Devi, G.; Sowmiya, N.; Yasoda, K.; Muthulakshmi, K.; Balasubramanian, K. Review on application of drones for crop health monitoring and spraying pesticides and fertilizer. J. Crit. Rev. 2020, 7, 667–672. Available online: http://www.jcreview.com/fulltext/197-1588224990.pdf (accessed on 1 February 2021).
- Mhetre, P.S.; Soni, D.; Nerkar, A.; Vishal, H. Agriculture drone for fertilizer spraying. Int. Res. J. Mod. Eng. Technol. Sci. 2020, 2, 770–777. Available online: https://irjmets.com/rootaccess/forms/uploads/agriculture-drone-for-fertilizer-spraying.pdf (accessed on 1 February 2021).
Publisher’s Note: MDPI stays neutral with regard to jurisdictional claims in published maps and institutional affiliations. |
© 2021 by the authors. Licensee MDPI, Basel, Switzerland. This article is an open access article distributed under the terms and conditions of the Creative Commons Attribution (CC BY) license (https://creativecommons.org/licenses/by/4.0/).