1. Introduction
PCM emulsions or, more generally, PCM slurries (PCS) are heat transfer fluids consisting of a PCM that is dispersed in a fluid (in this study, water). Compared to pure water, they showed a high storage capacity due to the usage of the PCM melting and solidification process, in addition to the sensible heat capacity of the water and the PCM. To utilise this benefit, they have to be used within the PCM melting and crystallisation temperature range [
1]. This offers the advantage of reduced volumes for energy storage due to a greater storage density [
2]. PCS, in general, offer the advantage of being liquid-independent of the PCM’s state of matter. This property makes it possible to convey PCS in hydraulic systems equally in both physical states of the PCM. Hence, PCS can act as heat transfer fluids and as a storage fluid. With this functionality, PCS contributes as a storage material to thermal systems that are operated within small temperature differences, such as cooling or temperature-buffering applications. PCS can transfer this heat homogeneously at an almost constant temperature [
3]. The fine dispersion of the PCM in water leads to a high surface-to-volume ratio that contributes to a high heat transfer rate between water and PCM [
4,
5].
Over time, researchers have investigated different paraffins for use as PCM in emulsions. Already, in the 1990s, Inaba and Morita [
6] investigated the application of tetradecane with a melting temperature of 14.75 °C in water as a PCM emulsion for cold storage. A mixture of anionic and non-ionic emulsifiers stabilised the emulsion. Paraffins are available over a wide range of melting temperatures. Additionally, melting temperatures between that of pure paraffins can be achieved by mixing two different paraffins [
7]. He and Setterwall [
7] mixed, for example, n-tetradecane and n-hexadecane and found melting temperatures between those of the pure materials. They also found that a mixture of about 90 mol% n-tetradecane and 10 mol% n-hexadecane showed a melting temperature at 2 °C. This makes it possible to adapt the melting point to the demand of different applications by choosing a paraffin with an appropriate melting temperature or mixed paraffins with higher and lower melting temperatures.
According to Montenegro and Landfester [
8], n-alkanes with an even number of carbon atoms in the range from 12 to 26 crystallise in the triclinic form, and those with an odd-numbered carbon chain show a phase transition from liquid to a metastable orthorhombic rotator phase and, in the second step, at a lower temperature, a transition to the stable phase. It was also observed that even-numbered n-alkanes show a phase transition to the rotator phase when emulsified in the nanometre scale. Hagelstein und Gschwander [
9] observed this as well for octadecane emulsions. It was found that the transition to a rotator phase accounts for 70–75% of the total crystallisation enthalpy. Beside this change in the phase transition, it was observed that, due to the confined volume of the paraffin droplets, it was crystallising at a temperature below its bulk phase-change temperature from solid to liquid. This is due to a separation of the natural given crystallisation seeds [
10]. This hysteresis effect is called supercooling. Zhang et al. [
11] reported that a PCM emulsion with a melting temperature of 18 °C had to be cooled down to 7 °C to obtain the full latent heat. Nucleation agents were used to supress the supercooling. Huang et al. [
5] developed, for example, a PCM emulsions based on the paraffin blends RT6 with a melting temperature of 6 °C, RT10 (10 °C) and RT20 (20 °C) from Rubitherm Technologies GmbH. Non-ionic emulsifiers—in particular, ethoxylated fatty alcohols—were used for the stabilisation of the PCM droplets/particles. A paraffin with a melting point at 50 °C was used as a nucleating agent that was able to decrease the supercooling. After 100 cooling/heating cycles in a test rig, the DSC measurements of the samples revealed an increased supercooling again and indicated an unstable nucleation agent. Lu and Tassou [
12] reported the development of a PCM slurry for cooling applications. A paraffin with a high melting temperature was used as a nucleation agent to reduce the supercooling of the emulsified PCM. The storage stability was tested by storing a sample over eight months and applying 50 heating and cooling cycles. The stability was analysed by comparing the DSC curves before and after the experiment. The emulsion showed no reduction of the effectiveness of the nucleation agent, but separation or creaming of the paraffin droplets was observed, which was, in further experiments, supressed by using thickeners. Zhang et al. [
2] dispersed n-octacosane with a melting temperature of 60 °C for use in heat storage applications. As emulsifiers, they used non-ionic surfactant different combinations of Tween and span emulsifiers with a HLB of 12, as well as hydrophobic SiO
2 particles, as nucleating agent to reduce supercooling. The stability was tested first by storing samples for up to six months and, second, by applying five freezing and melting cycles in which the sample was heated to 70 °C and then cooled down again to room temperature. The breaking ratio, which is the ratio between the separated PCM to the whole tested volume, was used to quantify the stability. After the storing experiment, a creaming was observed but no clear trend in the changes of the droplet sizes. In the thermal cycling experiment, separated oil was observed on the samples, and a breaking ratio was determined in a range between 40% and almost 90% for the different emulsions.
Delgado et al. [
1] stated that the smaller and more homogenous the particle size distribution is, the more stable a PCM emulsion is for thermal–mechanical cycling and storage time-induced effects. Zhang et al. [
13] described the development of PCM emulsions with particle sizes in the nanometre scale using hexadecane as the PCM. The emulsion showed a high stability against phase separation, which was tested under repeated thermal cycles in which the emulsion was cooled below the solidification temperature in an ice bath and heated up again by taking it out of the ice bath and exposing it to room temperature at 25 °C. A high stability was proven by applying this procedure. The DSC measurements revealed supercooling, which was reduced in further experiments by using SiO
2 particles, but nevertheless, the supercooling was still in the range of about 5–10 K.
Vorbeck et al. [
14] investigated a PCS based on microencapsulated paraffin with a melting range between 22 and 26 °C and a melting enthalpy of 50 kJ/kg. The PCS had a fraction of 30 wt.% of microcapsules and was tested on stability within a hydraulic test rig in which the PCS was cycled. The test rig contained plate-type heat exchangers and a centrifugal pump. In every cycle, the slurry was cooled below the solidification temperature and heated up above the melting temperature of the PCM again. Nearly 100,000 cycles were applied without observing a significant number of broken microcapsules. The storage capacity was investigated in a storage tank containing 5 m
3 of the slurry, and the results were compared with experiments using water as the storage fluid in the same storage tank. It was shown that it was possible to store 55% more energy than using water, which leads to a 95-min-longer discharge duration. Biedenbach et al. [
15] reported the experimental investigation of a PCM emulsion with 35 wt.% n-octadecane in a 500-L storage tank. The storage capacity was compared to water, which was also investigated in the same storage tank. The PCM emulsion showed a supercooling of 5.7 K. Compared to water, the emulsion offered, in the best-case scenario, an improvement of the storage capacity by a factor of 2.6, operating it between 20 and 27 °C, 2.3 in a temperature range between 22 and 29 °C and 1.7 between 15 and 29 °C. The stability of the emulsion was proven by particle size measurements done with samples taken after filling the storage tank after three and after six days of operation. The particle size was decreased and more uniform after three days of moving to slightly bigger sizes after six days. Delgado et al. [
16] investigated a PCM emulsion with a low-cost paraffin and solid content between 59% and 61% in a stirred 46-litre tank with a coiled heat exchanger. A 3.5–5.5 times higher heat transfer coefficient was observed when the emulsion was stirred with 290–600 rpm compared to the non-stirred tank. It was found that the stored energy was 80% higher for an operation temperature between 30 and 50 °C and 40% higher when operating it between 30 and 60 °C in comparison to water as the storage fluid. Morimoto et al. [
17] investigated the influence of the degree of supercooling on the storage capacity in n-hexadecane and n-octadecane emulsions. A freezing ratio was defined as the relation of the heat stored when the emulsion was cooled to a certain temperature before it was molten again to the total storage capacity of the full-phase transition. Dependent on the cooling temperature, the freezing ratio was in a range between 30% and 60% for emulsions having a mean particle size of 0.25 µm.
Research into PCS development is concentrated on the stabilisation of PCM in emulsions against phase separation (creaming) and on the suppression of supercooling. In many publications, the stability against thermal cycling is tested without applying mechanical stress at the same time. There is little information on how supercooling influences the storage capacity of PCM emulsions in comparison to standard heat transfer fluids. In this study, analyses on the storage capacity for emulsions using different paraffins as PCM in comparison to pure water are presented. All investigated emulsions are prepared using the same formulation, including the nucleation agent. Furthermore, an analysis of the stability is undertaken using repeated thermal cycles and shearing the emulsion with a defined shear rate at the same time (thermal–mechanical stress). The influence of supercooling on the storage capacity is analysed by enthalpy curves obtained via DSC measurements. The degradation due to thermal–mechanical stress is tested by using a rotational rheometer determining the change of viscosity with time, measuring the particle size distribution and the enthalpy via DSC before and after the test.
2. Materials and Methods
2.1. Materials
All presented PCM dispersions were prepared by using linear alcohol ethoxylates from Sasol Germany GmbH, Fritz-Staiger-Straße 15, 25541 Brunsbüttel, German as surfactants. The PCMs, which were emulsified, were Parafol 16-97, Parafol 17-97, Linpar 17, Parafol 18-97, Parafol 19-90 and Parafol 19-97, as well as Parafol 20Z, which were also received from Sasol Germany GmbH. For the paraffins of the Parafol trademark, the first digit stands for the number of carbon atoms in the hydrocarbon chain and the second digit for the purity of the material. For example, Parafol 19-90 and Parafol 19-97 are n-alkanes with 19 carbon atoms. These two materials differ solely in their purity, with 90% and 97%, respectively. According to Sasol, Linpar 17 and Parafol 20Z are paraffins with high purities, but there are no exact percentages available. In the following, Parafol is abbreviated to P and Linpar to L. The PCM RT 27 is a blend of paraffins that was manufactured by Rubitherm Technologies GmbH, Imhoffweg 6, 12307 Berlin, Germany with an unknown composition. A second blend was examined using 40 wt.% Parafol 16-97 and 60 wt.% Parafol 18-97, resulting in a melting temperature of 18.7 °C.
2.2. Formulation of the PCM Dispersions
The PCM dispersions were all formulated with 35 wt.% of PCM emulsified in deionised water. The concentration of 35 wt.% of PCM shown in previous internal studies a good compromise between capacity, viscosity and stability. For stabilising the PCM droplets/particles in water, 5 wt.% surfactant was added to the formulation. To decrease the supercooling of the PCM dispersion, a derivate of paraffin wax from Sigma-Aldrich Chemie GmbH, Kappelweg 1, 91625 Schnelldorf, Germany with a melting temperature of 105 °C was added to the PCM as a nucleation agent before dispersing it in water. The mixture of PCM and nucleation agent was heated to 105 °C and stirred for 30 min; then, it was cooled down to 80 °C before emulsifying it in water.
The mixture of Paraffin, nucleation agent, emulsifier and water was dispersed for 3 min using a dispersion machine, magicLAB®, from IKA®-Werke GmbH & Co.KG, Janke & Kunkel-Str. 10, 79219 Staufen, Germany which worked with a rotor–stator principle at a speed of 20,000 rpm. In a following step, the PCM emulsion was homogenised in a high-pressure homogeniser APV 2000 from SPX®, Konrad-Zuse-Straße 25, 47445 Moers, Germany at 200 bar. In total, 200 g of every sample was produced containing 70 g of PCM. The initial weight was done with an accuracy of ±50 mg for PCM and water and with ±5 mg for the emulsifiers and nucleation agent. The maximum weighting error was below ±0.07%, and therefore, this error was neglected for the storage capacity analyses.
2.3. Characterisation
Every PCM dispersion was analysed in terms of its particle size distribution, melting and crystallisation behaviours, enthalpy and stability against thermal–mechanical stress.
The particle size distribution was analysed using a laser diffraction particle analyser, LS13320, from Beckman Coulter GmbH, Europark Fichtenhain B 13, 47807 Krefeld, Germany. The measured values represented the particle diameter. The particle size distribution was measured after production and after the thermal–mechanical stability test.
A DSC (Q200 from TA Instruments, Altendorfstraβe 12, 32609 Hüllhorst, Germany) was used to determine the melting/crystallisation temperature and the enthalpy of the fusion/crystallisation. The onset values were chosen as the melting/crystallisation temperature due to its independency of the heating rate. To identify the suitable heating rate for the dispersions, a heating and cooling rate test was performed conformal to the procedure developed in IEA ECES Annex 29/SHC Task 42 [
18]. According to the heating rate test, the heating rate was determined to 1 K/min. The measurements were performed in T
zero hermetic aluminium crucibles at the determined heating rate, and the temperature dynamic range varied depending on the melting point of the PCMs. The sample volume was 10 µL. A flow of dry nitrogen was used to purge the measuring cell with 50 mL/h during the measurements. The error of the DSC measurements was given with ±5% for the enthalpy values and ±0.1 K for the temperature values.
For using PCM emulsions as heat or cold storage fluids, it is important to consider the degree of supercooling, especially when comparing it with water. Supercooling is increasing the necessary temperature range that must be applied to use the full potential of SC. In principle, the larger this temperature range is, the lower is the benefit of PCM systems in comparison to storages using water as the storage fluid. For the determination of SC, a temperature range for charging and discharging is defined as the ∆T
load. The SF is given as the volume-specific sensible and latent heat within the temperature range of ∆T
load in comparison to the volume-specific sensible heat of water in the same temperature range. For the comparison, a value of 4.19 kJ/(kg·K) as the specific heat capacity for water and a density at 20 °C of 0.998 kg/L were used [
19]. As the material datasheets showed no difference in the densities of the used pure paraffins, density measurements were performed using the Parafol 18-97 emulsion. The density was measured 4 times at 35 °C using an Anton Paar DMA 4500 divece from Anton Paar GmbH, Hellmuth-Hirth-Straße 6, 73760 Ostfildern, Germany. It was determined as 0.872 kg/L with a standard deviation of ±12 kg/L considering all 4 measurements. In this study, different temperature points were chosen to obtain different ∆T
load to determine the SC and SF (in the following, called methods a–d):
- (a)
Temperature range between the start of melting (Tm-start) and end of melting (Tm-end).
- (b)
Temperature range of −6 K from the end of melting (Tm-end) taking only the melting curve into account.
- (c)
Temperature range of −6 K from the end of melting (T
m-end) considering the crystallisation curve (see
Figure 1).
- (d)
Temperature range between the end of melting (Tm-end) and end of crystallisation (Tc-end).
Tm-end is determined as the temperature where the difference of enthalpy between the crystallisation and melting curve is smaller than 0.2 kJ/kg the first time when subtracting the melting curve from the crystallisation curve, starting from the onset temperature of melting to higher temperatures. Tc-end is determined in the same way but by decreasing the temperature. Tm-start is chosen visually as the temperature of the melting curve were the slope starts to steepen.
The dependency of the available SC on supercooling is illustrated in
Figure 1. The graph shows a DSC measurement of a microencapsulated paraffin that is partly crystallised. The material shows two phase transitions. In the first measuring cycle, the material was cooled down to 20 °C and heated again to 40 °C. In the second cooling, it was only cooled down 25 °C and heated from this temperature again (black, dashed line). As visible in this case, the available SC was determined by the crystallisation curve. In the following analyses, this behaviour was considered to determine the SC based on method c for the different PCM emulsions.
The rotational rheometer MCR 502 from Anton Paar GmbH, Hellmuth-Hirth-Straße 6, 73760 Ostfildern, Germany was used to determine the thermal–mechanical stability of the PCM emulsions. The setup allowed us to apply a defined heating and cooling rate to heat and cool a sample within a defined temperature range, as well as to stress the sample with a defined shear rate at the same time. The stability was tested in a concentric cylinder measuring system, consisting of a measuring body and a measuring cup, wherein the measuring body was rotated. This setup was suitable for low viscous fluids and a relatively large amount of sample could be applied. By using cylindrical geometry, the errors caused by the evaporation of water from the sample were reduced, having a minor effect on the measured results. During the measurements, evaporation was additionally reduced with a solvent trap. The PCM emulsion was heated up and cooled down at a defined rate of 0.05 K/s over 100 thermal cycles while being stressed with a constant shear rate of 100 1/s. This test will be called the thermal–mechanical stability test in the following. Before and after the thermal–mechanical stability test, a sample of the cycled PCM emulsion was analysed via DSC, and the particle size distribution was measured using the LS13320.
3. Results and Discussion
The used paraffins are characterised via DSC as well.
Table 1 summarizes all DSC results and
Figure 2 illustrates the variety of phase transitions and enthalpies within the dependency of temperature. All analysed paraffins show supercooling in the form of a hysteresis. Parafol 16-97 (P16-97), Parafol 18-97 (P18-97) and Parafol 20Z (P20Z) are linear
n-alkanes, with an even number of 16, 18 and 20 carbon atoms. In the DSC, they show a single-phase transition or two-phase transitions (P20Z) that are very close together when crystallising. The phase transitions are sharp and take place in a narrow temperature range. Linpar 17 (L17), Parafol 17-97 (P17-97), Parafol 19-90 (P19-90) and Parafol 19-97 (P19-97) are
n-alkanes with an odd number of carbon atoms. These
n-alkanes show a clearly visible second phase transition in both the melting and crystallisation processes.
P17-97 has an onset temperature Tonset (melting point) of 21.2 °C, L17 of 20.5 °C, P19-90 of 30.5 °C and P19-97 of 31.2 °C. These paraffins show a smaller hysteresis than most of the pure even-numbered paraffins, but the melting and crystallisation also take place over a broader temperature range. Combined with the two-phase transitions, the temperature difference in an application must then be comparatively large to use the full latent of the storage capacity. For example, P17-97 requires a temperature range of 8 K when only the first phase transition is used and 15 K when the second phase transition should be used as well. The comparison between P19-90 and P19-97 shows how impurities influence the storage capacity and the phase transition temperature. The total storage capacity is reduced from 222 kJ/kg for P19-97 to 207 kJ/kg for P19-90, and the melting temperature (Tonset) decreases from 31.2 °C to 30.5 °C.
RT27 is a purchasable blend of n-alkanes with paraffin, having a different numbers of carbon atoms in their hydrocarbon chains. The melting point Tonset is at 24.5 °C, which is close to that of P18-97 (27.3°C). The phase transition is in a temperature range that is larger than that of P18-97, and the enthalpy for the blend RT27 is 153 kJ/kg, which is 70 kJ/kg less than that of P18-97 (223 kJ/kg).
For the comparison with L17 and P17-97, which are both high-purity odd-numbered paraffins, a blend was mixed using 40 wt.% P16-97 and 60 wt.% P18-97. It has a melting point Tonset of 18.7 °C and an enthalpy of 151 kJ/kg. All the investigated blends show a small hysteresis but a broad temperature range for the phase transition in comparison to the pure PCMs.
P20Z is an n-alkane with twenty carbon atoms in the hydrocarbon chain. Its melting point Tonset is at 34.3 °C, and it offers an enthalpy of 211 kJ/kg. During crystallisation, it also shows two phase transitions, of which the first is the transition to the rotator phase and the second is the transition to the stable triclinic crystal form.
Table 1 summarises the paraffin´s most important properties from the DSC measurements.
3.1. PCM Emulsions
3.1.1. Particle Size Distribution
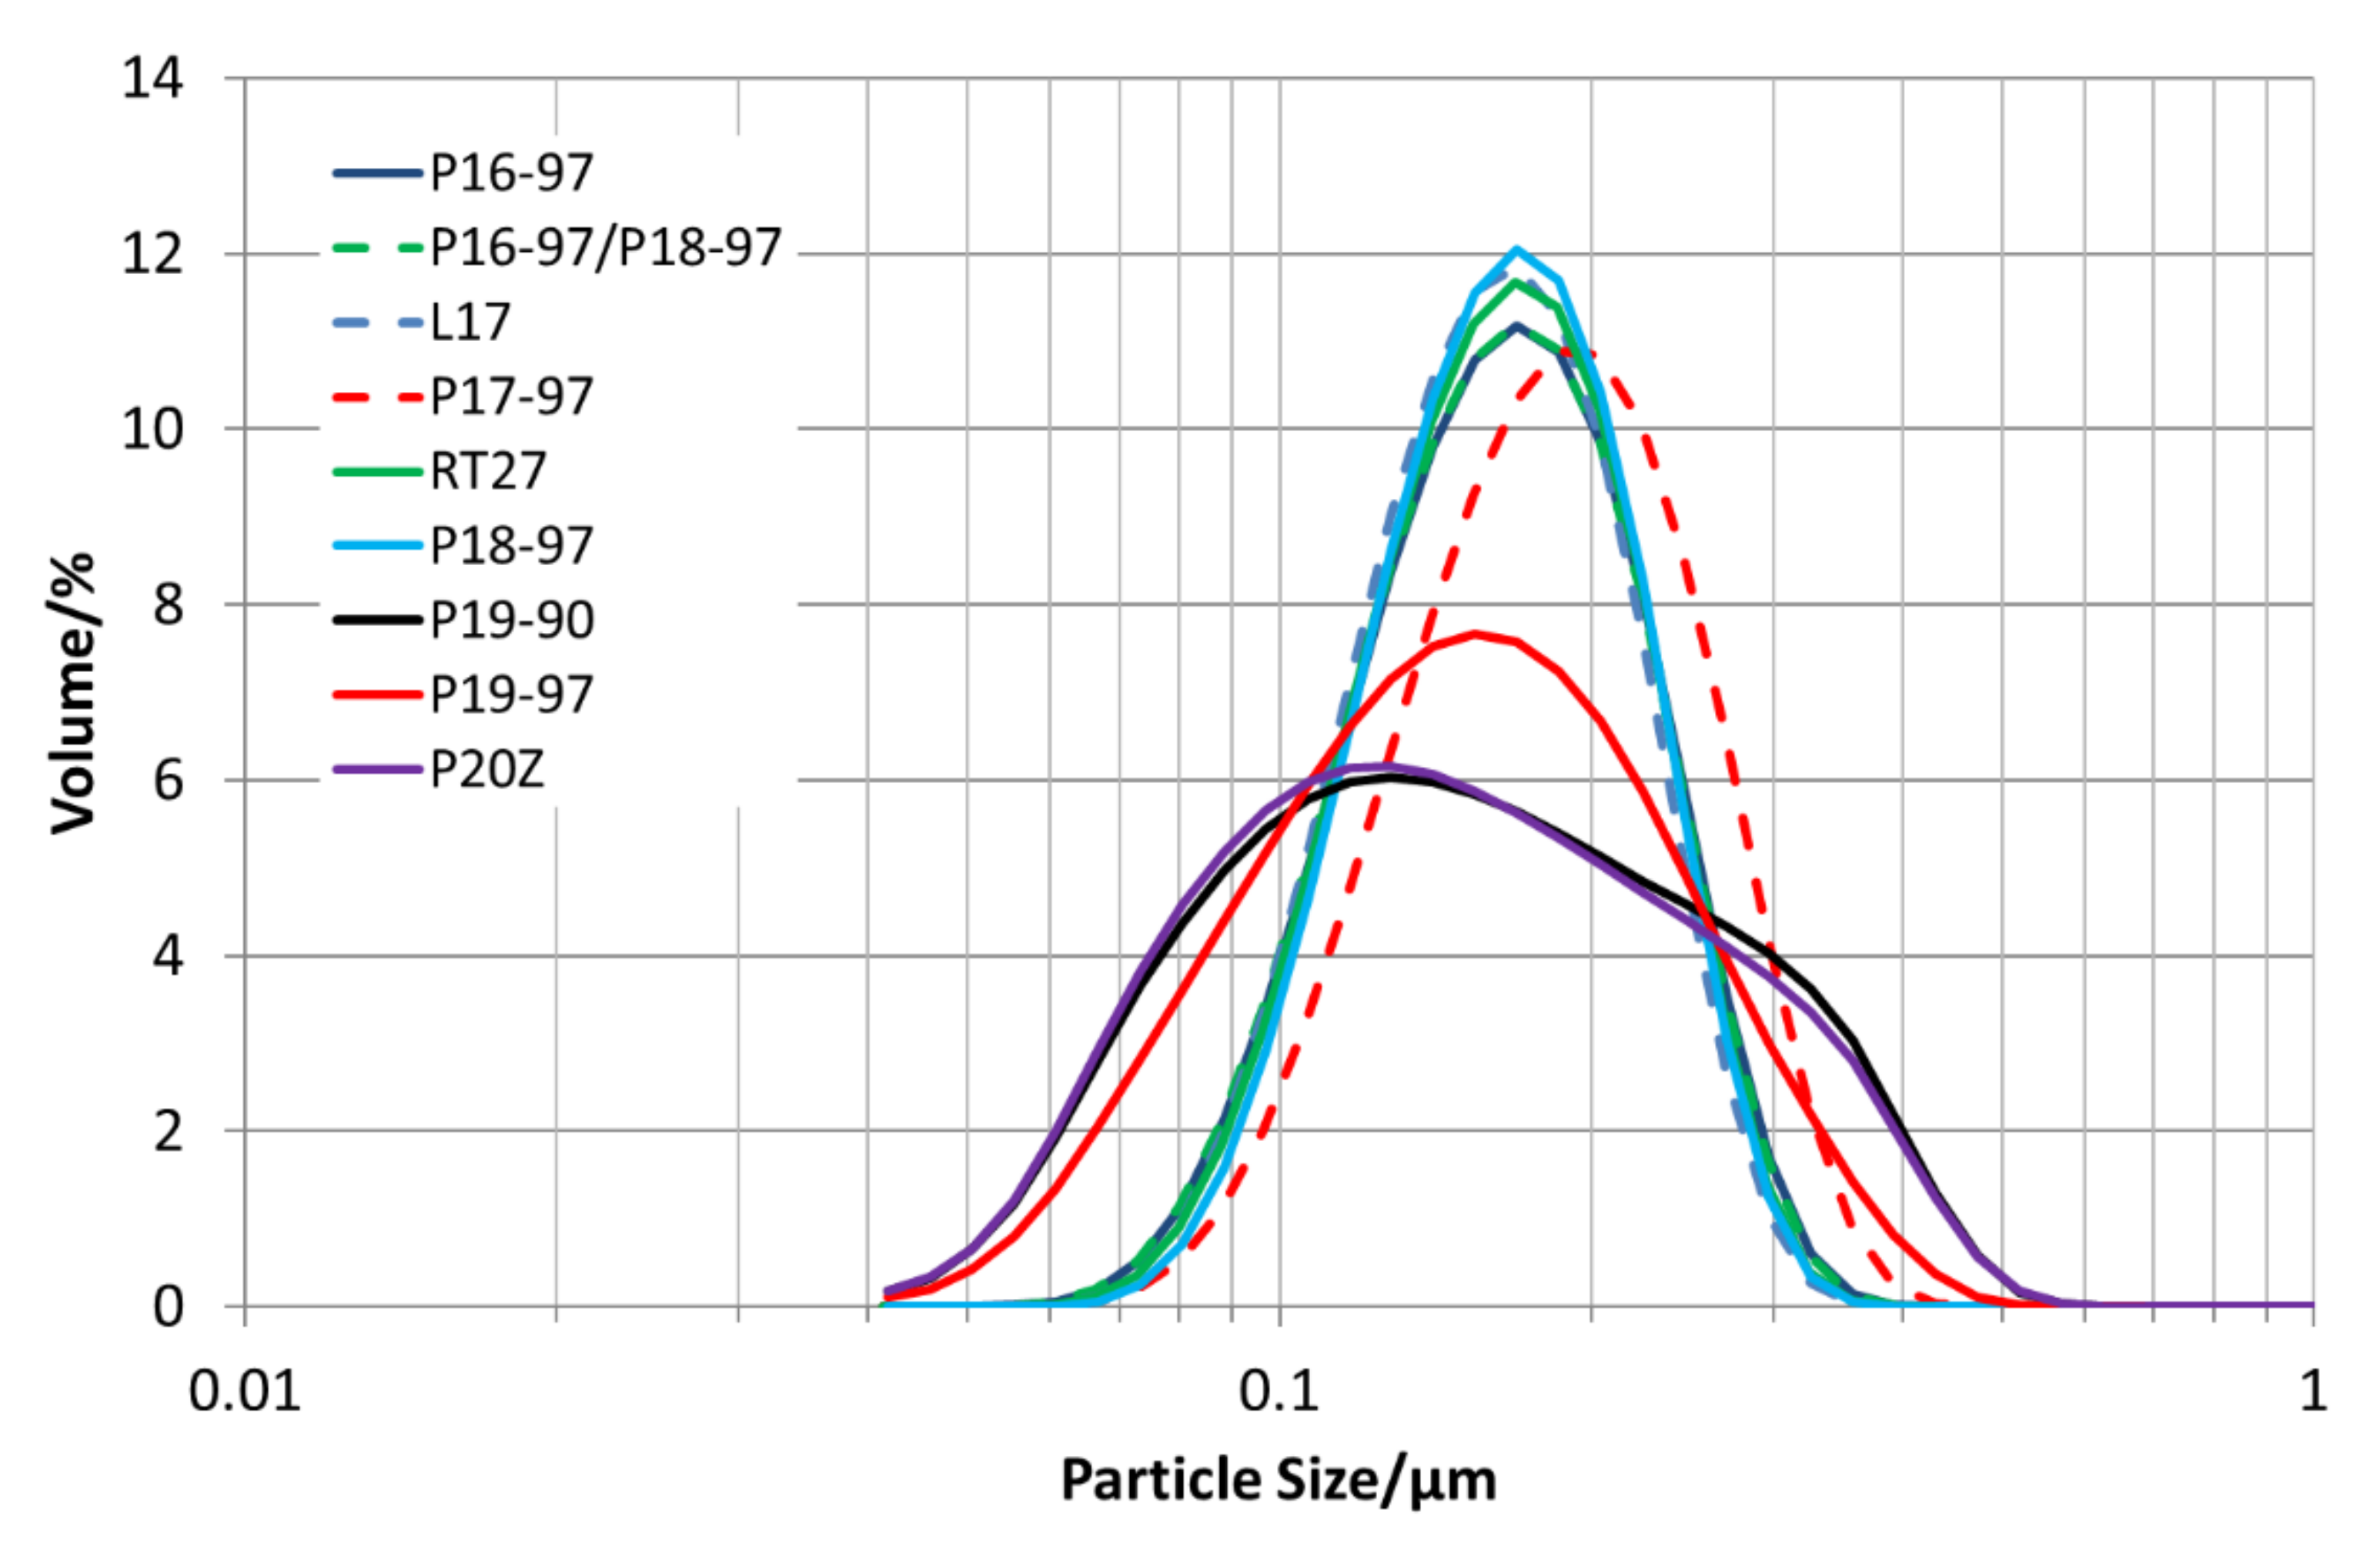
All PCM are dispersed with 35 wt.% of PCM in water and homogenised. Through homogenisation, a particle size distribution in the sub-micrometre range is reached, and thus, a high stability against creaming is obtained.
Figure 3 depicts the particle size distributions for all emulsions. All sizes are below 1 µm. The emulsions with P19-90 and P20Z have bimodal particle size distributions in the range between 45 and 600 nm, as well as P19-97; all others show a monomodal size distribution in the range between 60 and 500 nm.
3.1.2. Storage Capacities
The DSC results are summarised in
Table 2 for all the PCM emulsions. The melting enthalpies are in a range between 53 und 61 kJ/kg, which is on the level expected for odd-numbered paraffins due to the melting enthalpy of the first-phase transition of the used bulk paraffins. The even-numbered paraffin emulsions show a melting enthalpy that is less than 35% of the available bulk paraffin´s melting enthalpy (see Hf
PCM-1st-35% in
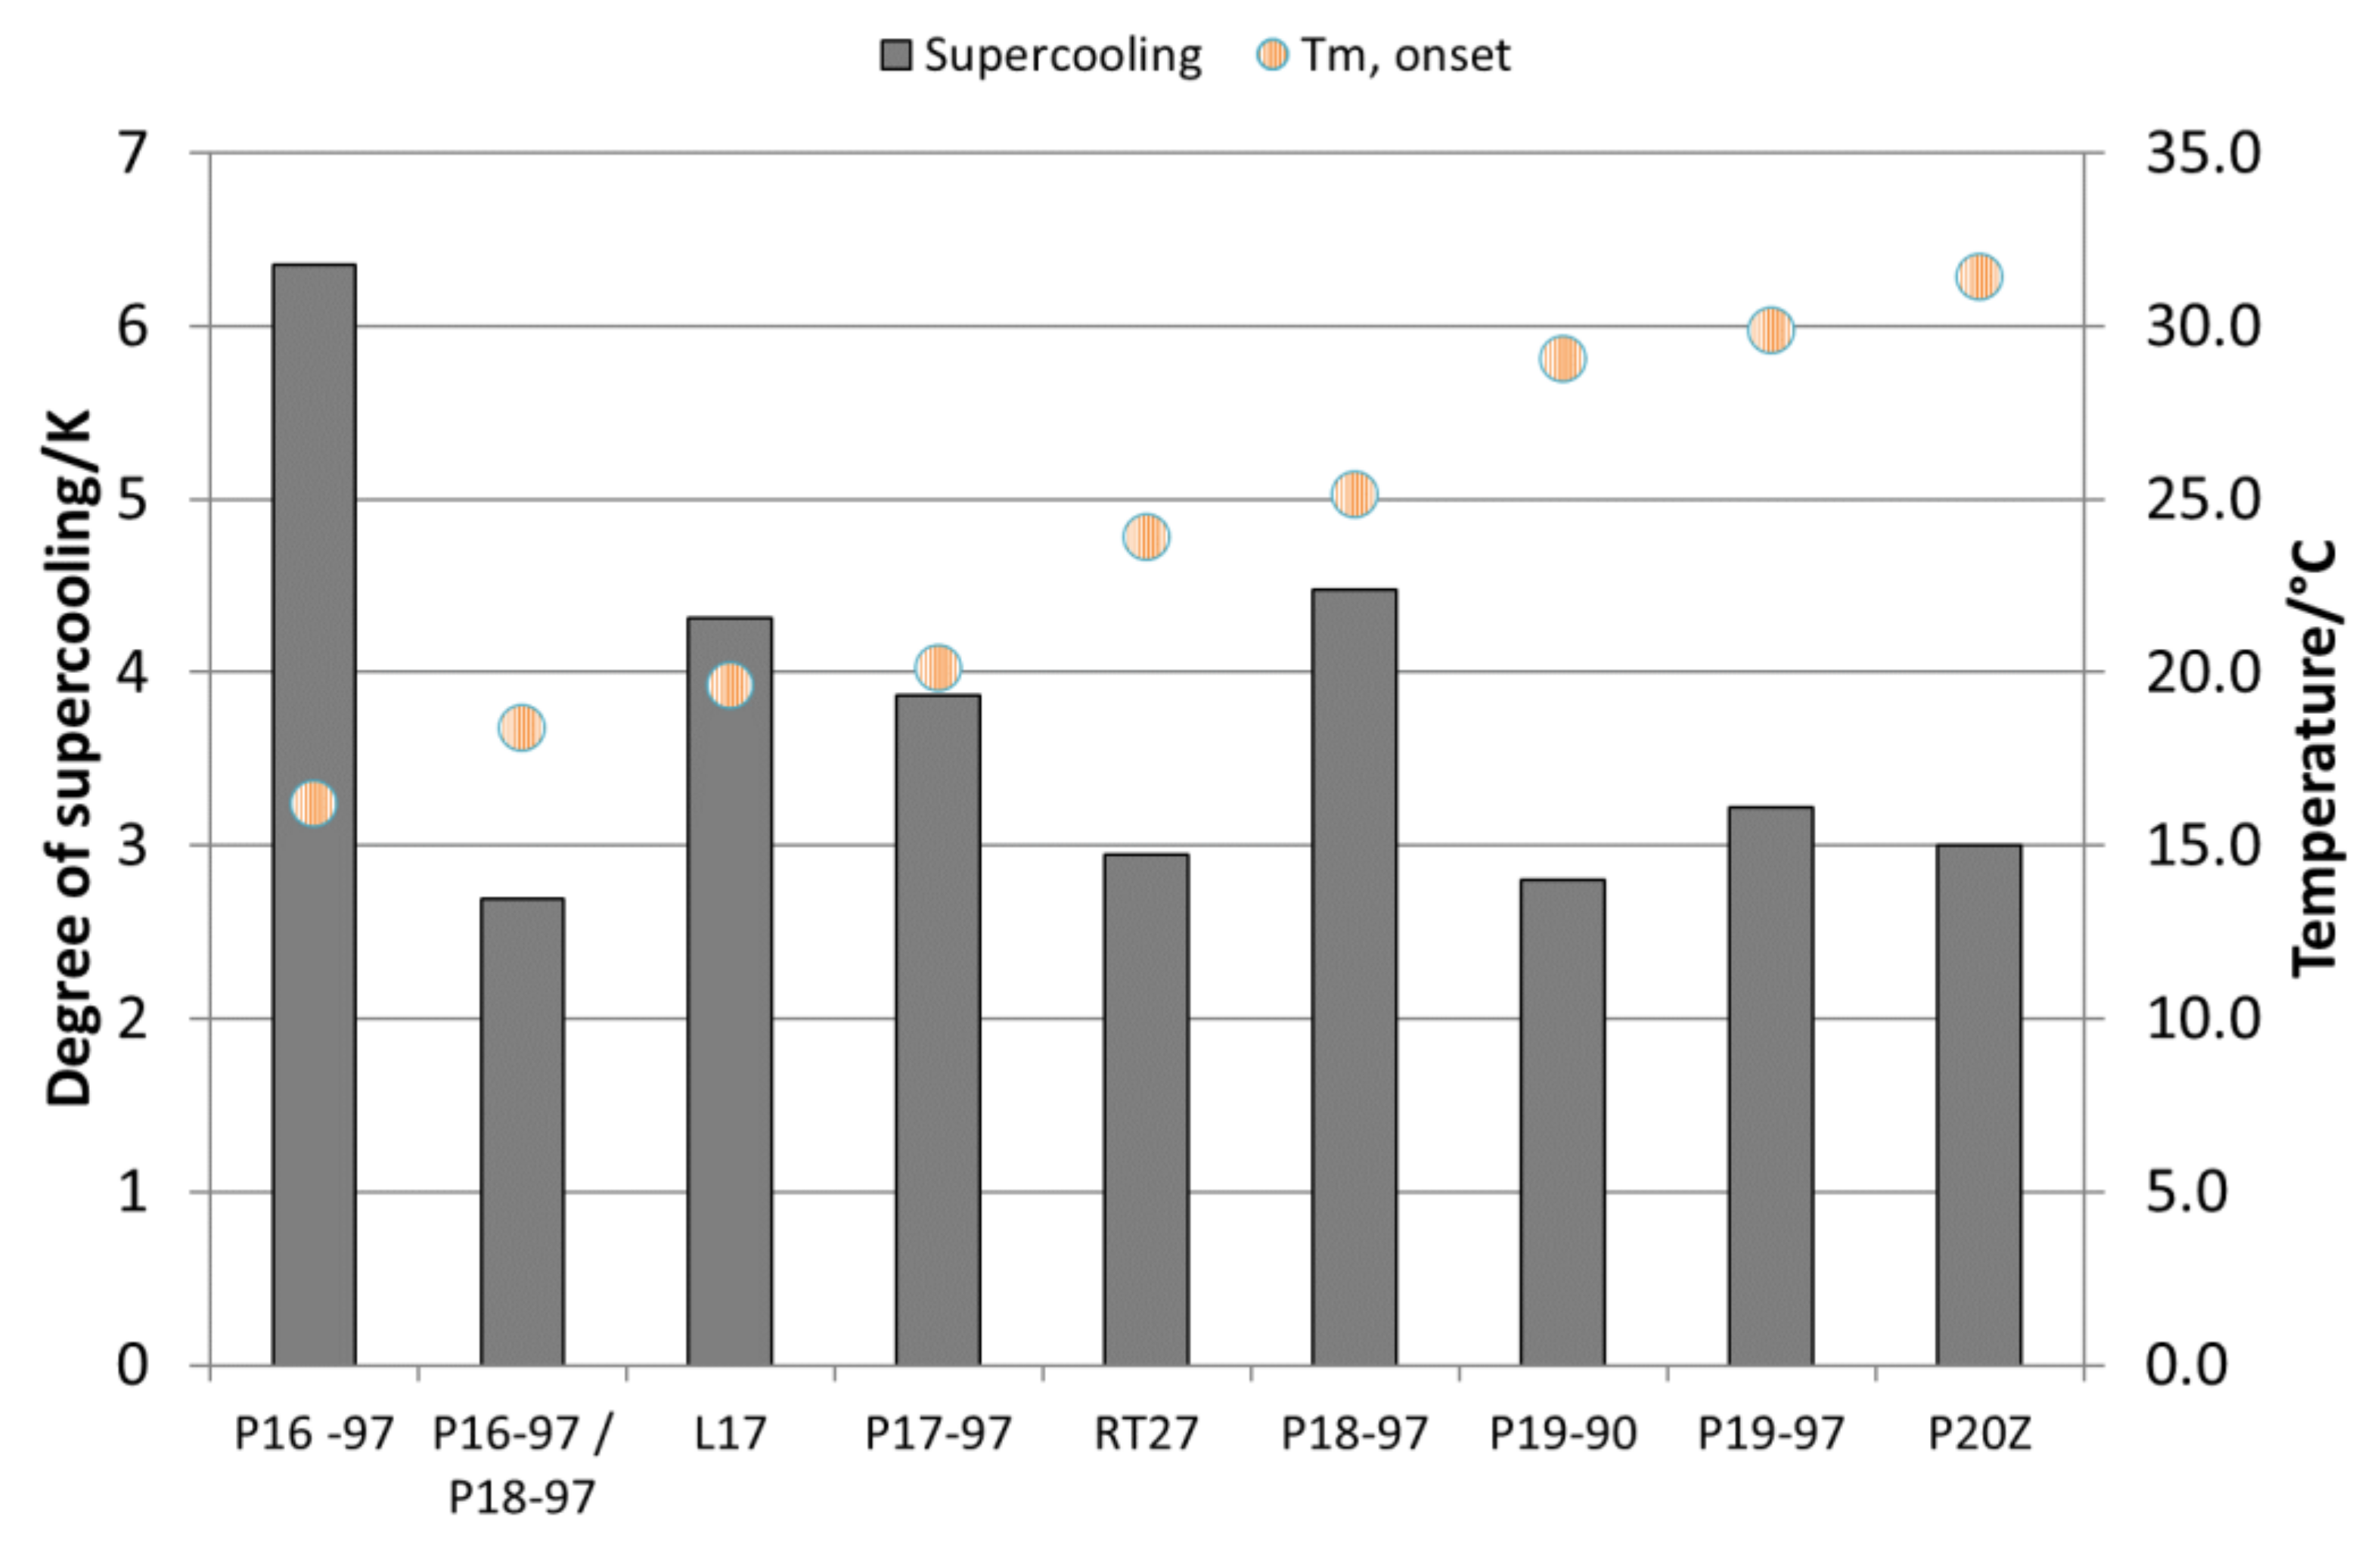
Table 2). This is due to the induction of a second-phase transition through the emulsification process. In comparison to the pure paraffins, all emulsions show a high degree of supercooling (∆T = T
m-offset − T
c-onset) that is listed in
Table 2 and shown in
Figure 4 for all the emulsions. Supercooling is reduced with an increasing melting temperature and samples with lower purity. Additionally, those emulsions prepared using paraffins with an odd number of C atoms in their hydrocarbon chain show a lower degree of supercooling than emulsions with even-numbered paraffins.
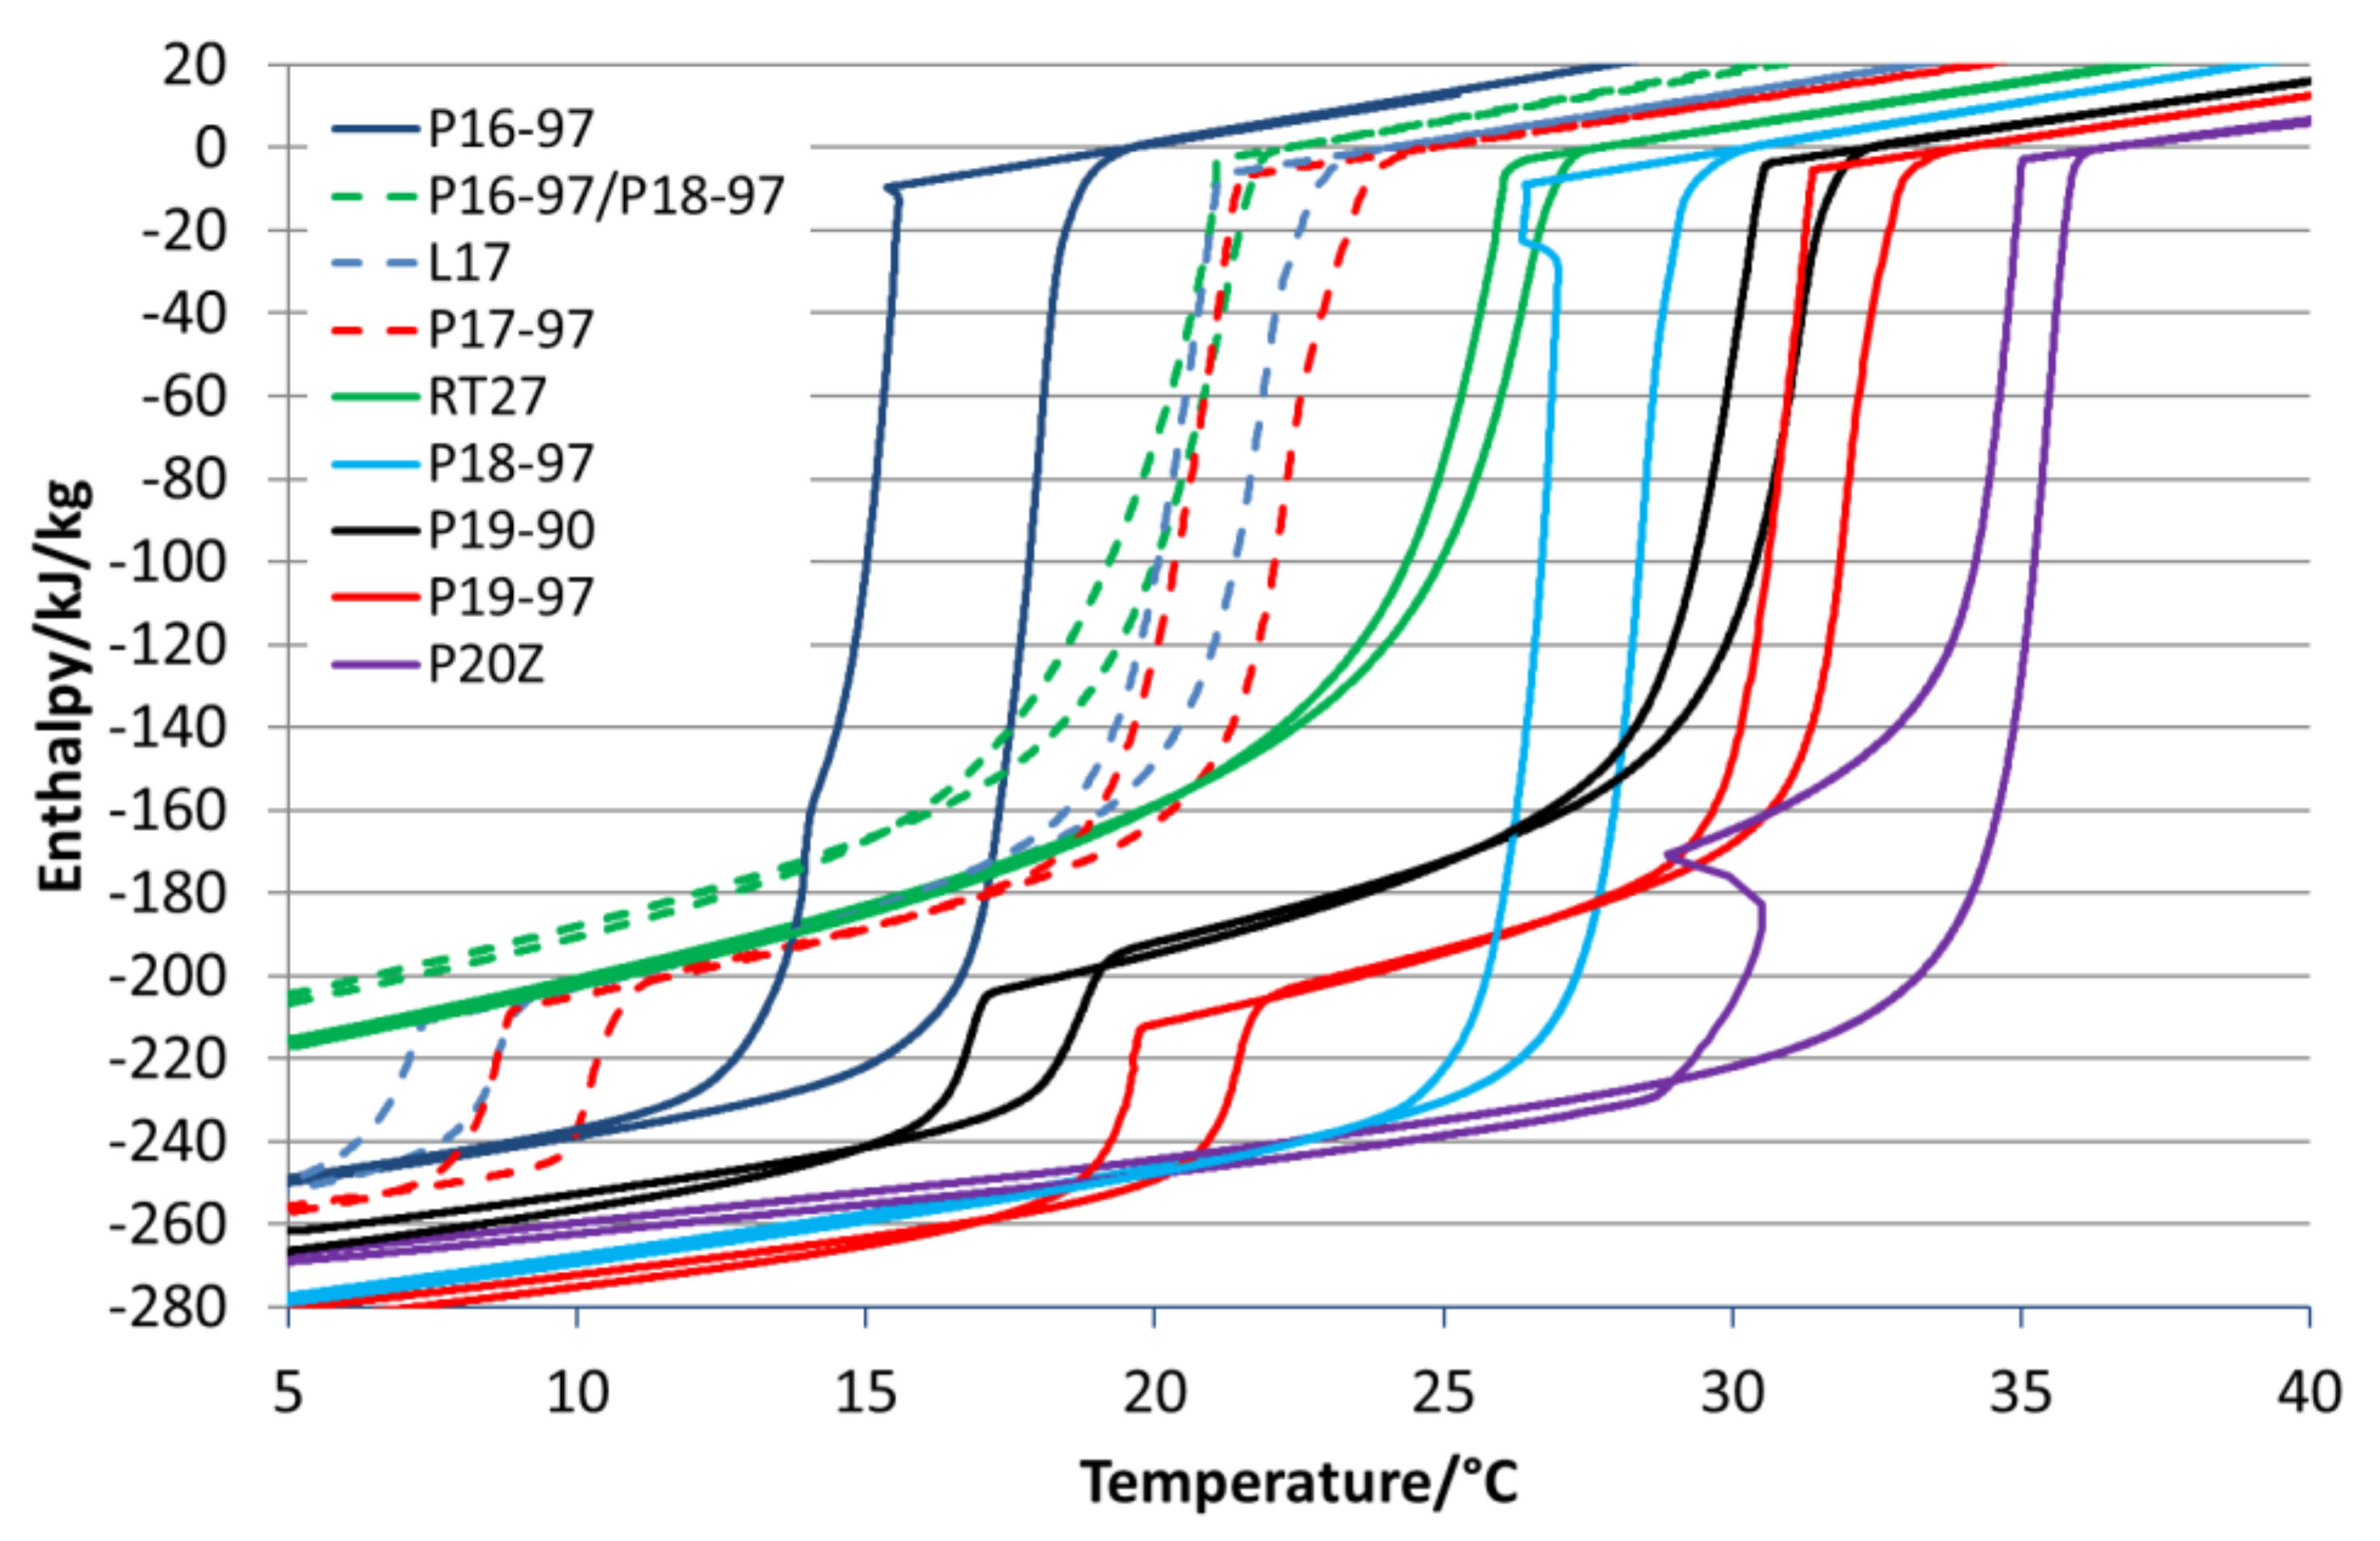
Figure 5 depicts the enthalpy curves for all PCM emulsions dependent on the temperature. The graph reveals that all emulsions have at least two-phase transitions in the measured temperature range, except the one prepared with a mixture of P16-97 and P18-97. It might have a second transition below the measured temperature range, but this could not be proved, as it was not possible to cool further down due to the freezing of the emulsion´s water fraction. The curves also show that those emulsions prepared with mixtures of paraffins (P16-97/P18-97, RT27) show broader melting and crystallisation ranges than those using purer paraffins.
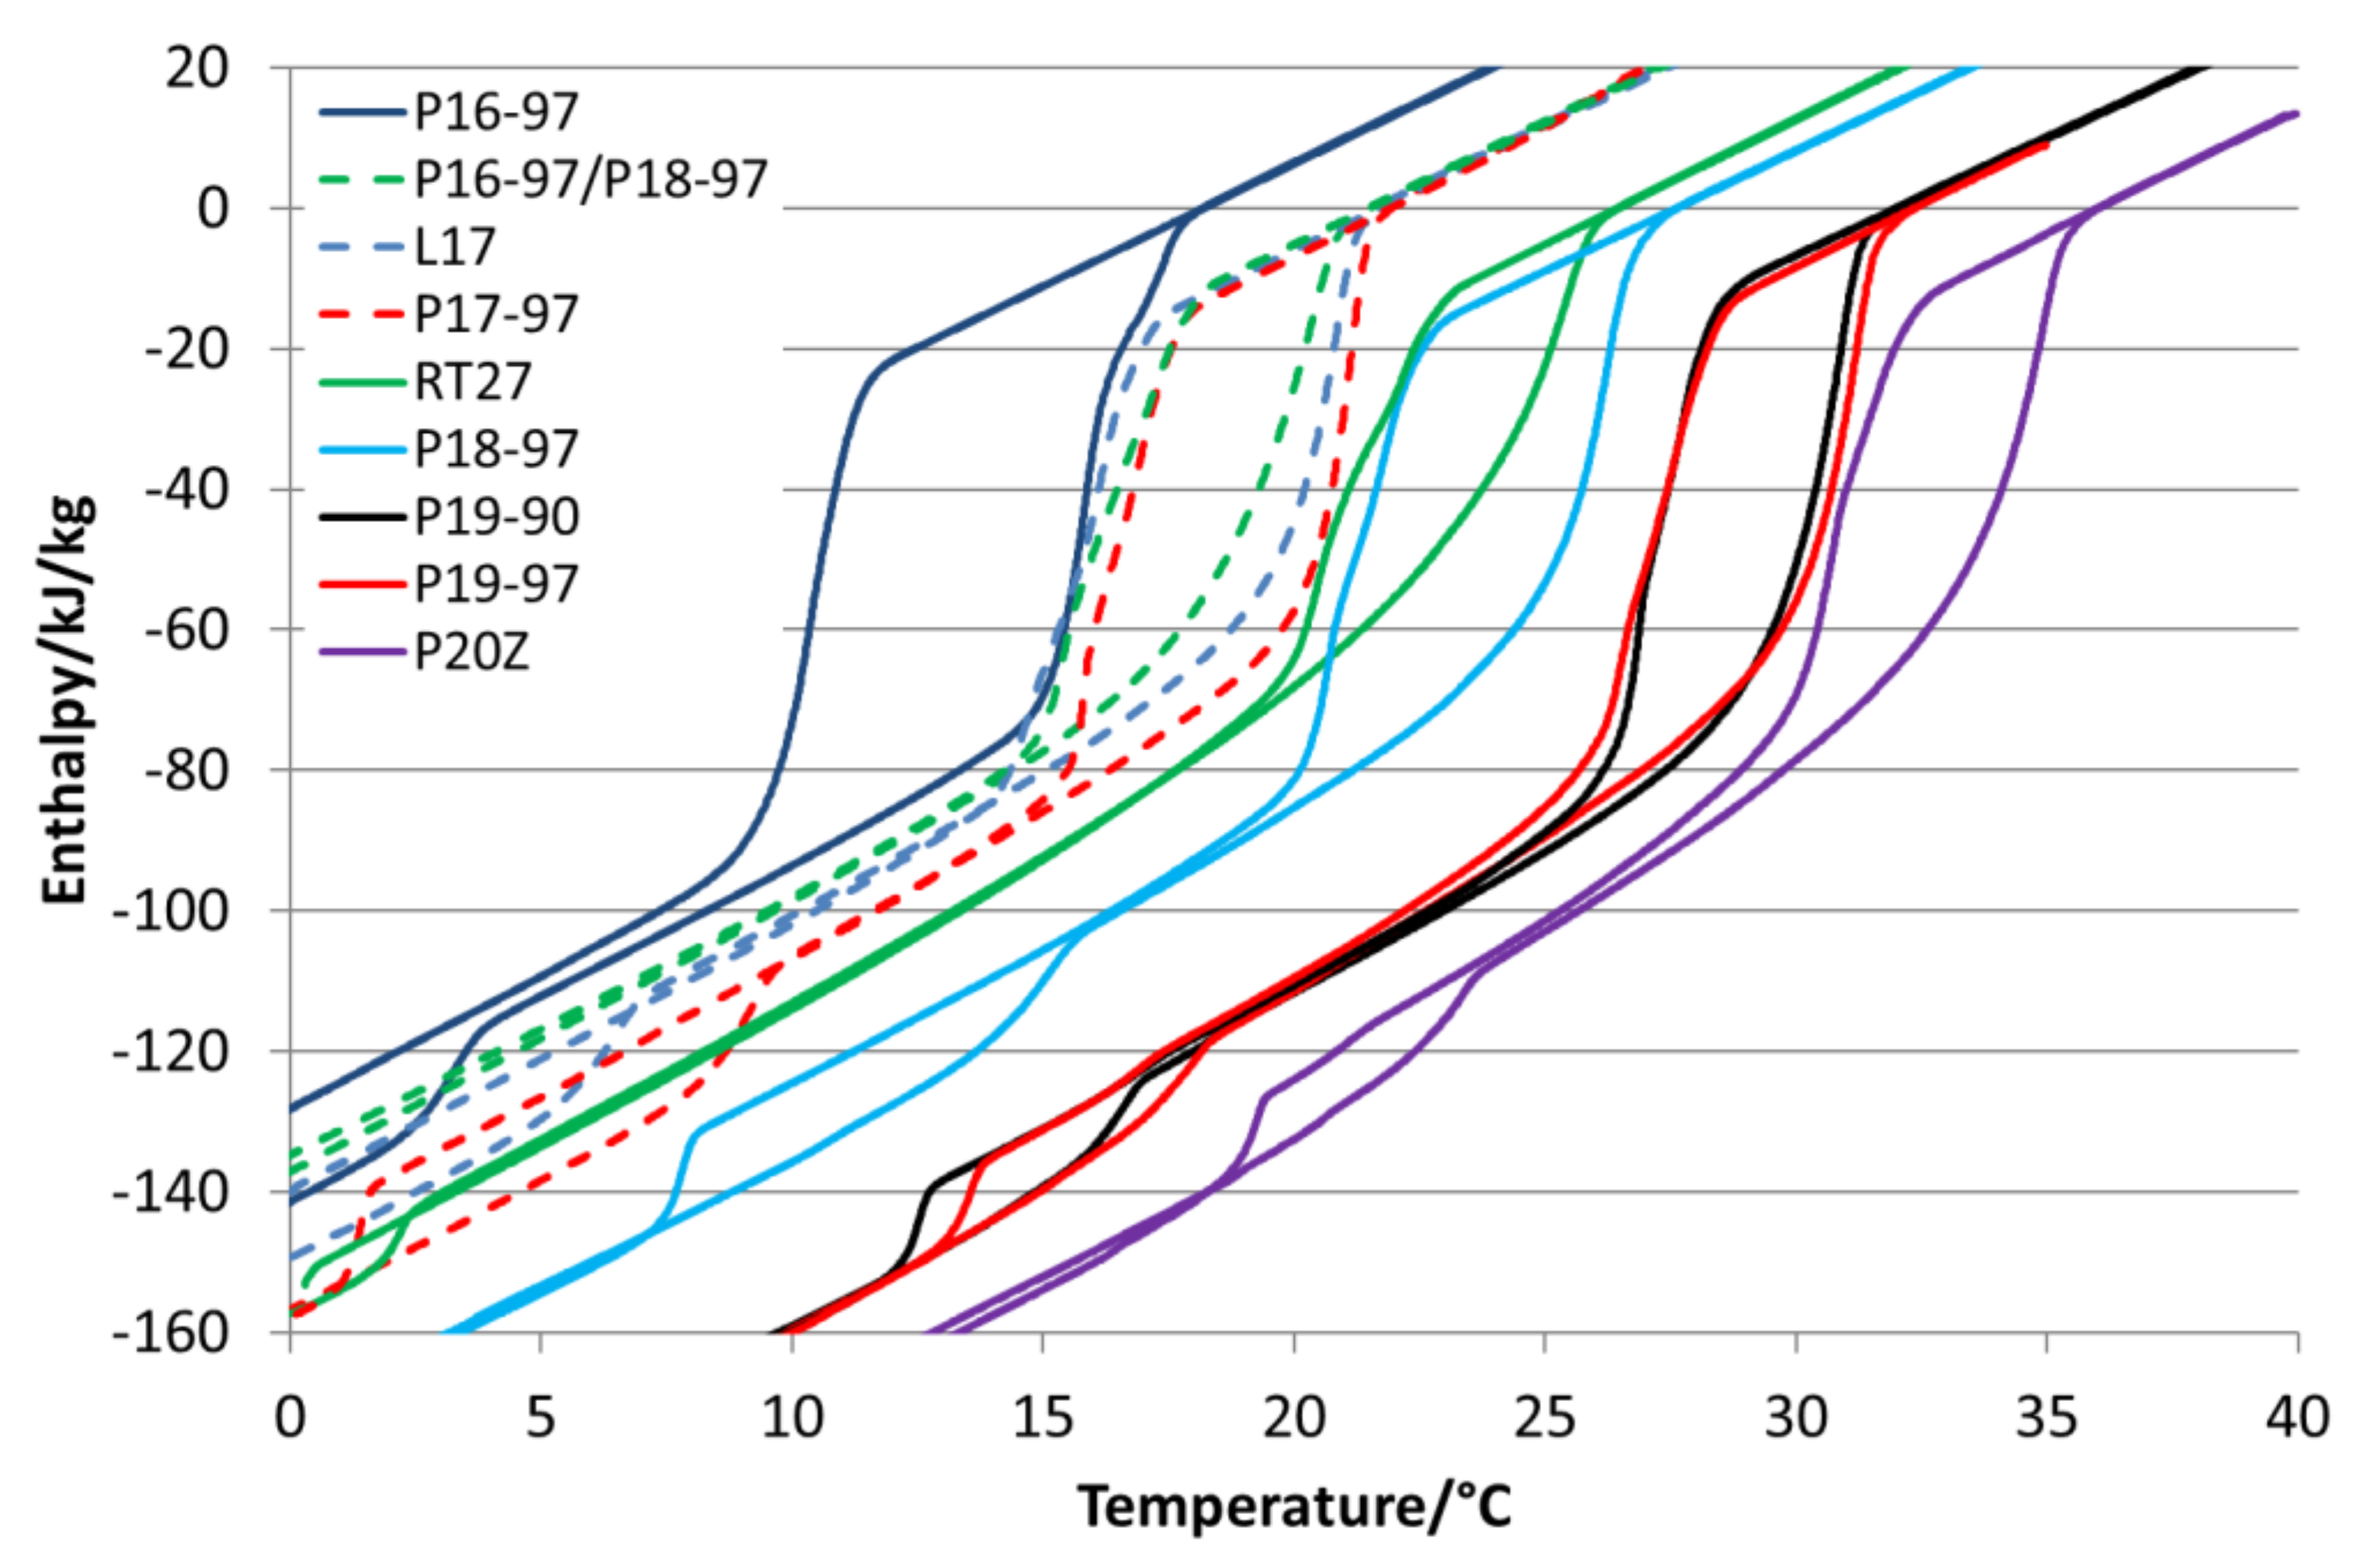
Figure 6 compares the enthalpy curves of L17, P17-97 and the mixture of P16-97/P18-97 emulsions. It is visible that L17 and the P16-97/P18-97 mixture offer almost the same enthalpy differences in the main transition range, whereas P17-97 melts at a higher temperature and shows a higher change in the enthalpy. Both the bulk PCM L17 and P17-97 have around 210 kJ/kg, while the blend of P16-97/P18-97 is 28% lower with 151 kJ/kg. After emulsification, the enthalpy of this mixture is only about 4.5% lower than that of the L17 and P17-97 emulsions (57.9 k/kg versus 60.6 kJ/kg). A similar effect can be seen for the P18-97 and RT27 emulsions. While the enthalpy of bulk RT-27 is 31% lower, it is only 14% lower when it is emulsified.
Despite the melting enthalpy for the bulk P16-97 being slightly higher (217 kJ/kg) than that of P20Z (211 kJ/kg), emulsified P20Z shows, with 59.0 kJ/kg, a slightly higher melting enthalpy than the emulsified P16-97, which provides 55.6 kJ/kg. One reason for this is the higher share of enthalpy within the second phase transition at a lower temperature for the P16-97 emulsion, which has 12.2 kJ/kg versus 8.6/kJ for the P20Z emulsion.
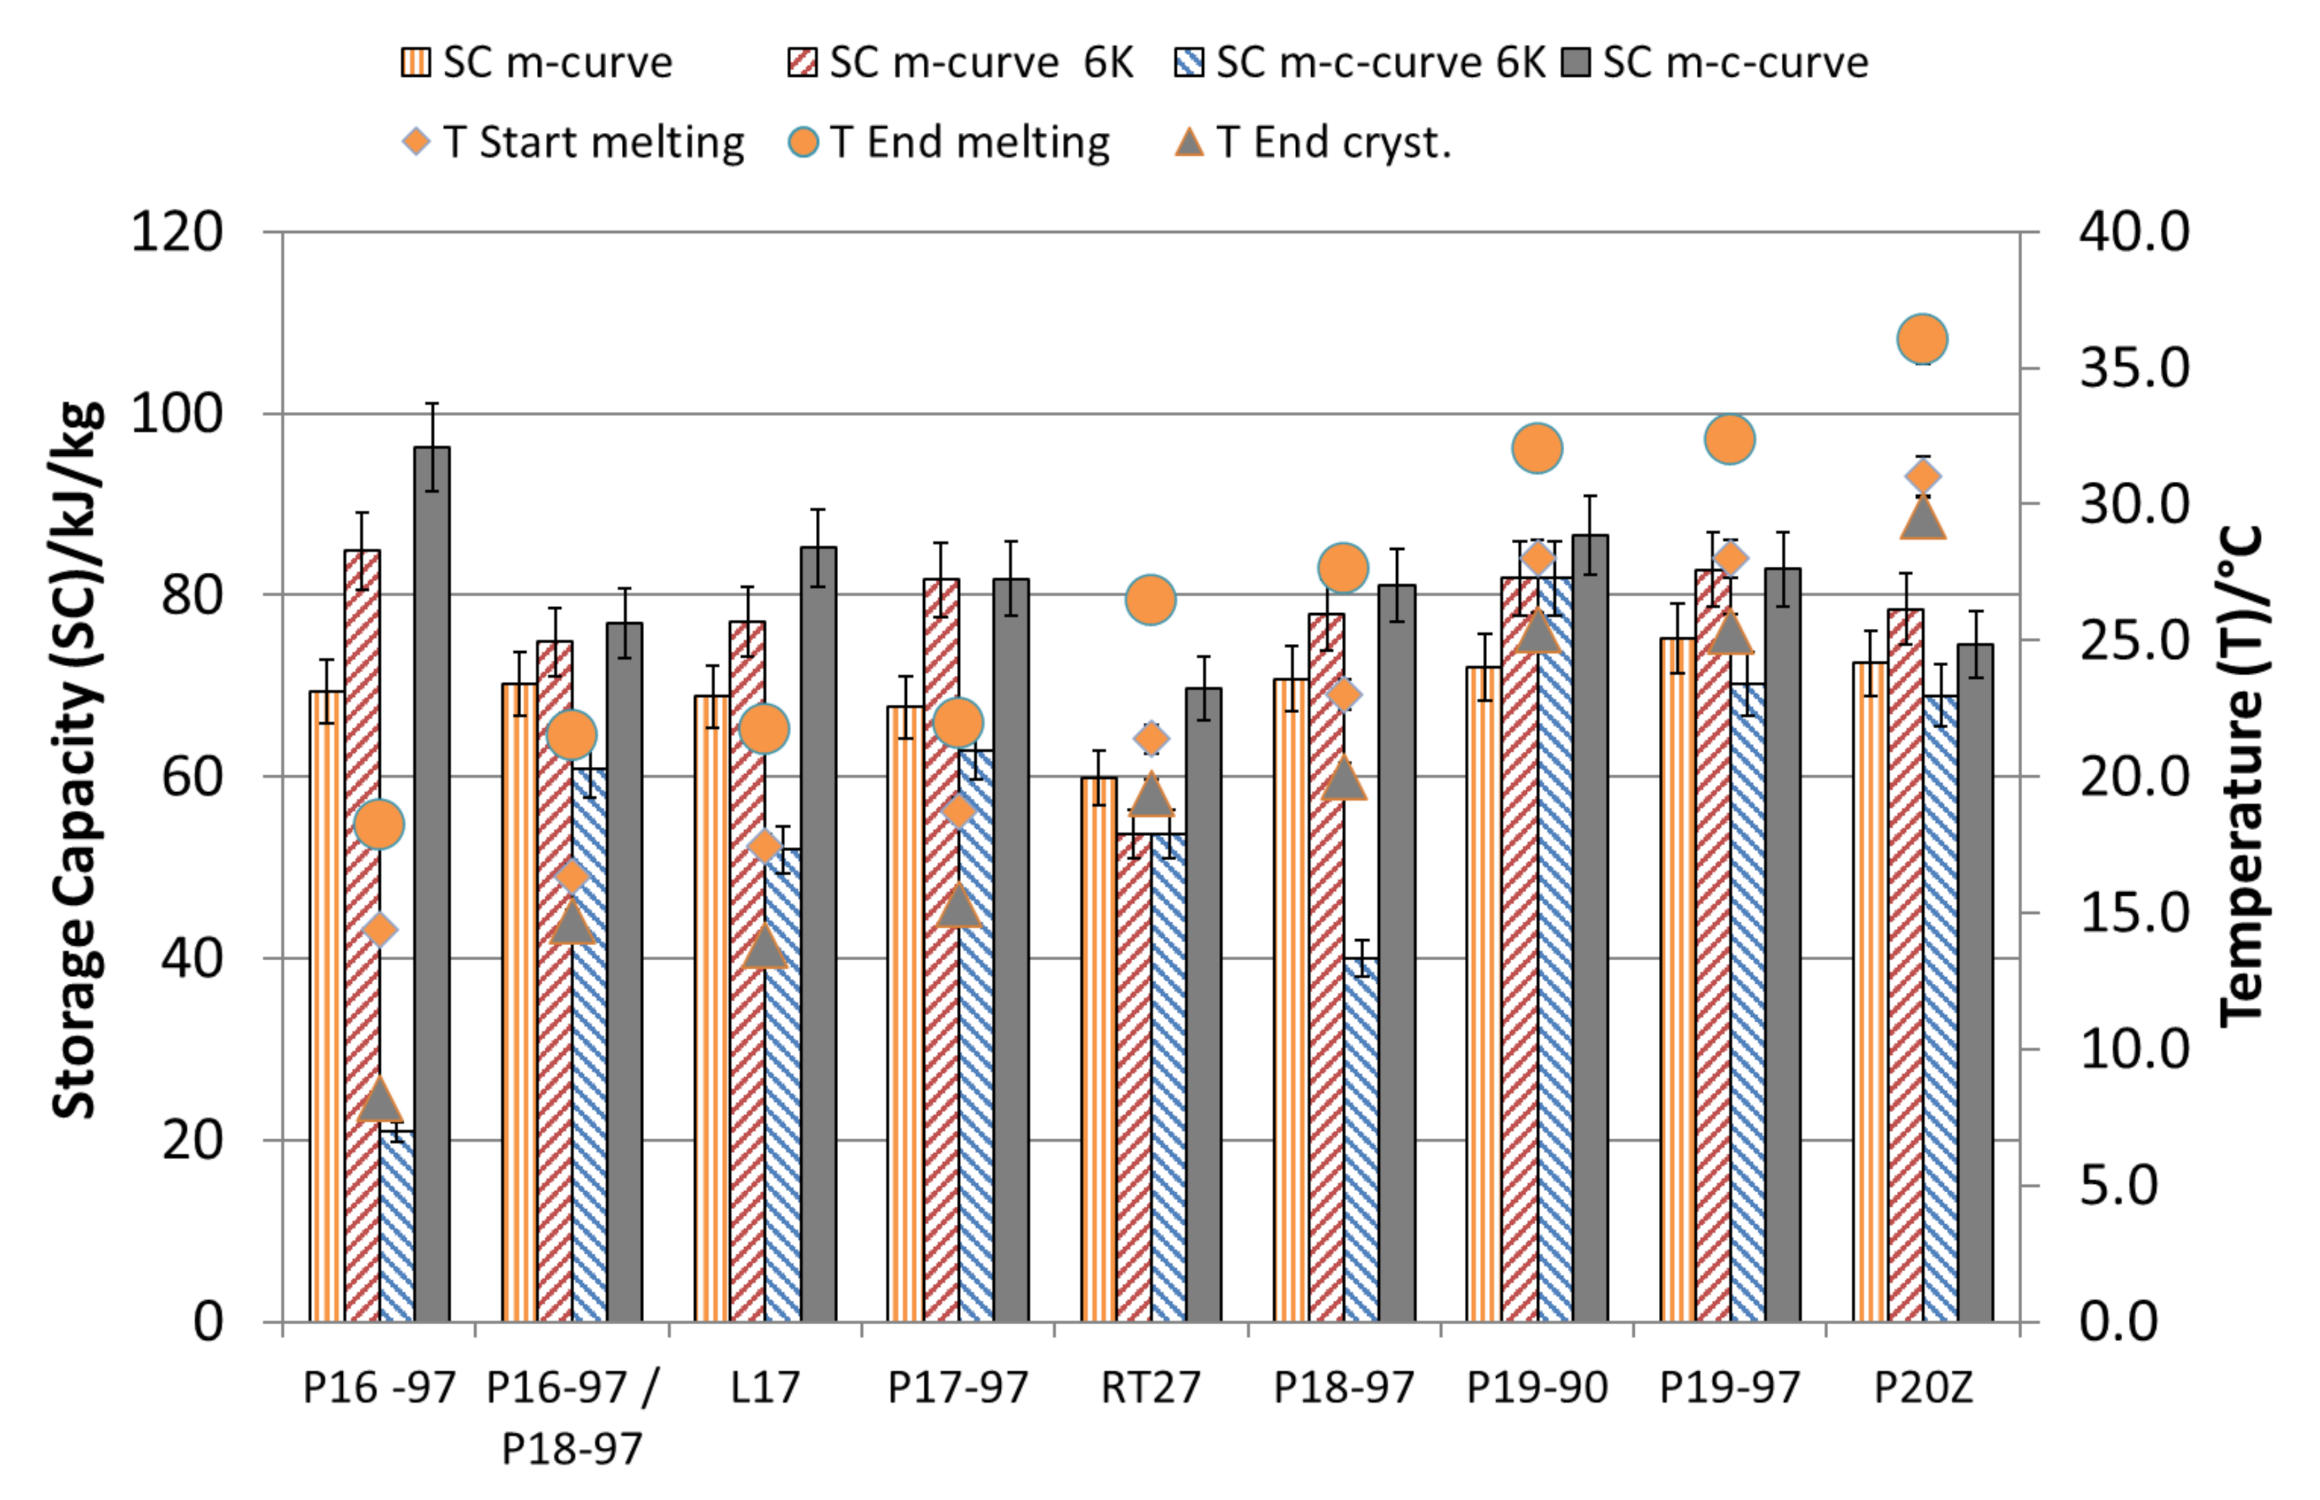
The storage capacities and temperature ranges for the emulsions, calculated according to methods a–d, are shown in
Figure 7 and listed in for method a and b in
Table 3 and and for method c and d in
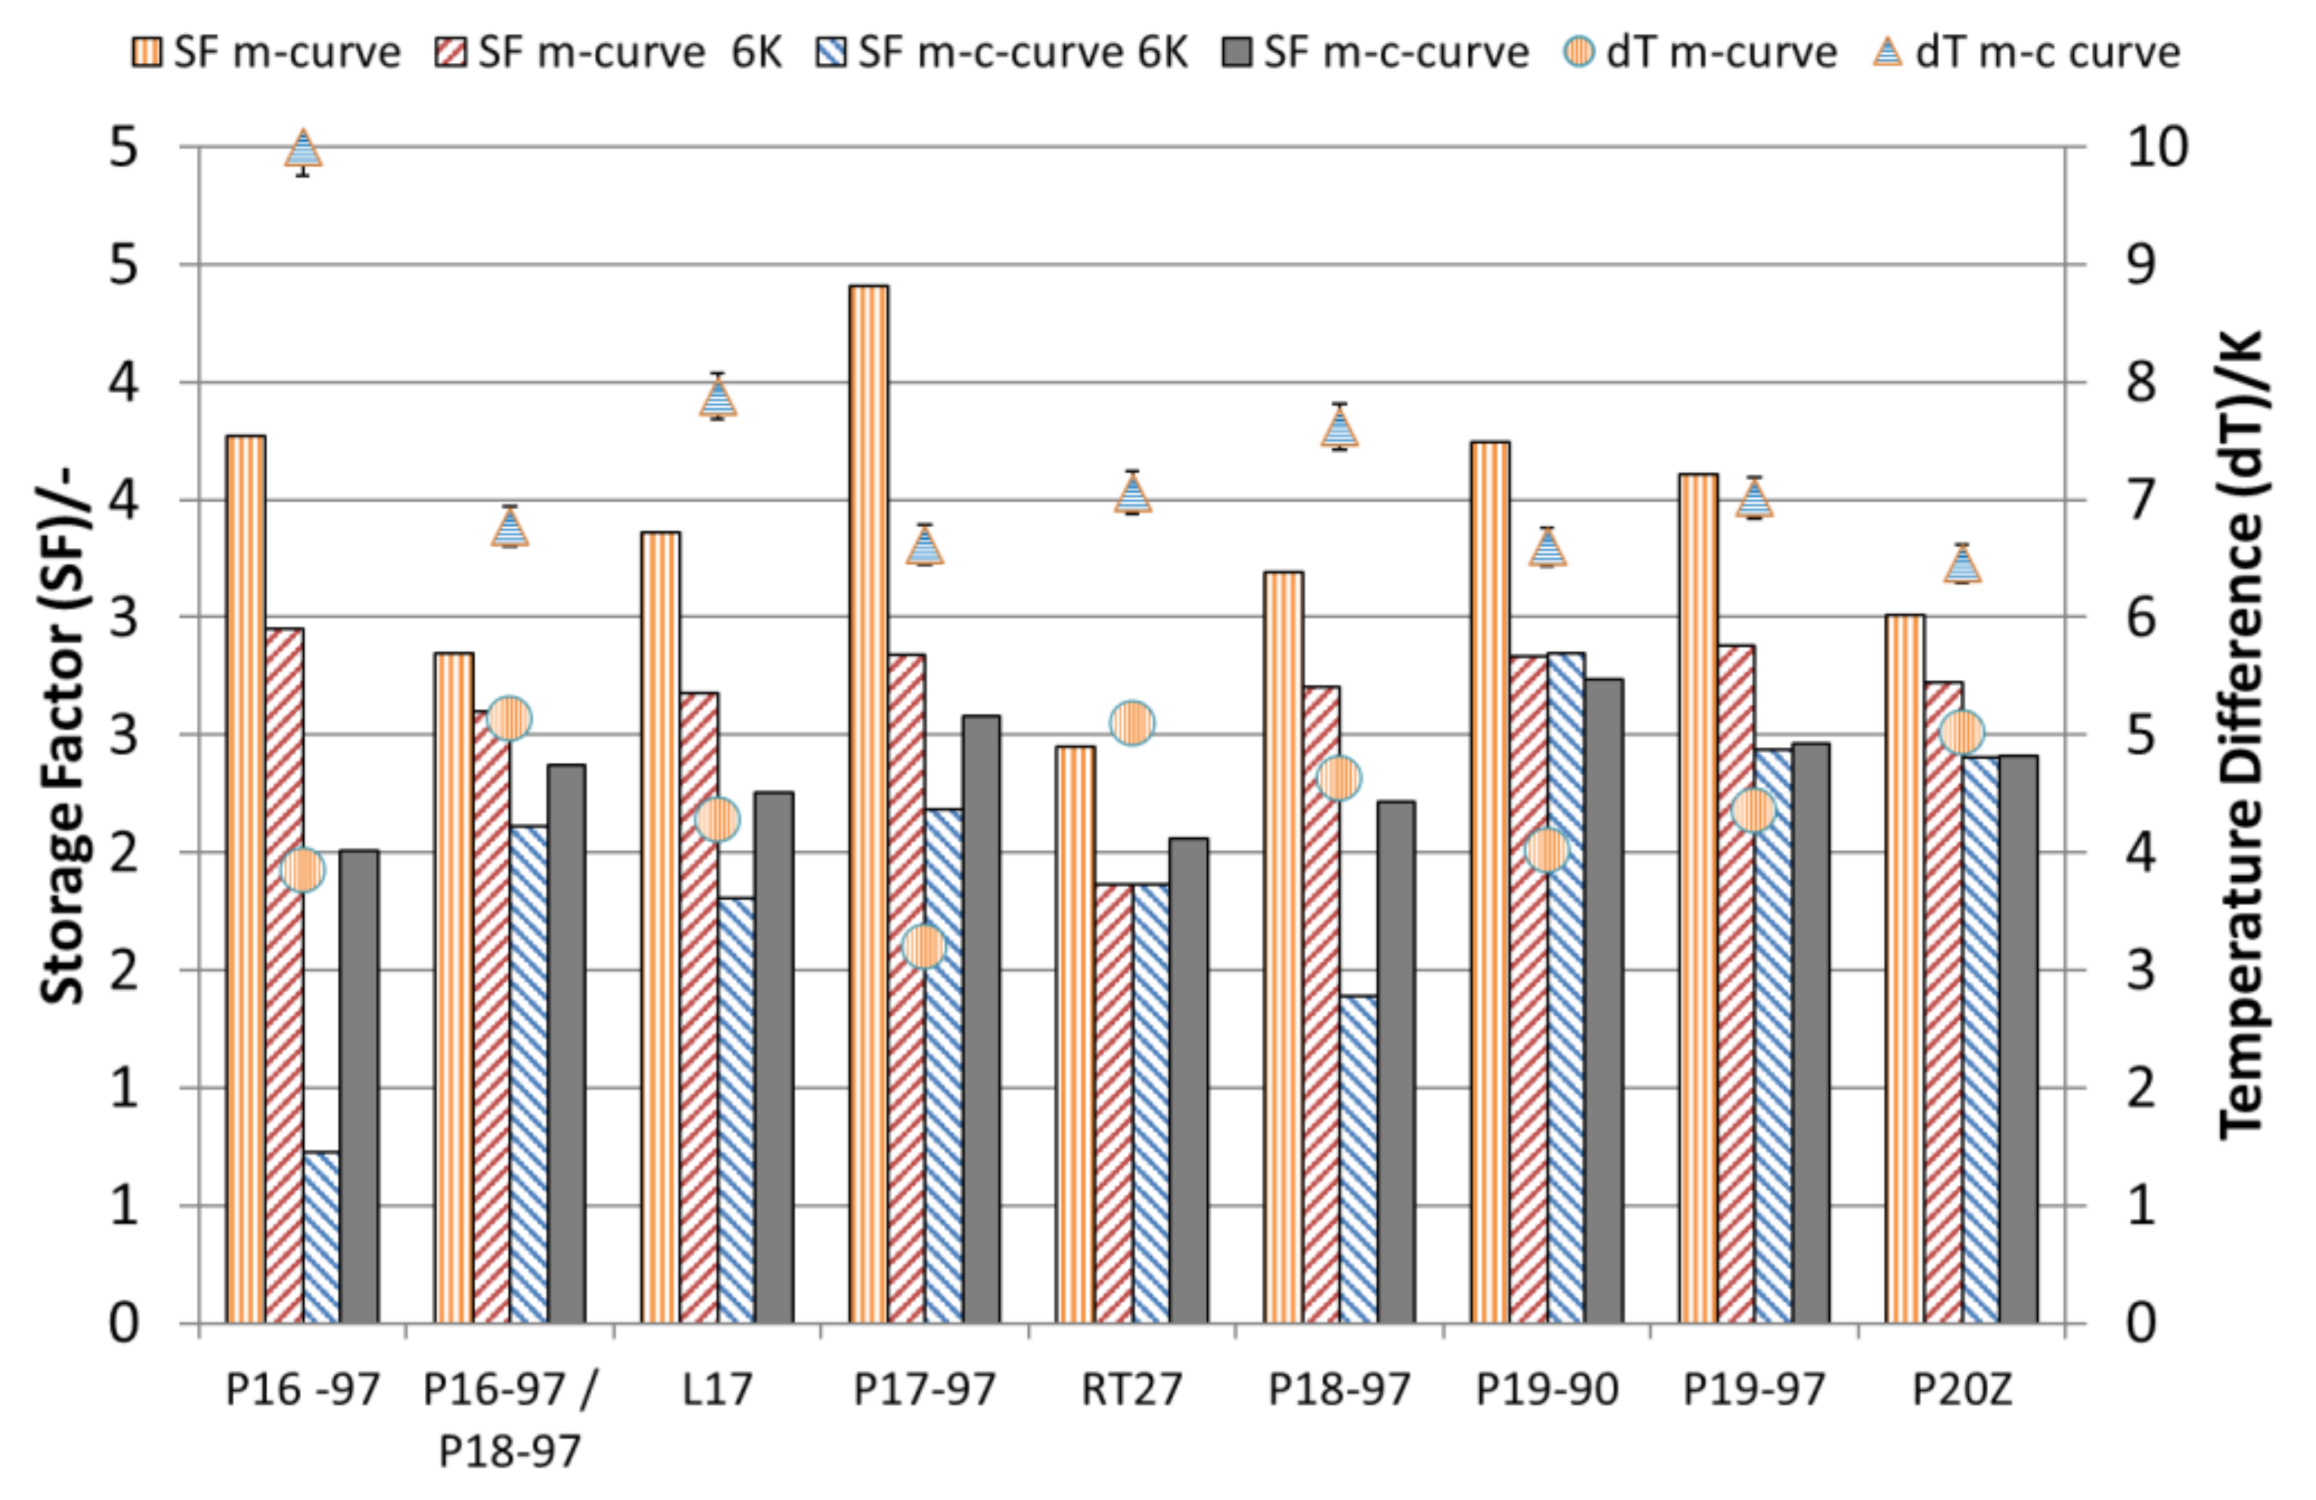
Table 4. As expected, the larger the chosen temperature range, the more storage capacity is available, except for the analyses considering a 6 K temperature difference and taking the crystallisation curves into account according to method c. These analyses revealed a much lower storage capacity, as expected from the enthalpy change of the melting curve. Here, those materials with a high degree of supercooling show the lowest storage capacity. The comparisons of the storage capacities with those that would be obtained using water as the storage medium are shown in
Figure 8. Here, a massive reduction of the benefits due to the supercooling phenomena and due to broad-phase transition temperature ranges is visible. The analyses that take only the melting curves into account (method a) show the maximum possible SF operating a system at the phase transition from a solid to liquid without any supercooling. Considering only the melting curve with a temperature range of 6 K (according to method b), the benefit is reduced for all materials but shows the realistic maximum benefit compared to water as the storage material in a real storage application. With the given supercooling and melting, as well as crystallisation ranges, P20Z, P19-97 and P17-97 perform best with a SF around 2.5. Considering the 6-K limit according to method c, RT27 offers a 1.8 higher SF than P18-97. Using the full temperature range (method d), P18-97 shows with 2.22 versus 2.06 (RT27) a 7.8% higher SF.
3.1.3. Thermal–Mechanical Stability
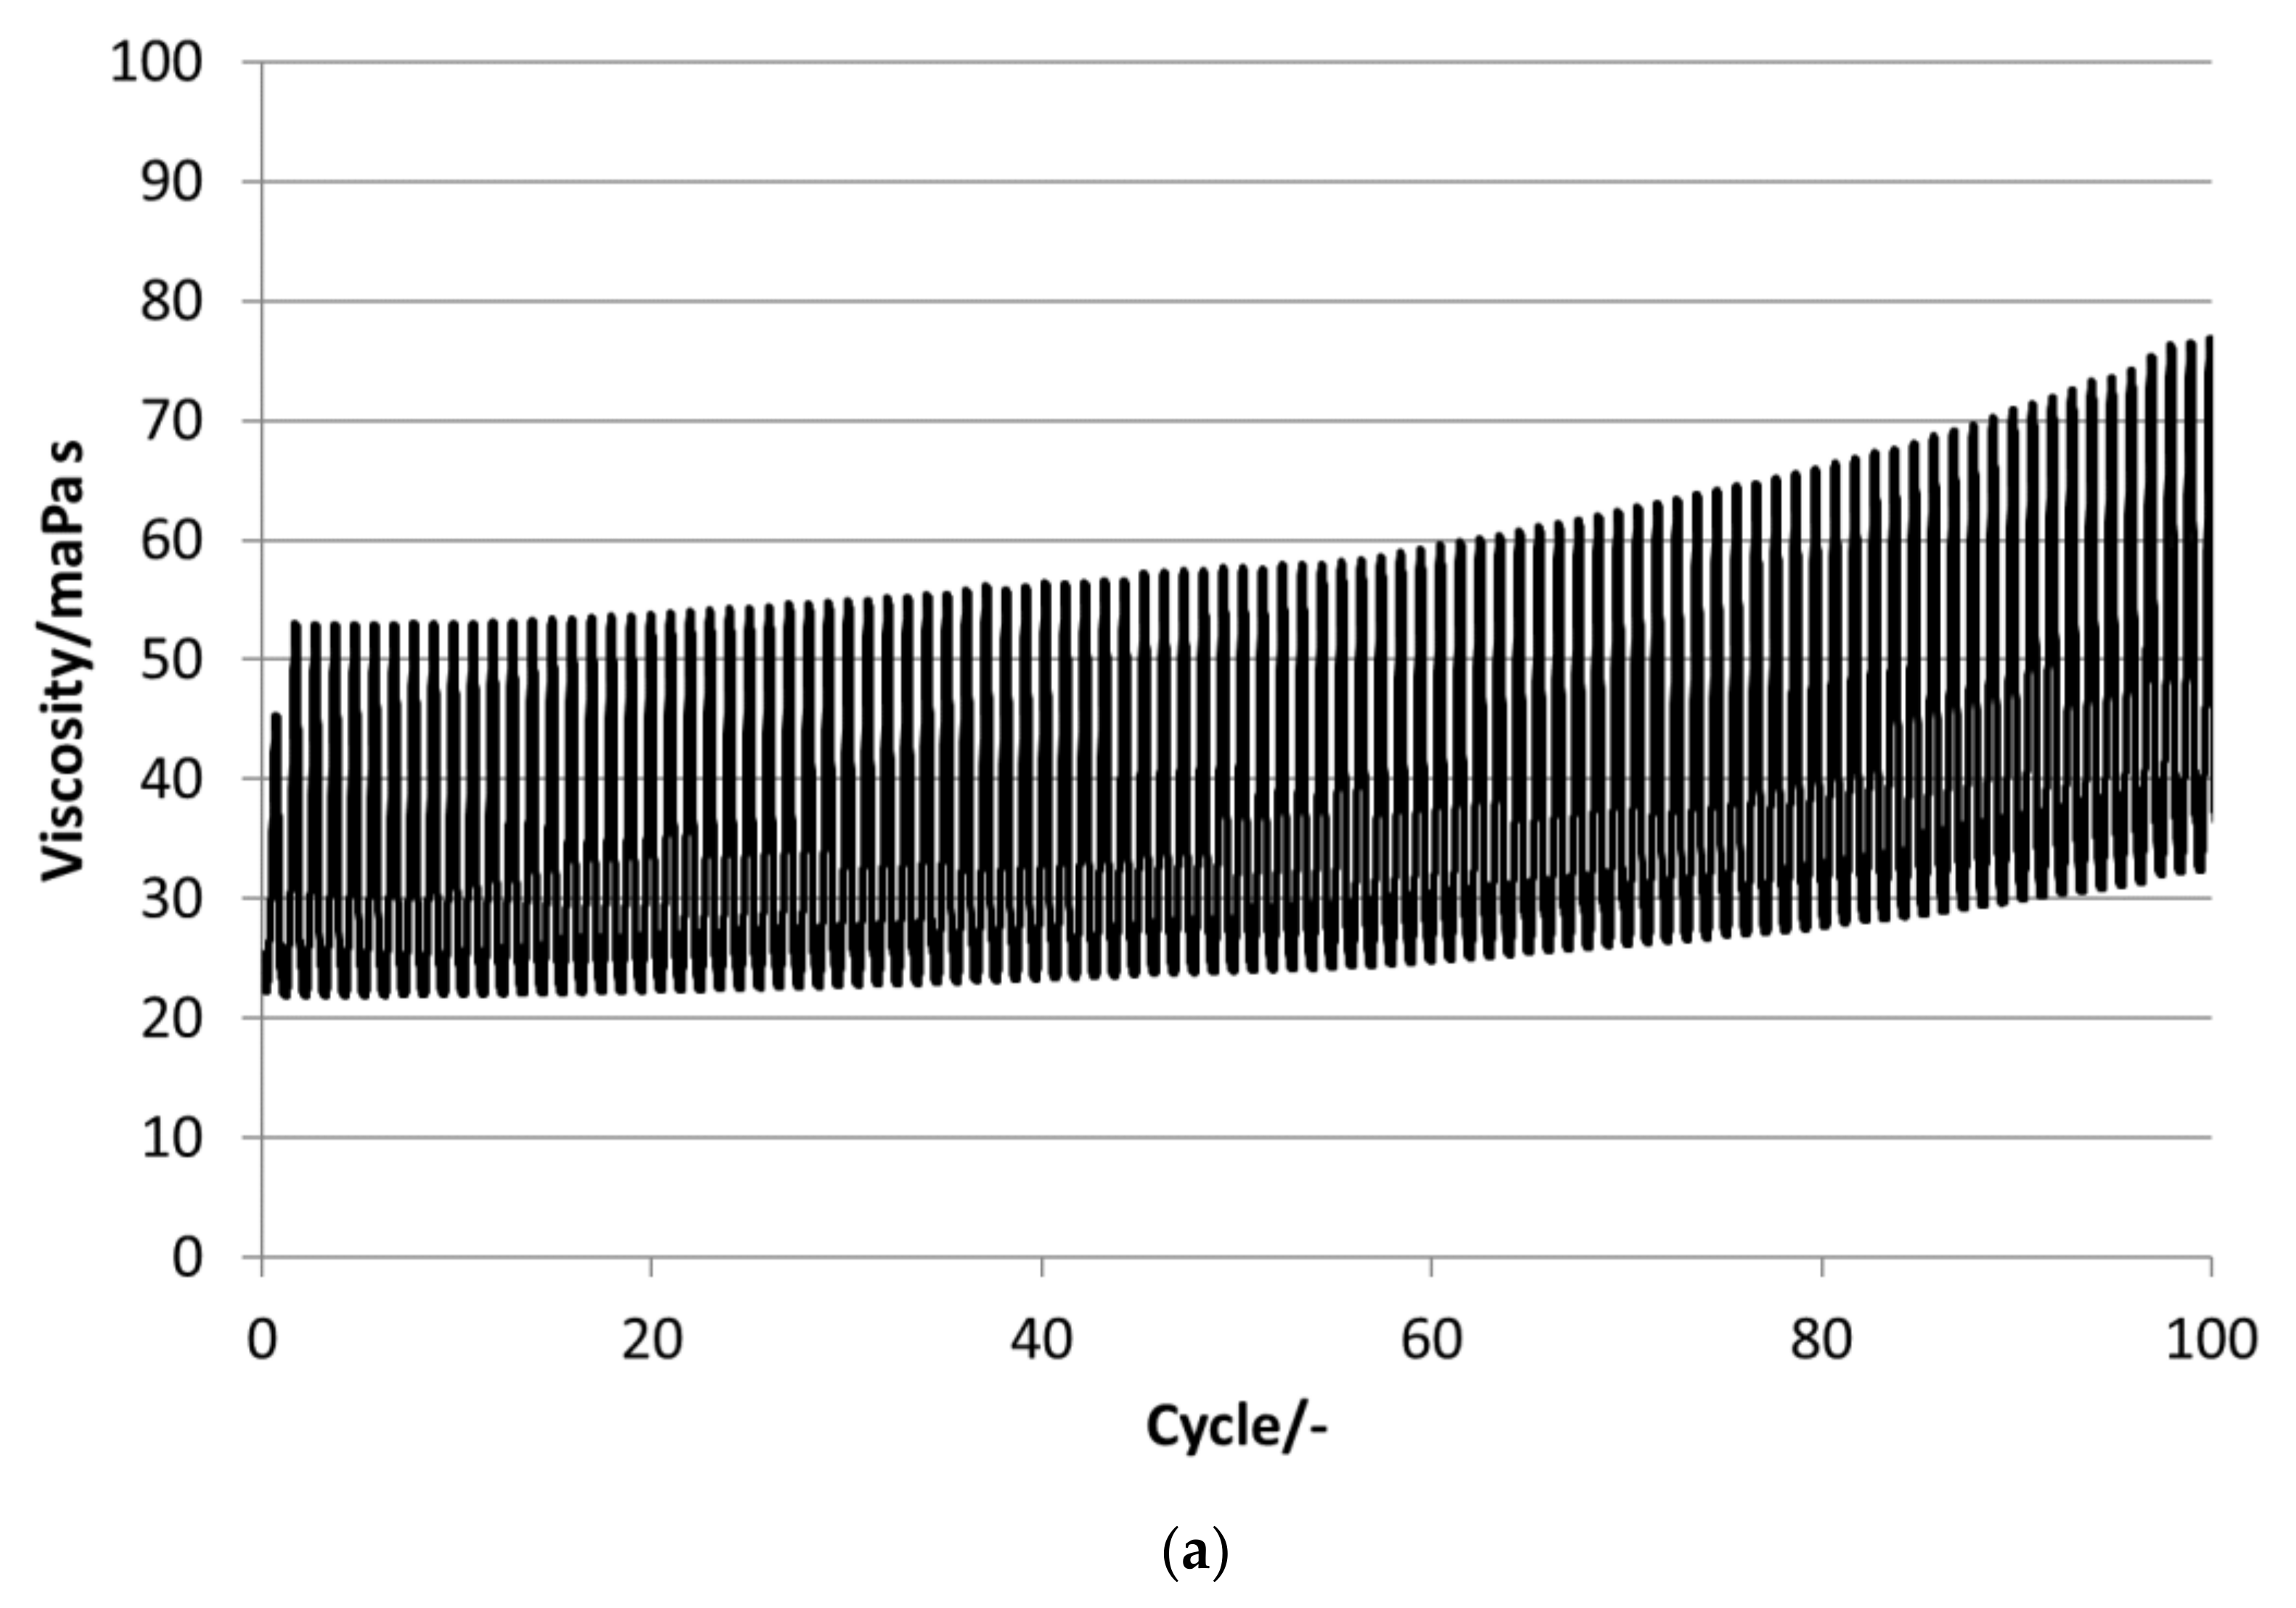
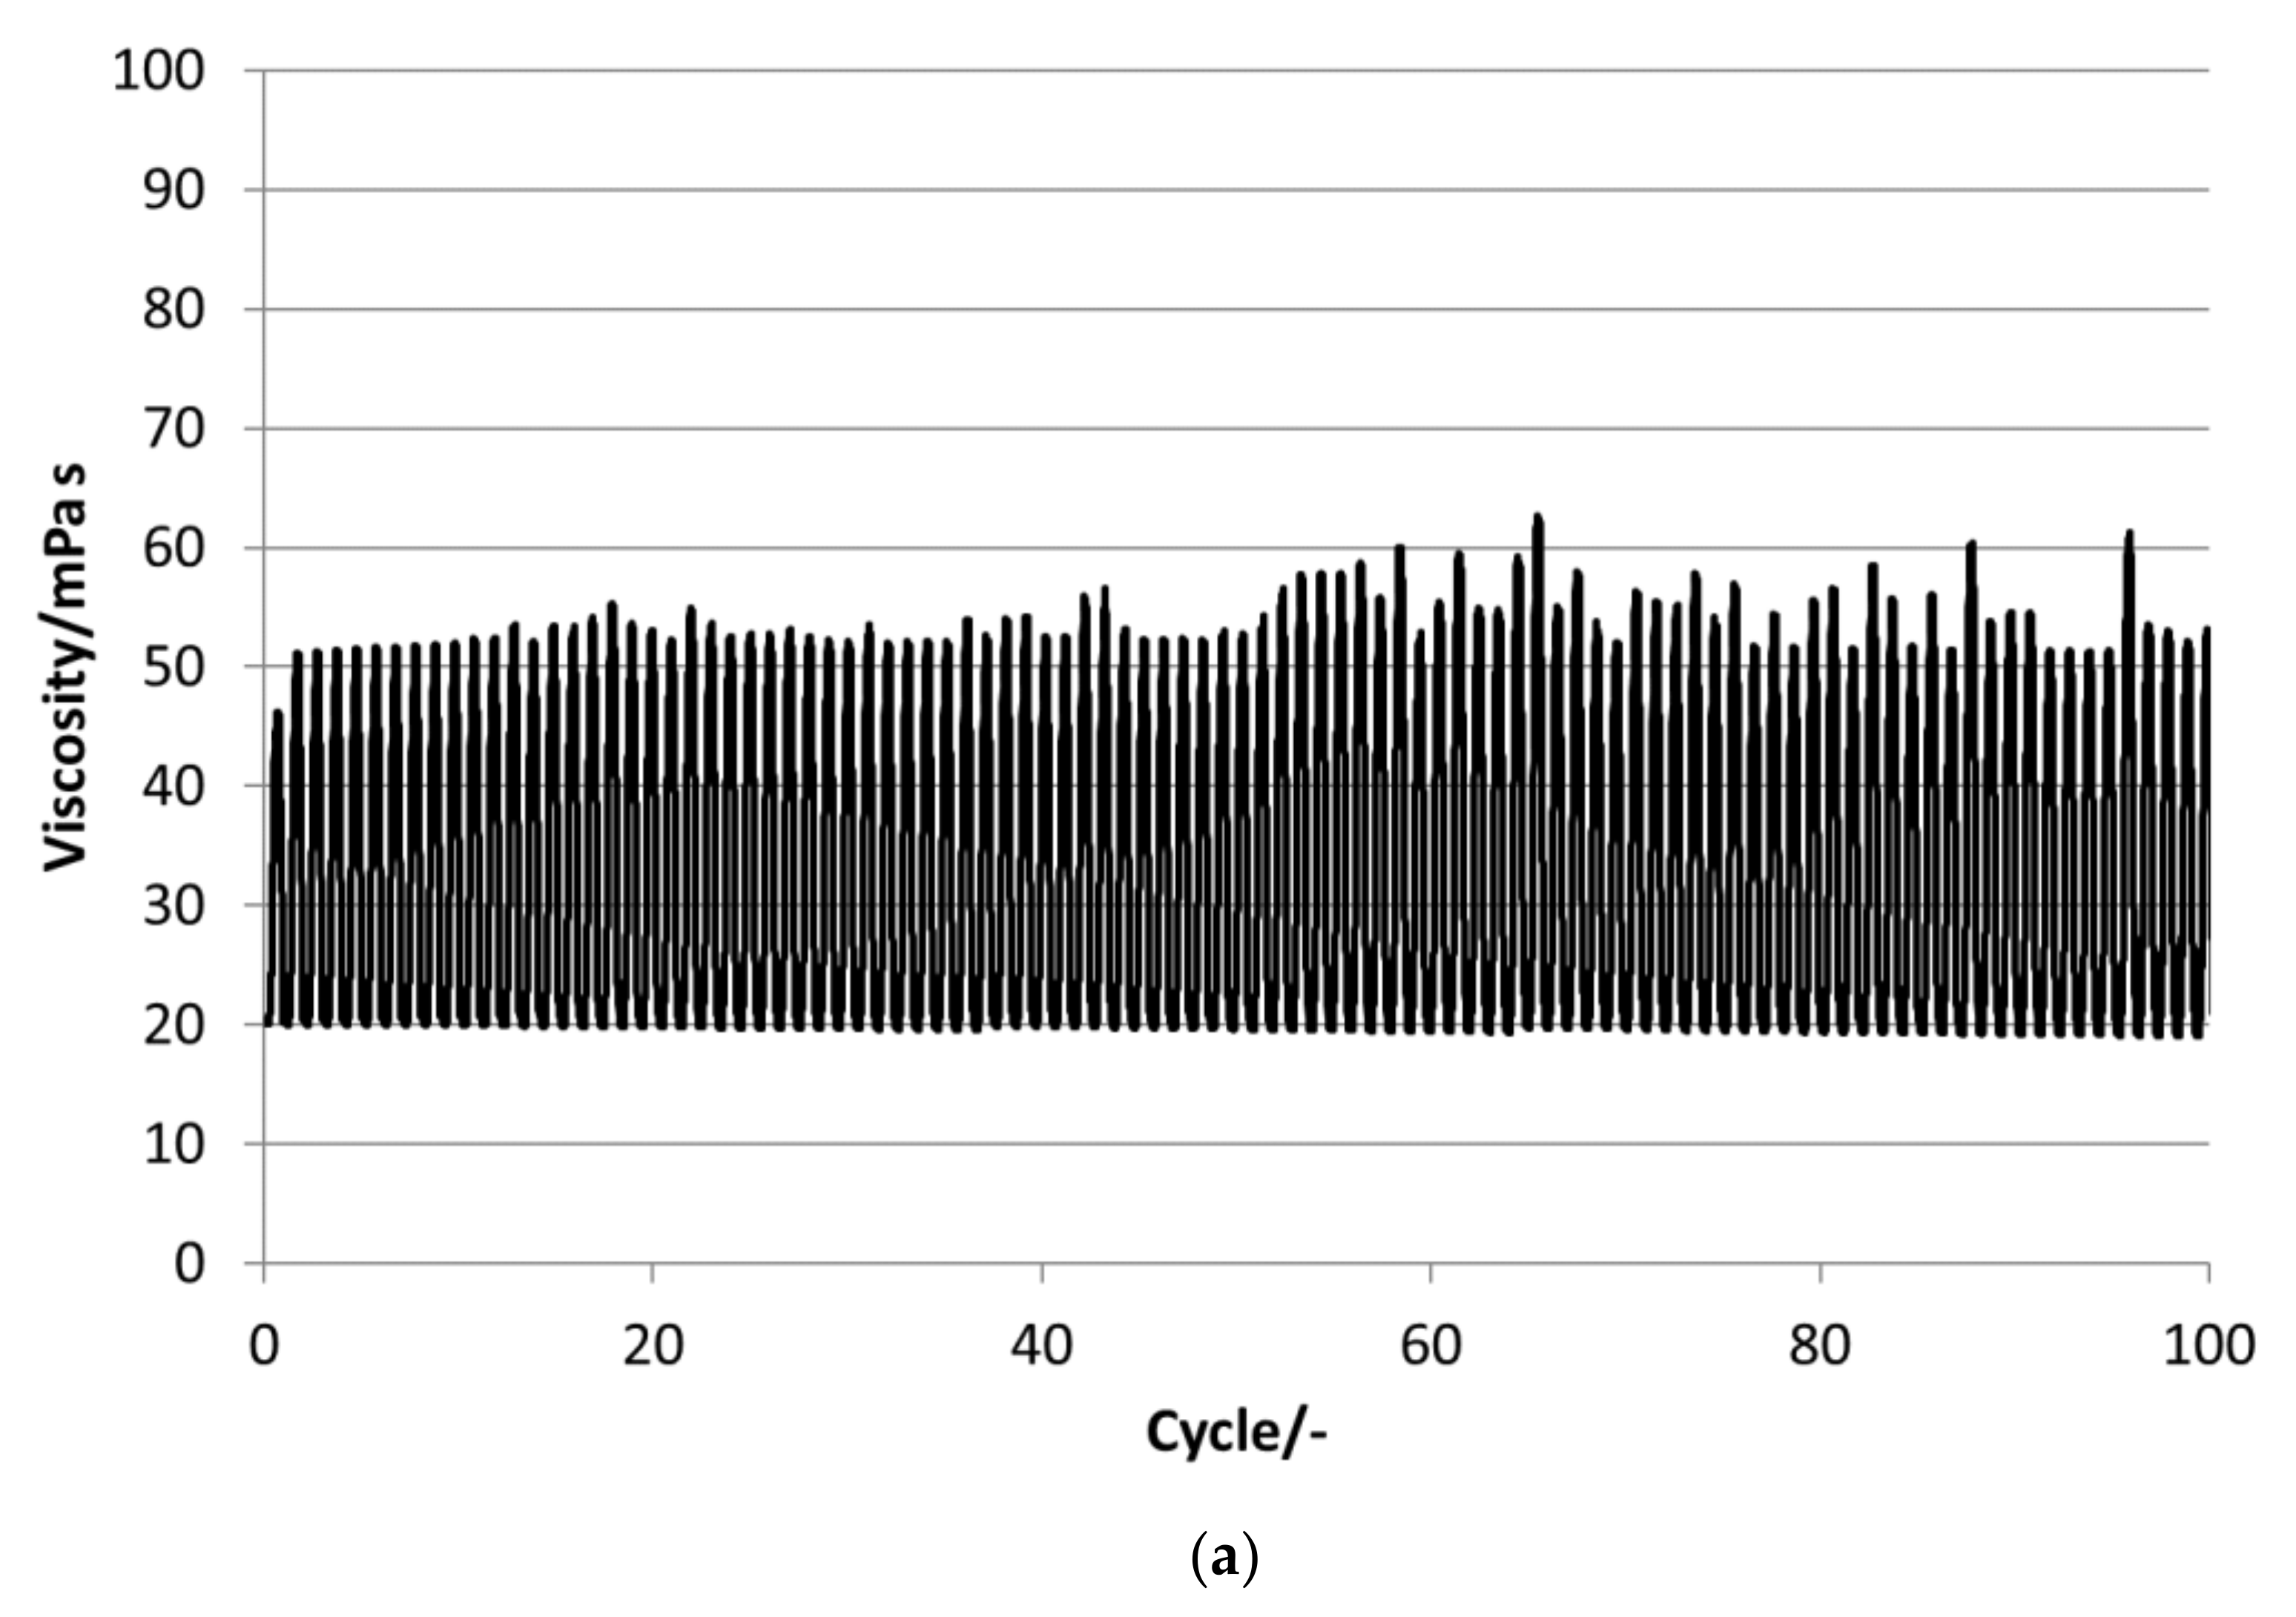
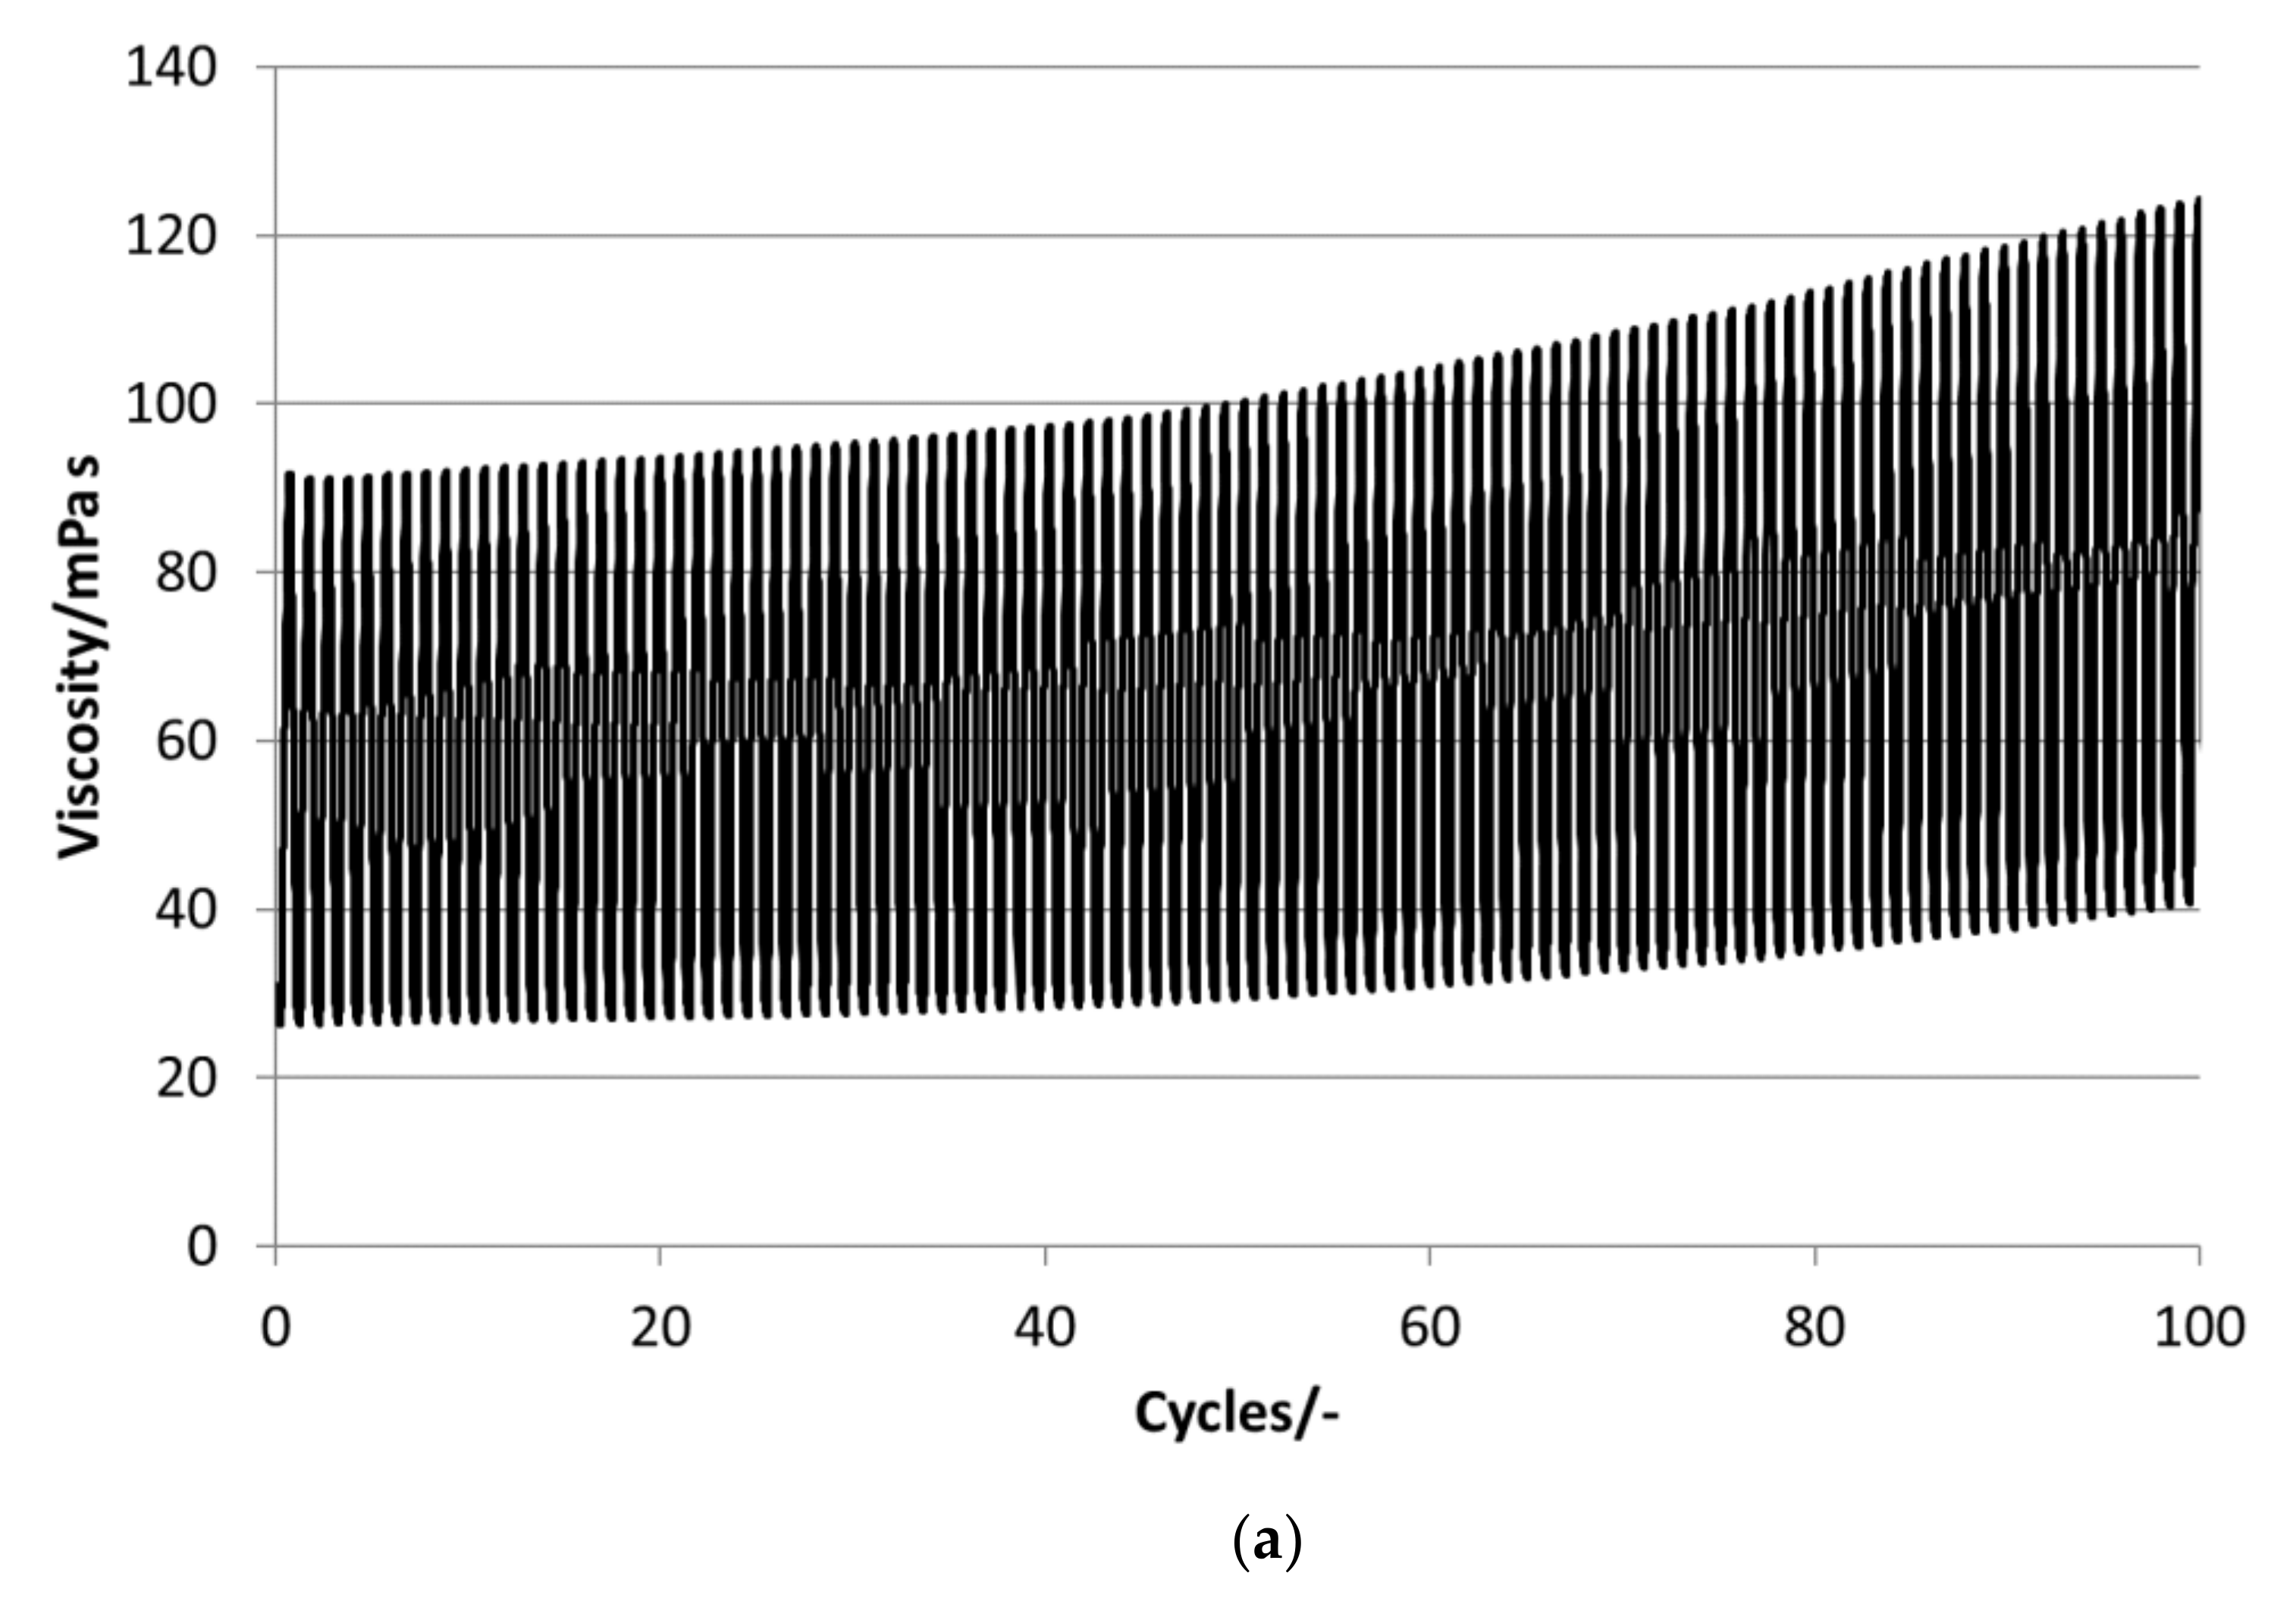
P16-97, L17, P18-97, P19-90 and P20Z emulsions are chosen for the stability evaluations. All tested PCM emulsions passed this stability test over 100 thermal–mechanical cycles without optically visible changes like phase separation or creaming.
Figure 9,
Figure 10,
Figure 11,
Figure 12 and
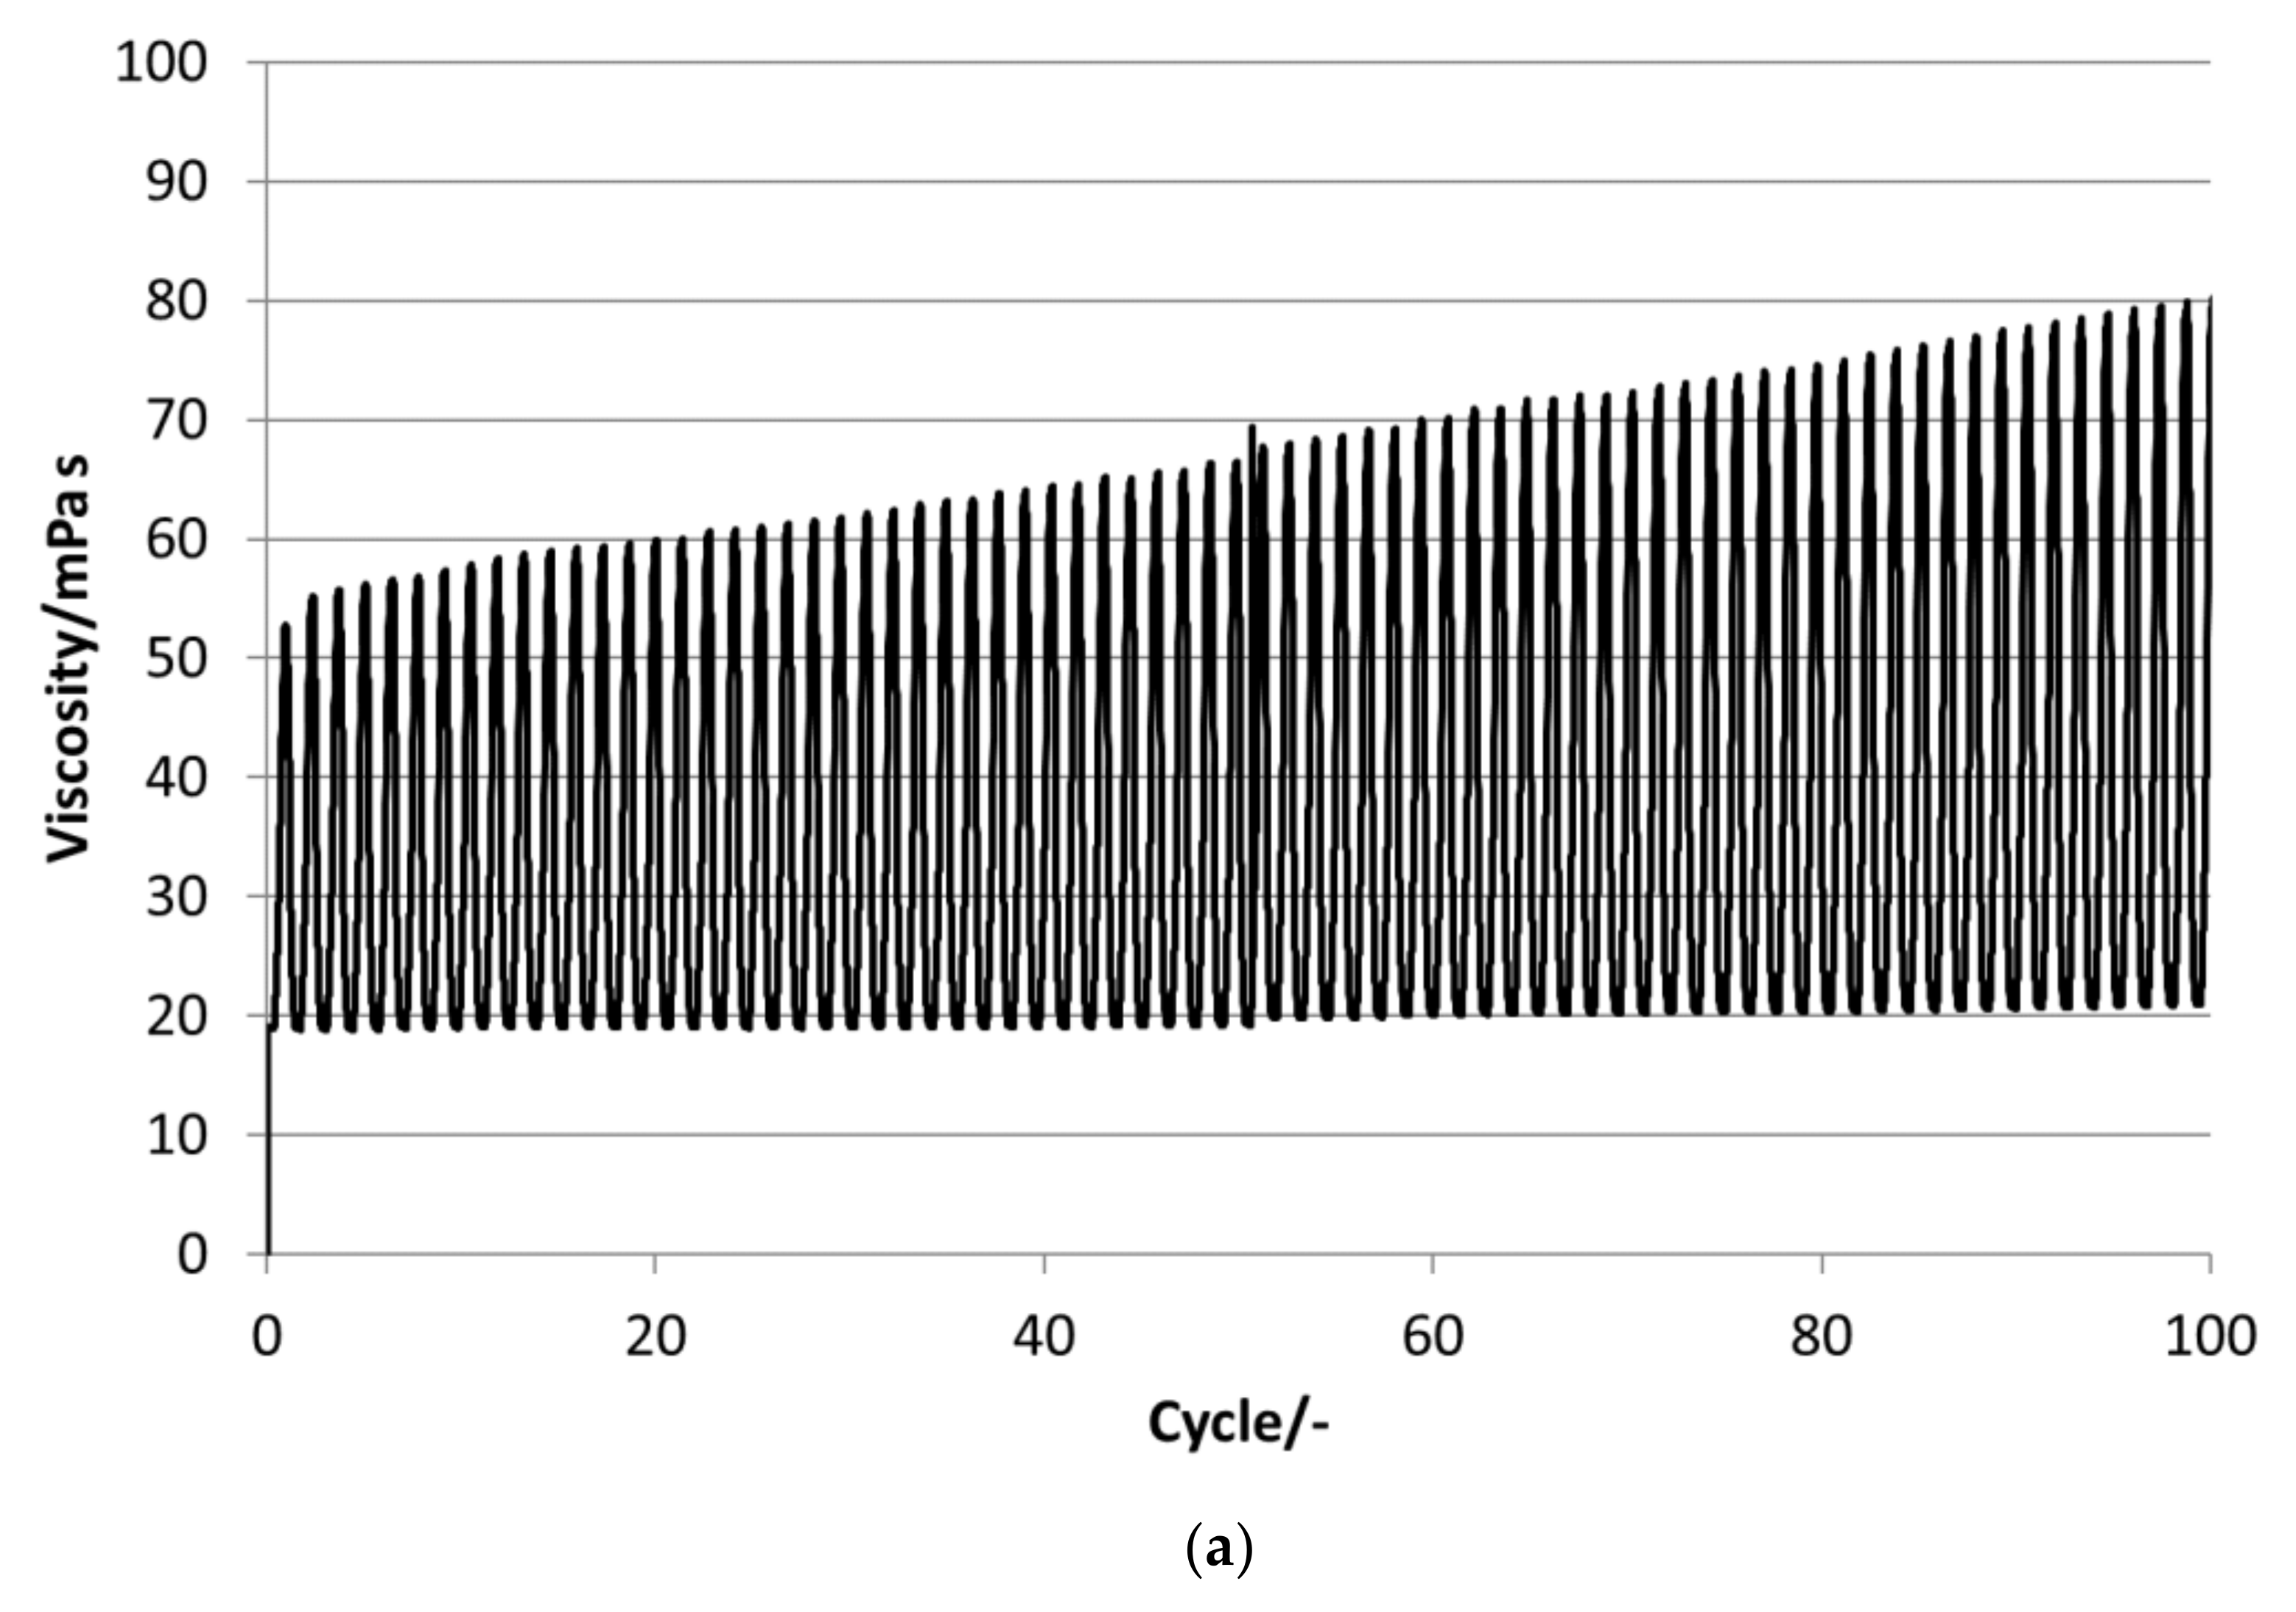
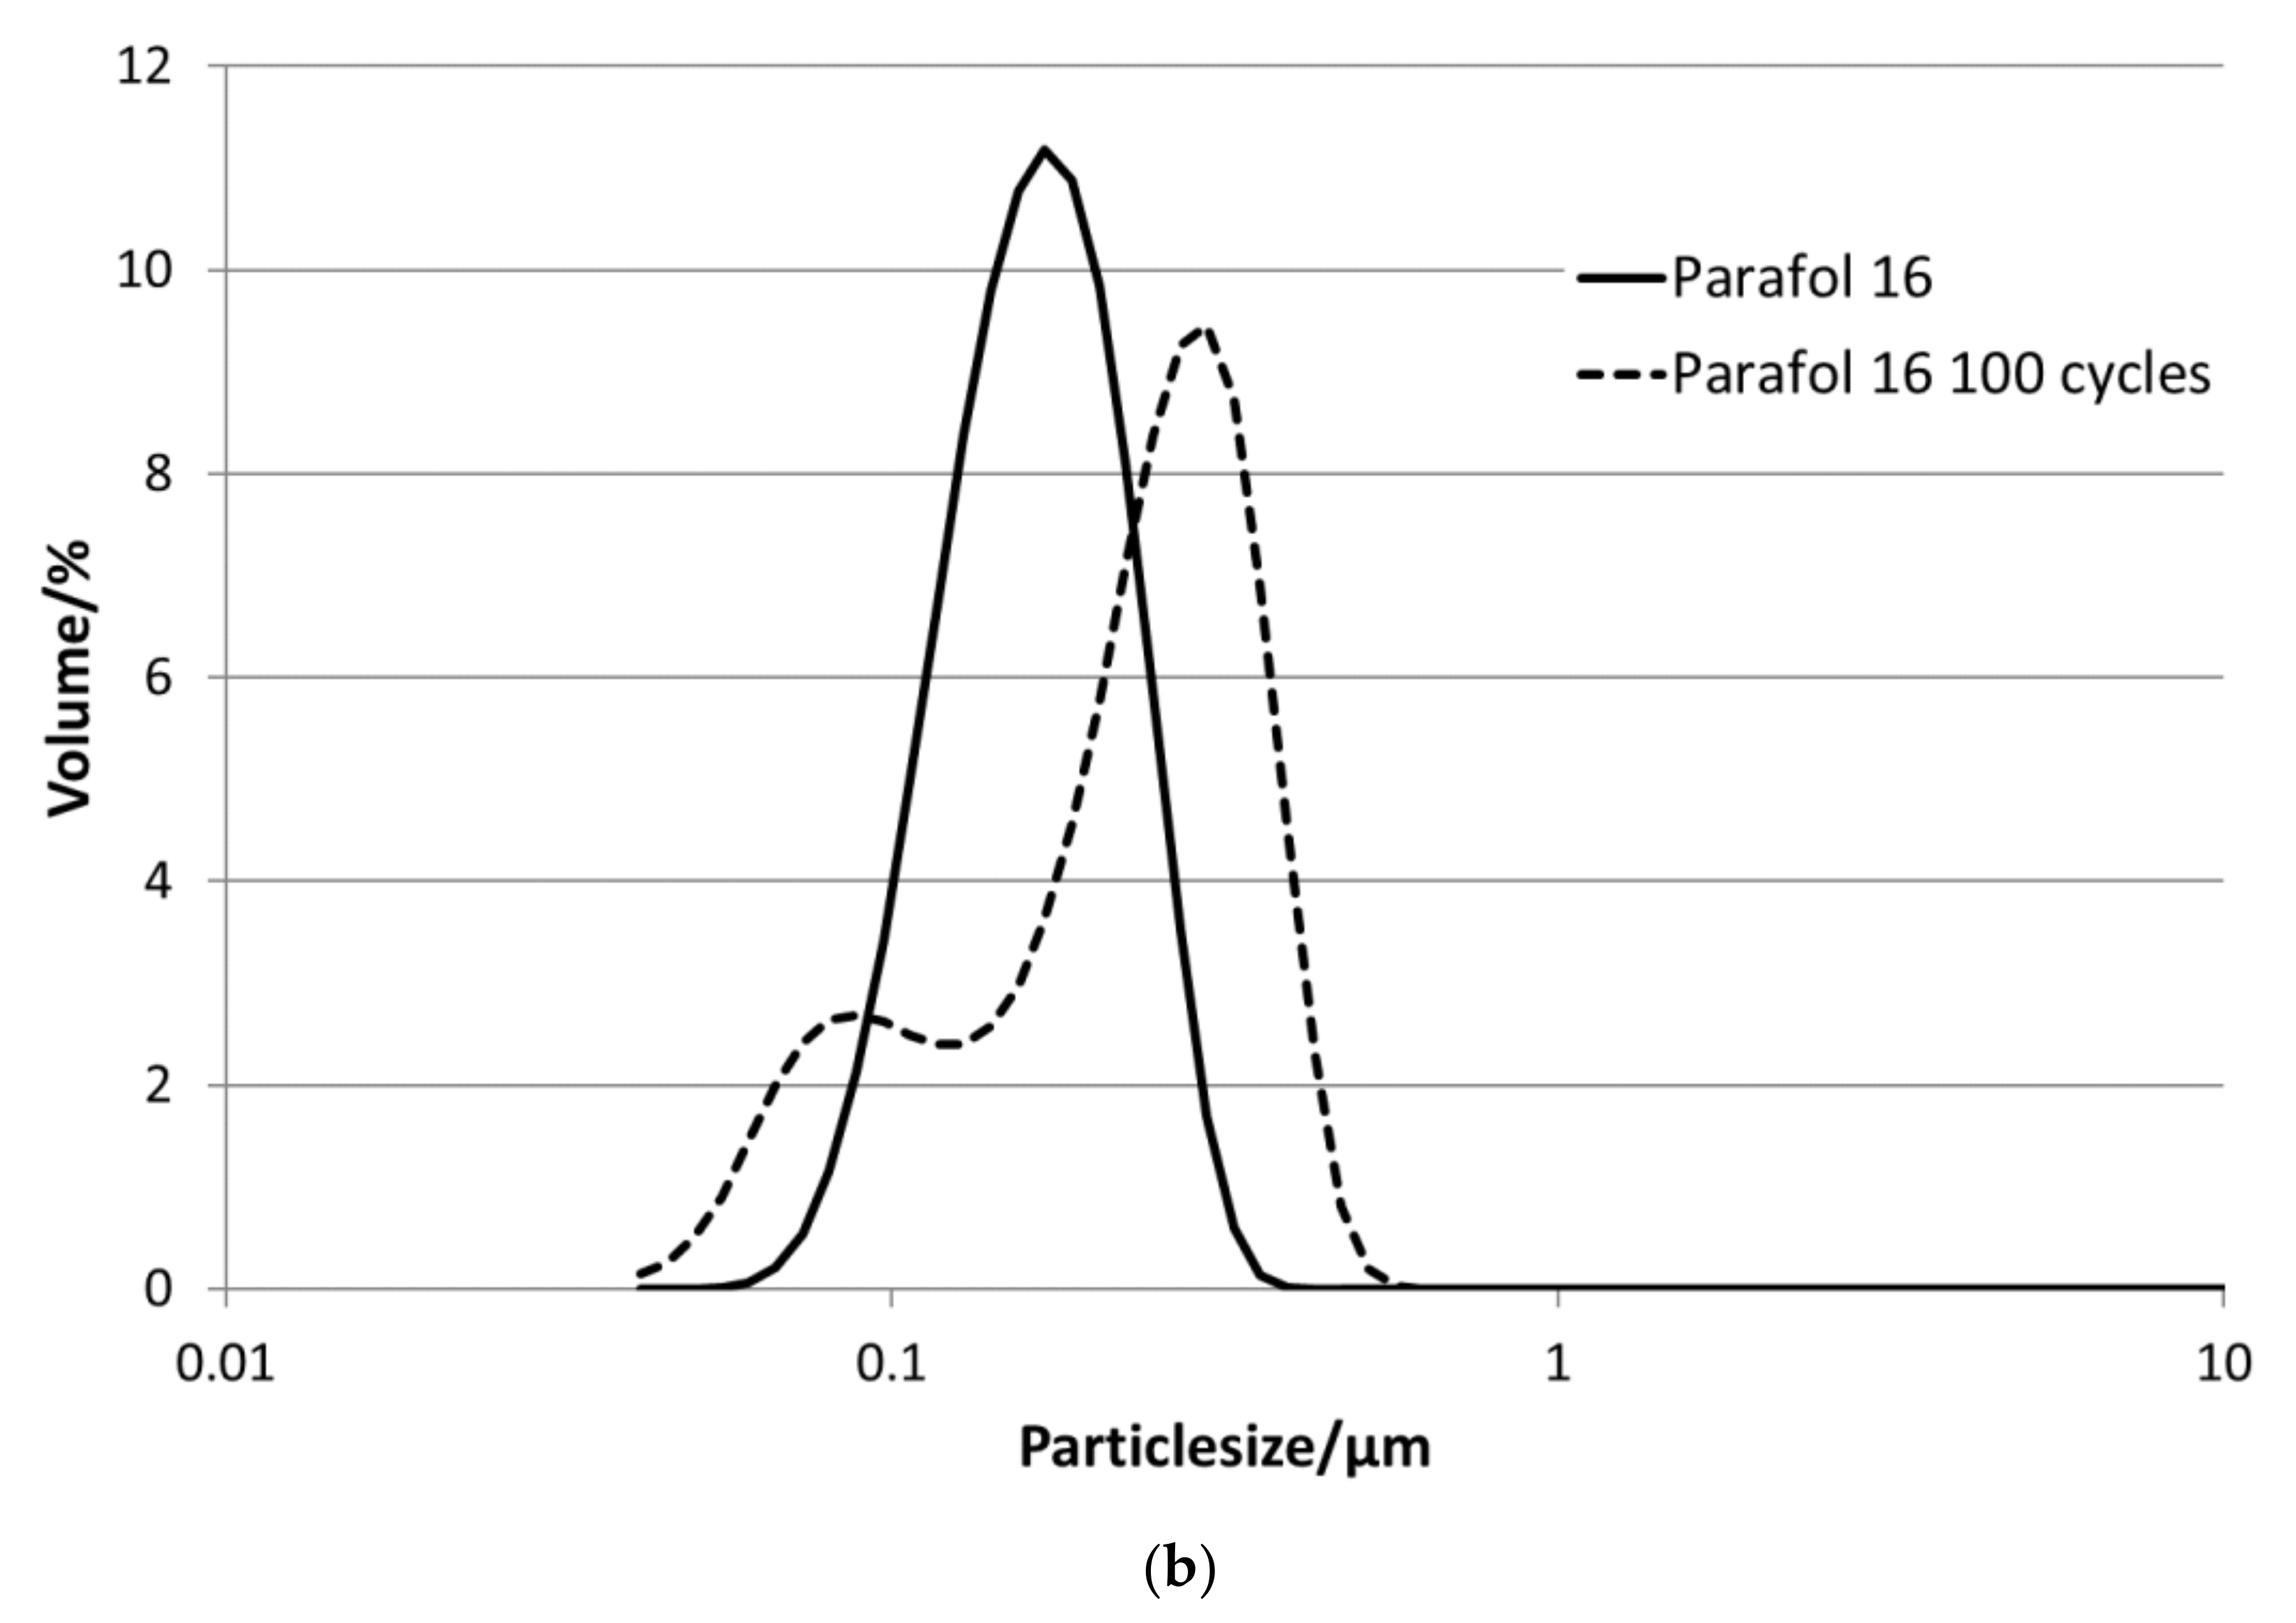
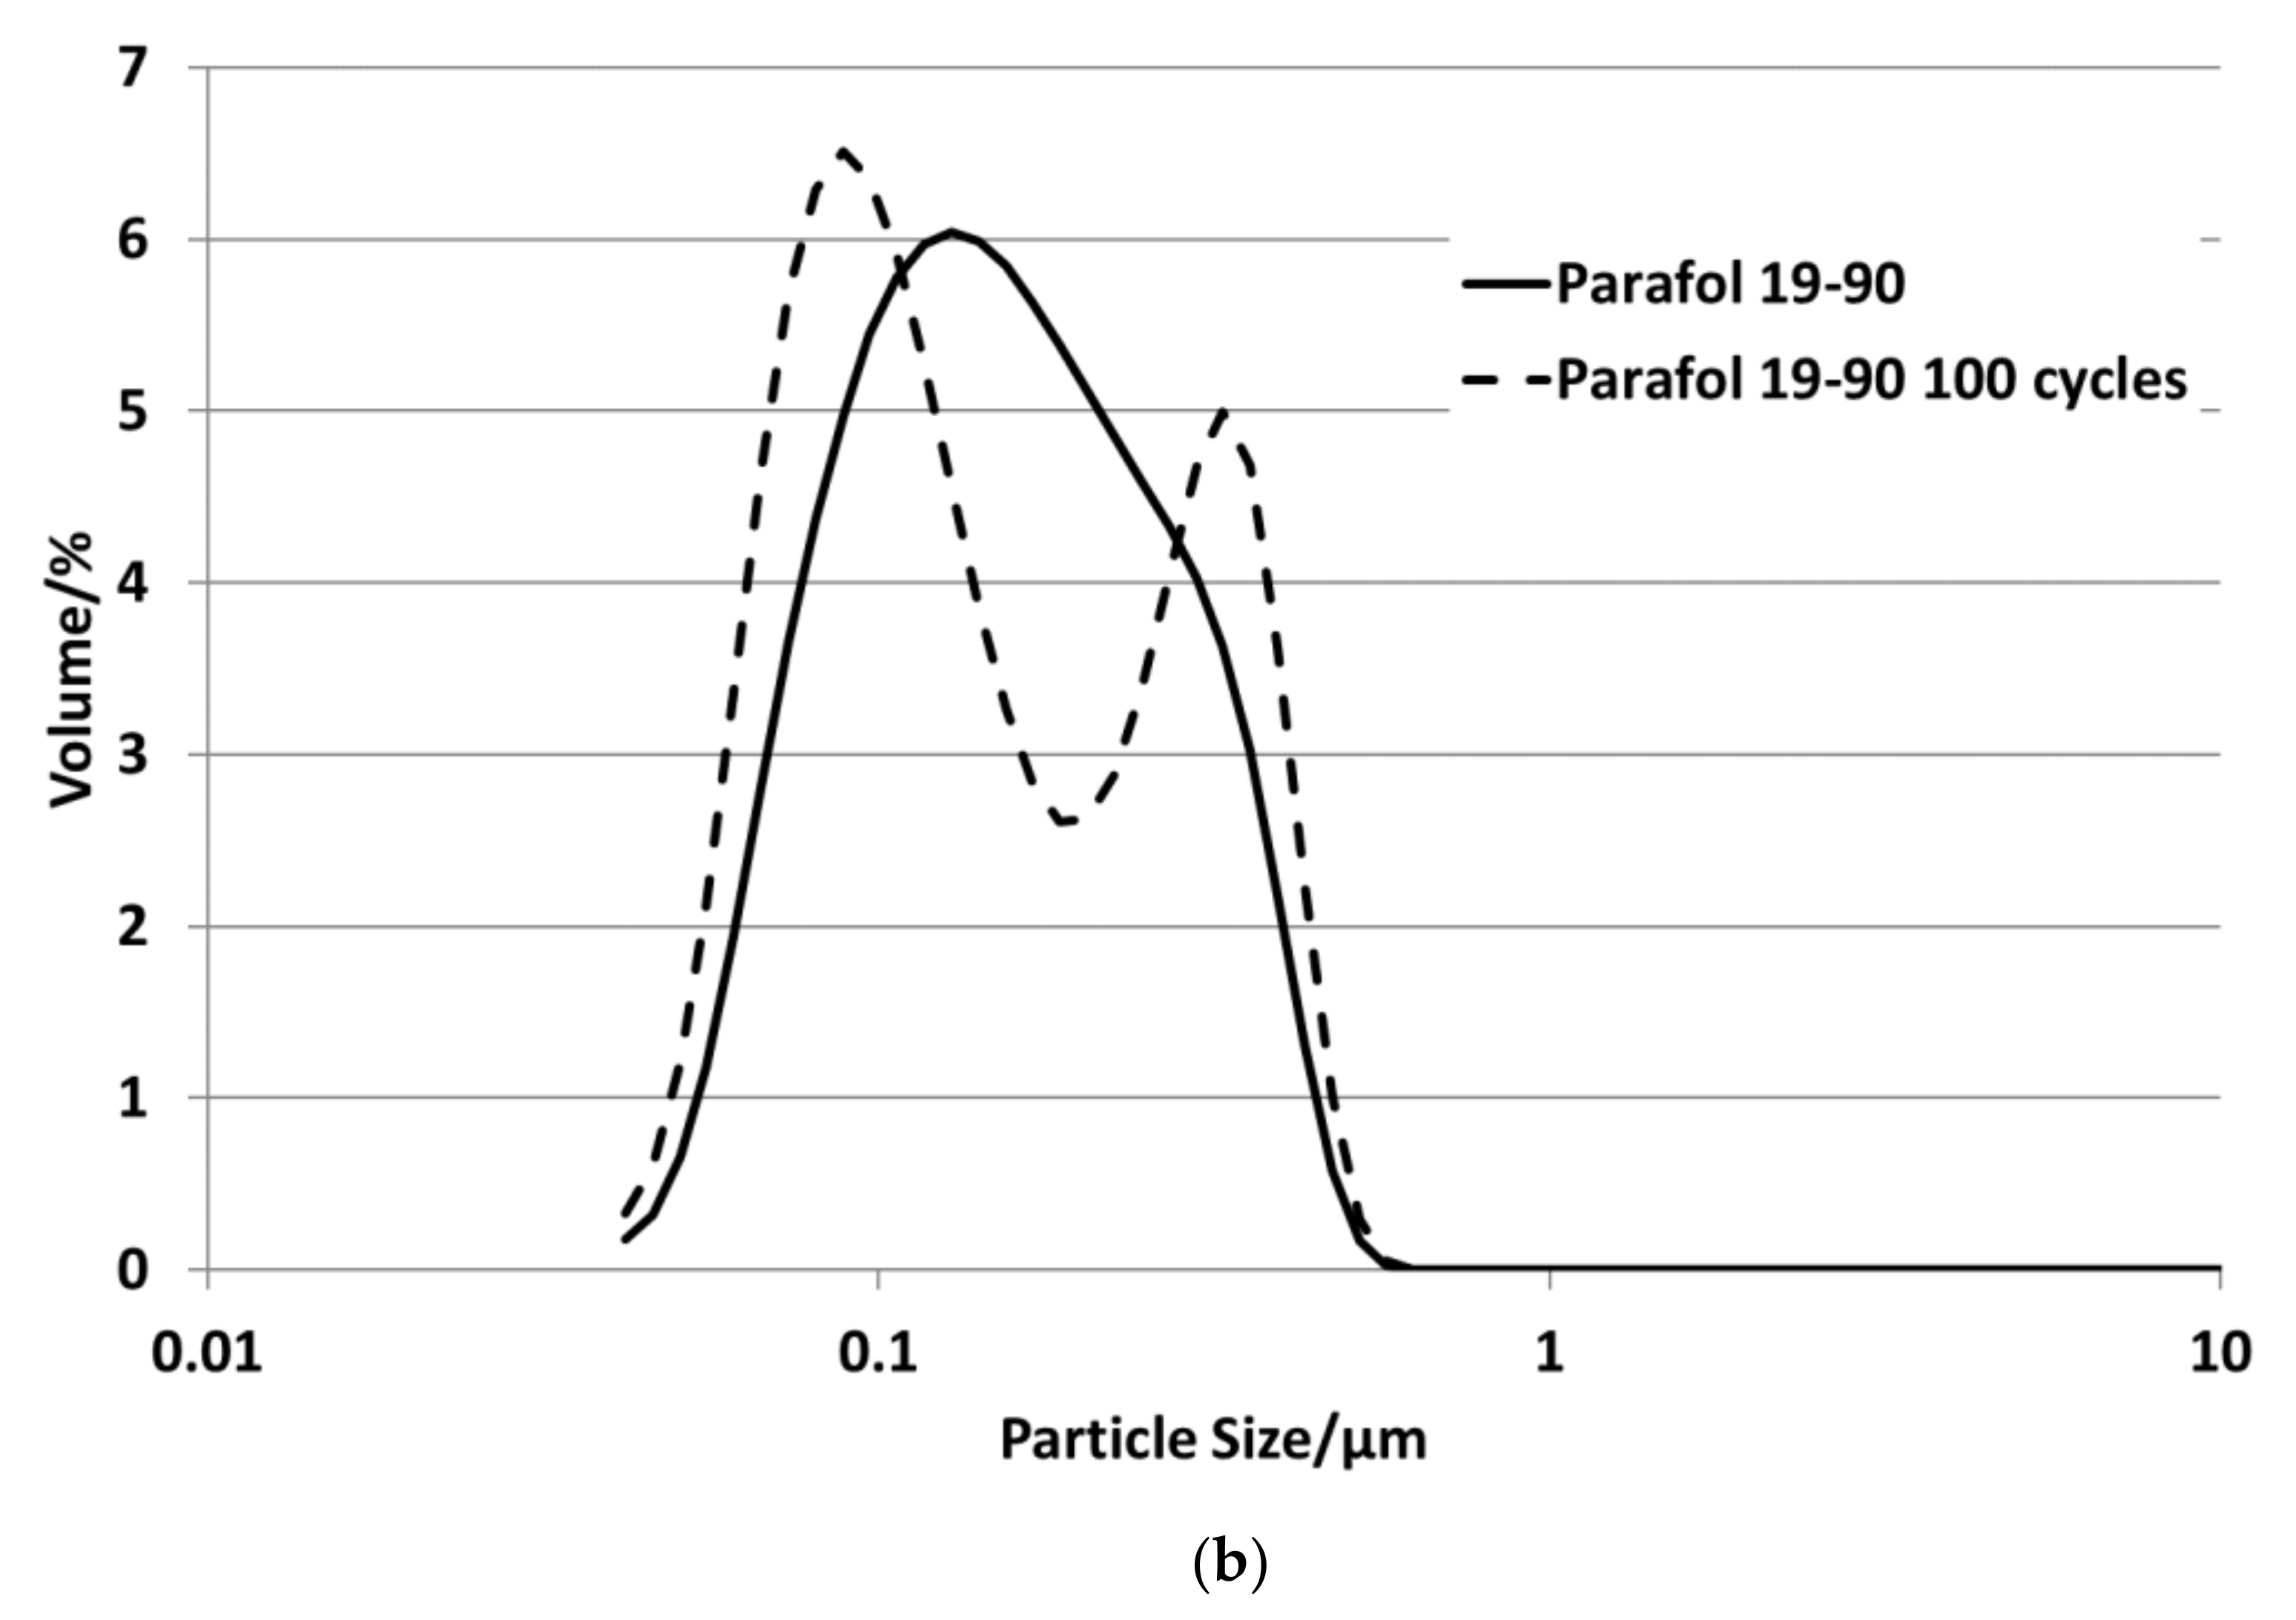
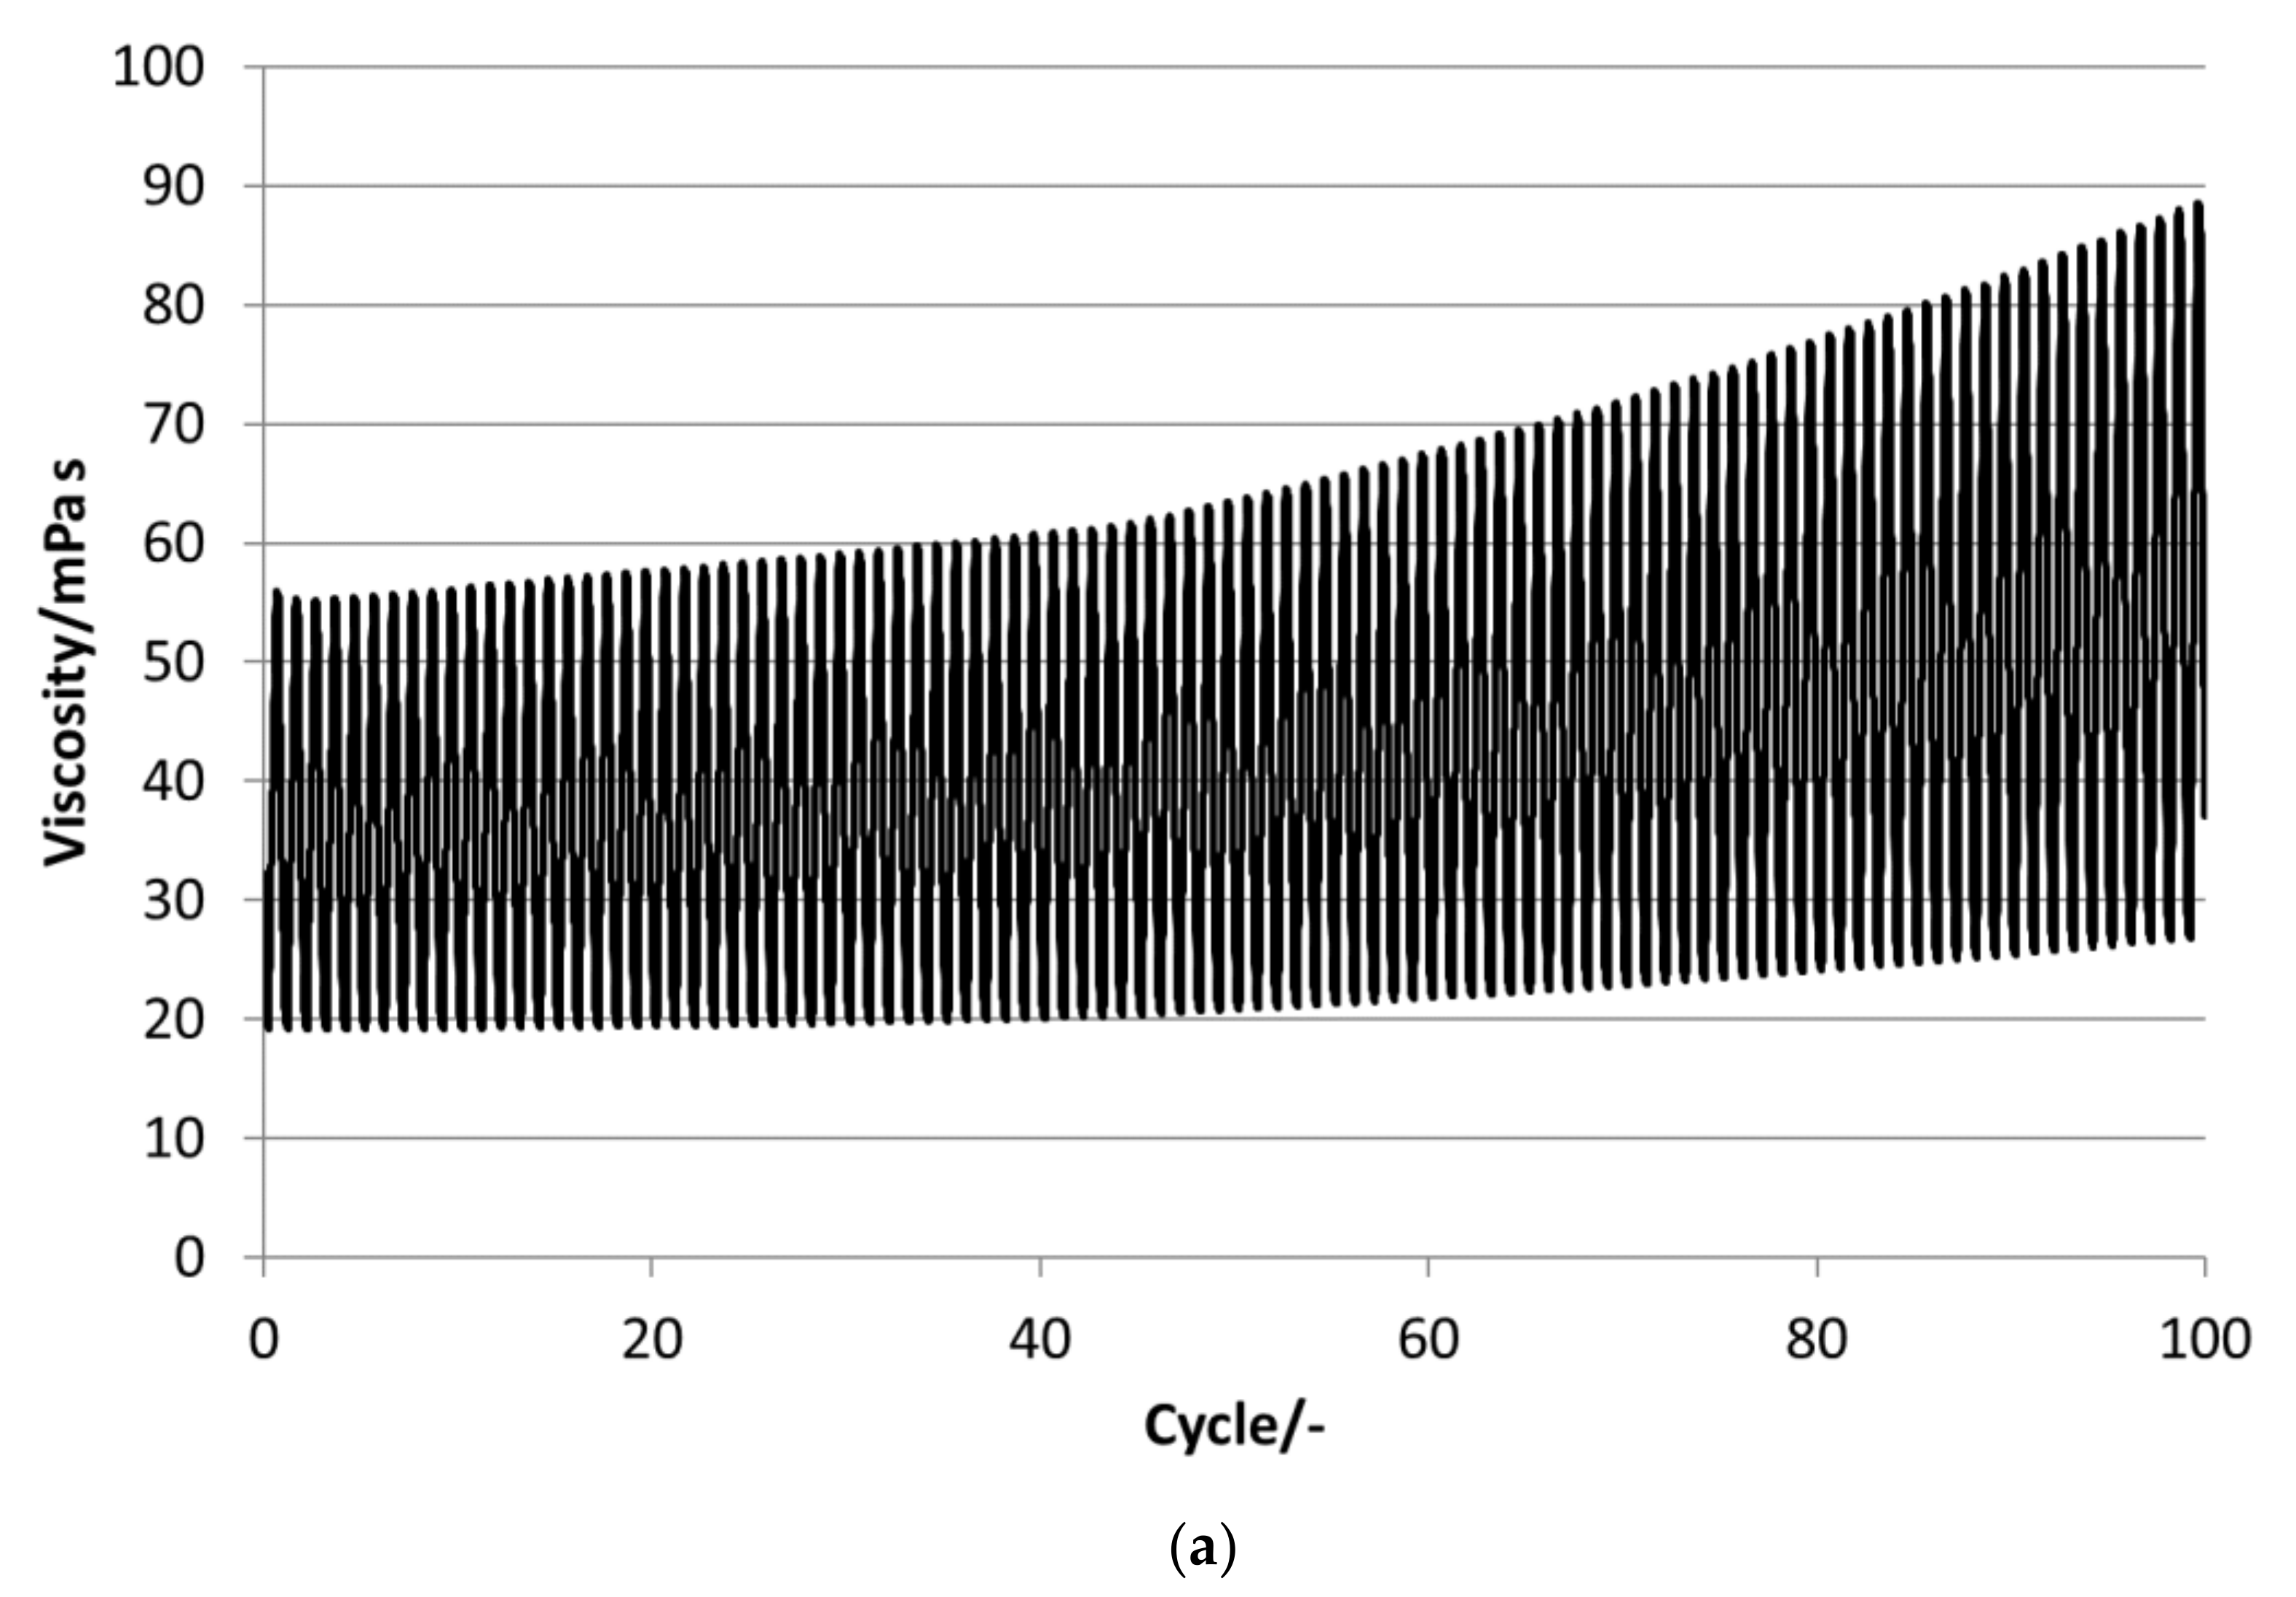
Figure 13 depict the results for the measured emulsions. The rheological data show different changes in the viscosity over the 100 cycles, which come with the changes in the particle size distribution. In the viscosity measurements, the lower viscosity value indicates the emulsion´s viscosities at 35 °C and the upper value those at 5 °C, respectively. At the beginning of the tests, the emulsions show viscosities between 20 and 50 mPa·s, except P19-90, which ranges between 25 and almost 95 mPa·s. Looking at the development of viscosity over the 100 cycles, the samples exhibit quite different changes. For P16-97, the viscosity at 35 °C is kept more or less constant at 20 mPa·s, while the upper value at 5 °C rises very linearly with every cycle, up to 80 mPa·s after 100 cycles. This comes with a change in the particle size distribution, from a monomodal distribution at the beginning to a bimodal distribution with a fraction of smaller sizes and a larger fraction at bigger sizes. L17 shows a rise in viscosity at 35 °C from 20 to 32 mPa·s and from almost 55 mPa·s to 80 mPa·s after 100 cycles at 5 °C. The particle size increase is minor, and the peak is slightly narrower than at the beginning. P18-97 keeps the lower viscosity at 20 mPa·s, and the upper values are also more or less constant with higher values for single peaks. No significant change in the size distribution is observed. The PCM emulsion P19-90 shows the highest viscosity values in this test. It reaches over 120 mPa·s after 100 cycles. The size distribution also becomes bimodal, but contrary to P16-97, the share that turned to smaller sizes is larger than the one grown to bigger sizes. P20Z also shows a viscosity between 20 and 55 mPa·s at the beginning of the cycle test. While cycled, both values rise, but the upper value at 5 °C rises faster than the lower value at 35 °C.
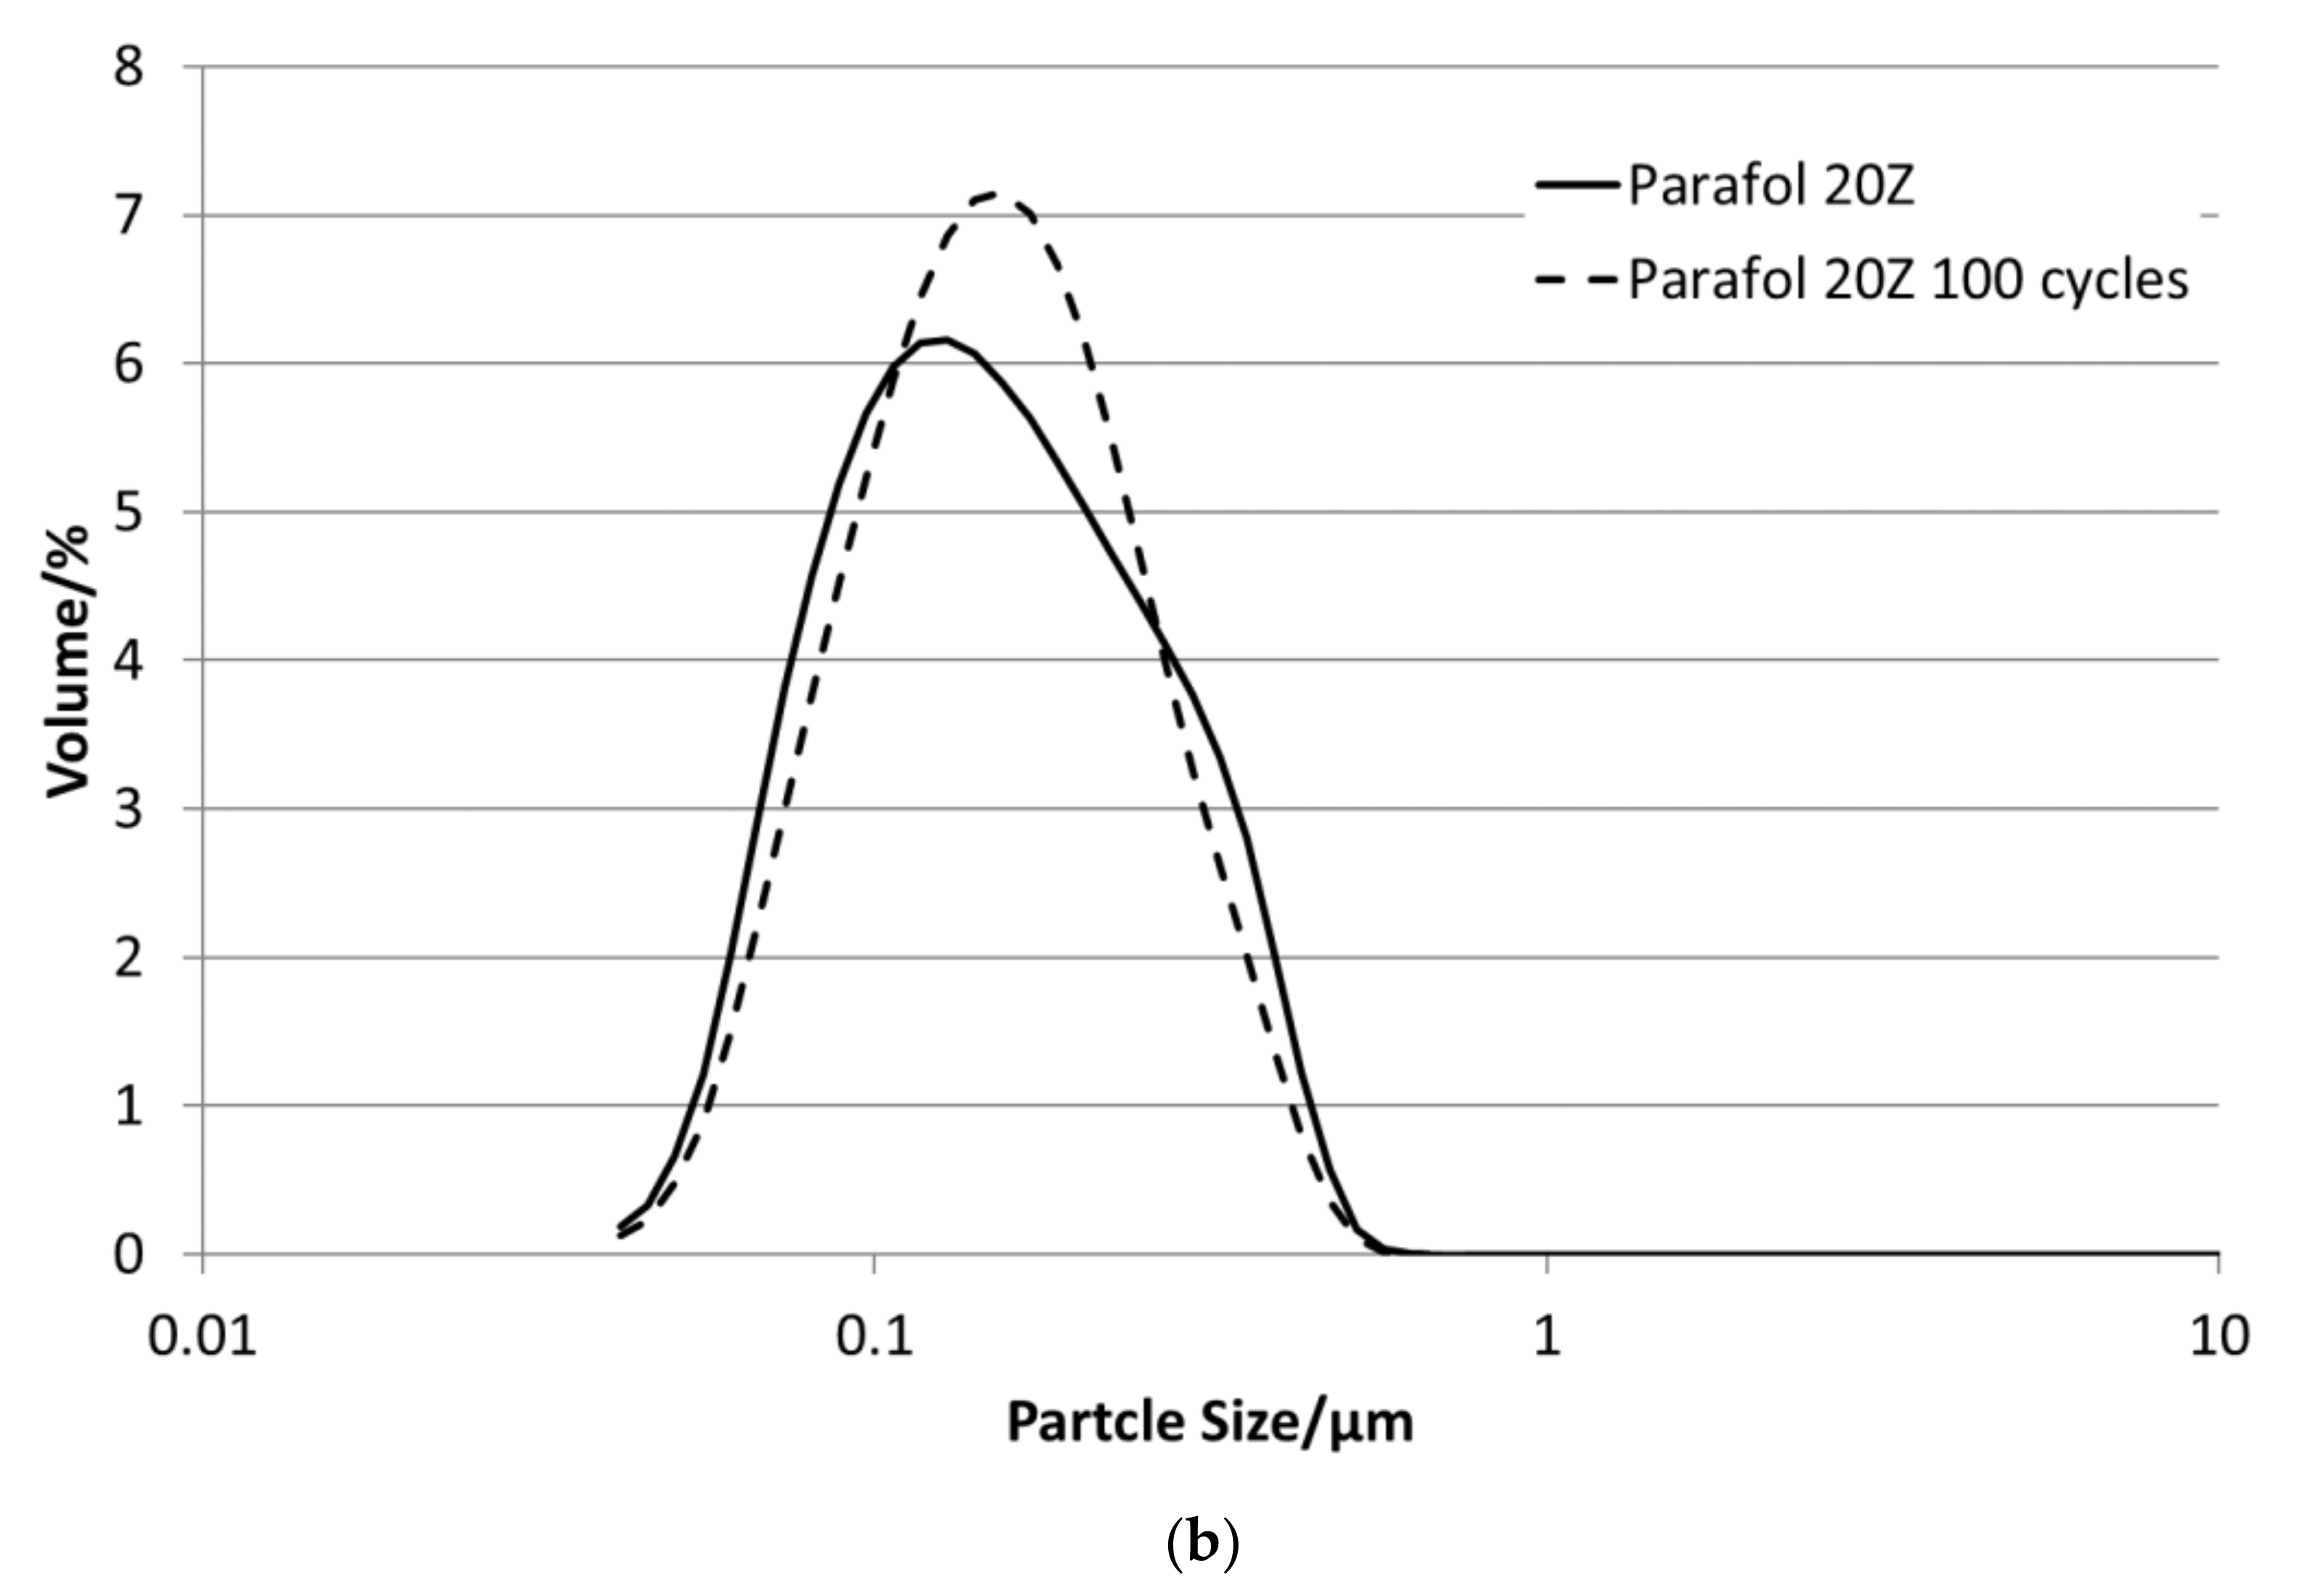
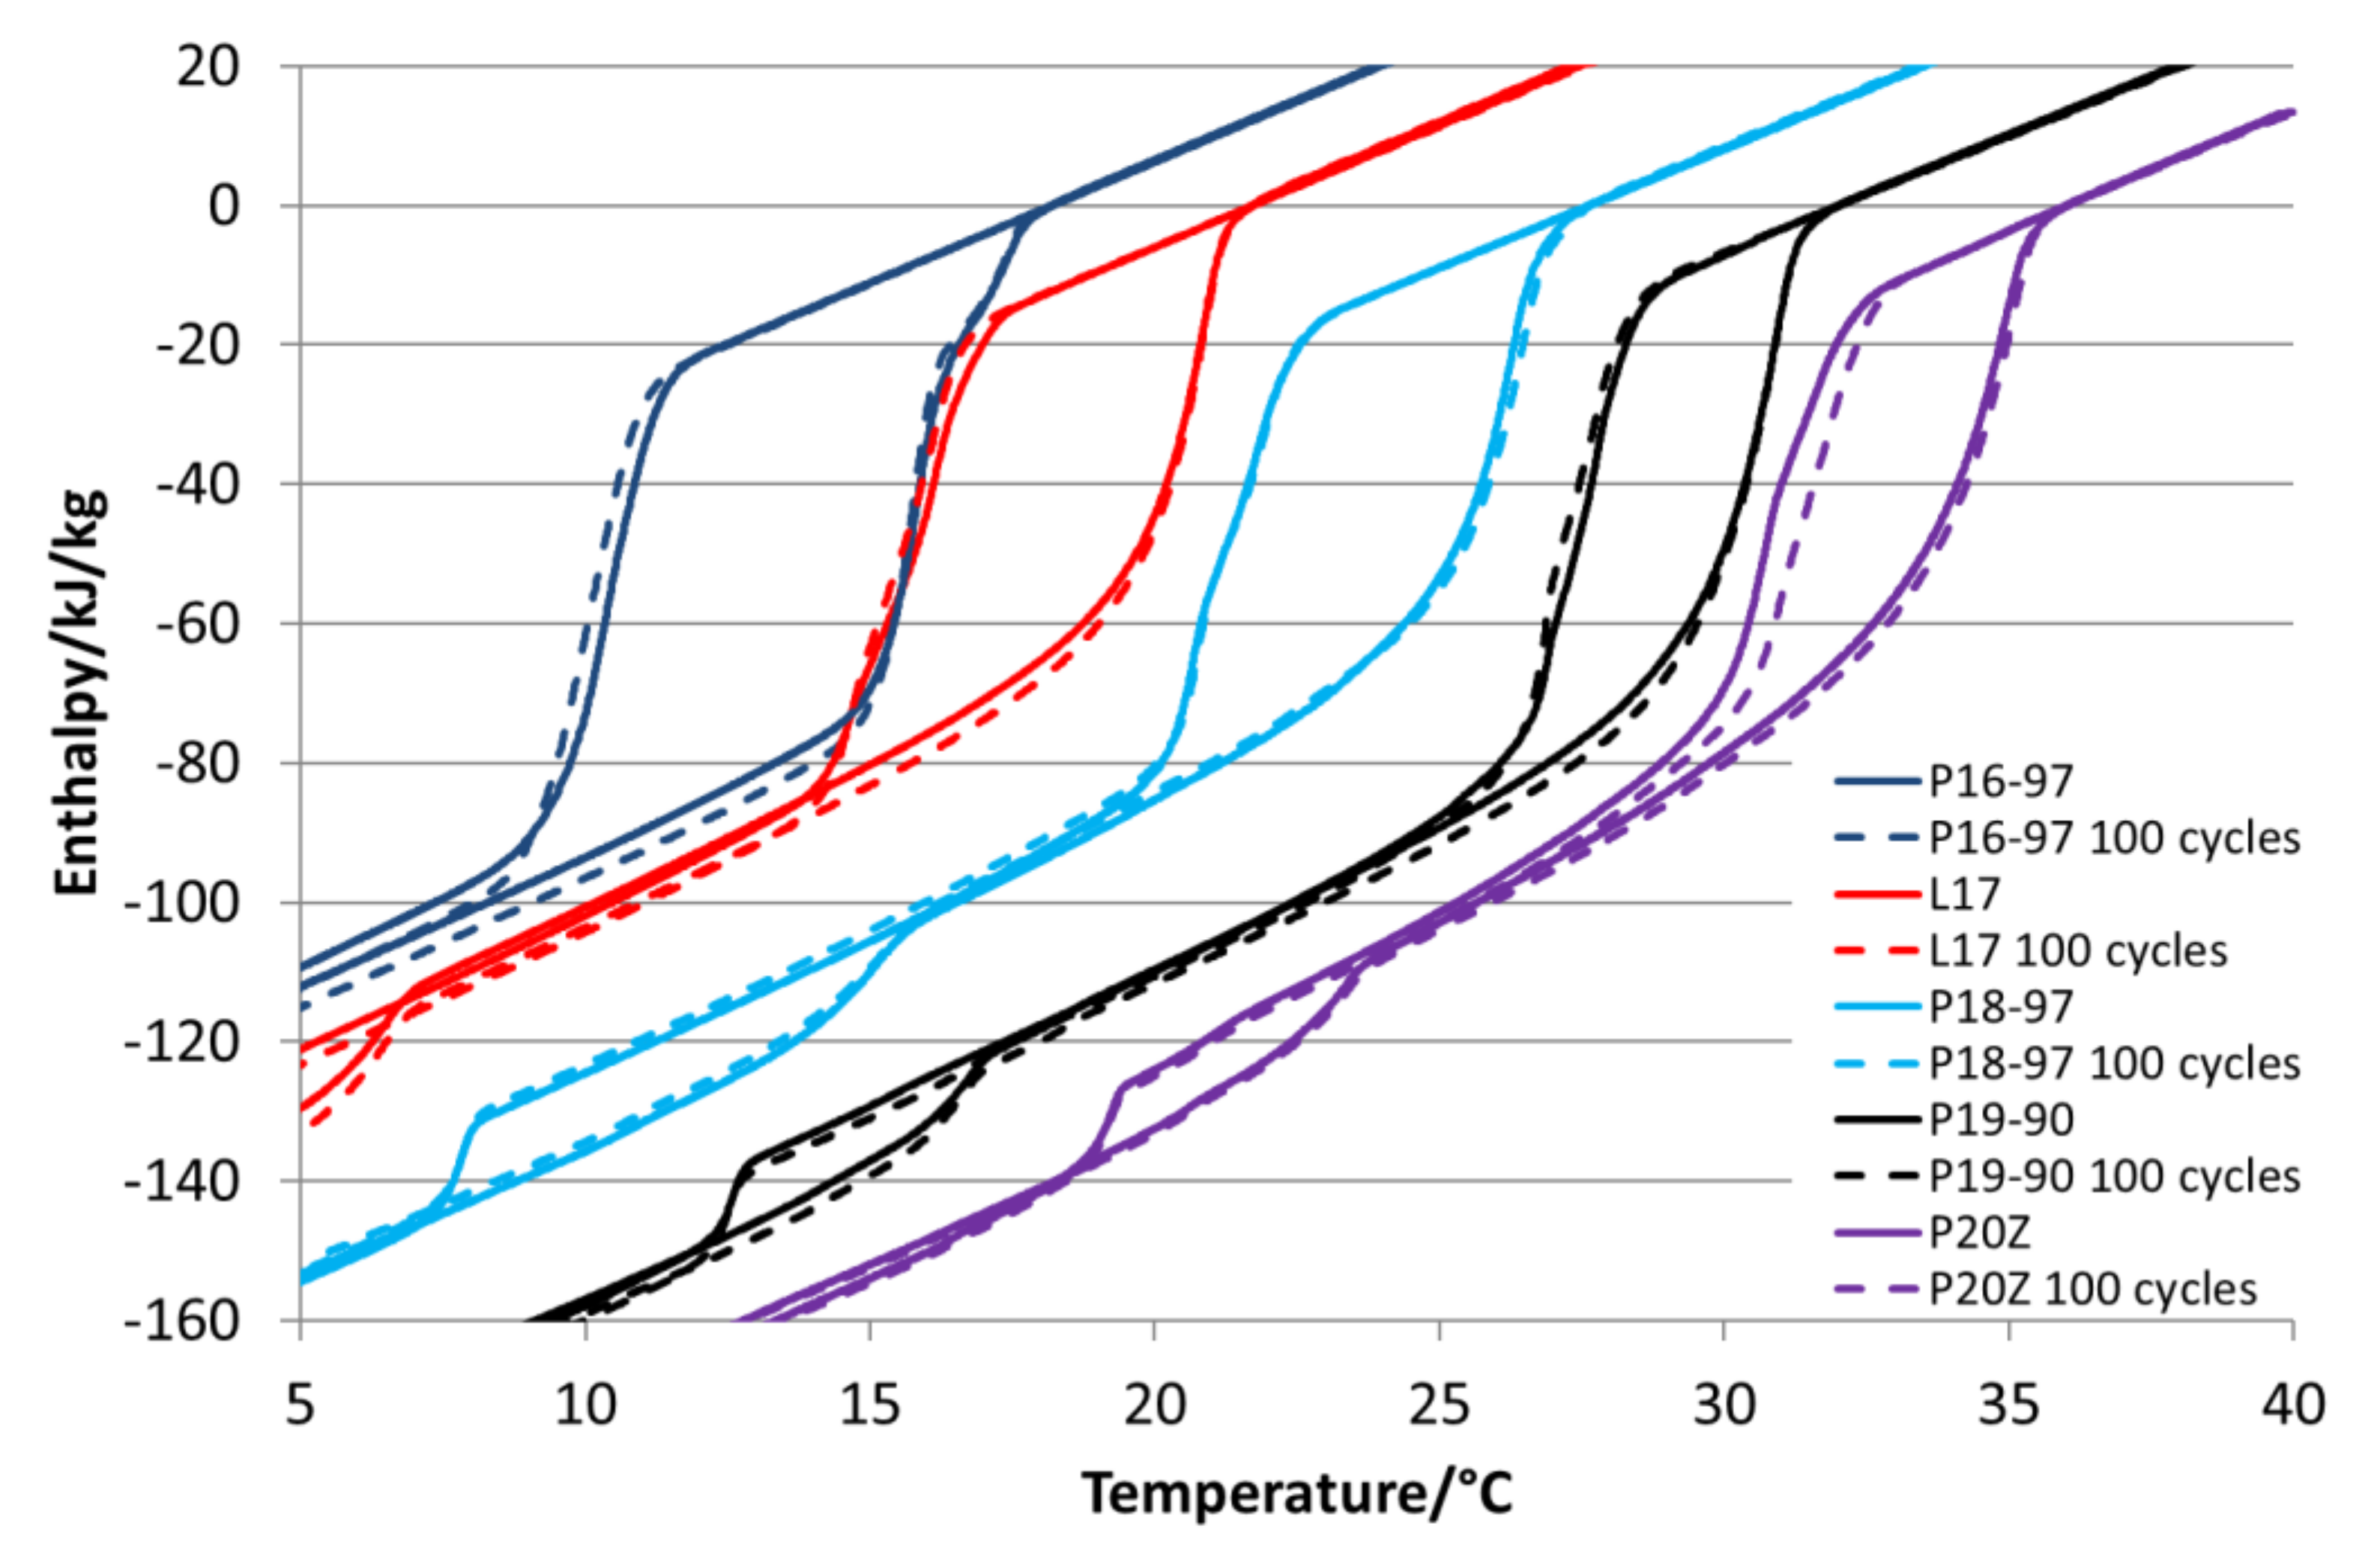
Figure 14 shows the comparison of enthalpy curves determined before and after this test. It is visible that all samples show minor changes in the crystallisation curve except P18-97. P16-97, L17 and P19-90 show slightly but not significantly deeper solidification temperatures after the test that might be an indication of an unstable nucleation seed. P20Z reveals an increase in the phase transition temperatures from a liquid to solid, which could be induced by an increase in particle size. Therefore, in general, it can be stated that those emulsions showing minor changes in the viscosity and in the particle size distribution also revealed minor changes in the phase transition behaviour.
4. Conclusions
In this study, even- and odd-numbered paraffins were used to prepare PCM emulsions and mixtures. The DSC analyses of the paraffins showed the two-phase transitions of the odd-numbered paraffins. The even-numbered paraffins shown in the DSC were only one-phase transitions, except for P20Z, which was a two-phase transition that was close together in the measurements. Furthermore, all used paraffin mixtures showed less enthalpy than the pure materials and a larger temperature range for the phase transition from a solid to liquid and, also, less supercooling. While all used pure paraffins offered total enthalpies in the range between 207 and 223 kJ/kg for the phase transition from a solid to liquid, the enthalpies of the mixtures P16-97/P18-97 and RT27 were 151 kJ/kg and 157 kJ/kg, respectively. This was on the same level with the enthalpies of the first transition of the measured odd-numbered paraffins, which were about 75–77% of their total enthalpy.
The supercooling and storage factors of the PCM emulsions were influenced by the emulsified PCM and nucleation agent. The odd- and even-numbered paraffins showed different crystallisations in the bulk but similar behaviours when emulsified. Odd-numbered paraffins kept the two-phase transitions of the bulk materials, while the investigated even-numbered paraffins showed a second phase transition (different from the bulk materials) that indicated a phase transition from the liquid to a rotator phase (first transition) and from the rotator phase to the stable phase (second transition). This behaviour led to a reduction of up to 27% of the bulk paraffin´s phase transition enthalpy for the first transition, as the emulsion P16-97, for example, showed. It was shown that the purer materials exhibited more supercooling when emulsified than the blends or mixtures. The results revealed that, due to this effect, the mixtures and blends were better in terms of the SF when small temperature intervals were given, which was shown by using a temperature difference of 6 K (comparing RT27 with P18-97 and P19-90 with P19-97). Additionally, the mixture of P16-97 and P18-97 had a SF within a 6-K range that was on the same level as P17-97 (2.11 versus 2.19). If a large melting enthalpy of a bulk material suggests a large SF for a PCM emulsion, these examples showed that this could not be transferred to the PCM emulsion directly, because the supercooling and limited temperature intervals of the applications needed to be taken into account and strongly influenced the SF and, therefore, the advantage of the emulsions over conventional heat transfer fluids.
One aspect of the analysed PCMs that could be transferred to the PCM emulsions was its tendency of supercooling with a decreasing melting temperature. The shorter the PCM´s hydrocarbon chain, the larger the degree of supercooling. Furthermore, the supercooling of the PCM emulsions was higher using purer materials. This effect was shown for Parafol 19-90 and Parafol 19-97, as well as for RT27 and P18-97 emulsions.
Therefore, in terms of costs, it is favourable to have knowledge about the specific temperature interval of an application to consider whether it is more cost-efficient to use not-so-pure but cheaper PCMs providing a good storage capacity within small temperature intervals or to choose the more expensive, purer PCMs to provide more storage capacity when the usable temperature interval is a bit broader.
All the investigated PCM emulsions had similar particle sizes. This indicated that, for the investigated emulsions, the particle size distribution was dependent on the formulation rather than on the used PCM. The thermal–physical properties were measured before and after cycling and showed comparable results for P16-97, L17, P18-97, P19-90 and P20Z emulsions. None of them showed visible instabilities, such as creaming or phase separation, after 100 thermal–mechanical cycles in the rheometer, but a major or minor change in the behaviours and properties was visible for the measured viscosities, particle size distributions and crystallisation behaviours. Especially, the changes in the viscosity and particle size were significant and revealed differences. In comparison, the changes in the melting and solidification behaviours were not so pronounced, and it might be more difficult to draw conclusions about stability from these DSC results. Nevertheless, there were some changes visible that might indicate, e.g., the stability of the crystallisation seed and, due to decreased supercooling, the influence of a change in the particle sizes. In general, all used measuring techniques could reveal a change of properties and, therefore, instability before creaming or phase separation was visible and, therefore, provided an indication of the long-term stability or instability of the PCM emulsions. So far, it is not known how the observed changes affect the stability of these PCM emulsions under real usage or what they mean in terms of useful life applications. Therefore, in future works, the changes of the material properties due to the thermal–mechanical stability test undertaken in the rheometer have to be compared with the stabilities obtained under real applicational conditions, with the aim of developing a model to predict the real stability of PCM emulsions on the basis of this accelerated lab test.


 ,
, 


