Article

Evaluation of Structural Performance of Post-Installed Anchors Embedded in Cracked Concrete in Power Plant Facilities

Department of Civil Engineering, Gangneung-Wonju National University, Gangneung 210-702, Korea
*
Author to whom correspondence should be addressed.
Appl. Sci. 2021, 11(8), 3488; https://doi.org/10.3390/app11083488
Submission received: 15 March 2021 / Revised: 30 March 2021 / Accepted: 6 April 2021 / Published: 13 April 2021
(This article belongs to the Special Issue Seismic Assessment and Design of Structures)

Abstract

:
In this study, a field survey was conducted on the fixed anchorages of the operation and power generation facilities installed in domestic power plants. A static/dynamic performance evaluation was conducted to present safety evaluation guidelines that meet the domestic seismic performance requirements. Seismic performance tests were performed on the post-installed set anchors M10 and M12, which are mainly used for anchorages in accordance with the US and European seismic performance standards. The dynamic shear test results showed that the M12 anchor met the seismic performance verification criterion, whereas the M10 anchor did not because its dynamic performance was reduced, owing to the cyclic loading. In the results of the dynamic pull-out test, M12 also met the seismic performance verification criterion, whereas M10 was safe only in a non-cracked state. In summary, the seismic performance of M12 in both cracks and non-cracks was satisfied, but, in the case of M10, the results were not satisfied in cracks. This was an experimental study; it will be necessary to conduct additional analytical research in the future to verify the reliability and parameters of the experiment.

1. Introduction

1.1. Background

Most operation and power generation facilities that are used in power plants have important functional purposes and are independently constructed on concrete slabs applying fixation systems. Post-installed anchors are mainly used as a general fixation system and are widely used for attaching or fixing structures, owing to their flexibility and ease of construction [1]. However, such anchors may affect the safety of the entire structure when exposed to direct events, such as an earthquake, or indirect events, such as concrete cracking due to aging [2].
According to a Federal Emergency Management Agency (FEMA) report, the frequency of occurrence of earthquakes with a magnitude of 5.0 or higher has been continuously increasing over the last 10 years, and there has been an increasing amount of damage to non-structural elements, such as operation and power generation facilities in power plants [3]. Most of this damage has involved an overturning or sliding of the facility from damaged anchors embedded in cracked concrete. The occurrence of such damage may lead to secondary damage, causing more serious social chaos from the functional loss and malfunction of the facilities [4].
Despite the increasing importance of anchors used in fixation units, such as in operation and power generation facilities, there are no seismic evaluation or verification criteria for such units in South Korea. In this study, static and dynamic experiments on the anchorages of non-structural elements were conducted using the seismic performance evaluation criteria of anchorages in the United States and Europe.

1.2. Fixation Unit Anchor System

1.2.1. Types of Post-Installed Anchor Bolts

Anchor bolts are installed in concrete by drilling holes using hammer or core drills after the concrete has been poured and hardened. They can be divided into mechanical post-installed anchor bolts, which produce the main bearing capacity by frictional force and mechanical locking devices, and adhesive post-installed anchor bolts, which generate the main bearing capacity by the adhesive force of the attached compounds [5]. Figure 1 shows post-installation anchors commonly used for field installation in Korea, and, in this study, set anchors were targeted.

1.2.2. Design Standards and Failure Modes for Concrete-Embedded Anchor Bolts

In this study, the design load was calculated by referring to the domestic “Concrete Structure Standard (2012) Appendix II Concrete Anchors” design standards, and the level of safety was examined through a comparison with the results of static tests (pull-out and shear tests) [6]. The basic concepts of the anchor bolts subjected to tensile and shear loads are shown in Equations (1) and (2) below. Regarding the nominal tensile strength and shear strength, the smallest values among the possible anchor failure modes were used, as presented in Table 1. Anchor bolts were installed.
NnNua
where Nua is the required tensile strength and Nn is the nominal tensile strength.
VnVua
where Vua is the required shear strength and Vn is the nominal shear strength.

2. Overseas Seismic Performance Evaluation Criteria

Concrete with embedded anchors generally exhibits cracks when its durability is significantly reduced in the event of an earthquake. Additionally, a stress distribution occurs along the anchor installation locations, as shown in Figure 2, and the bearing capacity of the anchors is rapidly weakened [7]. In the evaluation of the seismic performance of concrete anchors, these behavioral characteristics are considered, and the effect of the cracks in the fixation unit of the concrete on the adhesive force of the anchors is evaluated. The average maximum loads are calculated by evaluating the static performance of two concrete types (non-cracked and cracked concrete), and a dynamic load protocol is presented based on such calculations. Finally, the seismic safety of the concrete-embedded anchor bolts is evaluated by assessing the performance under these dynamic loads [8].
In the United States, the seismic performance of post-installed anchor bolts embedded in cracked concrete is evaluated in accordance with the American Concrete Institute (ACI) 355.2 standards [9] because they may cause concrete cracks or be pulled out in the event of an earthquake [10]. According to the ACI 355.2 standards, a simulated seismic load test is conducted by simulating an earthquake using cyclic loading, and it is assumed that post-installed anchor bolts are embedded in concrete with a 0.5-mm-wide crack. The presented cyclic loading is shown in Figure 3. For the cyclic loading pattern, a 50% load with average strength, determined through a static performance test, is applied 10 times; a 37.5% load is applied 30 times, and a 25% load is applied 100 times. Therefore, cyclic loading is applied 140 times until failure. In this instance, the loading rate must be between 0.1 and 2 Hz. The seismic performance is considered verified if the dynamic performance through cycling loading meets 80% of the static performance.
TR 049, which are the design standards published by the European Organization for Technical Approval (EOTA), include the design standards for mechanical post-installed anchors [11]. For the C1 classification for non-structural elements, it is assumed that they are embedded in concrete with a 0.5-mm-wide crack. In addition, a 50% load with average strength, as determined through a static performance test, is applied 10 times; a 37.5% load is applied 30 times, and a 25% load is applied 100 times, in the same way as with the ACI 355.2 standards. The seismic performance is also considered to be verified if 80% of the static performance is met during the static loading test.

3. Experiment Overview

3.1. Selection of Test Targets through a Field Survey

In this study, a field survey was conducted to evaluate the seismic performance of the post-installed anchor bolts embedded in an actual site. The Daecheong hydroelectric power plant located in Daejeon Metropolitan City was selected as the test bed. As shown in Figure 4, most of the fixation unit anchors constructed at the site were found to be cast-in-place anchors. In the case of anchor damage or equipment without anchors, post-installed anchors were applied through a seismic reinforcement added in the year 2000.
For the post-installed anchors applied on-site, M10 and M12 set anchors were used. These anchors were selected as the test targets in this study. Figure 5 shows the M10 and M12 set anchors selected as test targets, and Table 2 shows their specifications.

3.2. Specimen Design and Fabrication

At the time of the field survey, concrete in the fixation units of power generation facilities in the test bed exhibited considerable concrete degradation from aging as a few decades had passed since the pouring of the concrete. This means that the operation facilities are highly likely to overturn and slide in the event of an earthquake, owing to a reduction in the anchor–concrete adhesive force caused by cracks in the concrete with a fixation unit. To evaluate the level of safety against this problem, in this study, specimens were fabricated, and tests were conducted by dividing the concrete with a fixation unit into two states (non-cracked and cracked concrete).

3.2.1. Non-Cracked Concrete

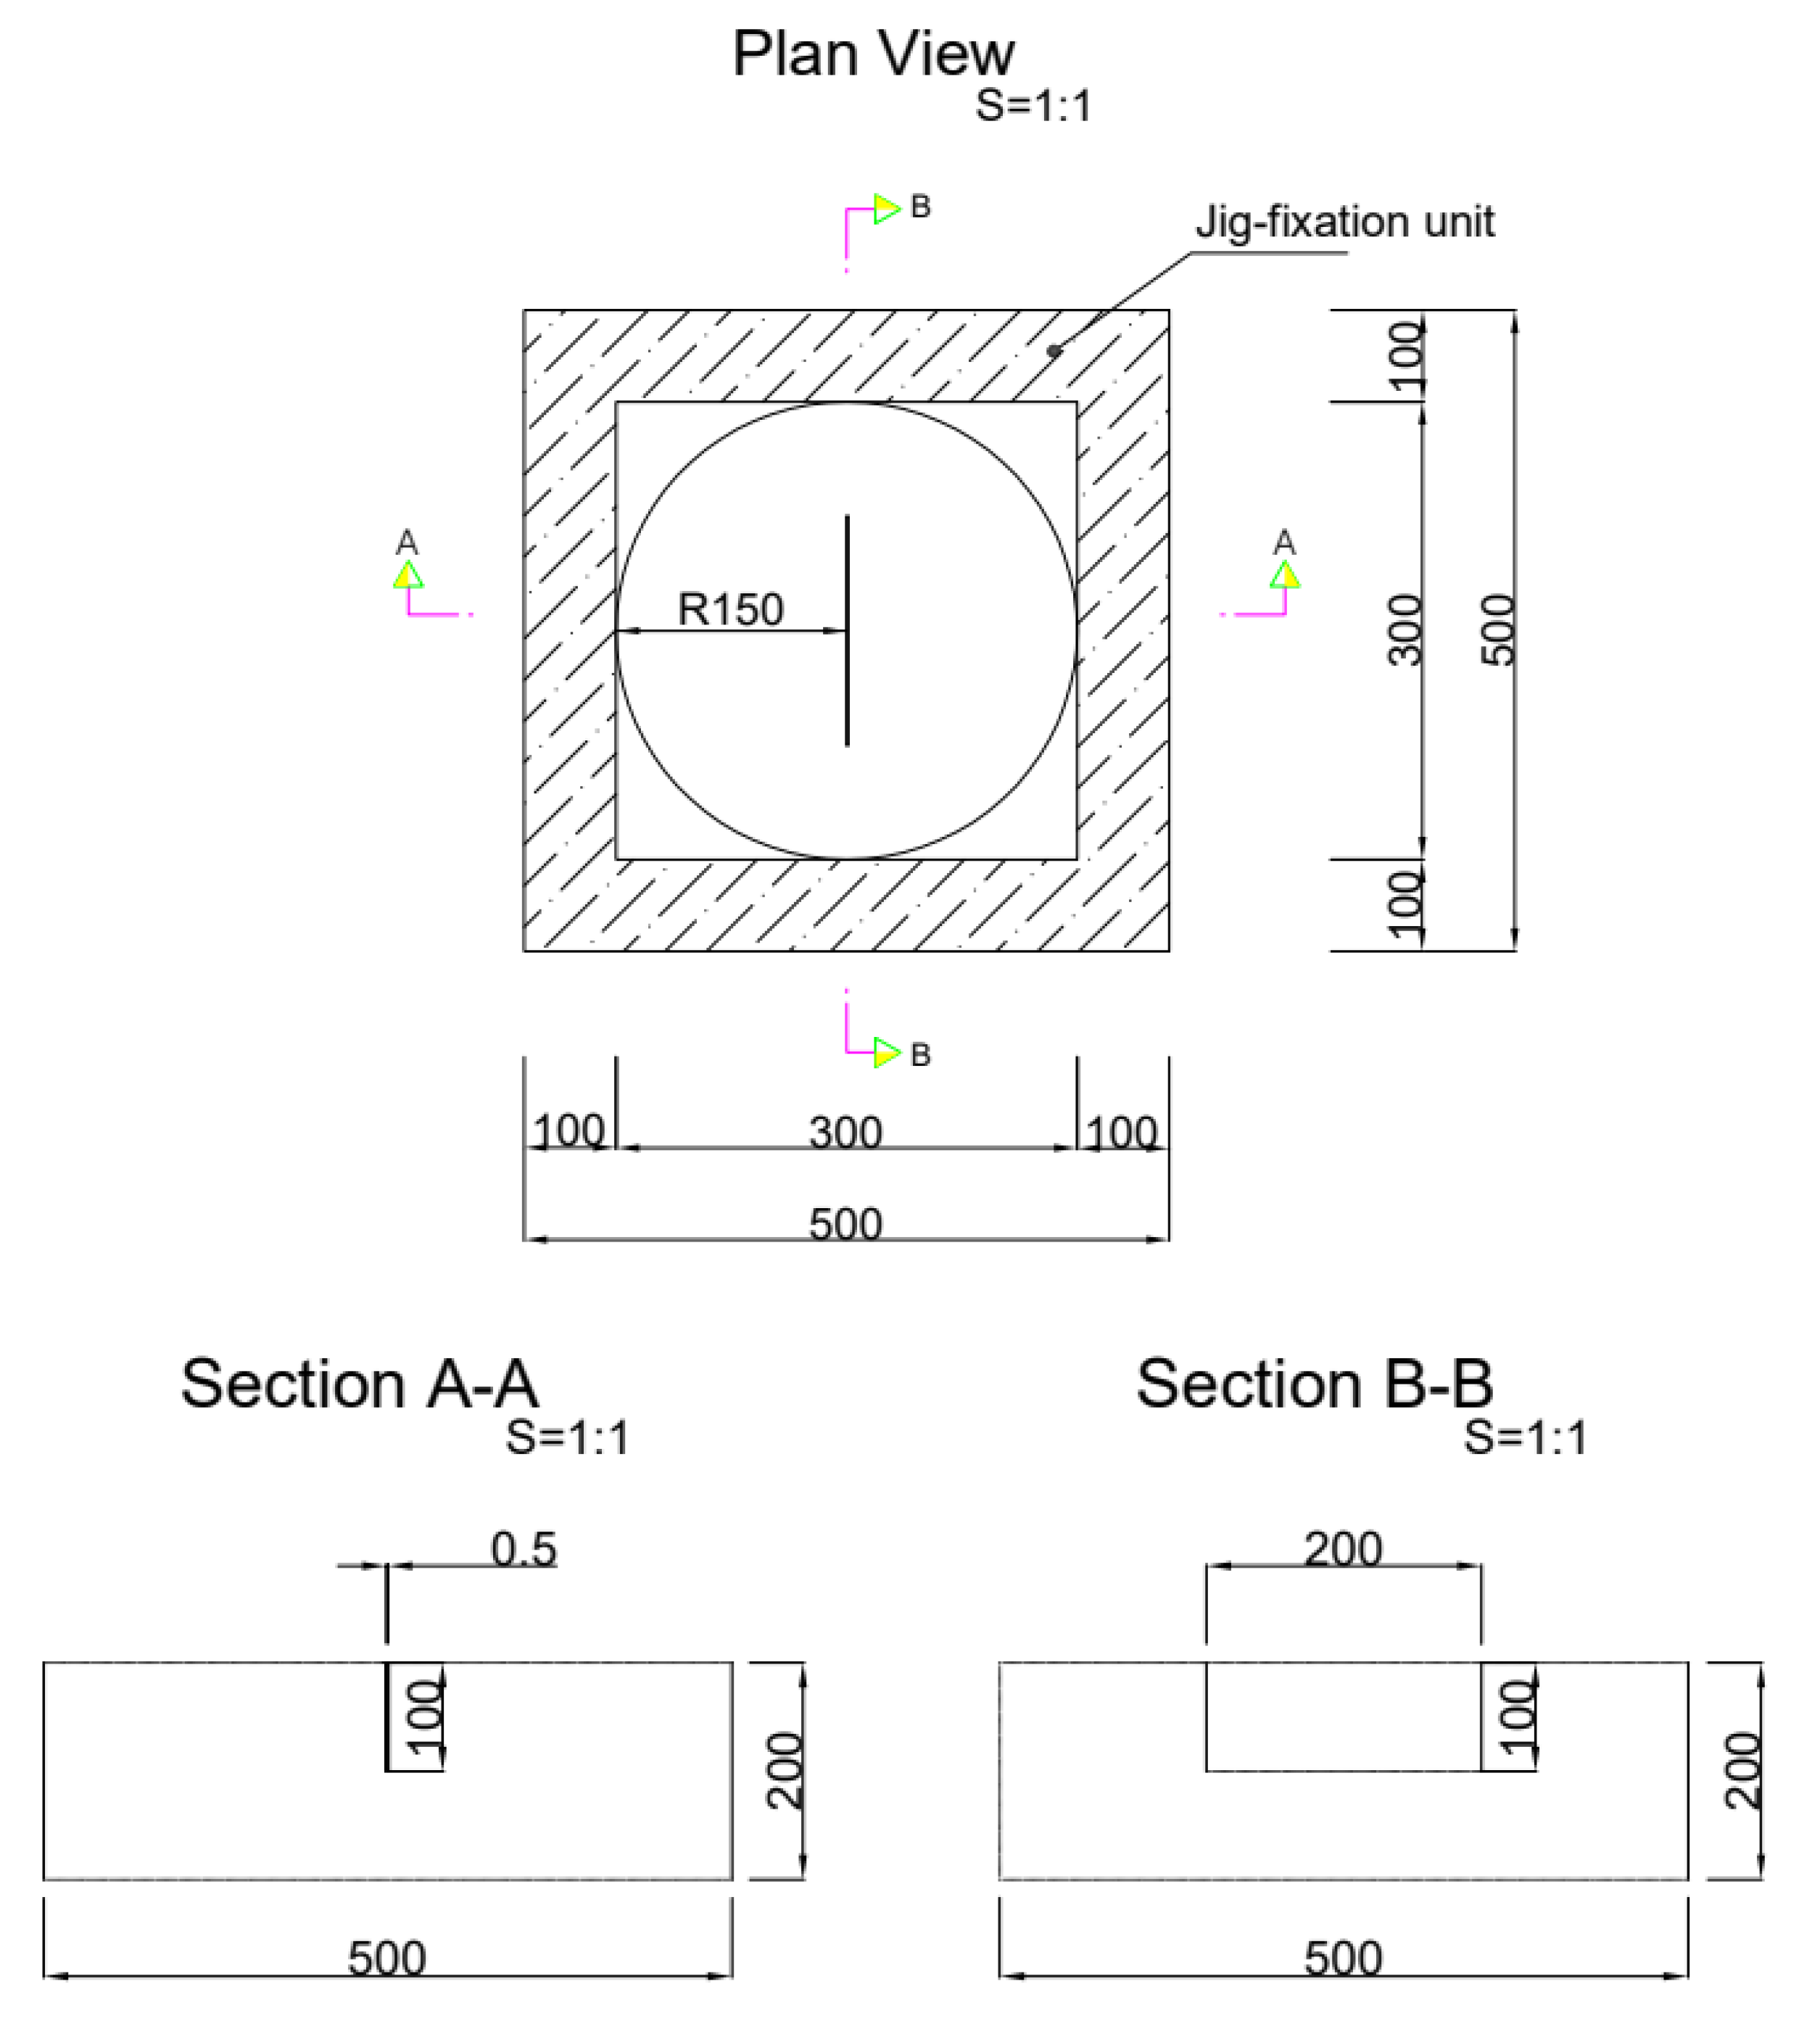
For the fabrication of the specimens, the design strength of 21 MPa measured in the fixation units of the power generation facilities in the test bed using a Schmidt hammer, a non-destructive test tool, was also considered as the design strength of the concrete. Specimens were fabricated with a size of 500 mm (width) × 500 mm (depth) × 200 mm (height) considering the fracture radius of an anchor bolt in accordance with ACI 318, as shown in Figure 6. Five specimens were fabricated for each of the pull-out and shear tests for each set anchor diameter. Thus, a total of 20 specimens were fabricated. The set anchors used were M10 and M12, and a 250 mm length and a 100 mm embedded depth were selected as their specifications, considering the fixation unit anchor bolts installed at the actual site and the experimental equipment set.

3.2.2. Cracked Concrete

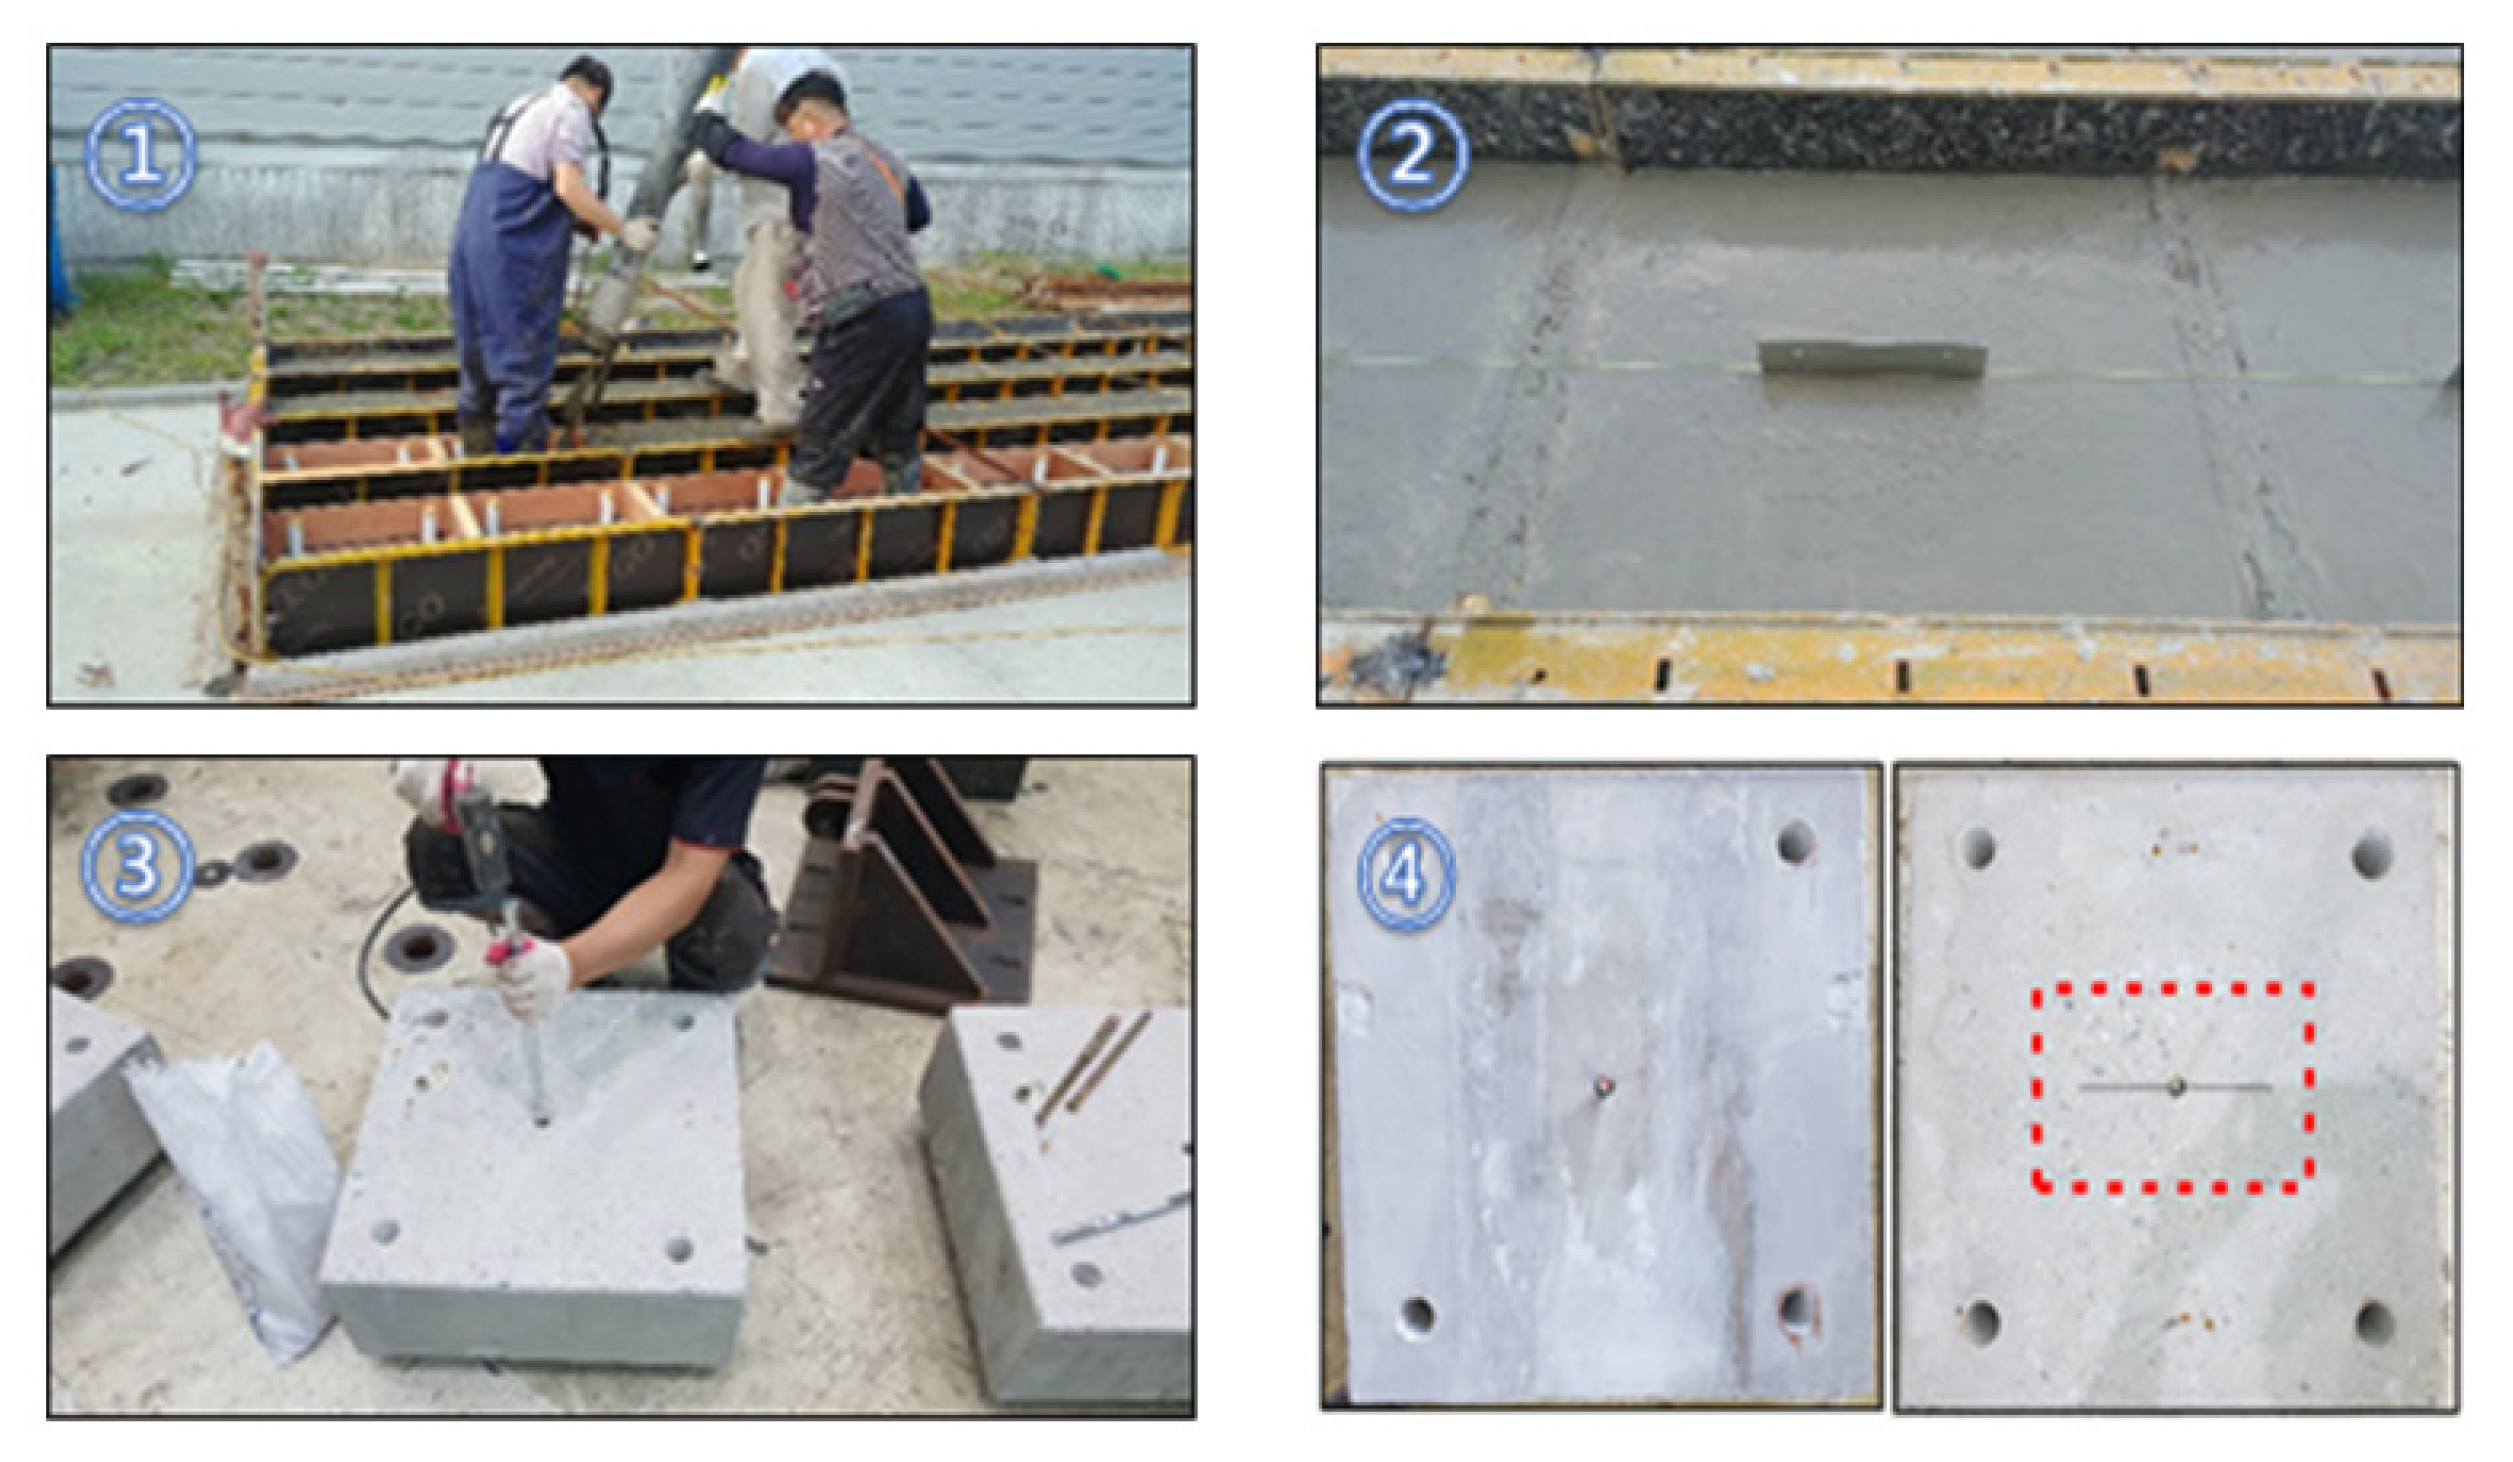
Cracked concrete specimens were fabricated in the same way as non-cracked concrete specimens with a specific size. An artificial crack was simulated in the concrete by referring to the seismic performance evaluation criteria of the United States and Europe. In the case of artificial cracks [12], the experiments were conducted by fabricating the test specimen by inserting a 0.5 mm panel, not by using a general method, in order to conduct the experiment under the same conditions. A 0.5-mm-wide artificial crack was generated in the specimens by embedding a stainless-steel plate, at a depth of up to 100 mm, during concrete pouring and then removing it after curing. Five specimens were fabricated for each of the pull-out and shear tests for each set anchor type. Thus, a total of 20 specimens were fabricated. Figure 7 shows the fabrication process for the cracked concrete specimens.

4. Performance Evaluation of Post-Installed Anchors

A static performance evaluation was conducted by installing M10 and M12 set anchors, among various types of post-installed anchors, into two types of concrete specimens (non-cracked and cracked concrete). The main purpose of the experiment was the development of a dynamic load protocol for seismic performance evaluation. The load protocol applied to the dynamic tests was proposed by investigating the structural behavior under a pull-out and shear load and using the average maximum load from the results.

4.1. Static Loading Test

4.1.1. Experimental Method

The static performance of the post-installed anchors was evaluated by conducting shear and pull-out tests using a dynamic 1000 kN universal testing machine (UTM) in a domestic certification test research center in accordance with American Society for Testing and Materials (ASTM) E 488 [13]. For the applied loading condition, a continuous loading method (T-01), in which the load is slowly applied until failure, was used to obtain the load–displacement data for the full behavior until the failure of the anchor bolt. The loading rate was set to 0.4 mm/min, allowing the tests to be slowly conducted while observing the concrete–anchor bond behavior.
In the case of the shear tests, each concrete specimen with anchor bolts was erected vertically and fixed at the UTM, as shown in Figure 8a, and the equipment set for the shear tests was then fastened with the anchor. In the case of the pull-out tests, by contrast, each of the concrete specimens with the anchor bolts was fixed to the reaction floor of the UTM, as shown in Figure 8b, and the hydraulic tension grip of the UTM load cell was then fastened with the anchor. The tests were stopped when damage occurred or when the load resistance was lost from such damage. From the five tests conducted, three test results with an error rate of less than 20% were selected.
Based on the selected test results, the average maximum loads were calculated, and the pull-out performance was evaluated. The result was used to propose a load protocol for use in dynamic performance evaluation. Table 3 provides a list of the specimen names.

4.1.2. Shear Performance Evaluation

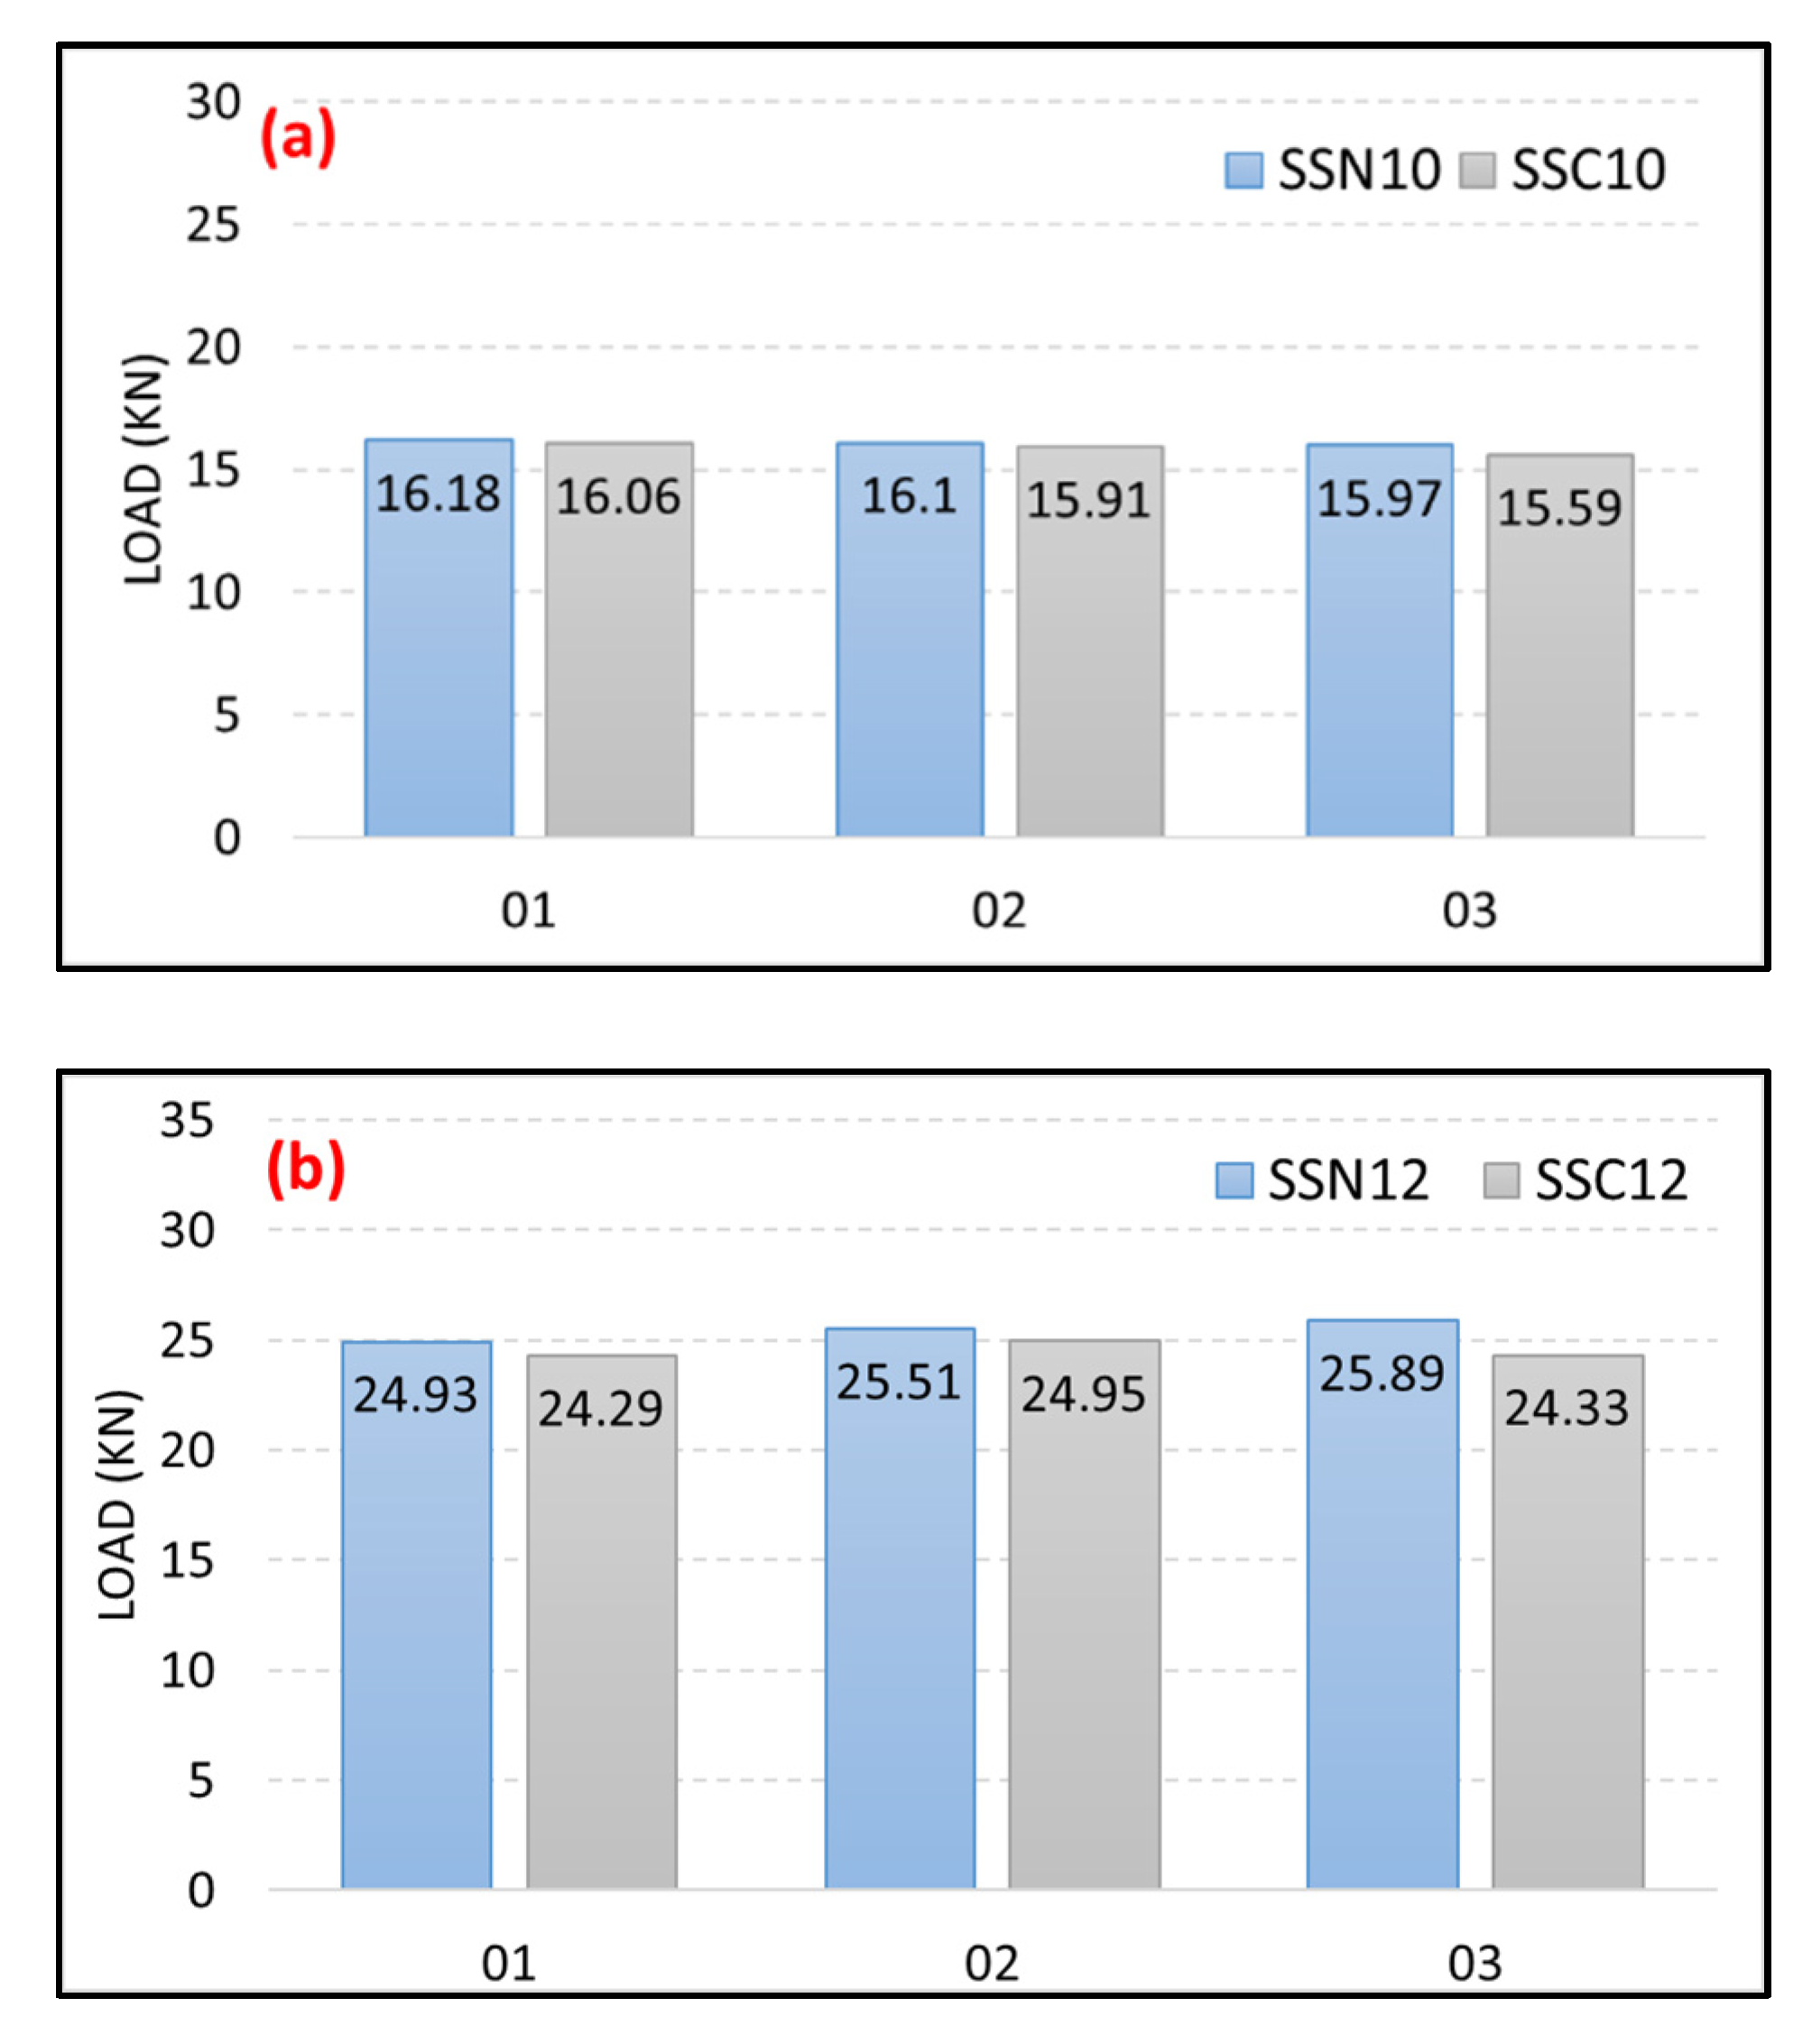
In the shear test results of the M10 and M12 set anchors, both anchors exhibited a steel failure instead of a concrete–anchor bond failure, as shown in Figure 9. It appears that the steel failure occurred before the load affected the concrete, owing to the sufficient bearing capacity of the concrete for the anchor installed at the center of the specimen and because of the distance of the concrete–anchor generated from the way in which the anchor was set. The differences in performance depending on the presence of a concrete crack were found to be insignificant, as shown in Figure 10. Table 4 summarizes the average maximum load for each test.

4.1.3. Pull-Out Performance Evaluation

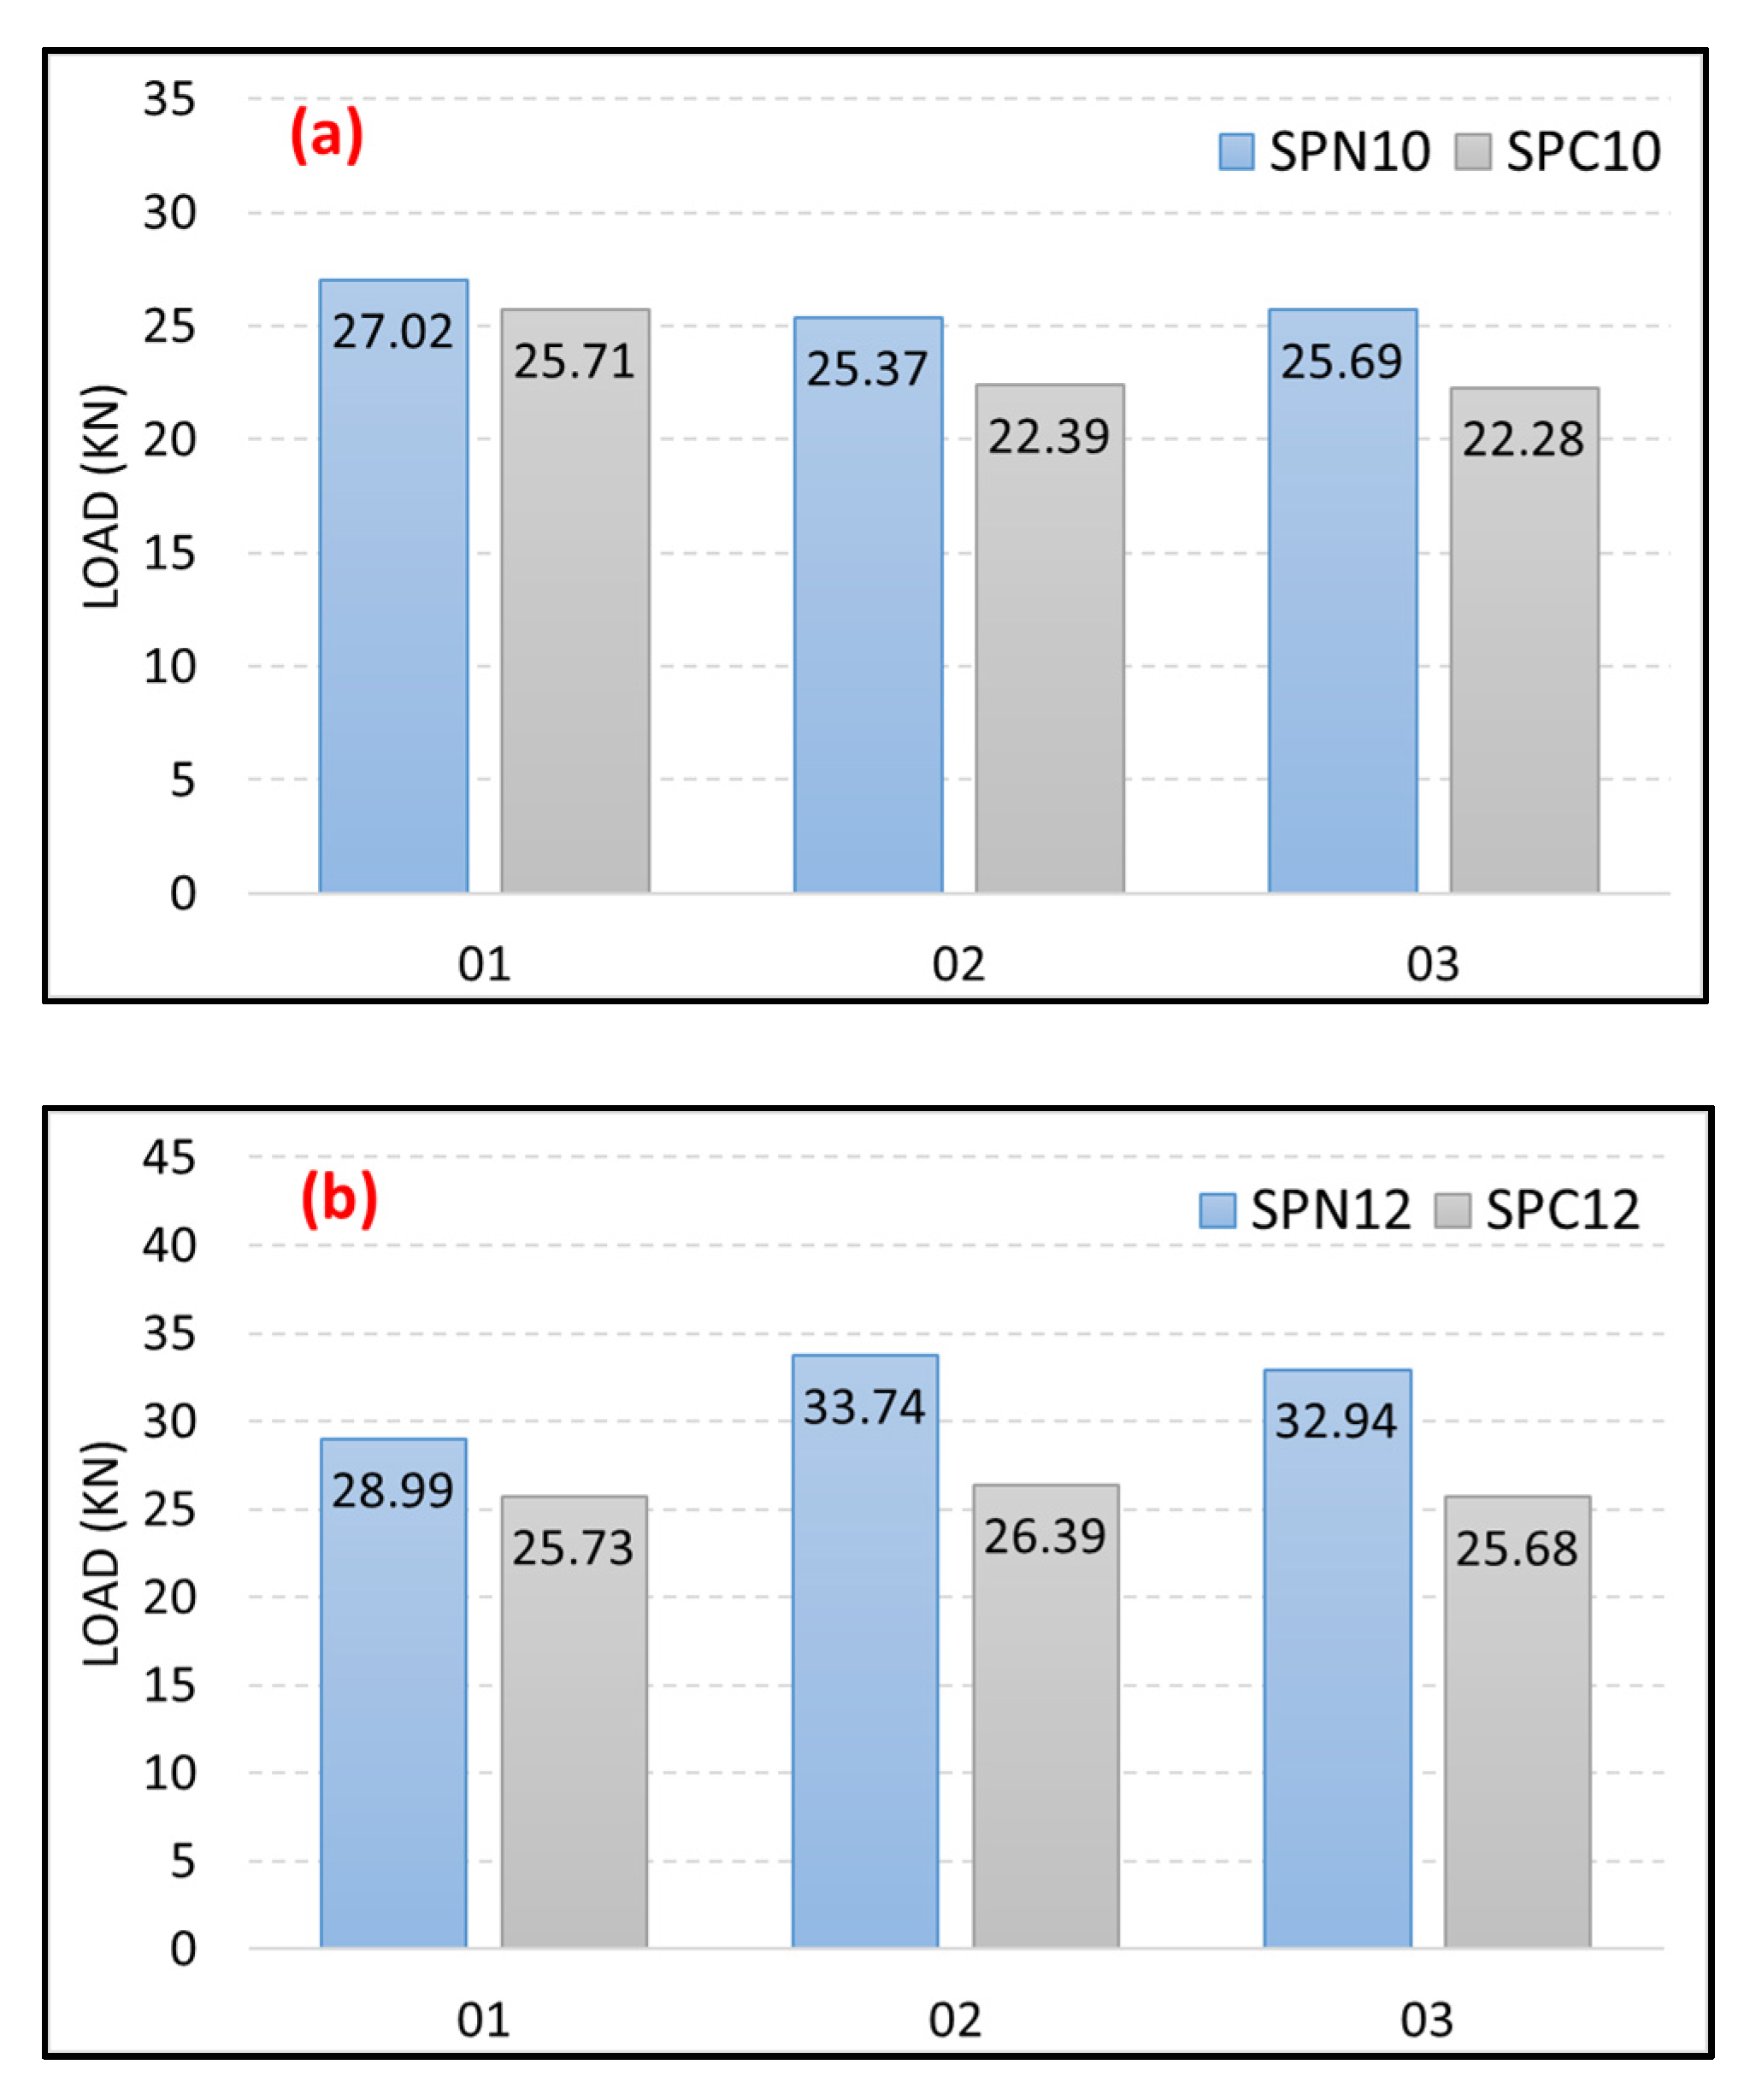
For the pull-out tests on the M10 set anchor, a steel anchor failure finally occurred in both the cracked and non-cracked concrete, as shown in Figure 11a. The maximum pull-out load in the cracked concrete specimens was smaller than that in the non-cracked concrete specimens, owing to a reduction in adhesive force between the concrete and anchor. For the M12 set anchor, a concrete cone failure by the adhesive force occurred only under the slightly increased anchor diameter, as shown in Figure 11b. As with M10, the maximum pull-out load in the cracked concrete specimens was smaller than that in the non-cracked concrete specimens, owing to a reduction in the adhesive force. Figure 12 shows the differences in performance depending on the presence of a concrete crack, and Table 5 shows the average maximum load for each test.

4.2. Dynamic Loading Test

4.2.1. Presentation of Dynamic Load Protocol

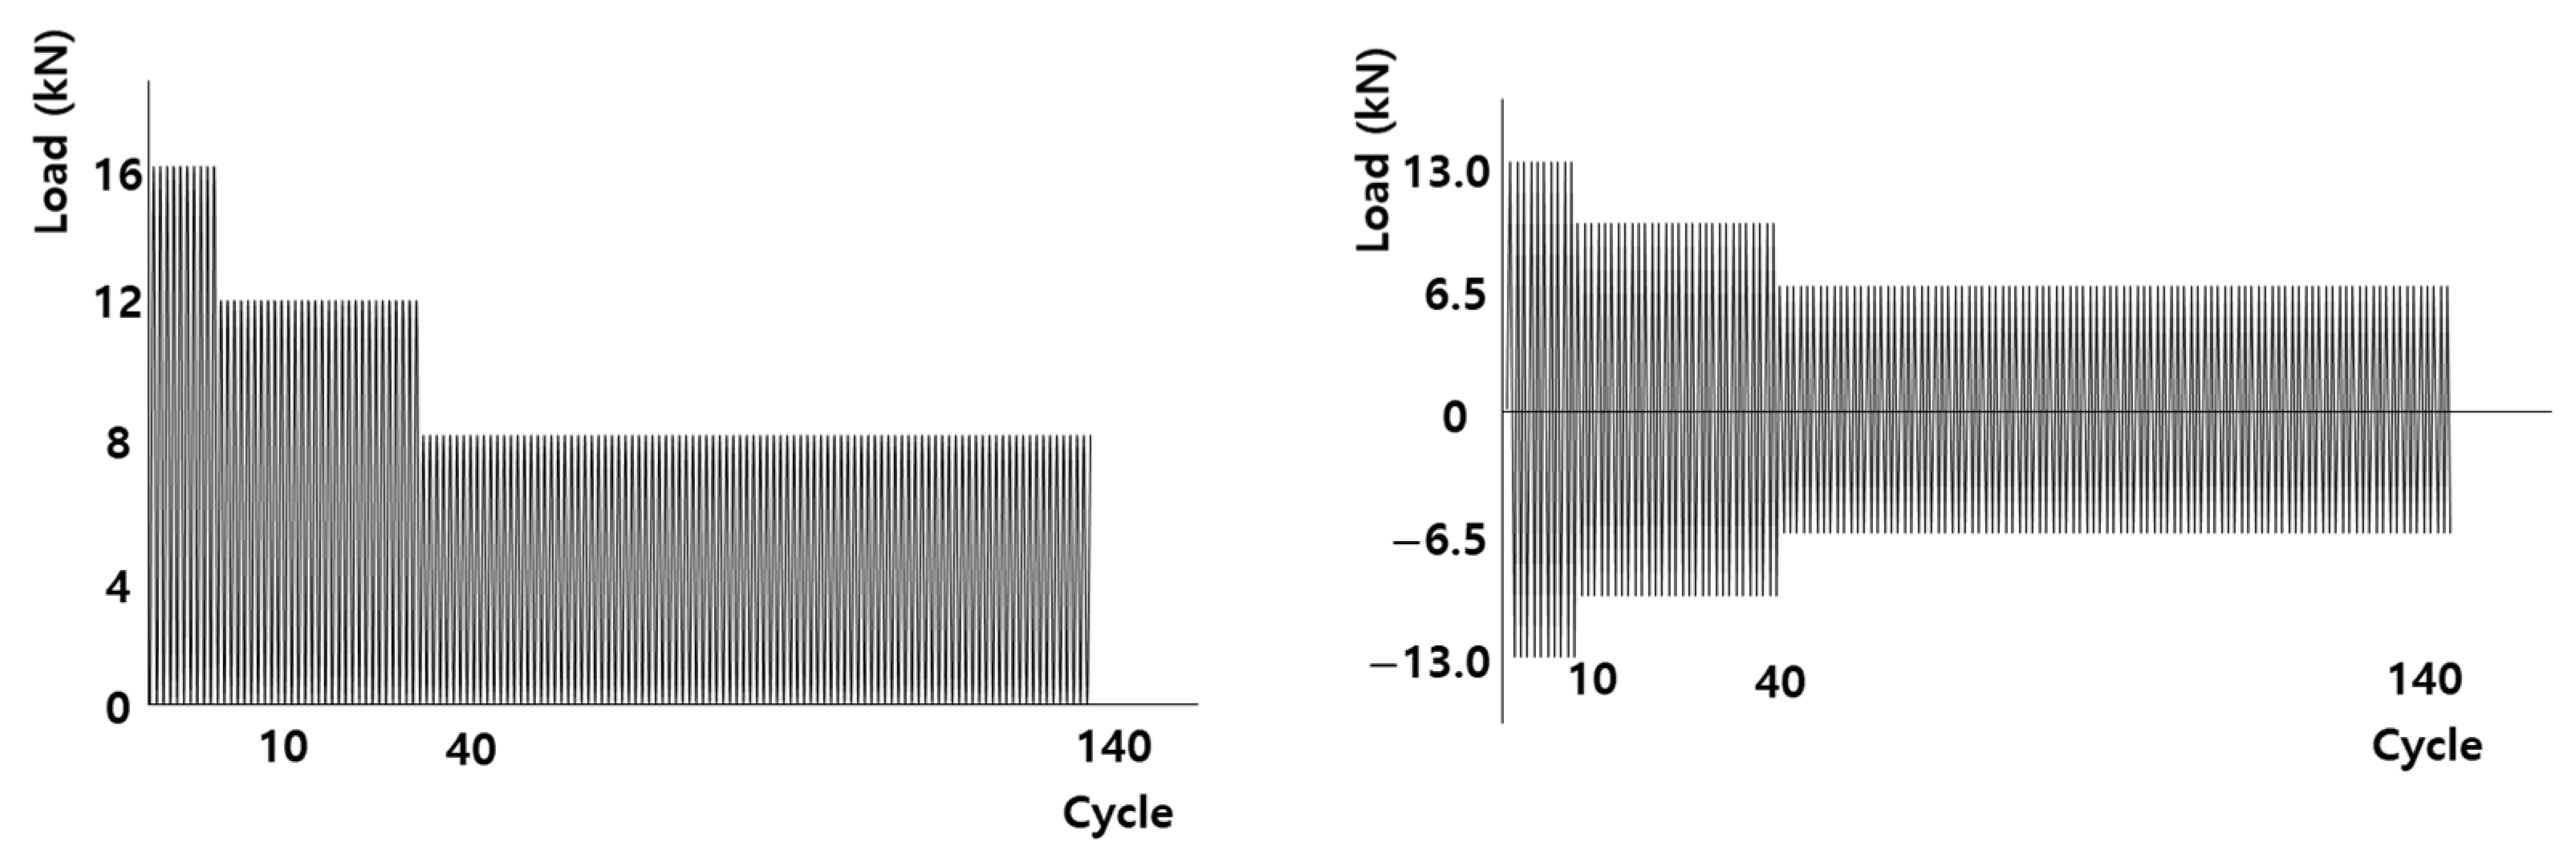
In this study, a load protocol for a seismic safety evaluation under a dynamic load was presented by referring to the ACI 355.2 standards of the United States for verification of the seismic performance of power generation facilities in power plants and the TR 049 Category C1 standards of Europe, which consider non-structural elements. Based on the average maximum loads derived from the static performance evaluation, a dynamic load protocol was presented, as shown in Table 6. The protocol was used to evaluate the dynamic performance of the M10 and M12 set anchors. Figure 13 shows the dynamic load protocol of the M10 set anchor, and Figure 14 shows that of the M12 set anchor. The seismic performance of the concrete anchors installed in power generation facilities was considered verified if the maximum pull-out and shear load values of the dynamic tests derived under the presented cyclic loading met 80% of the performance presented in the static tests.

4.2.2. Experimental Methods

During the dynamic tests, there was clearance between the concrete and each anchor owing to the sleeve of the set anchors. As such, clearance may cause errors from a slip of the equipment set and the vibration of the anchor under the actual cyclic loading, and an equipment set that can deliver cyclic loading more accurately was fabricated. In addition, during the tests, the rate of the cyclic loading was reduced from 1.0 to 0.2 Hz, as determined through trial and error, to deliver the load to the actual anchor more accurately. Experimental methods other than the loading rate and equipment set were conducted in the same way as the static performance tests. The tests were stopped when the load resistance was lost from damage to the anchor or concrete. From the five tests conducted, the results of three tests with an error rate of less than 20% were selected. Table 7 provides a specimen list with the specimen names.

4.2.3. Shear Performance Evaluation

In the dynamic shear test results of the M10 and M12 set anchors, both anchors exhibited steel failure. In the case of the M10 anchors, an early anchor failure occurred owing to the cyclic loading in the tests compared to the M12 anchors. This appears to be due to the difference in diameter. The differences in dynamic shear performance depending on the presence of a concrete crack were found to be insignificant, as in the static shear tests.
Table 8 summarizes whether the shear maximum loads generated during the tests met 80% of the static shear performance (seismic performance verification criterion).
  • DSN10 and DSC10
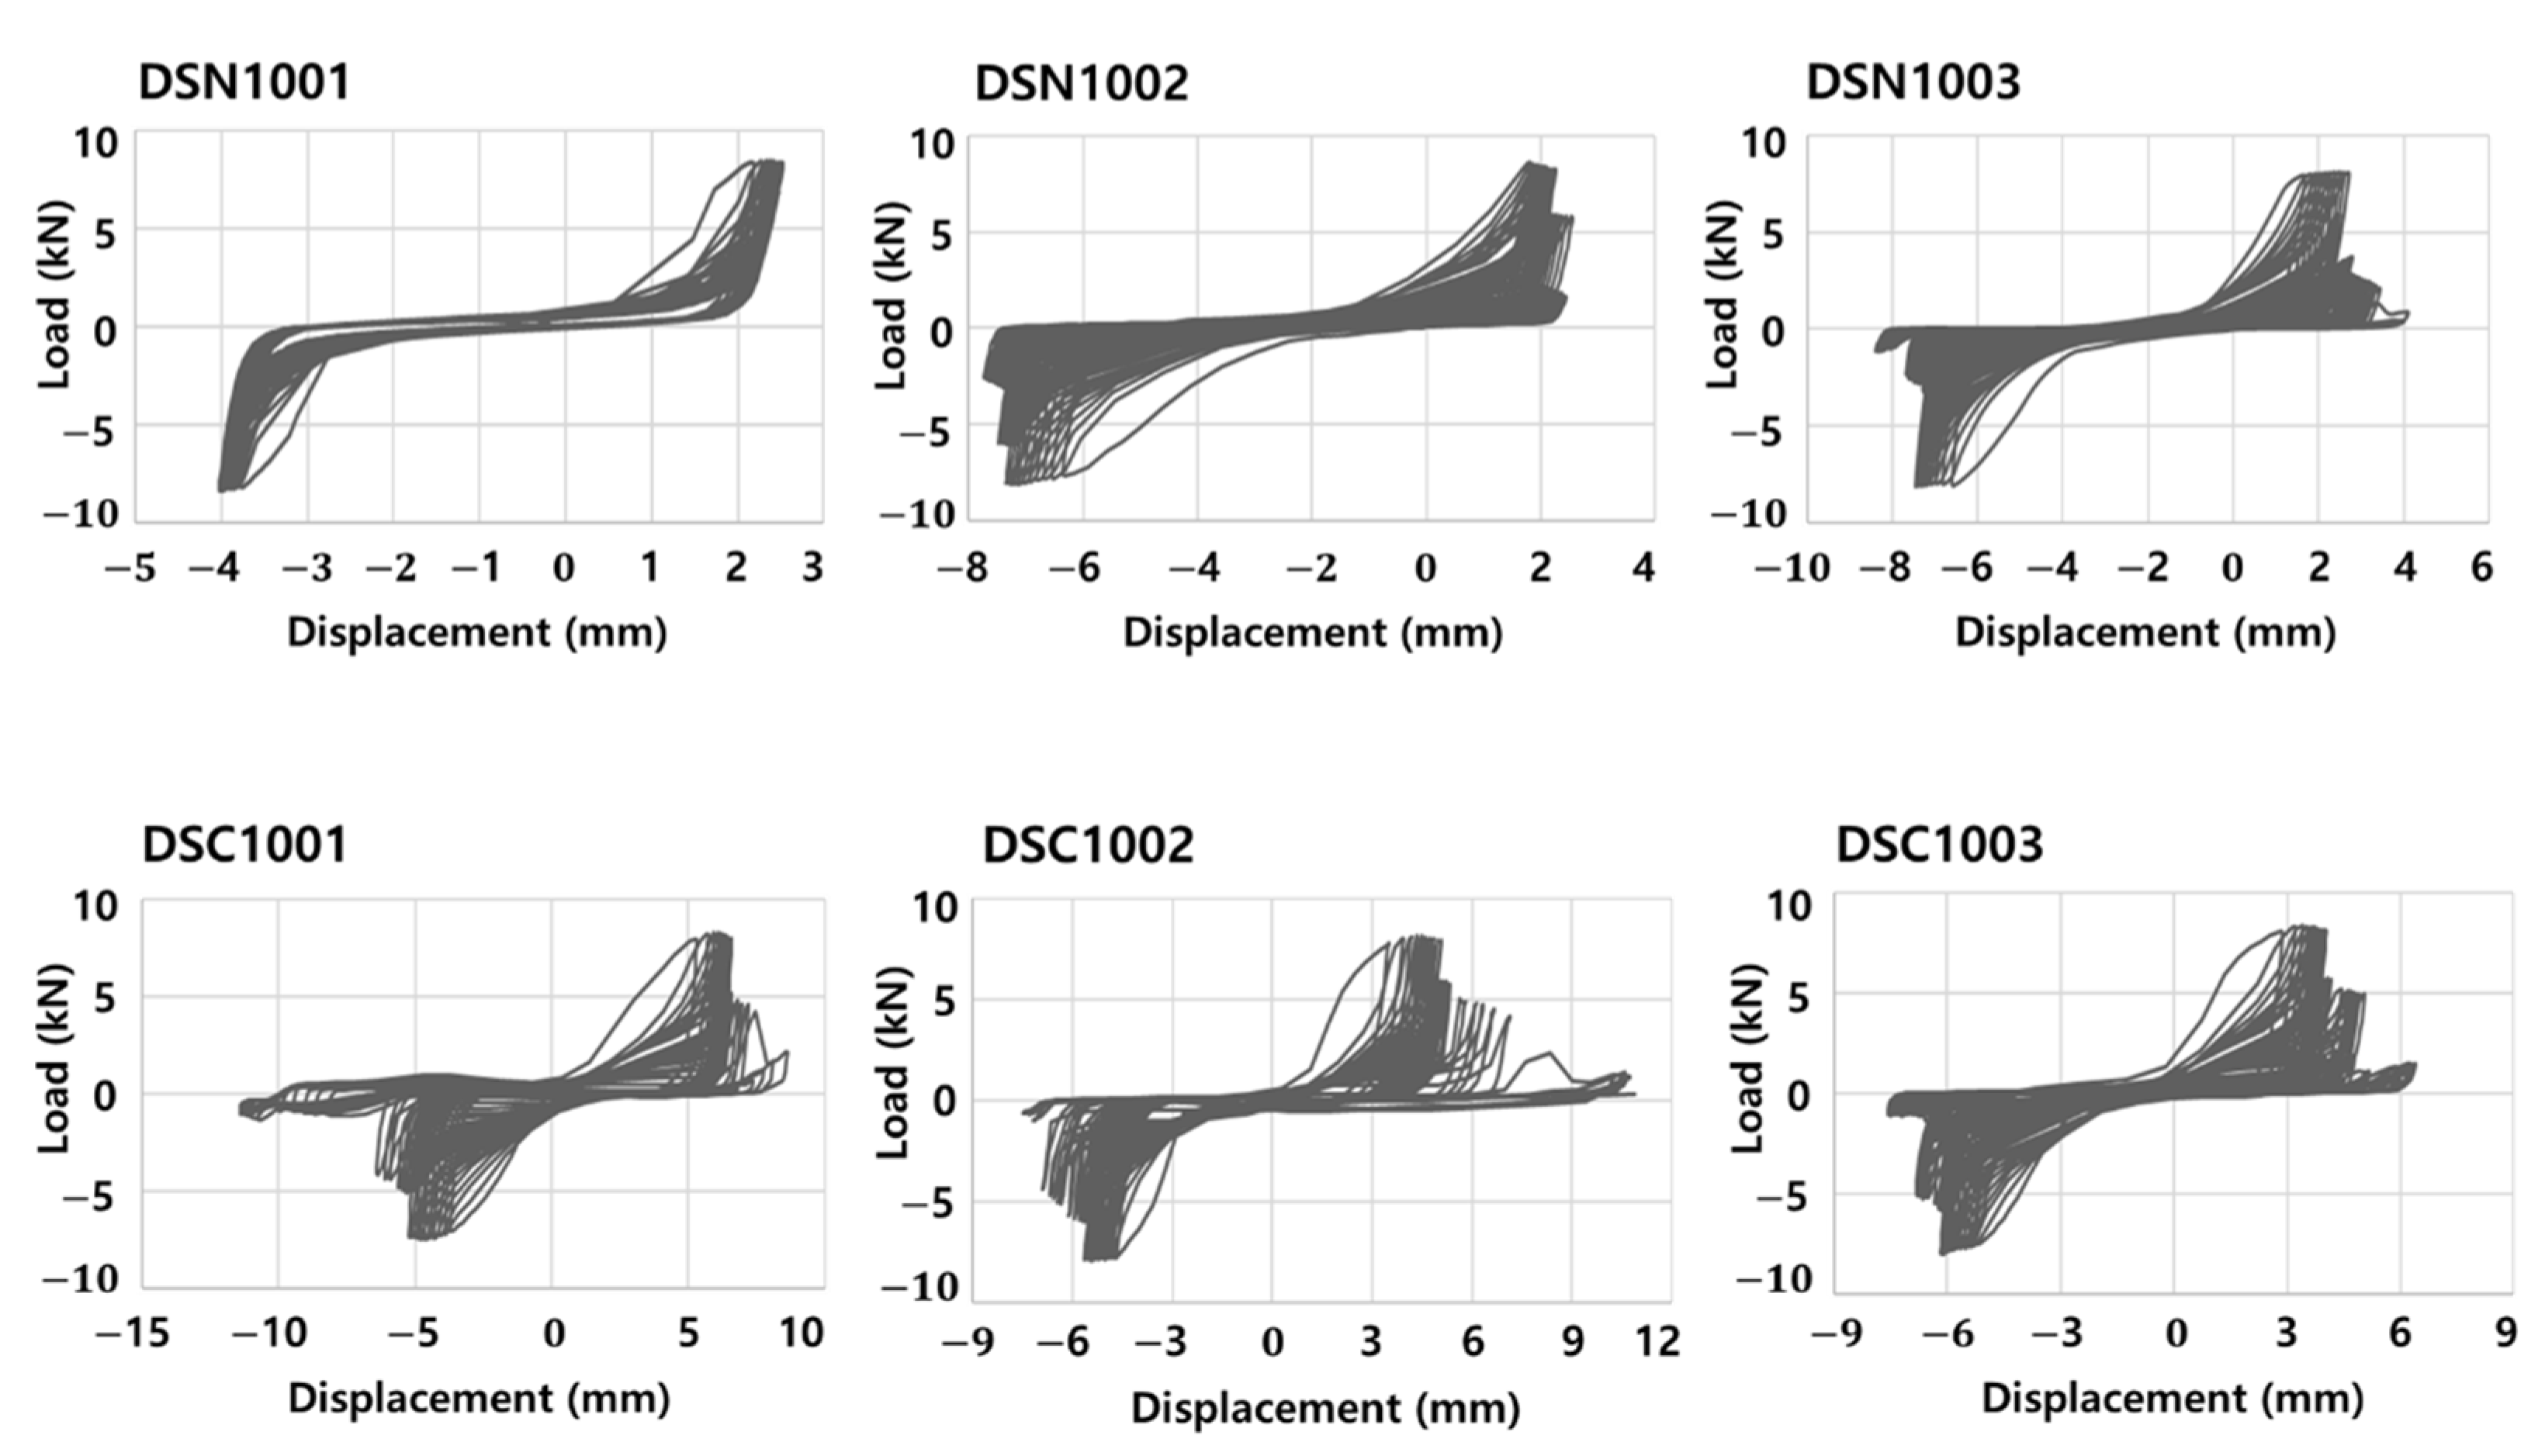
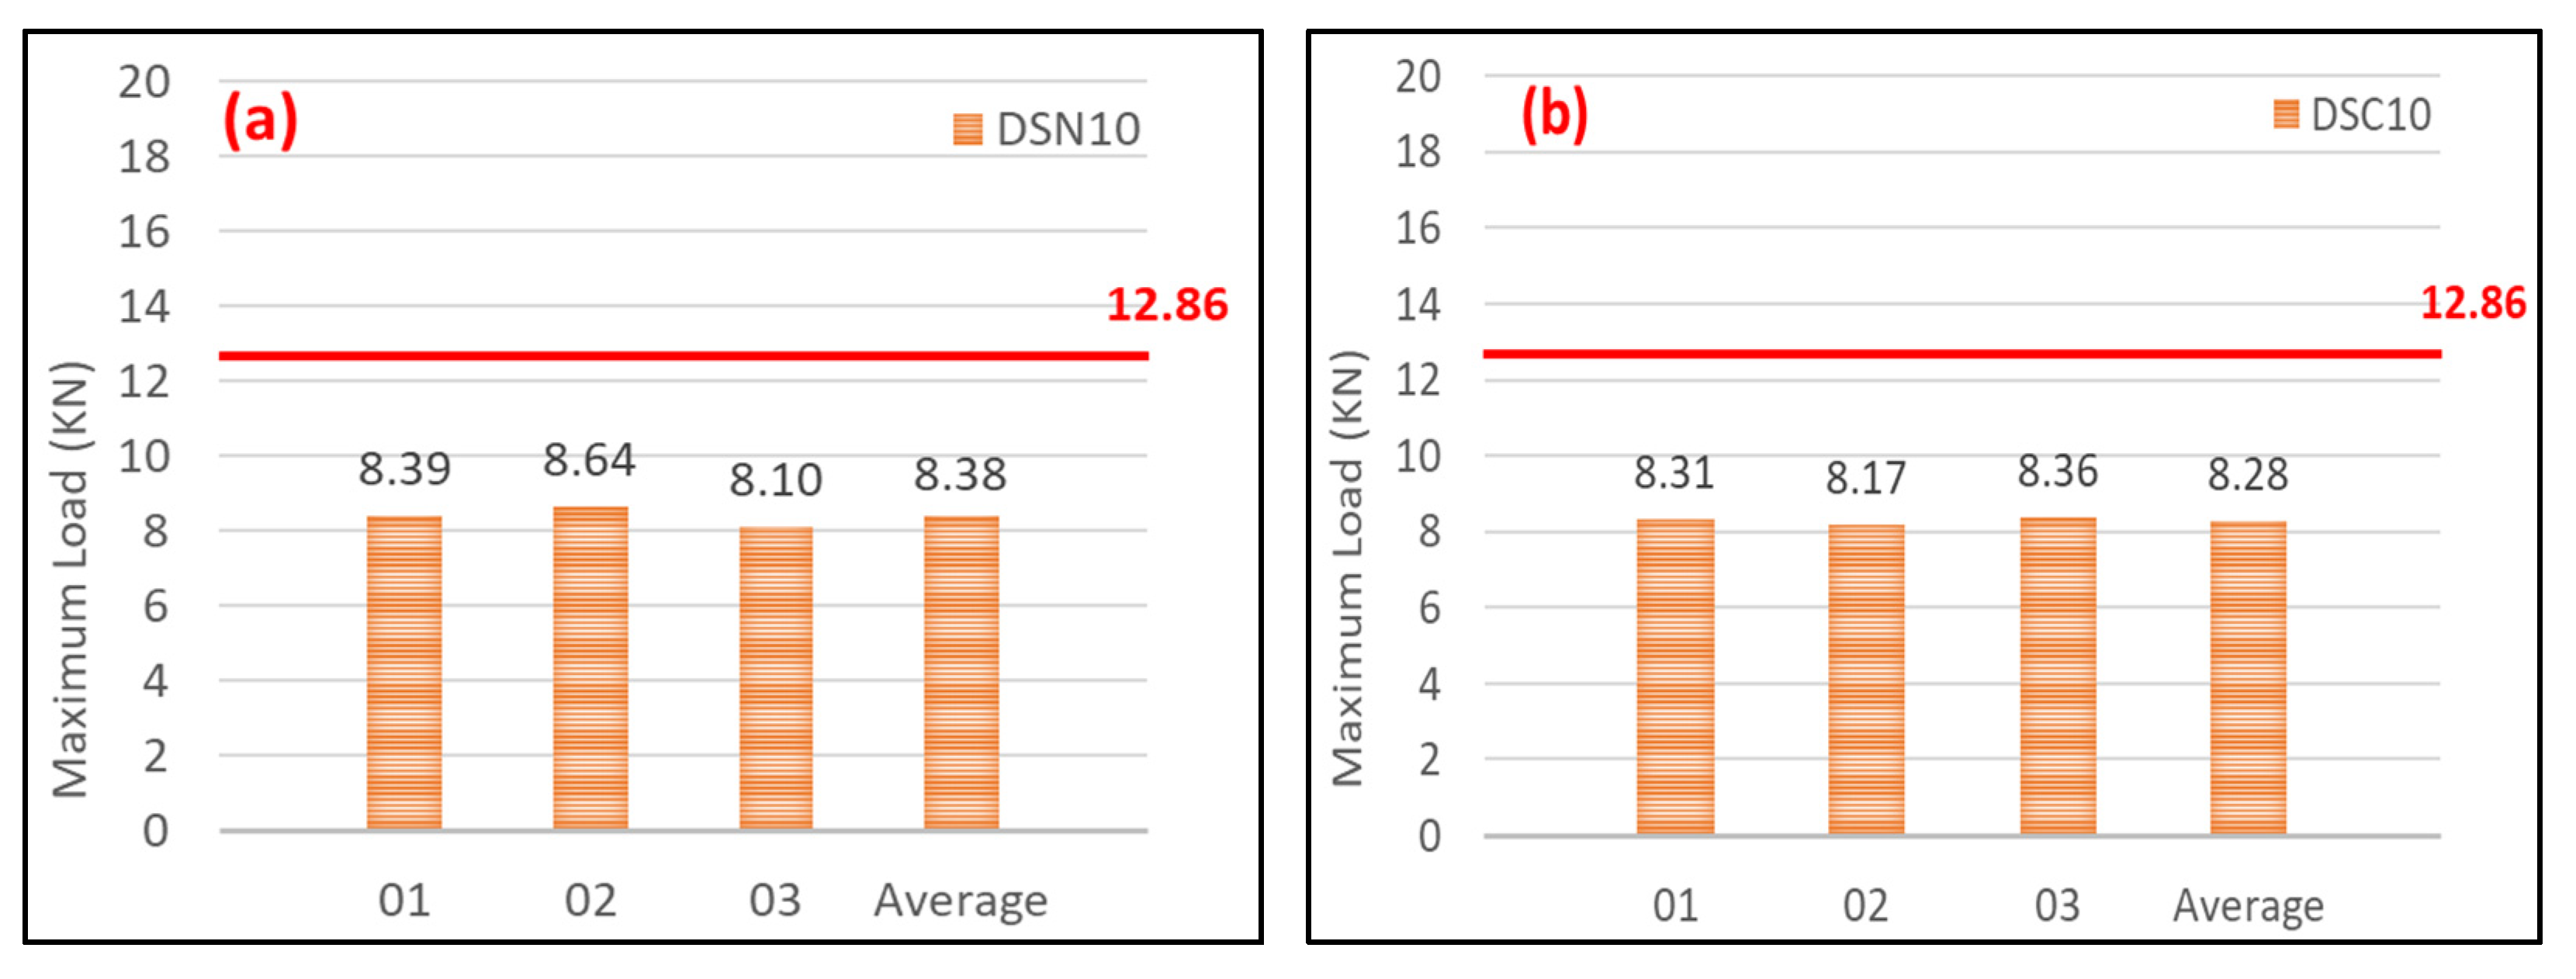
Figure 15 shows the load–displacement curves, and Figure 16 shows an average summary of the values for each case-specific dynamic shear test. As the figure shows, the dynamic shear performance of the M10 anchors does not meet the seismic performance verification criteria (horizontal lines) for both cracked and non-cracked concrete. Based on this, the anchors of M10 are not considered suitable for anchors of fixed parts.
  • DSN12 and DSC12
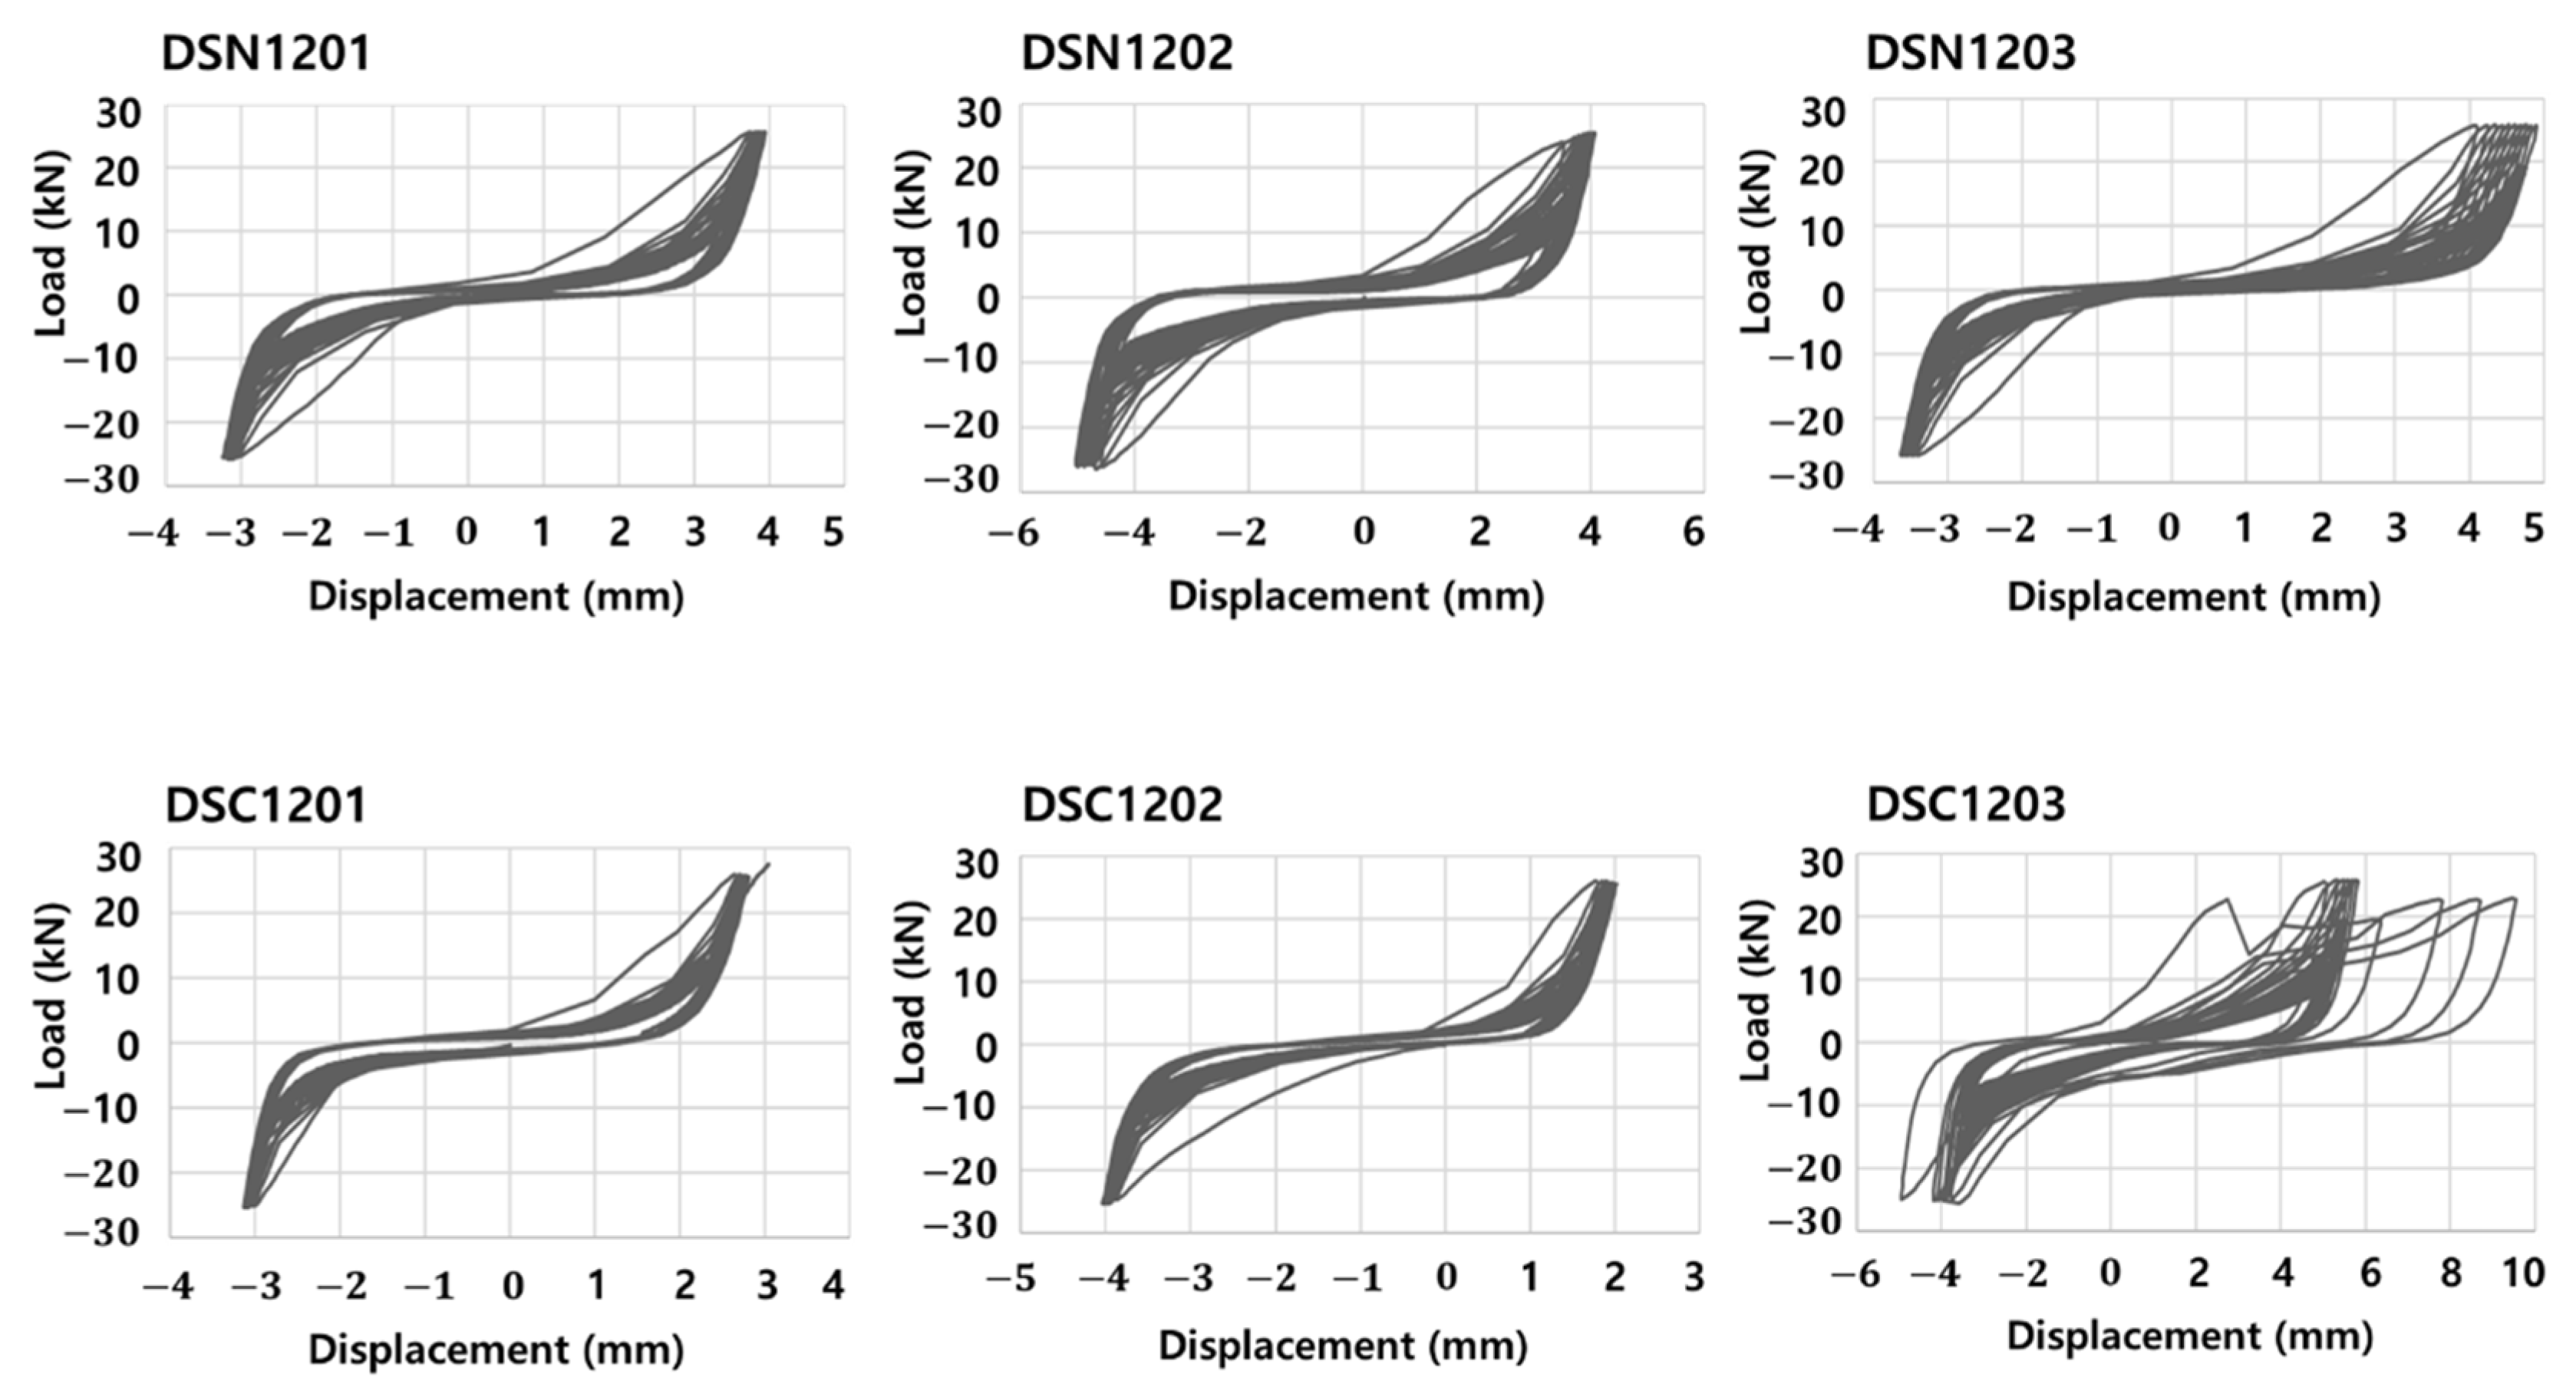
Figure 17 shows the load–displacement curves, and Figure 18 shows an average summary of the values for each case-specific dynamic shear test. As the figure shows, in the case of M12 anchors, unlike M10 anchors, both cracked and non-cracked concrete met the seismic performance verification criteria.

4.2.4. Pull-Out Performance Evaluation

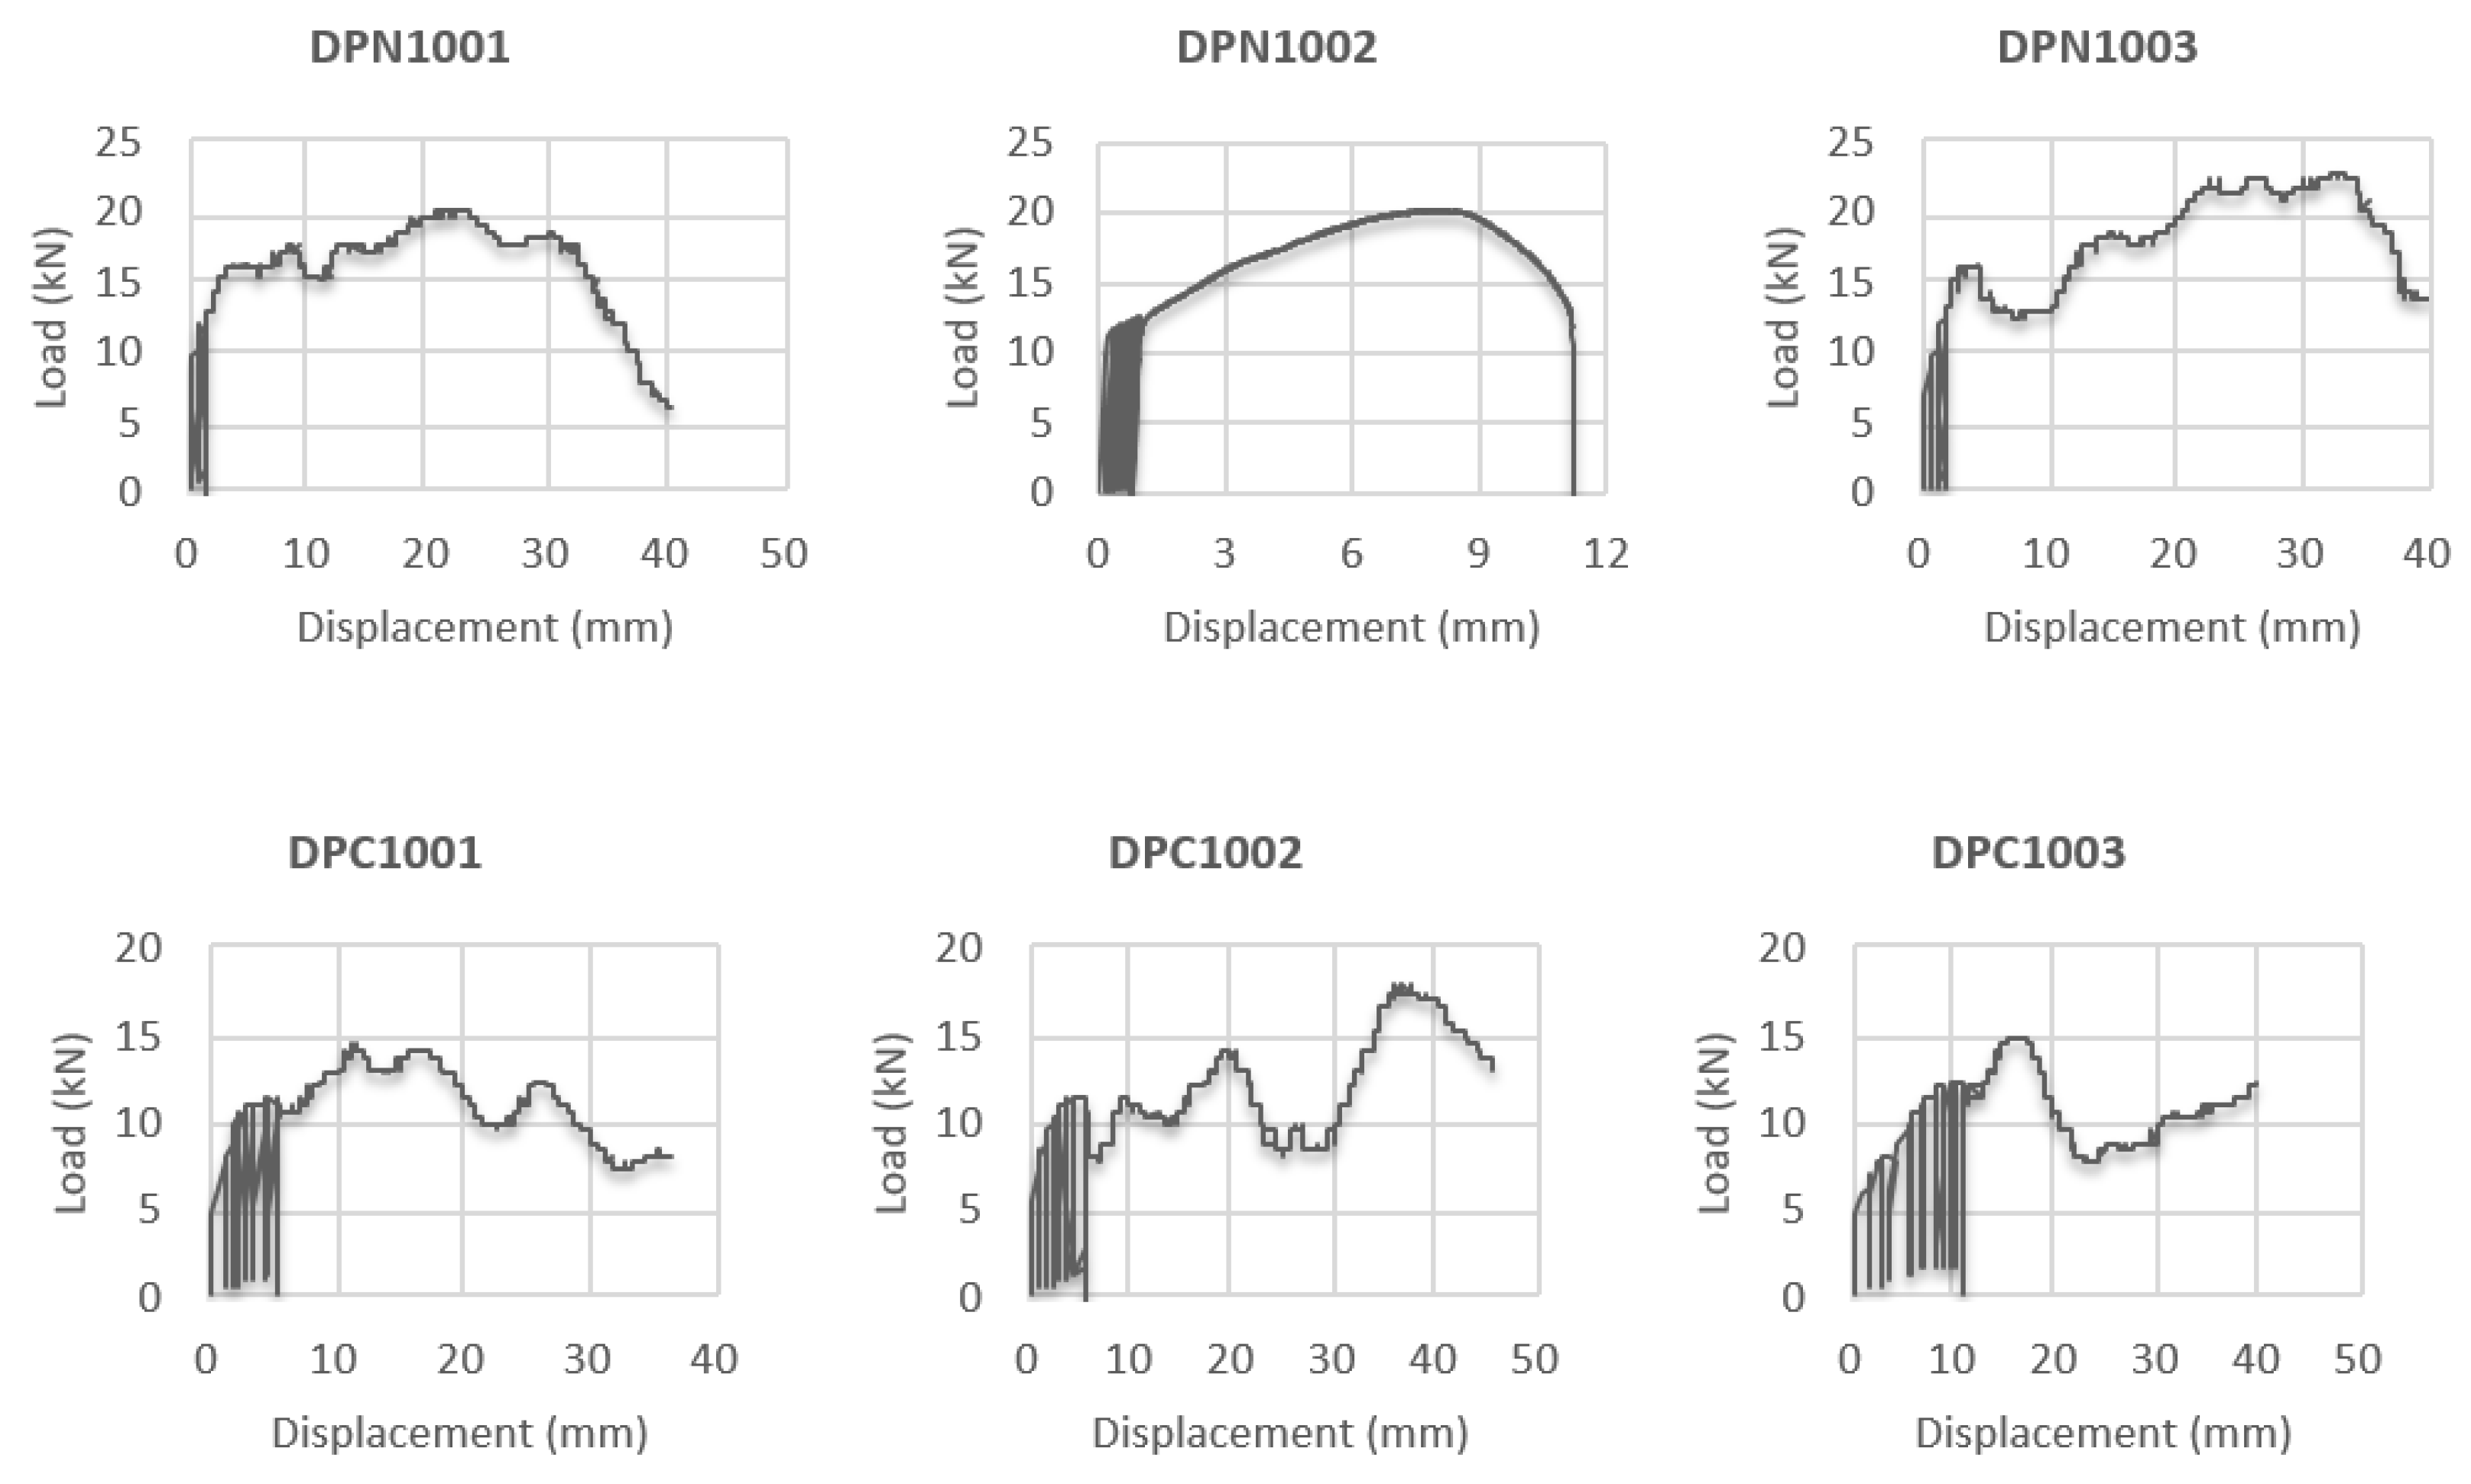
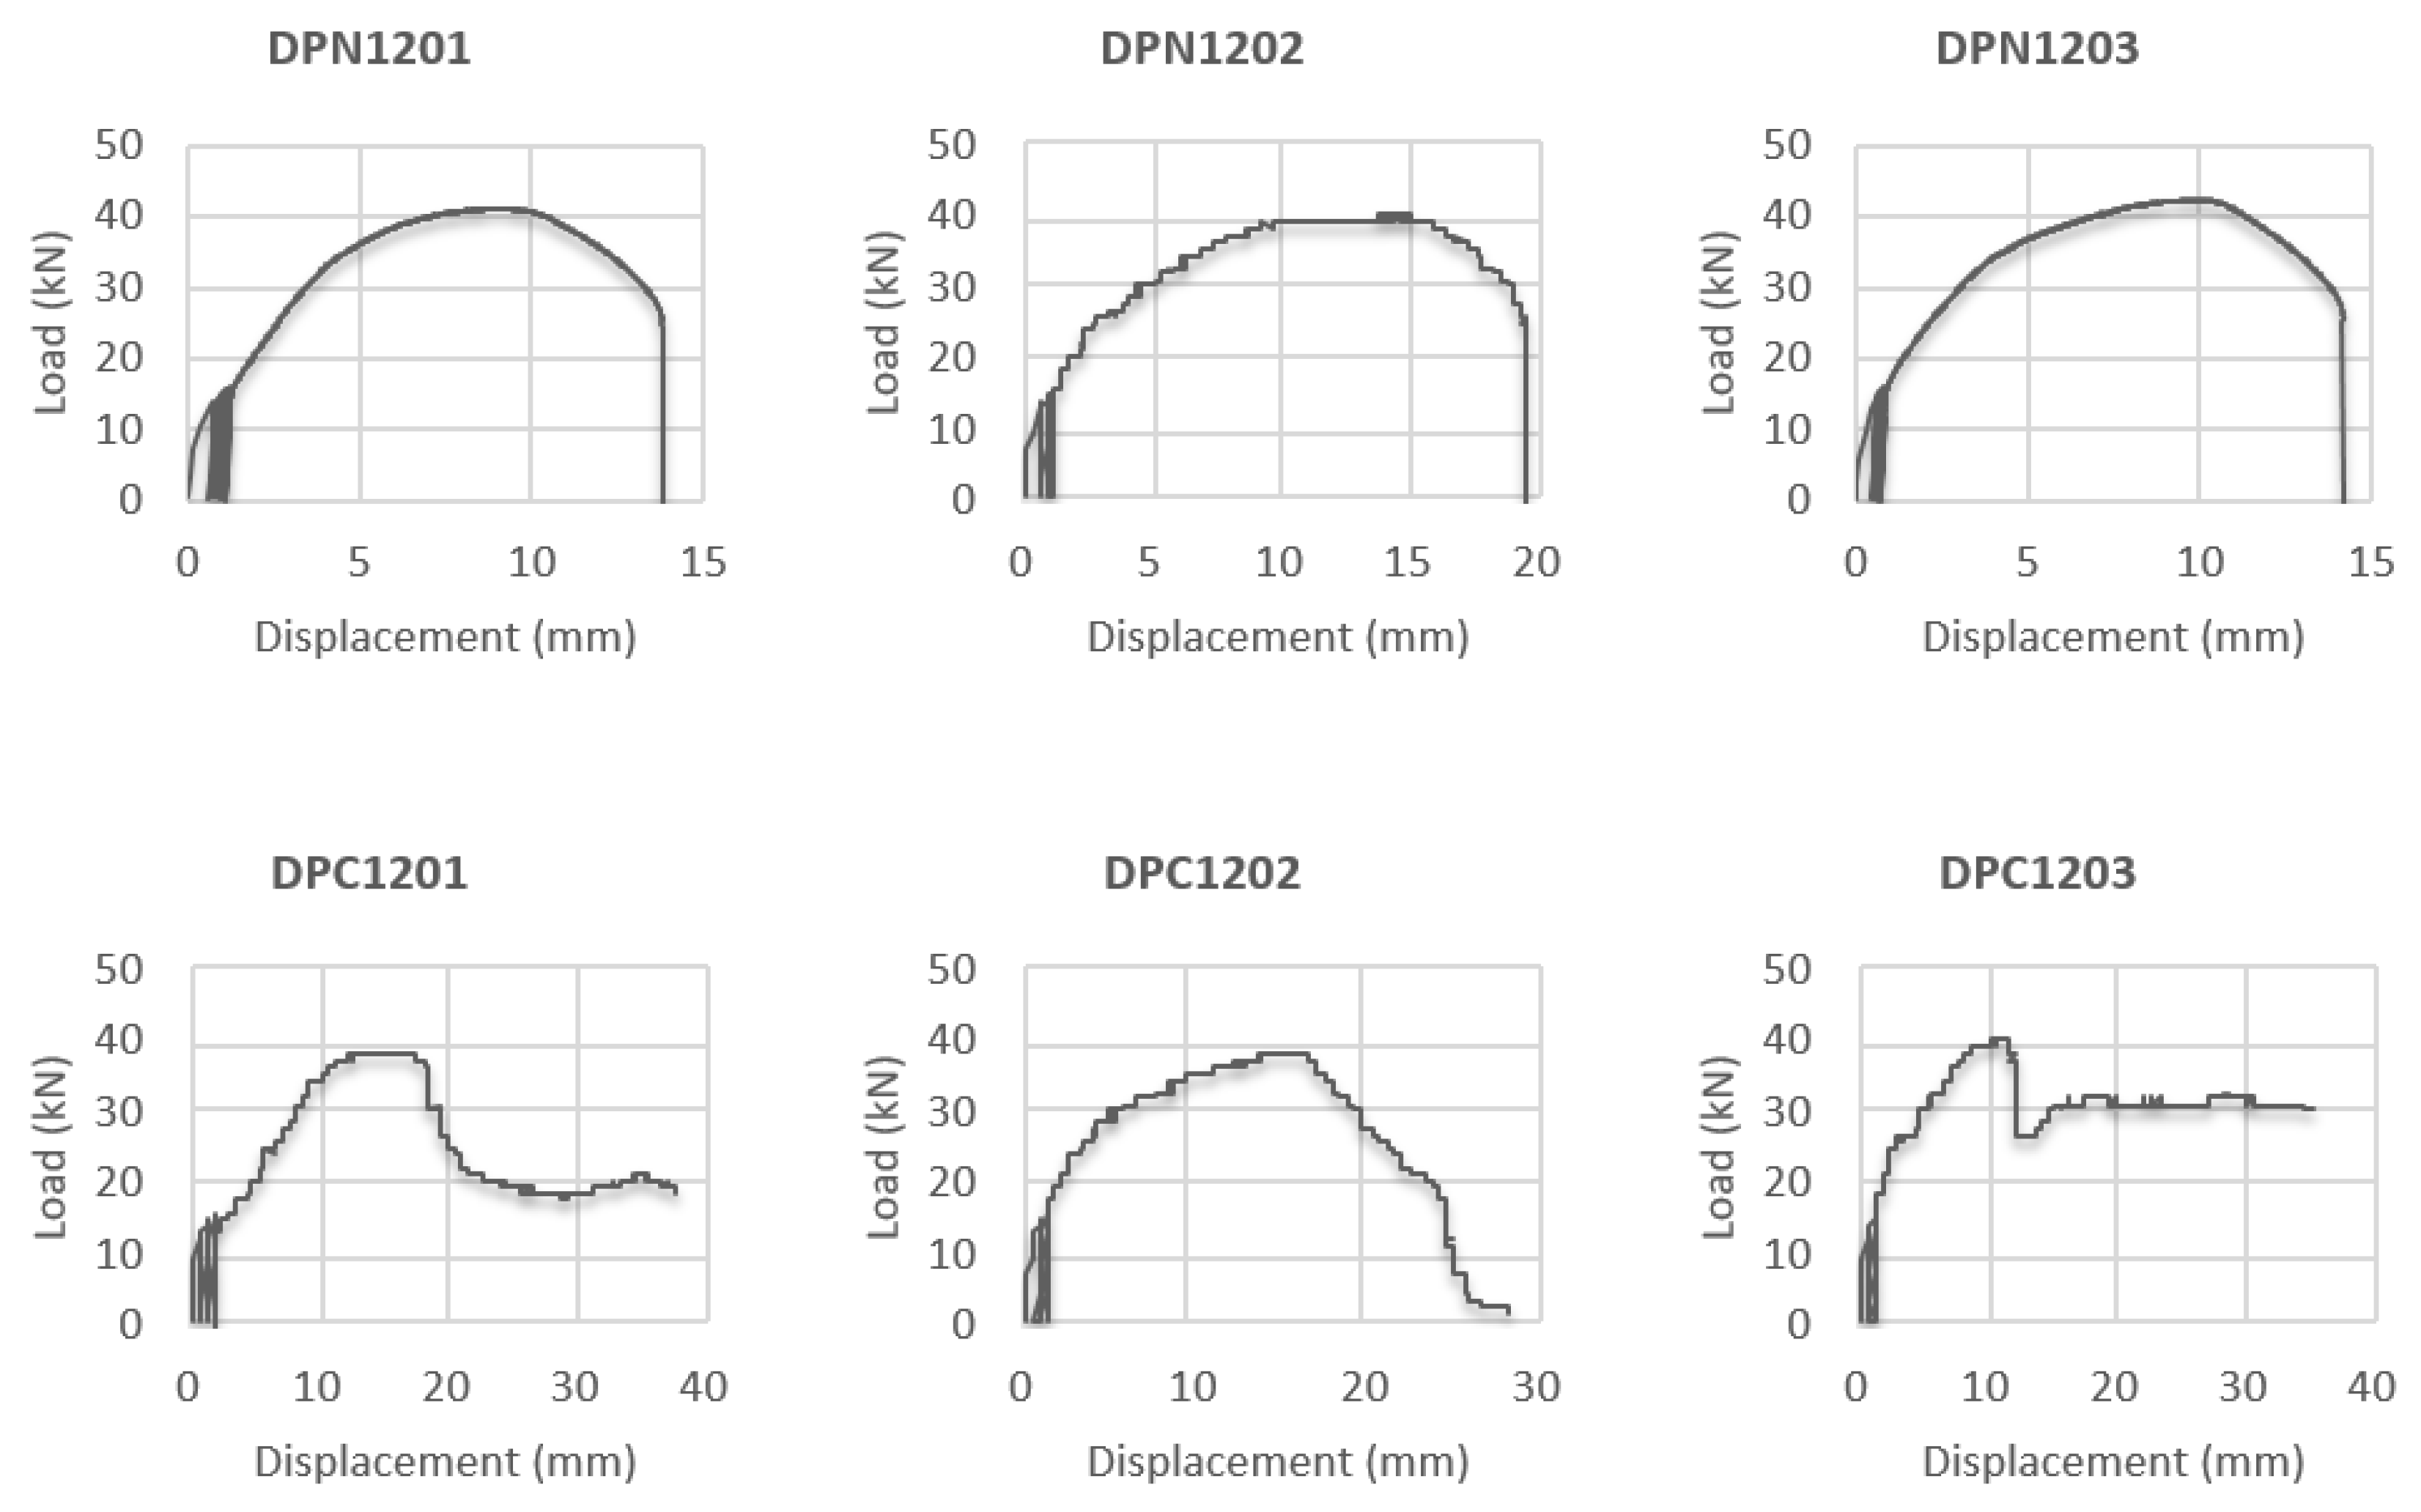
In the case of the M10 set anchor, a pull-out failure of the steel anchor occurred. The pull-out loads in the cracked concrete specimens were smaller than those in the non-cracked concrete specimens. In the case of the M12 set anchor, a concrete cone failure occurred as in the static pull-out tests. As with M10, the pull-out loads in the cracked concrete specimens were smaller than those in the non-cracked concrete specimens. It was found that the M10 set anchor exhibited a failure of the anchor itself before the concrete–anchor bond failure, owing to the relatively smaller diameter. When the maximum loads of the dynamic pull-out tests were compared with those of the static tests, the maximum pull-out loads under dynamic loads were found to be higher. This appears to be because the clearance between the concrete and the set anchor, which existed at the time of the set anchor installation, contributed to the concrete–anchor frictional force that was generated by vibration under the application of cyclic loading.
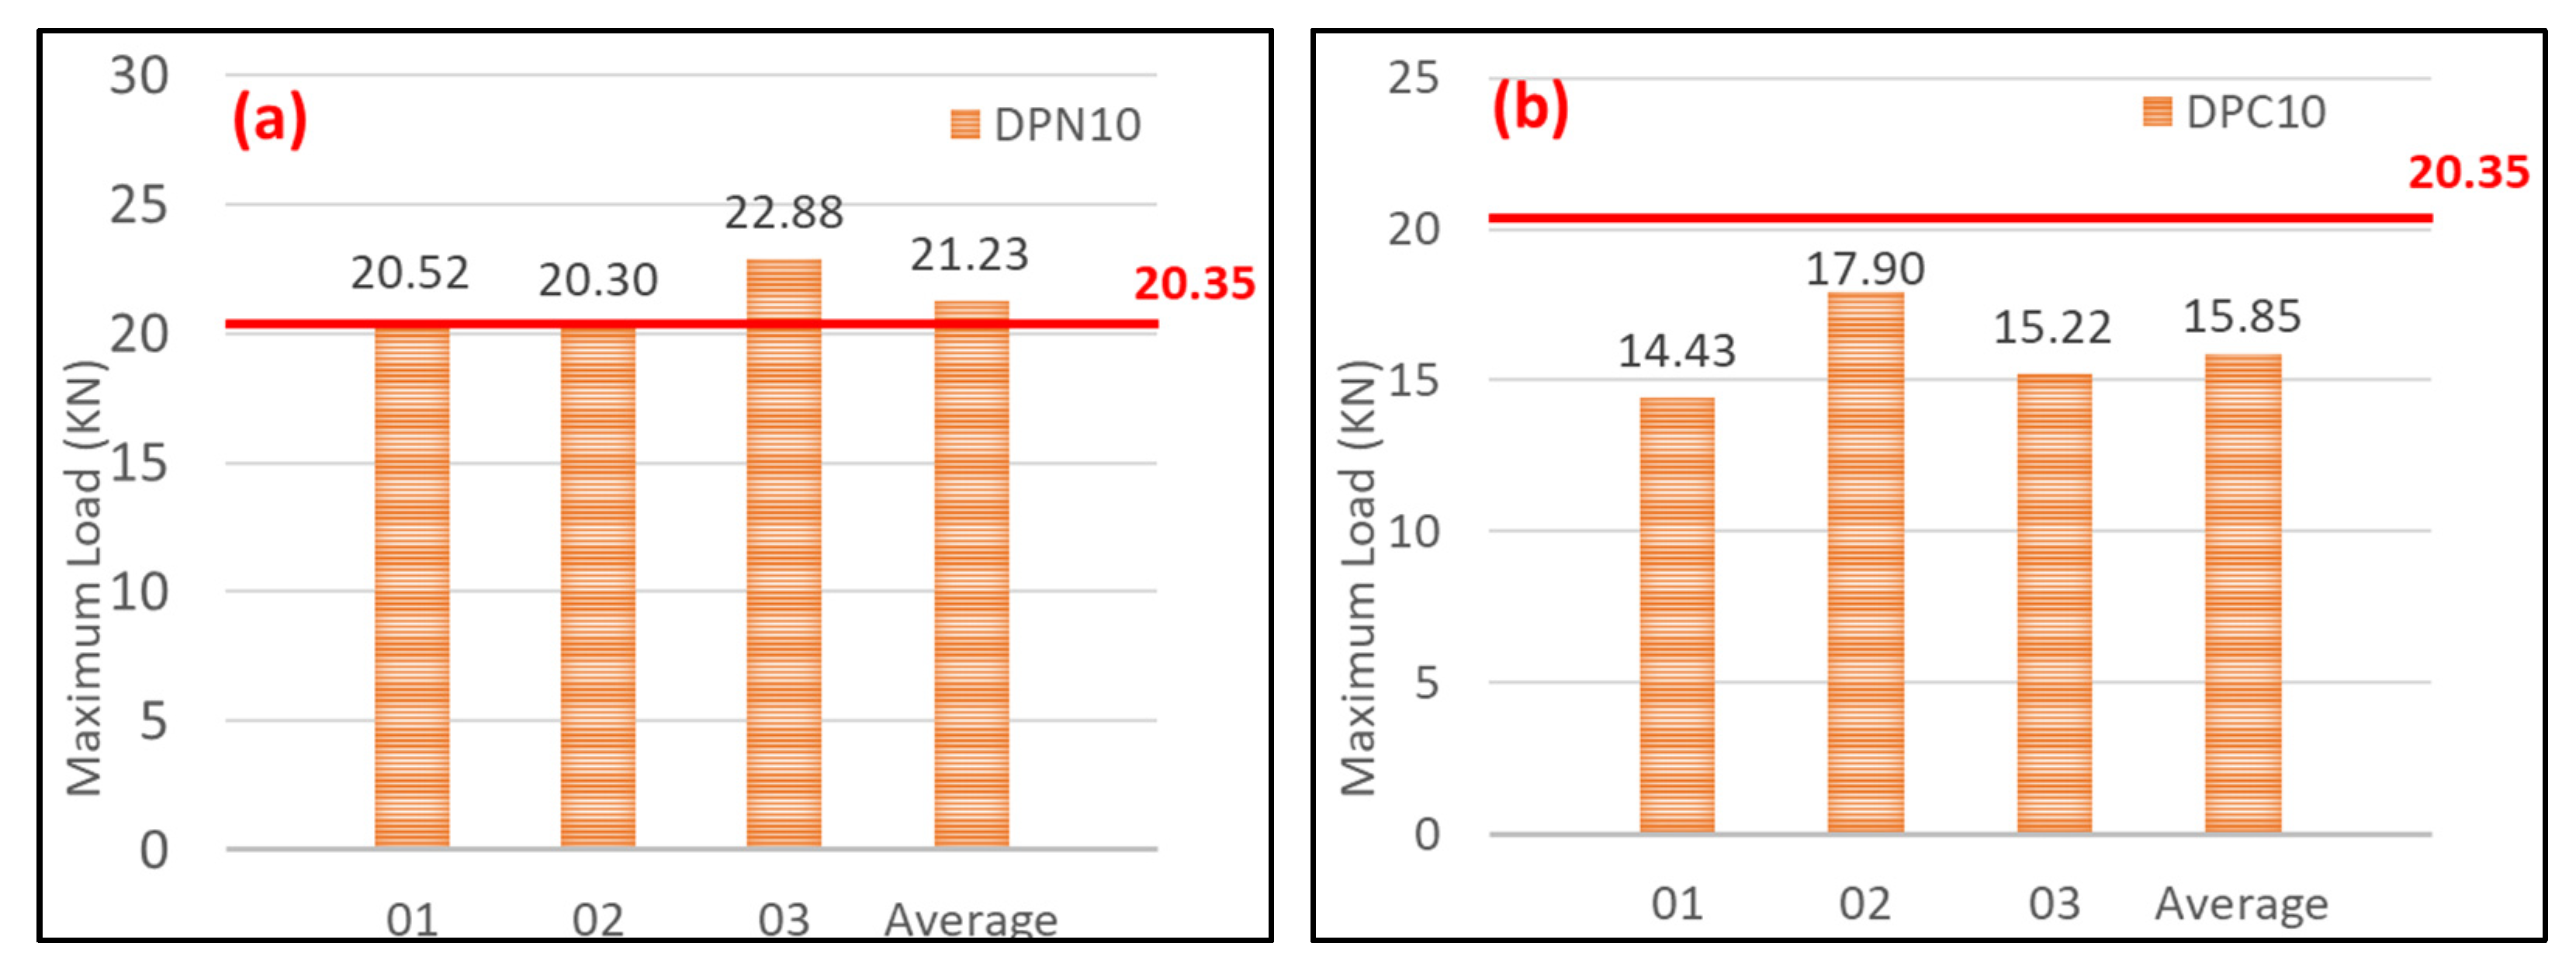
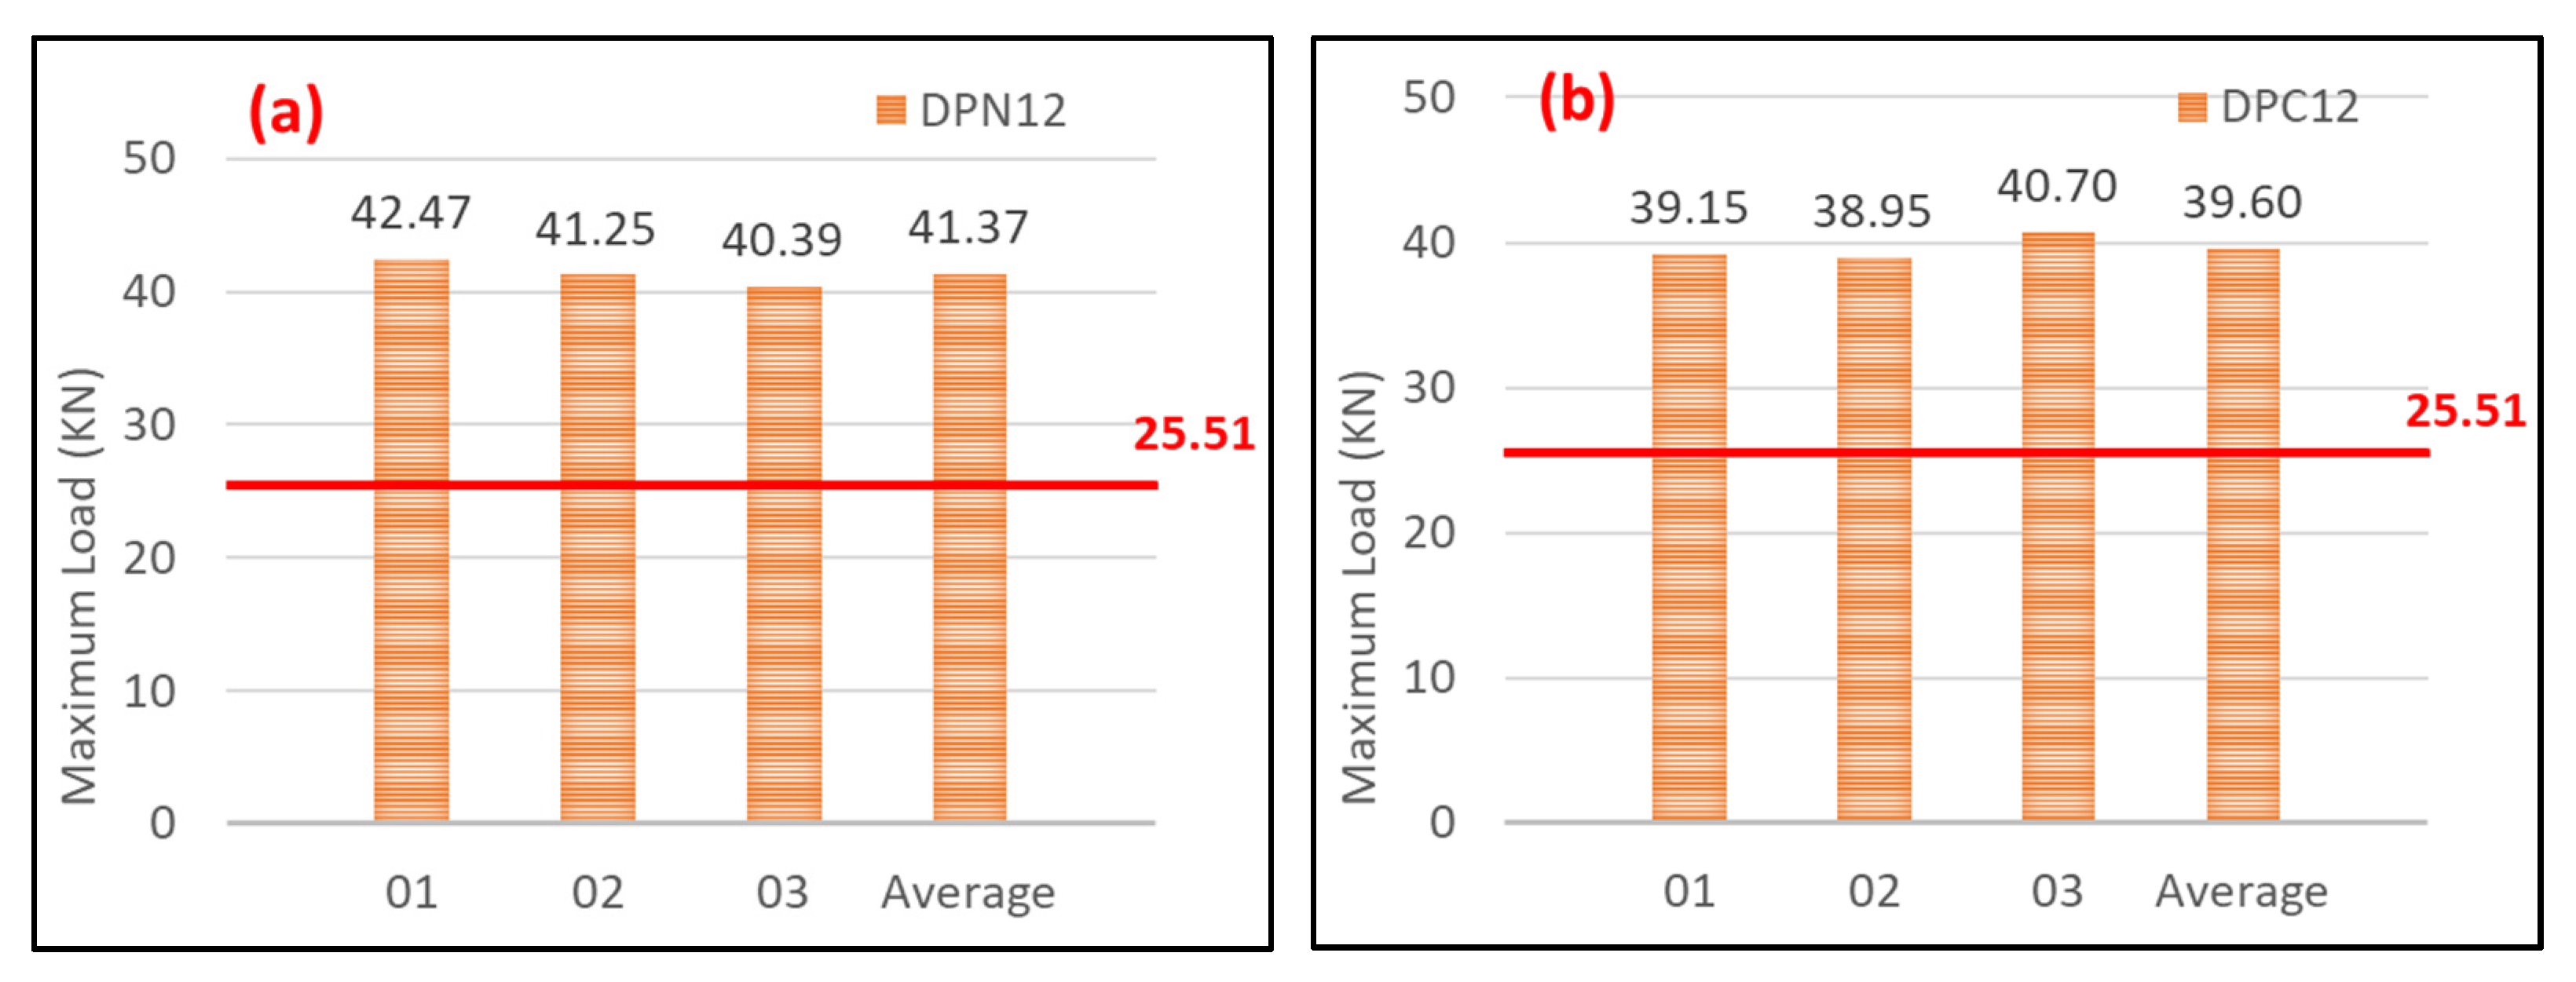
Table 9 summarizes whether the pull-out maximum loads generated during the tests met 80% of the static pull-out performance (seismic performance verification criterion).
  • DPN10 and DPC10
Figure 19 shows the load–displacement curves, and Figure 20 shows an average summary of the values for each case-specific dynamic pull-out test. As the figure shows, the dynamic pull-out performance of the M10 anchors does not met the seismic performance verification criteria (horizontal lines) for cracked concrete. Based on this, the set anchors of M10 are not considered suitable for anchors of fixed parts.
  • DPN12 and DPC12
Figure 21 shows the load–displacement curves, and Figure 22 shows an average summary of the values for each case-specific dynamic pull-out test. As shown in the figure, both cracked and non-cracked concrete met the seismic performance verification criteria for the M12 anchor, as shown in the M10 anchor.

5. Conclusions

In this research, a field study was conducted on the fixation unit of post-installed anchors used in operation and power generation facilities installed in domestic power plants. Based on the results, a static/dynamic performance evaluation was conducted to determine the safety evaluation guidelines that meet the domestic seismic performance requirements.
  • In this study, the average maximum loads of post-installed anchors were calculated by evaluating the static performance of two concrete types (non-cracked and cracked concrete), based on which a dynamic load protocol was presented. A dynamic performance evaluation was conducted using this protocol to evaluate the seismic safety of concrete-embedded anchor bolts.
  • The static shear test results of the M10 and M12 set anchors showed that steel failure occurred in both the cracked and non-cracked concrete. It appears that the anchor failure occurred before the load affected the concrete, owing to the sufficient bearing capacity of the concrete for the anchor bolt installed at the center of the concrete specimen and because of the concrete–anchor distance generated during the anchor installation.
  • In the static pull-out test results, the M10 set anchor exhibited an anchor steel failure in both the cracked and non-cracked concrete. The M12 set anchor showed a concrete cone failure by the concrete–anchor adhesive force, owing to its slightly increased diameter. As with the M10 set anchor, the maximum pull-out load in the cracked concrete specimens was smaller than that in the non-cracked concrete specimens, owing to a reduction in the concrete–anchor adhesive force.
  • In the dynamic shear test results of the M10 and M12 set anchors, both anchors exhibited steel failure. The M12 set anchor met the seismic performance verification criterion (80% of the static performance), but the M10 set anchor could not because its dynamic performance was reduced, owing to the cyclic loading.
  • The results of the dynamic pull-out test showed that the M10 anchor met the seismic performance verification criterion in a non-cracked state, i.e., at the time of installation, but could not meet the criterion when cracks occurred, owing to aging and other loads. In the case of the M12 set anchor, the maximum pull-out loads under dynamic loads were found to be higher than those of the static tests. This appears to be because the clearance between the concrete and the set anchor, which existed at the time of the set anchor installation, contributed to the concrete–anchor frictional force generated by vibrations under the application of cyclic loading.
Because this was an experimental study, it will be necessary in the future to additionally conduct analytical research to verify the reliability and applied parameters of the experiment.

Author Contributions

Conceptualization, S.L. and W.J.; methodology, S.L.; software, S.L.; validation, S.L. and W.J.; formal analysis, S.L.; investigation, S.L.; resources, S.L.; data curation, S.L.; writing—original draft preparation, S.L.; writing—review and editing, S.L., and W.J. All authors have read and agreed to the published version of the manuscript.

Funding

This research was funded by the power plant research program (21IFIP-B128598-05) funded by the Ministry of Land, Infrastructure, and Transport.

Institutional Review Board Statement

Not applicable.

Informed Consent Statement

Not applicable.

Data Availability Statement

Not applicable.

Conflicts of Interest

The authors declare no conflict of interest.

References

  1. Jung, W.; Kwon, M.; Kim, J.; Ju, B. Performance Evaluation of the Post-Installed Anchor for Sign Structure. Int. J. Civ. Environ. Eng. 2012, 6, 1097–1102. [Google Scholar]
  2. Lee, S.M.; Jung, W.Y. Evaluation of anchorage performance of the switchboard cabinet under seismic loading condition. Adv. Mech. Eng. 2020, 12, 1687814020926309. [Google Scholar] [CrossRef]
  3. Reducing the Risks of Nonstructural Earthquake Damage—A Practical Guide; FEMA E-74; FEMA: Washington, DC, USA, 2012.
  4. Oh, S.H.; Park, H.Y.; Choi, K.K. Seismic Damage Status and Characteristics of Non-structural Elements. Korean Soc. Noise Vib. Eng. 2018, 28, 71–77. [Google Scholar]
  5. Park, Y.M.; Jeon, M.; Lee, K.J.; Kim, C.H. A Study on the Concrete Breakout Capacity Evaluation of Medium-to-Large size CIP Anchor Bolts under Tension Loading. J. Korean Soc. Steel Constr. 2011, 23, 493–501. [Google Scholar]
  6. Building Code Requirements for Structural Concrete (ACI 318-11) and Commentary; ACI Committee 318; ACI: Farmington Hills, MI, USA, 2011; 503p.
  7. Jang, J.B.; Suh, Y.P.; Lee, J.R. A Study on the Evaluation of Concrete Breakout Strength for Cast-In-Place Anchor with Crack. J. Korean Soc. Civ. Eng. 2004, 24, 647–652. [Google Scholar]
  8. Park, Y.M.; Ju, H.J.; Kim, D.H.; Kang, M.K.; Lee, J.H. Static Shear Resistance of Cast-In-Place Anchors in Cracked Concrete. J. Korean Soc. Steel Constr. 2015, 27, 87–97. [Google Scholar] [CrossRef]
  9. Evaluating the Performance of Post-Installed Mechanical Anchors in Concrete, Reported by ACI Committee 355; ACI 355.2-01; ACI: Farmington Hills, MI, USA, 2002.
  10. Mahrenholtz, C.; Eligehausen, R.; Hutchinson, T.C.; Hoehler, M.S. Behavior of post-installed anchors tested by stepwise increasing cyclic crack protocols. ACI Struct. J. 2017, 114, 623. [Google Scholar] [CrossRef]
  11. Post-Installed Fasteners in Concrete under Seismic Action; EOTA TR 049; EOTA: Brussels, Belgium, 2016.
  12. Kim, S.-Y.; Yu, C.-S.; Yoon, Y.-S. Sleeve-type expansion anchor behavior in cracked and uncracked concrete. Nucl. Eng. Des. 2004, 228, 273–281. [Google Scholar] [CrossRef] [Green Version]
  13. Standard Test Methods for Strength of Anchors in Concrete and Masonry Elements; ASTM E 488-96; ASTM: West Conshohocken, PA, USA, 2003.
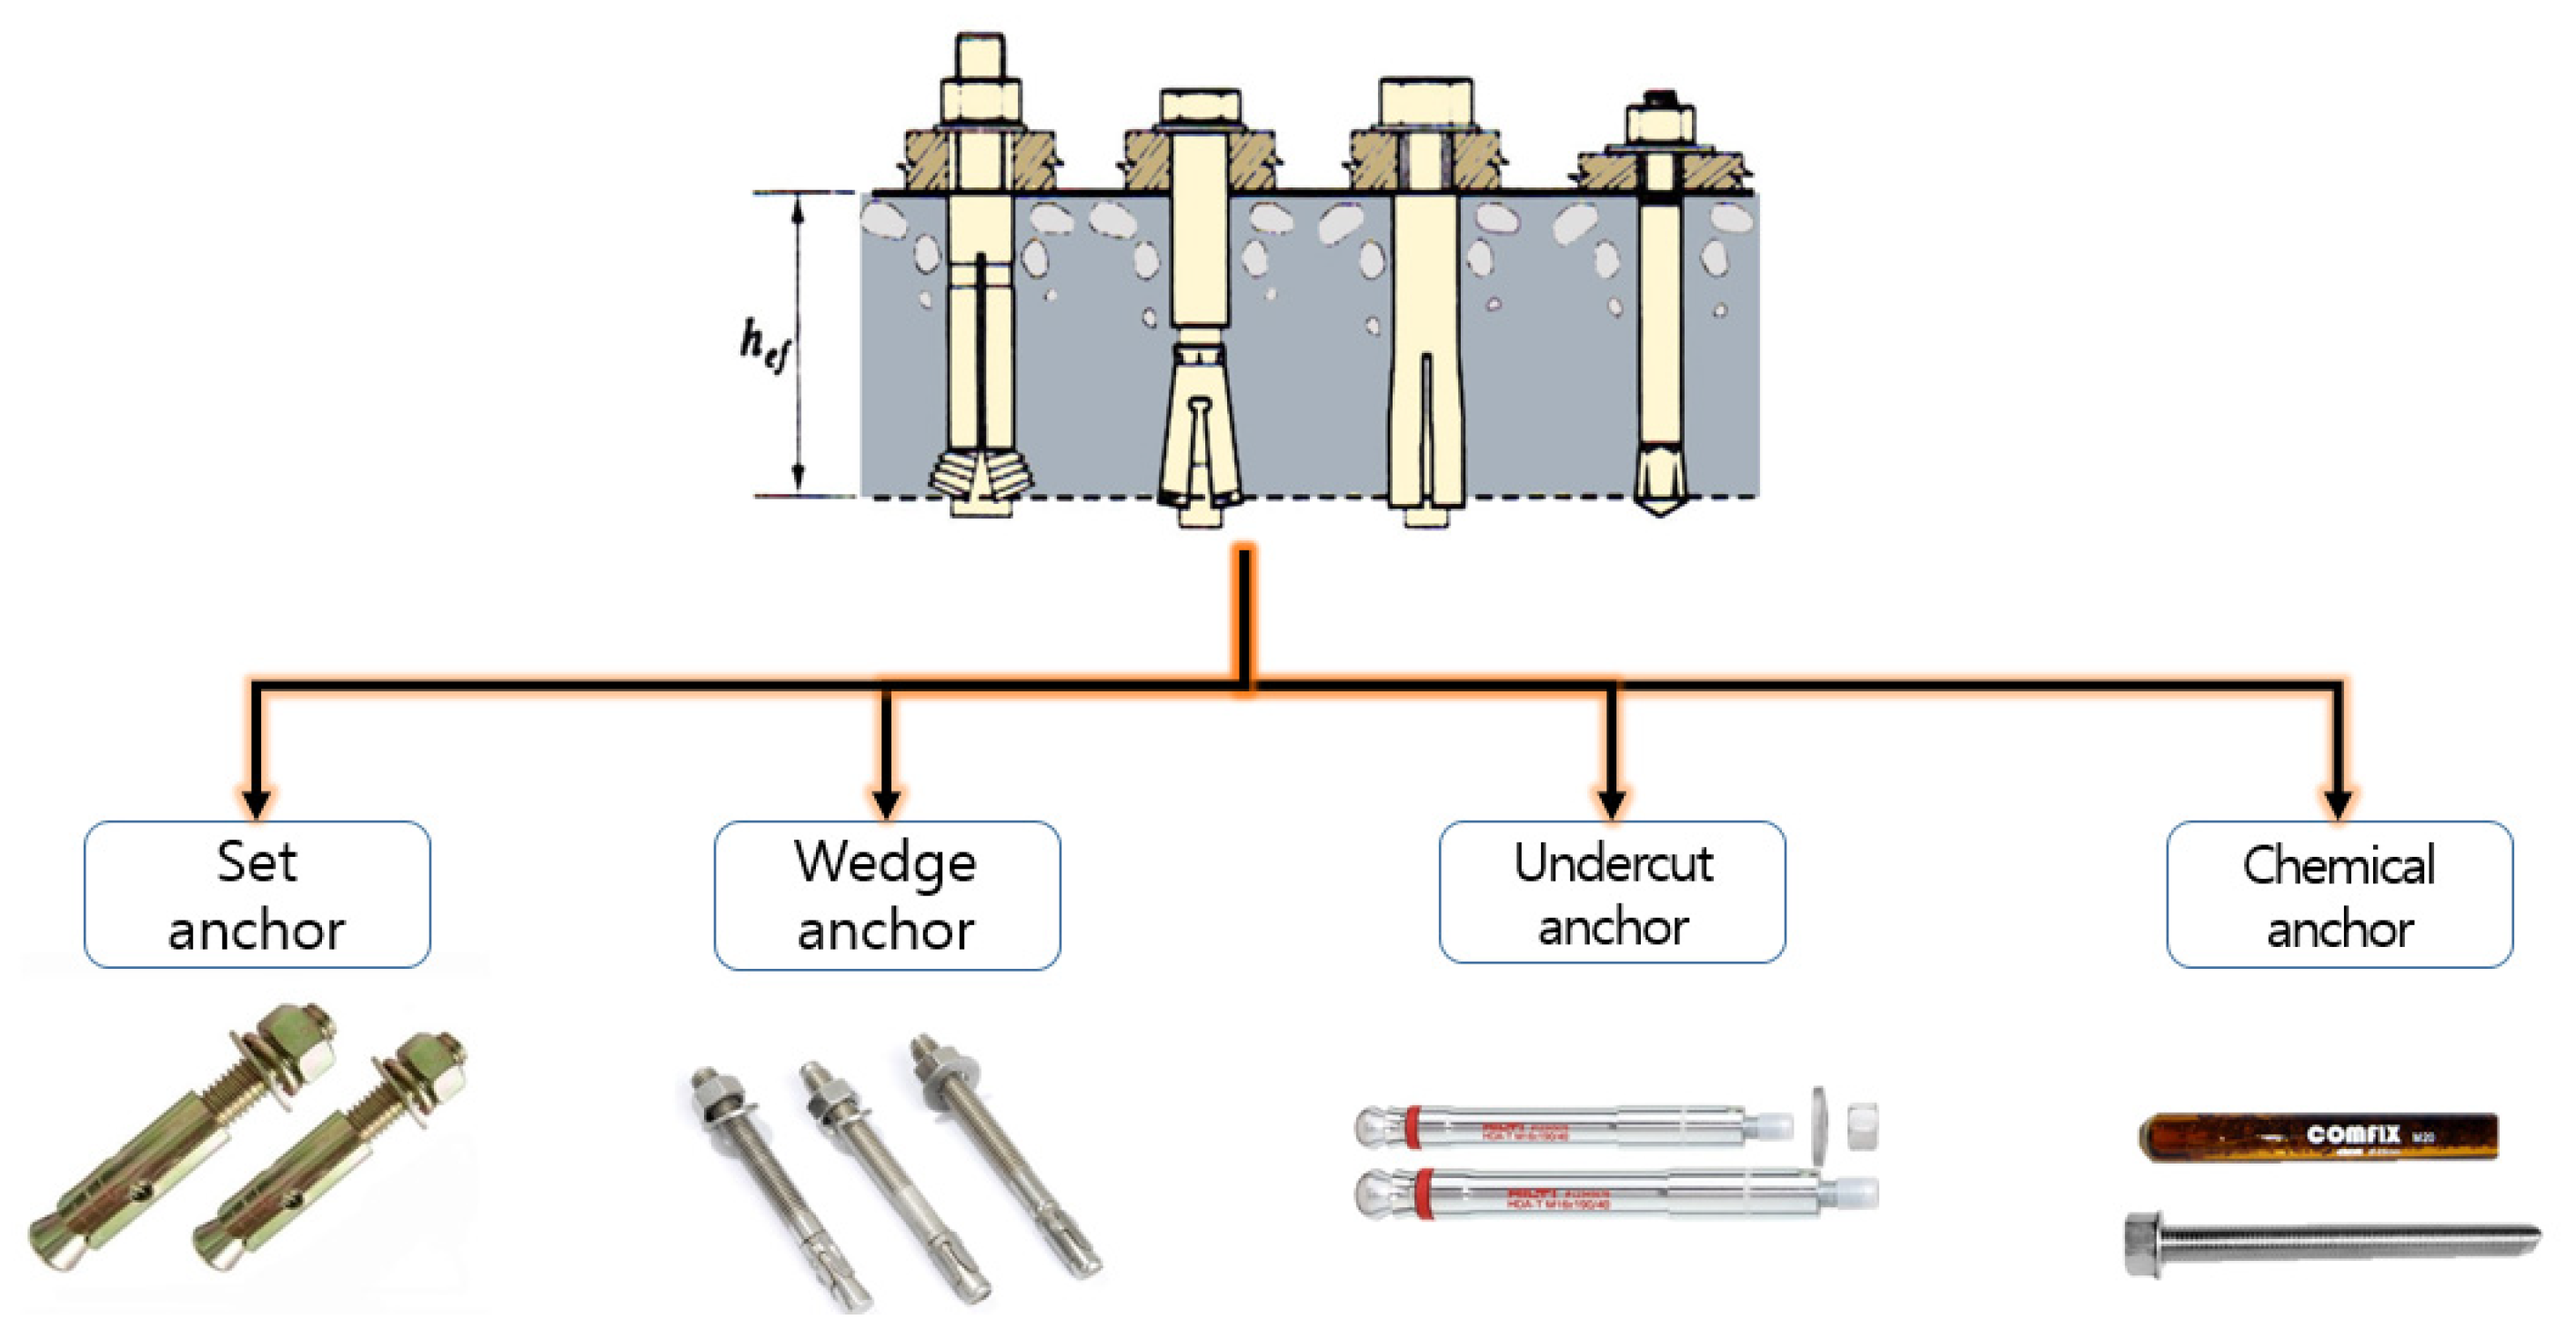
Figure 1. Typical post-installed anchors.
Applsci 11 03488 g001
Figure 2. Condition of concrete under cracking: (a) stress concentration around the anchor hole; (b) stress in concrete induced by the anchor expansion or by the load acting on the anchor; (c) stress distribution in non-cracked concrete; (d) stress distribution in cracked concrete.
Applsci 11 03488 g002
Figure 3. Number of cycles in loading pattern according to American Concrete Institute (ACI) 355.2 and TR 049: (a) pull-out force; (b) shear force. (Unit: mm)
Applsci 11 03488 g003
Figure 4. Field survey for an anchorage in power plant: (a) Gas Circuit Breaker (GCB) cabinet; (b) governor cabinet; (c) main control cabinet.
Applsci 11 03488 g004
Figure 5. Post-installed anchors applied to experiments.
Applsci 11 03488 g005
Figure 6. Schematics of concrete specimen (Unit: mm).
Applsci 11 03488 g006
Figure 7. Process of making concrete specimens.
Applsci 11 03488 g007
Figure 8. Test setup for performance evaluation of static loading: (a) shear tests; (b) pull-out tests.
Applsci 11 03488 g008
Figure 9. Failure mode for static shear tests: (a) M10 set anchor; (b) M12 set anchor.
Applsci 11 03488 g009
Figure 10. Comparison of results of shear tests: (a) M10 set anchor; (b) M12 set anchor.
Applsci 11 03488 g010
Figure 11. Failure mode for static pull-out tests: (a) M10 set anchor; (b) M12 set anchor.
Applsci 11 03488 g011
Figure 12. Comparison of results of pull-out tests: (a) M10 set anchor; (b) M12 set anchor.
Applsci 11 03488 g012
Figure 13. Load protocol shape of M10 set anchor: pull-out and shear dynamic force.
Applsci 11 03488 g013
Figure 14. Load protocol shape of M12 set anchor: pull-out and shear dynamic force.
Applsci 11 03488 g014
Figure 15. Load–displacement curve of dynamic shear tests for M10 anchors.
Applsci 11 03488 g015
Figure 16. Comparison results of the dynamic shear tests for M10 anchors: (a) non-cracked concrete; (b) cracked concrete.
Applsci 11 03488 g016
Figure 17. Load–displacement curve of dynamic shear tests for M12 anchors.
Applsci 11 03488 g017
Figure 18. Comparison results of the dynamic shear tests for M12 anchors: (a) non-cracked concrete; (b) cracked concrete.
Applsci 11 03488 g018
Figure 19. Load–displacement curve of dynamic pull-out tests for M10 anchors.
Applsci 11 03488 g019
Figure 20. Comparison results of the dynamic pull-out tests for M10 anchors: (a) non-cracked concrete; (b) cracked concrete.
Applsci 11 03488 g020
Figure 21. Load–displacement curve of dynamic pull-out tests for M12 anchors.
Applsci 11 03488 g021
Figure 22. Comparison results of the dynamic pull-out tests for M12 anchors: (a) non-cracked concrete; (b) cracked concrete.
Applsci 11 03488 g022
Table 1. Failure mode of anchor bolt subjected to strength.
DivisionTensile StrengthShear Strength
Steel FailureNsaVsa
PulloutNpn
Side-Face BlowoutNsb
Concrete BreakoutNcbVcb
Concrete Splitting
Concrete Pryout Vcp
Table 2. Post-installed anchor specifications.
DivisionDiameter
(mm)
Length
(mm)
Embedded Depth
(mm)
AnchorΦ10250100
Φ12250100
Table 3. Test specimens and parameters for static loading test.
Specimen NameTest MethodRemark
(Specimen Test Classification)
SSN1001–03T-01Test No. 01 to 03 (static_shear_non-cracked_10Ø)
SSC1001–03Test No. 01 to 03 (static_shear_cracked_10Ø)
SSN1201–03Test No. 01 to 03 (static_shear_non-cracked_12Ø)
SSC1201–03Test No. 01 to 03 (static_shear_cracked_12Ø)
SPN1001–03Test No. 01 to 03 (static_pull-out_non-cracked_10Ø)
SPC1001–03Test No. 01 to 03 (static_pull-out_cracked_10Ø)
SPN1201–03Test No. 01 to 03 (static_pull-out_non-cracked_12Ø)
SPC1201–03Test No. 01 to 03 (static_pull-out_cracked_12Ø)
Table 4. Respective results of the shear tests.
Specimen Test ClassificationMax. Average Load
Shear testsΦ10Non-cracked concrete16.08 kN
Cracked concrete15.85 kN
Φ12Non-cracked concrete25.44 kN
Cracked concrete24.52 kN
Table 5. Respective esults of the pull-out tests.
Specimen Test ClassificationMax. Average Load
Pull-out testsΦ10Non-cracked concrete26.03 kN
Cracked concrete23.46 kN
Φ12Non-cracked concrete31.89 kN
Cracked concrete25.93 kN
Table 6. Load protocol of post-installed anchors.
AnchorTestApplied Load (kN)Static Max. Average Load (kN)
(Refer to Table 4 and Table 5)
50%
(10 Times)
37.5%
(30 Times)
25%
(100 Times)
Φ10Shear86416.08
Pull-out139.56.426.03
Φ12Shear139.86.525.44
Pull-out1612831.89
Table 7. Test specimens and parameters for dynamic loading test.
Specimen NameTest MethodRemark
(Specimen Test Classification)
DSN1001–03T-01Test No. 01 to 03 (dynamic_shear_non-cracked_10Ø)
DSC1001–03Test No. 01 to 03 (dynamic_shear_cracked_10Ø)
DSN1201–03Test No. 01 to 03 (dynamic_shear_non-cracked_12Ø)
DSC1201–03Test No. 01 to 03 (dynamic_shear_cracked_12Ø)
DPN1001–03Test No. 01 to 03 (dynamic_pull-out_non-cracked_10Ø)
DPC1001–03Test No. 01 to 03 (dynamic_pull-out_cracked_10Ø)
DPN1201–03Test No. 01 to 03 (dynamic_pull-out_non-cracked_12Ø)
DPC1201–03Test No. 01 to 03 (dynamic_pull-out_cracked_12Ø)
Table 8. Dynamic shear test results of M10 and M12 maximum loads.
AnchorConcreteTest No.01
(kN)
Test No.02
(kN)
Test No.03
(kN)
Criteria 80%
(Refer to Table 6)
Φ10Non-crack8.398.648.1012.86 kN
Crack8.318.178.36
Φ12Non-crack25.4325.8025.8620.82 kN
Crack25.3224.7225.01
Table 9. Dynamic pull-out test results of M10 and M12 maximum loads.
AnchorConcreteTest No.01
(kN)
Test No.02
(kN)
Test No.03
(kN)
Criteria 80%
(Refer to Table 6)
Φ10Non-crack20.5220.3022.8820.35 kN
Crack14.4317.9015.22
Φ12Non-crack42.4741.2540.3925.51 kN
Crack39.1538.9540.70
Publisher’s Note: MDPI stays neutral with regard to jurisdictional claims in published maps and institutional affiliations.