Article

Water-Induced Inverse Correlation between Temperature and Flux Changes in Vertical Vapor-Phase Diffusive Transport of Volatile Organic Compounds in Near-Surface Soil Environments

1
Department of Environmental Studies for Advanced Society, Graduate School of Environmental Studies, Tohoku University, Sendai 9808579, Japan
2
Department of Mechanical and Aerospace Engineering, School of Engineering, Tohoku University, Sendai 9808579, Japan
*
Author to whom correspondence should be addressed.
Appl. Sci. 2021, 11(8), 3489; https://doi.org/10.3390/app11083489
Submission received: 23 March 2021 / Revised: 7 April 2021 / Accepted: 12 April 2021 / Published: 13 April 2021
(This article belongs to the Section Environmental Sciences)

Abstract

:
Volatile organic compounds (VOCs) in contaminated soils have been investigated in near-surface environments to describe their transport behaviors and the resultant impacts of vapor intrusion into buildings. Prior studies have suggested that temperature changes significantly influence such transport behaviors in near-surface soils; however, the nature of these influences and their mechanisms have remained unclear. This is because an inverse correlation between the in situ temperature and VOC flux changes has been suggested but has not been experimentally investigated or demonstrated. Herein, we show the results of a set of experiments on the vertical and upward vapor-phase diffusive transport of benzene in sandy soils for different sand grain size and water content combinations under sinusoidal temperature changes between 20 and 30 °C. Under all experimental conditions, changes in the flux from the soil surface correlated with temperature changes, whereas changes in the flux into the overlying soil showed inverse correlations. Concurrent monitoring of the relative humidity revealed that an inverse correlation was exhibited in response to the condensation and volatilization of water. Moreover, the intensity of the inverse correlation was independent of grain size but was larger at higher water contents. Overall, water in soil may induce an inverse correlation.

1. Introduction

Volatile organic compound (VOC) contaminants, such as chlorinated hydrocarbon (CHC) and petroleum hydrocarbon (PHC) compounds, are commonly found in near-surface soils, and they pose a serious environmental issue owing to their large-scale production and extensive utilization in the manufacturing industry [1,2,3]. These VOC vapors can migrate from contaminated near-surface soils into buildings via overlaying building foundations, thereby resulting in higher indoor VOC concentrations than those of the outdoor environment [4,5]. The inhalation of VOC vapors inside a building is considered to be a significant exposure pathway at VOC-contaminated sites and poses a severe hazard to human health [1,4,6,7].
Under building foundations, several factors influence VOC vapor transport behavior [8,9]. For instance, previous studies have proposed that soil temperature changes significantly influence VOC transport behaviors [8], and that the diffusive transport rates of VOCs are greater under higher temperatures in static temperature environments [10,11,12,13]. However, owing to the dynamic nature of these environments and/or heterogeneities in the geophysical properties of subsurface soil, the VOC vapor transport behavior may be complex or counterintuitive in some special cases. Bekele et al. (2014) [8] determined an inverse correlation between the subsurface soil temperature and VOC flux changes on the basis of field observations at depths of up to 3 m in near-surface soils. Although the changes in the in situ trichloroethylene (TCE) fluxes were positively correlated with the in situ temperature changes at shallower locations, an inverse correlation was revealed for deeper locations. These findings may be related to those reported by Barnes and McRae (2017) [9], who observed that changes in the indoor tetrachloroethylene (PCE) concentration were closely correlated with relatively shallow soil temperatures as opposed to deeper soil temperatures at a depth range of approximately 3 m. However, to the best of our knowledge, this inverse correlation under dynamic temperature environments has not been experimentally demonstrated or investigated in the laboratory, as most laboratory investigations on gas-phase diffusive VOC transport experiments in soils have been conducted under static temperature conditions [14,15,16,17,18,19,20,21,22].
In a few laboratory-based studies that have considered dynamic environments in near-surface soils, the correlation between temperature and VOC flux changes was generally found to be positive [22,23,24]. In the experiments reported by Ausma et al. (2003) using a mesocosm-scale simulator facility [24], soil surface temperature changes were driven by diurnal temperature variations (18–24 °C). Their study showed a correlation between changes in soil surface temperature and total hydrocarbon flux from the soil surface. In another study conducted by Shonnard and Bell (1993) [23], the influences of field conditions, such as temperature and relative humidity (RH) changes above the soil surface, were investigated. In their experiments, the temperature changed diurnally, while the RH was maintained at a relatively constant value. Changes in the benzene flux from the soil surface were also found to be correlated with the temperature changes. Therefore, more extensive investigations must be conducted on the correlation between the soil temperature and VOC flux changes not only for the soil surface but also for the deeper layers, owing to the inconsistent conclusions drawn among previous laboratory experiments and field observations.
In this study, we aim to experimentally investigate the occurrence and mechanisms of the inverse correlation between the changes in temperature and the vertical vapor-phase VOC diffusive flux in soils. We first present and describe a newly developed experimental method for investigating the vertical vapor-phase diffusive transport of VOCs through a soil sample, which enables separate and continuous measurements of the changes in the VOC concentration and flux at both the bottom and top of the soil sample under both static and dynamic temperature conditions. This experimental method also enables continuous measurements of RH and water vapor flux changes at the top of the soil to obtain insights into the behavior of water, which may have some influence on VOC transport. Subsequently, we present the results of static temperature (25 °C) and dynamic temperature (25 ± 5 °C) experiments on the diffusive transport of benzene through a sandy soil sample with a water content of 10 wt% to verify that the characteristic results showing the inverse correlation under the dynamic temperature condition are not obtained under the static temperature condition. Thereafter, we present the results of a set of dynamic temperature experiments on the diffusive transport of benzene for different combinations of sand grain size (coarser and finer grains) and water content (air-dried and 10 wt%) to reveal the influences of these conditions on the inverse correlation. The grain size and water content of soil may affect the intensity of VOC sorption and desorption from the soil grain, which also has a potential influence on VOC transport. Finally, the possible mechanisms of the inverse correlation are discussed based on the experimental results.

2. Materials and Methods

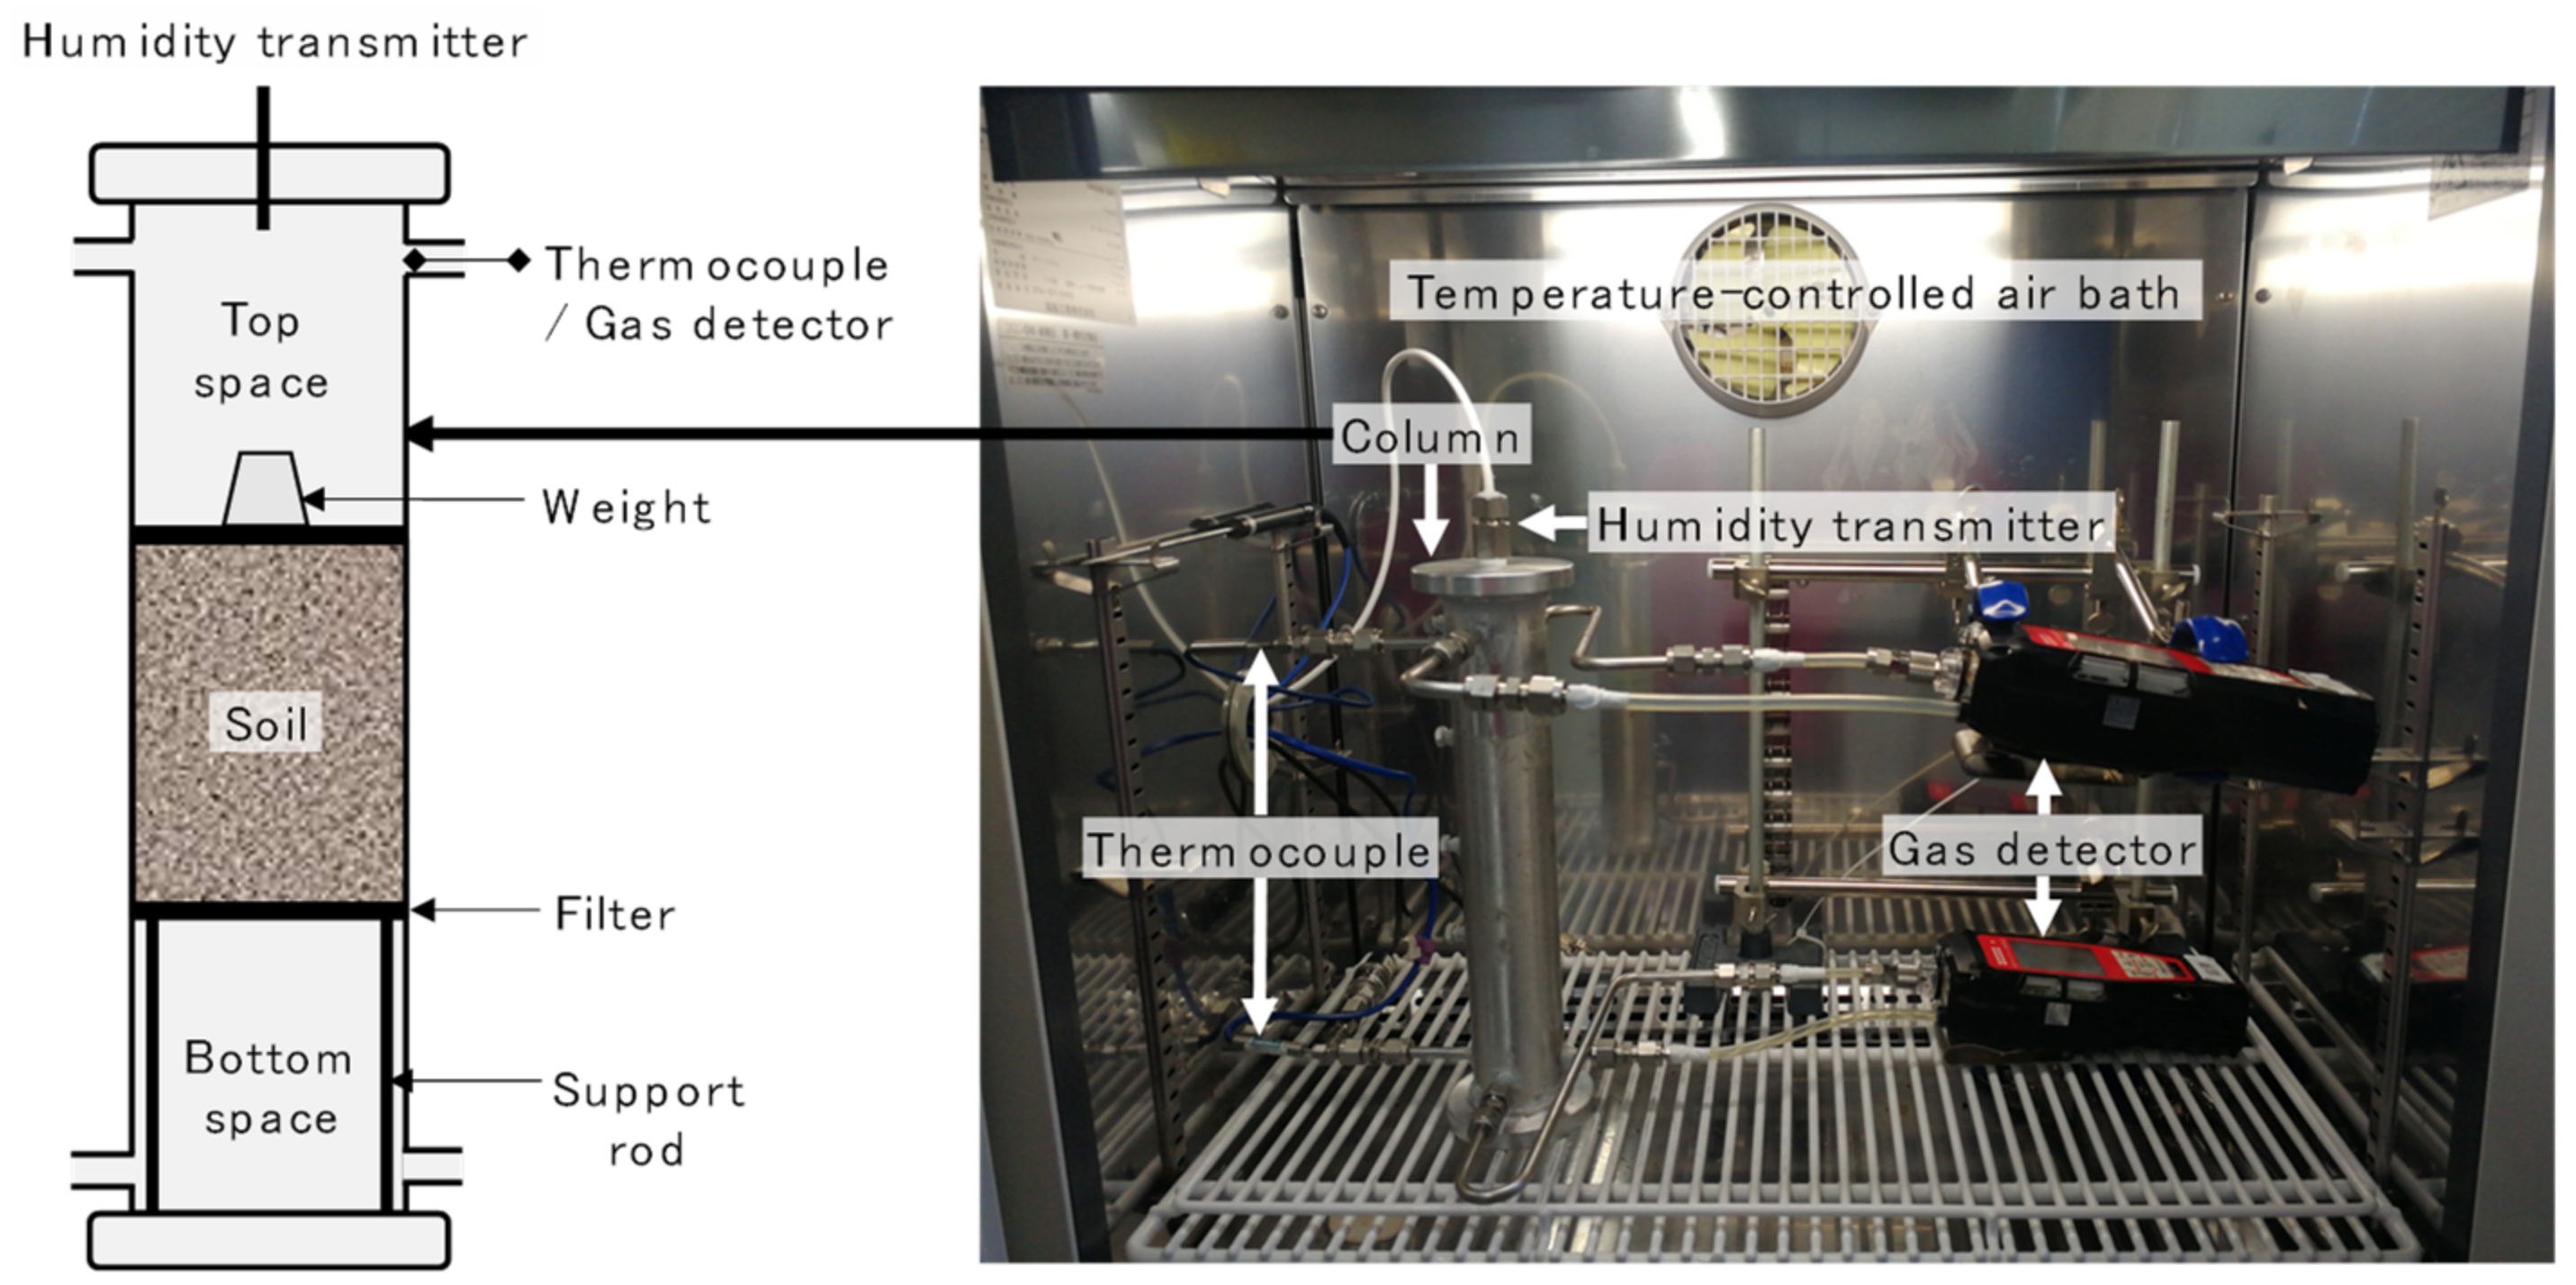
2.1. Experimental System

An experimental system for the vertical vapor-phase diffusive transport of VOCs through a soil sample was developed using an aluminum column, as illustrated in Figure 1. In this system, the VOC concentration and temperature can be continuously measured at both the bottom and top spaces of the column, and the RH within the column can be continuously measured at the top space under both static and dynamic temperature conditions. The inner diameter and length of the column were 4.4 and 28.6 cm, respectively. A soil sample (occupying a length of approximately 10 cm) containing a prescribed amount of water was placed in the middle of the column, where it was supported at its lower end by a 1 mm-thick stainless-steel sintered filter and capped at its upper end by another filter on which a 50 g weight was placed for stabilization of the soil.
The top and bottom spaces of the column were monitored using thermocouples and portable gas detectors (GX-6000, Riken Keiki Co., Ltd., Tokyo, Japan). The gas detectors were equipped with a pump that allowed for the continuous circulation of gas between the detector and the top or bottom space. The VOC concentration was measured every 5 min via the photoionization detector (PID). A preliminary experiment revealed that the pump produced no detectable pressure difference (<0.1 kPa) between the bottom and top spaces. Therefore, advective VOC transport due to pumping was deemed unlikely. The top space of the column was monitored using a humidity transmitter (EE-23-T6, TEKHNE Co., Ltd., Kanagawa, Japan). During conduction of the experiments, the column—with the thermocouples, gas detectors, and humidity transmitter—was placed in a temperature-controlled air bath that could operate between −15 and 50 °C.

2.2. Experimental Procedures

Either 233 g of air-dried coarse-grained silica sand (grain size: 1.2–2.4 mm) or 221 g of air-dried relatively fine-grained silica sand (grain size: 0.074–0.35 mm) was first homogeneously packed into the column, as shown by the vertical X-ray computed tomography slice images in Figure 2. The images were captured at an X-ray tube voltage of 120 kV, X-ray tube current of 150 µA, and voxel size of 40 × 40 × 40 µm using a microfocus X-ray computed tomography system (ScanXmate-D225RSS270, Comscantecno Co., Ltd., Kanagawa, Japan), where a lighter color corresponds to a higher density in the image. Although the shape of each grain of the finer-grained silica sand is difficult to identify in the figure because of the voxel size employed, the homogeneity of the packing can be confirmed by the homogenous color displayed in the figure. Both silica sands are natural silica sands produced in Japan, where the courser and finer ones are Keisha No. 3 (Takeori Mineral Mining Co., Ltd., Tokyo, Japan) and Toyoura silica sand (Toyoura Keiseki Kogyo Co., Ltd., Yamaguchi, Japan), respectively. As these sands have been utilized widely in Japan for various purposes, their chemical characteristics are well documented [25,26,27]. Typically, these sands contain ≥90% silica and rarely contain organic impurities [27,28,29,30].
During wet soil sample preparation, the prescribed amount of water (described in Section 2.3) was added to the top face of the soil sample using a syringe, and the column was left to rest overnight. As no water dropped from the soil sample to the bottom space, we expected that all added water was naturally distributed in the soil sample. The amount of water may decrease gradually from the top to the bottom owing to the addition of water from the top and matric potential/capillary forces, and the water retention behavior may be different between the coarser- and finer-grained silica sands. This type of vertical variation in water content simulates conditions for a depth of up to 3 m in near-surface soils, under which an inverse correlation between temperature and VOC flux changes was observed by Bekele et al. (2014) [8]. However, measurements on the distributions of water, which should be addressed in future studies, were not conducted in this study.
After the bottom and top space temperatures reached 25 °C, approximately 3 mL of benzene gas was injected into the bottom space of the column through a gas detector circulation tube connected to a syringe. A preliminary experiment confirmed that no detectable pressure changes (<0.1 kPa) were produced during the injection. Benzene gas was extracted from the headspace of a sealed 10 mL vial, which contained 0.5 mL of liquid benzene (99.7% purity, Wako Pure Chemical Industry, Ltd., Osaka, Japan) and was heated to 60 °C. Benzene was chosen for this study, because it is a typical VOC that poses hazards to human health. The boiling point and solubility in water at 25 °C for benzene are 80.1 °C and 22.8 mmol/L, respectively [31,32].
The benzene concentration and temperature changes—for both the bottom and top spaces—and RH changes within the column were measured for 100 min, either without changes in temperature (constant at 25 °C) or under sinusoidal changes in temperature between 20 and 30 °C, that is, 25 ± 5 °C (Figure 3). During the measurement, the benzene concentrations in the bottom and top spaces, respectively, decreased and increased with time owing to the upward diffusive transport of benzene. The RH measured at the top space changed in response to changes in the amount of saturated water vapor resulting from temperature changes, and changes in the amount of existing water vapor owing to evaporation and condensation within the column.
The changes in the benzene concentration in the bottom and top spaces of the column (known dimensions) were used to estimate the benzene fluxes into and from the soil sample, respectively, as follows:
J v b t m , i = ( C v b t m , i 1 C v b t m , i + 1 ) × 10 3 22.4 · 273 273 + T · L b t m 2 t   and
J v t o p , i = ( C v t o p , i + 1 C v t o p , i 1 ) × 10 3 22.4 · 273 273 + T · L t o p 2 t ,
where Jvbtm,i and Jvtop,i are, respectively, the bottom and top benzene fluxes (mol/m2/s) at measurement time i; Cvbtm,i+1, Cvbtm,i−1, Cvtop,i+1, and Cvtop,i−1 are, respectively, the bottom and top benzene concentrations (ppm) at measurement times i + 1 and i − 1; T is the temperature (°C); Lbtm and Ltop are, respectively, the lengths (m) of the bottom and top spaces; and Δt is the measurement interval (i.e., 5 min = 300 s). The changes in the RH measured at the top space of the column were used to estimate the water fluxes from the soil sample, for which positive and negative values correspond to water evaporation and condensation within the column, respectively, as follows:
J w , i = m i + 1 h i + 1 100 m i 1 h i 1 100 · L t o p 2 t ,
where Jw,i is the water flux (mol/m2/s) at measurement time i; mi+1 and mi−1 are, respectively, the amounts of saturated water vapor (mol/m3) at measurement times i + 1 and i − 1; and hi+1 and hi−1 are, respectively, the RH (%) at measurement times i + 1 and i − 1.
We note that the temperature changes in the average value, +/−5 °C, and the decreasing VOC concentration as per this study design were referenced from the study of Bekele et al. (2014) [8], who suggested that an inverse correlation between the temperature and VOC flux changes may be demonstrated under such conditions. Moreover, we noted a preliminary measurement that showed that the temperature changes at the center of the sand-packed column were delayed when compared to those in the bottom and top spaces. However, this delay was small (approximately 5 min), and did not affect the investigation of the flux changes. Consequently, no consideration for the delay has been required so far. Therefore, an almost identical temperature change occurred at any location within the column, which simulates the approximately depth-independent temperature change at a depth range of up to 3 m, as previously reported [8]. Therefore, only the data for the bottom temperature are presented in the results.

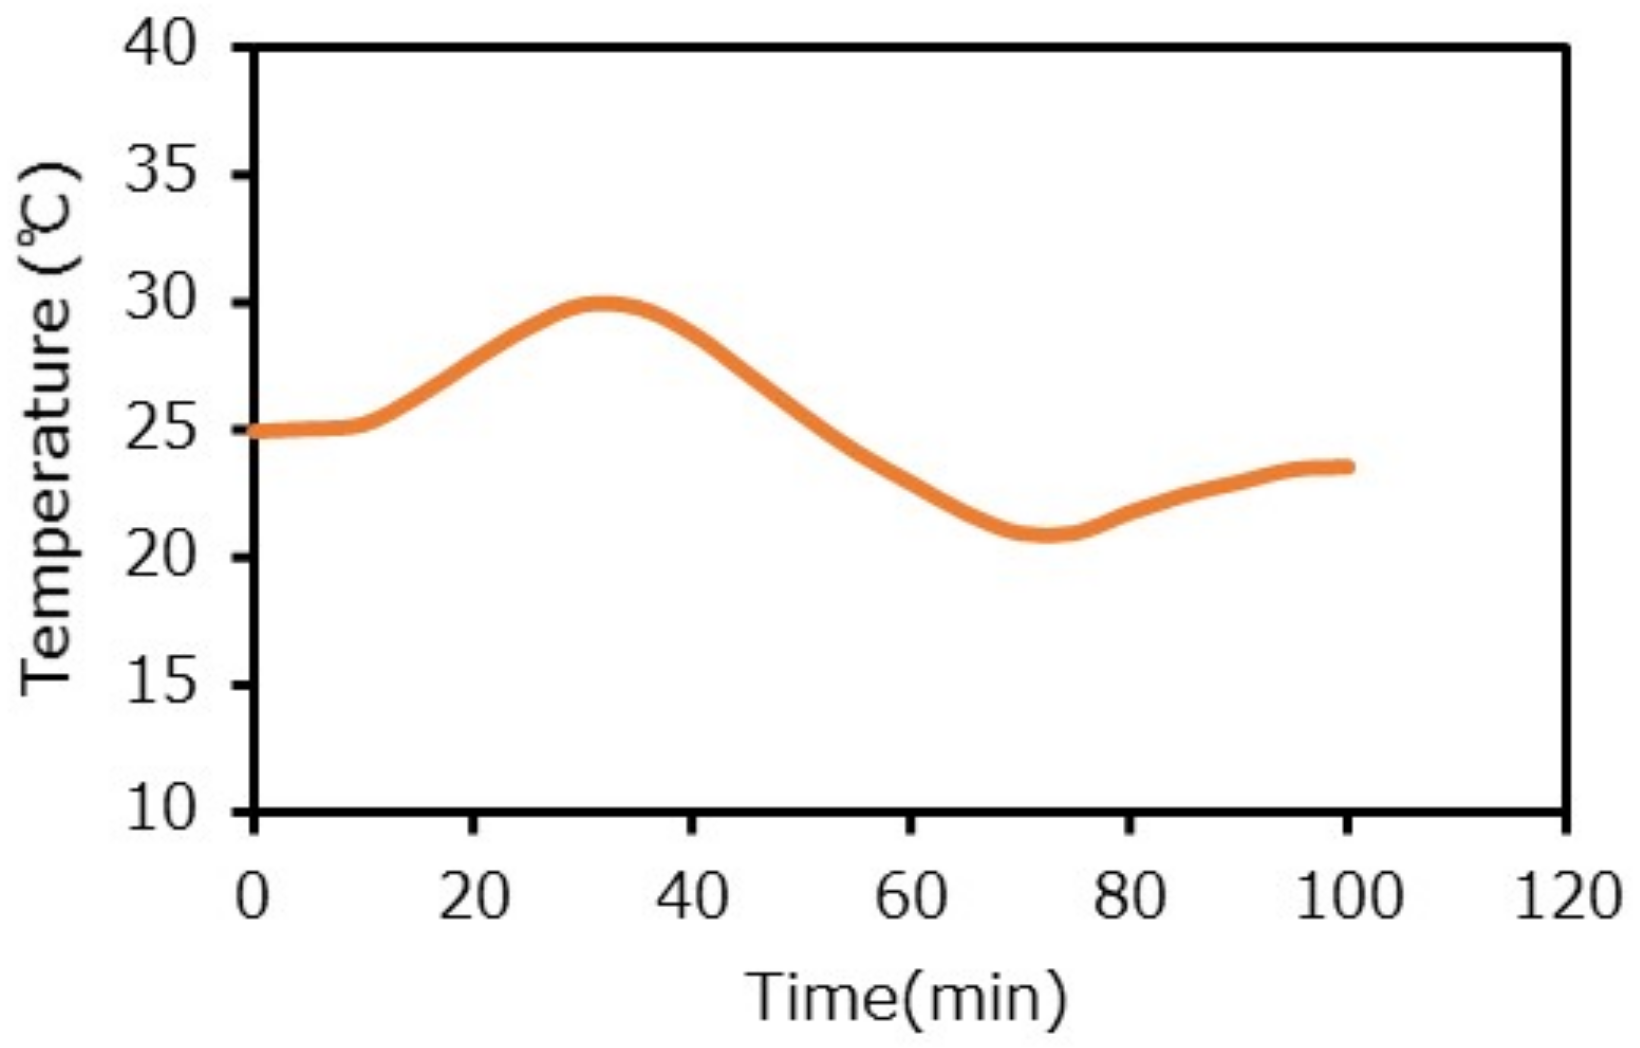
2.3. Experimental Conditions

A total of five experiments (Runs 1–5) were conducted in this study, as listed in Table 1. Run 1, for comparison with Run 2, was conducted on the coarser-grained silica sand at a water content of 10 wt% under static temperature conditions. Runs 2 and 3 were conducted, respectively, on the coarser- and finer-grained silica sands at a water content of 10 wt% under dynamic temperature conditions. Runs 4 and 5 were conducted, respectively, on the air-dried coarser- and finer-grained silica sands (water content: ~0.3 wt%) under dynamic temperature conditions. The amount of water added for 10 wt% water content was 23 g for the courser-grained silica sand and 22 g for the finer-grained silica sand.

3. Results

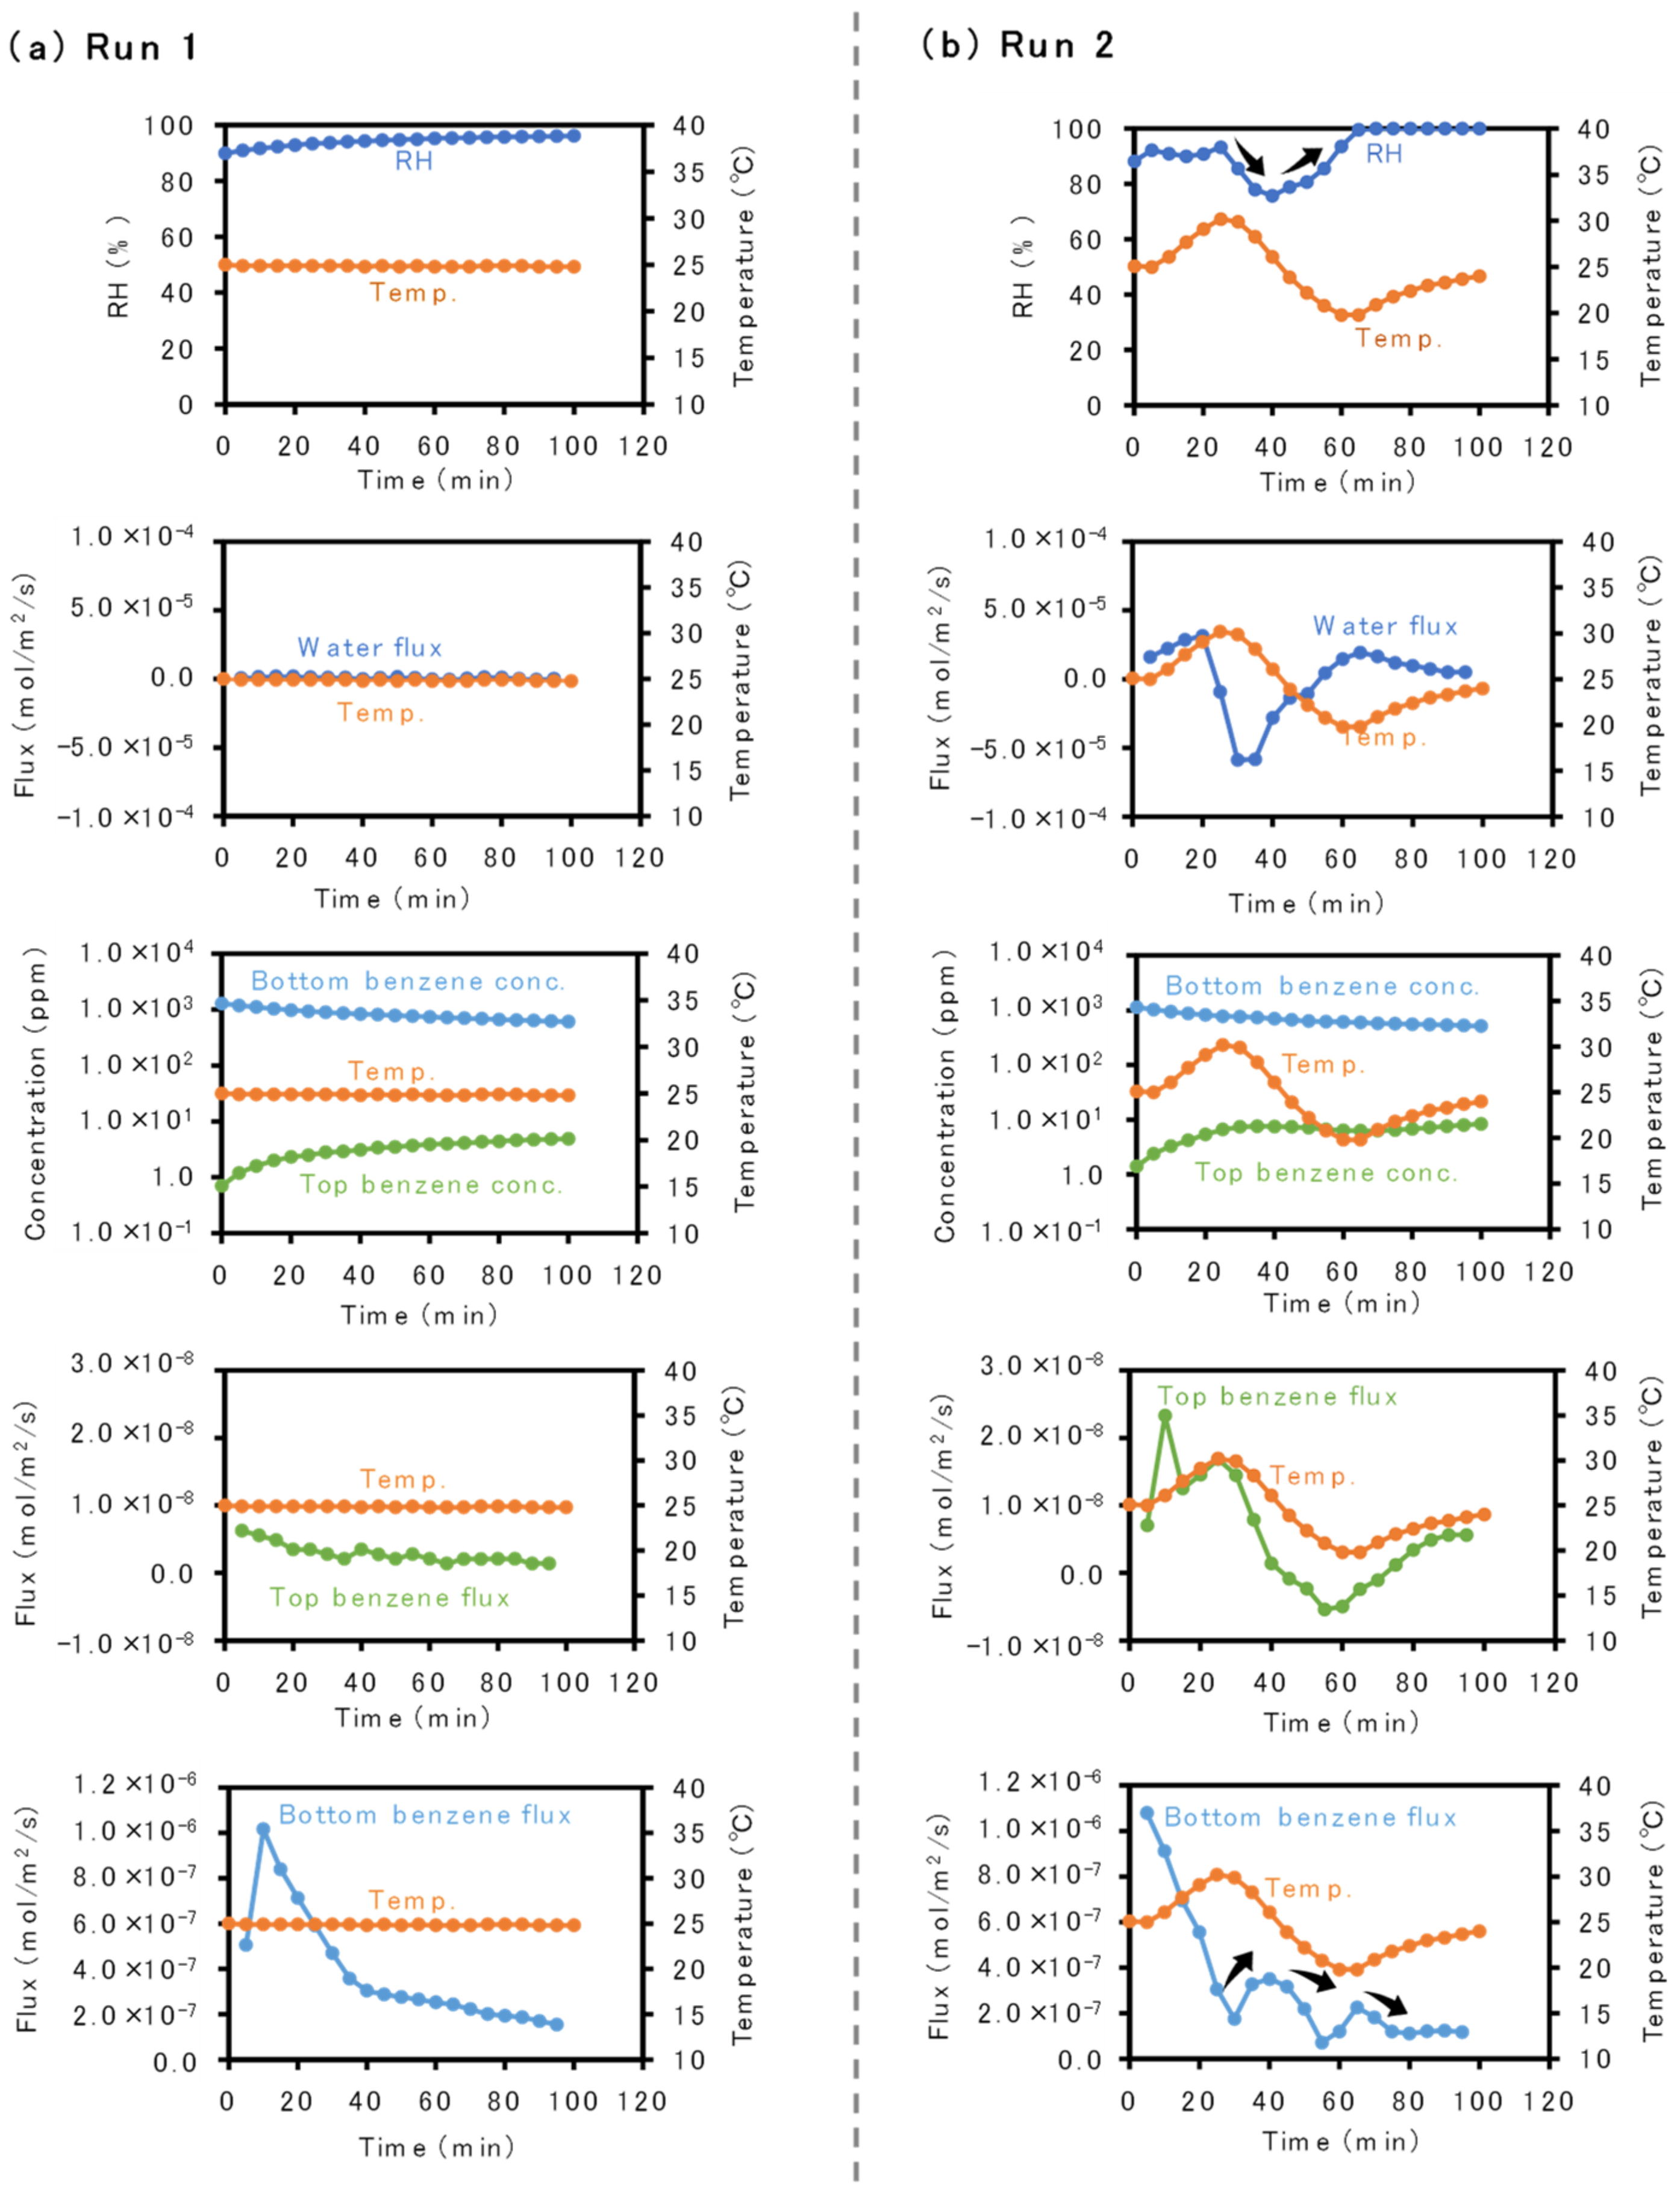
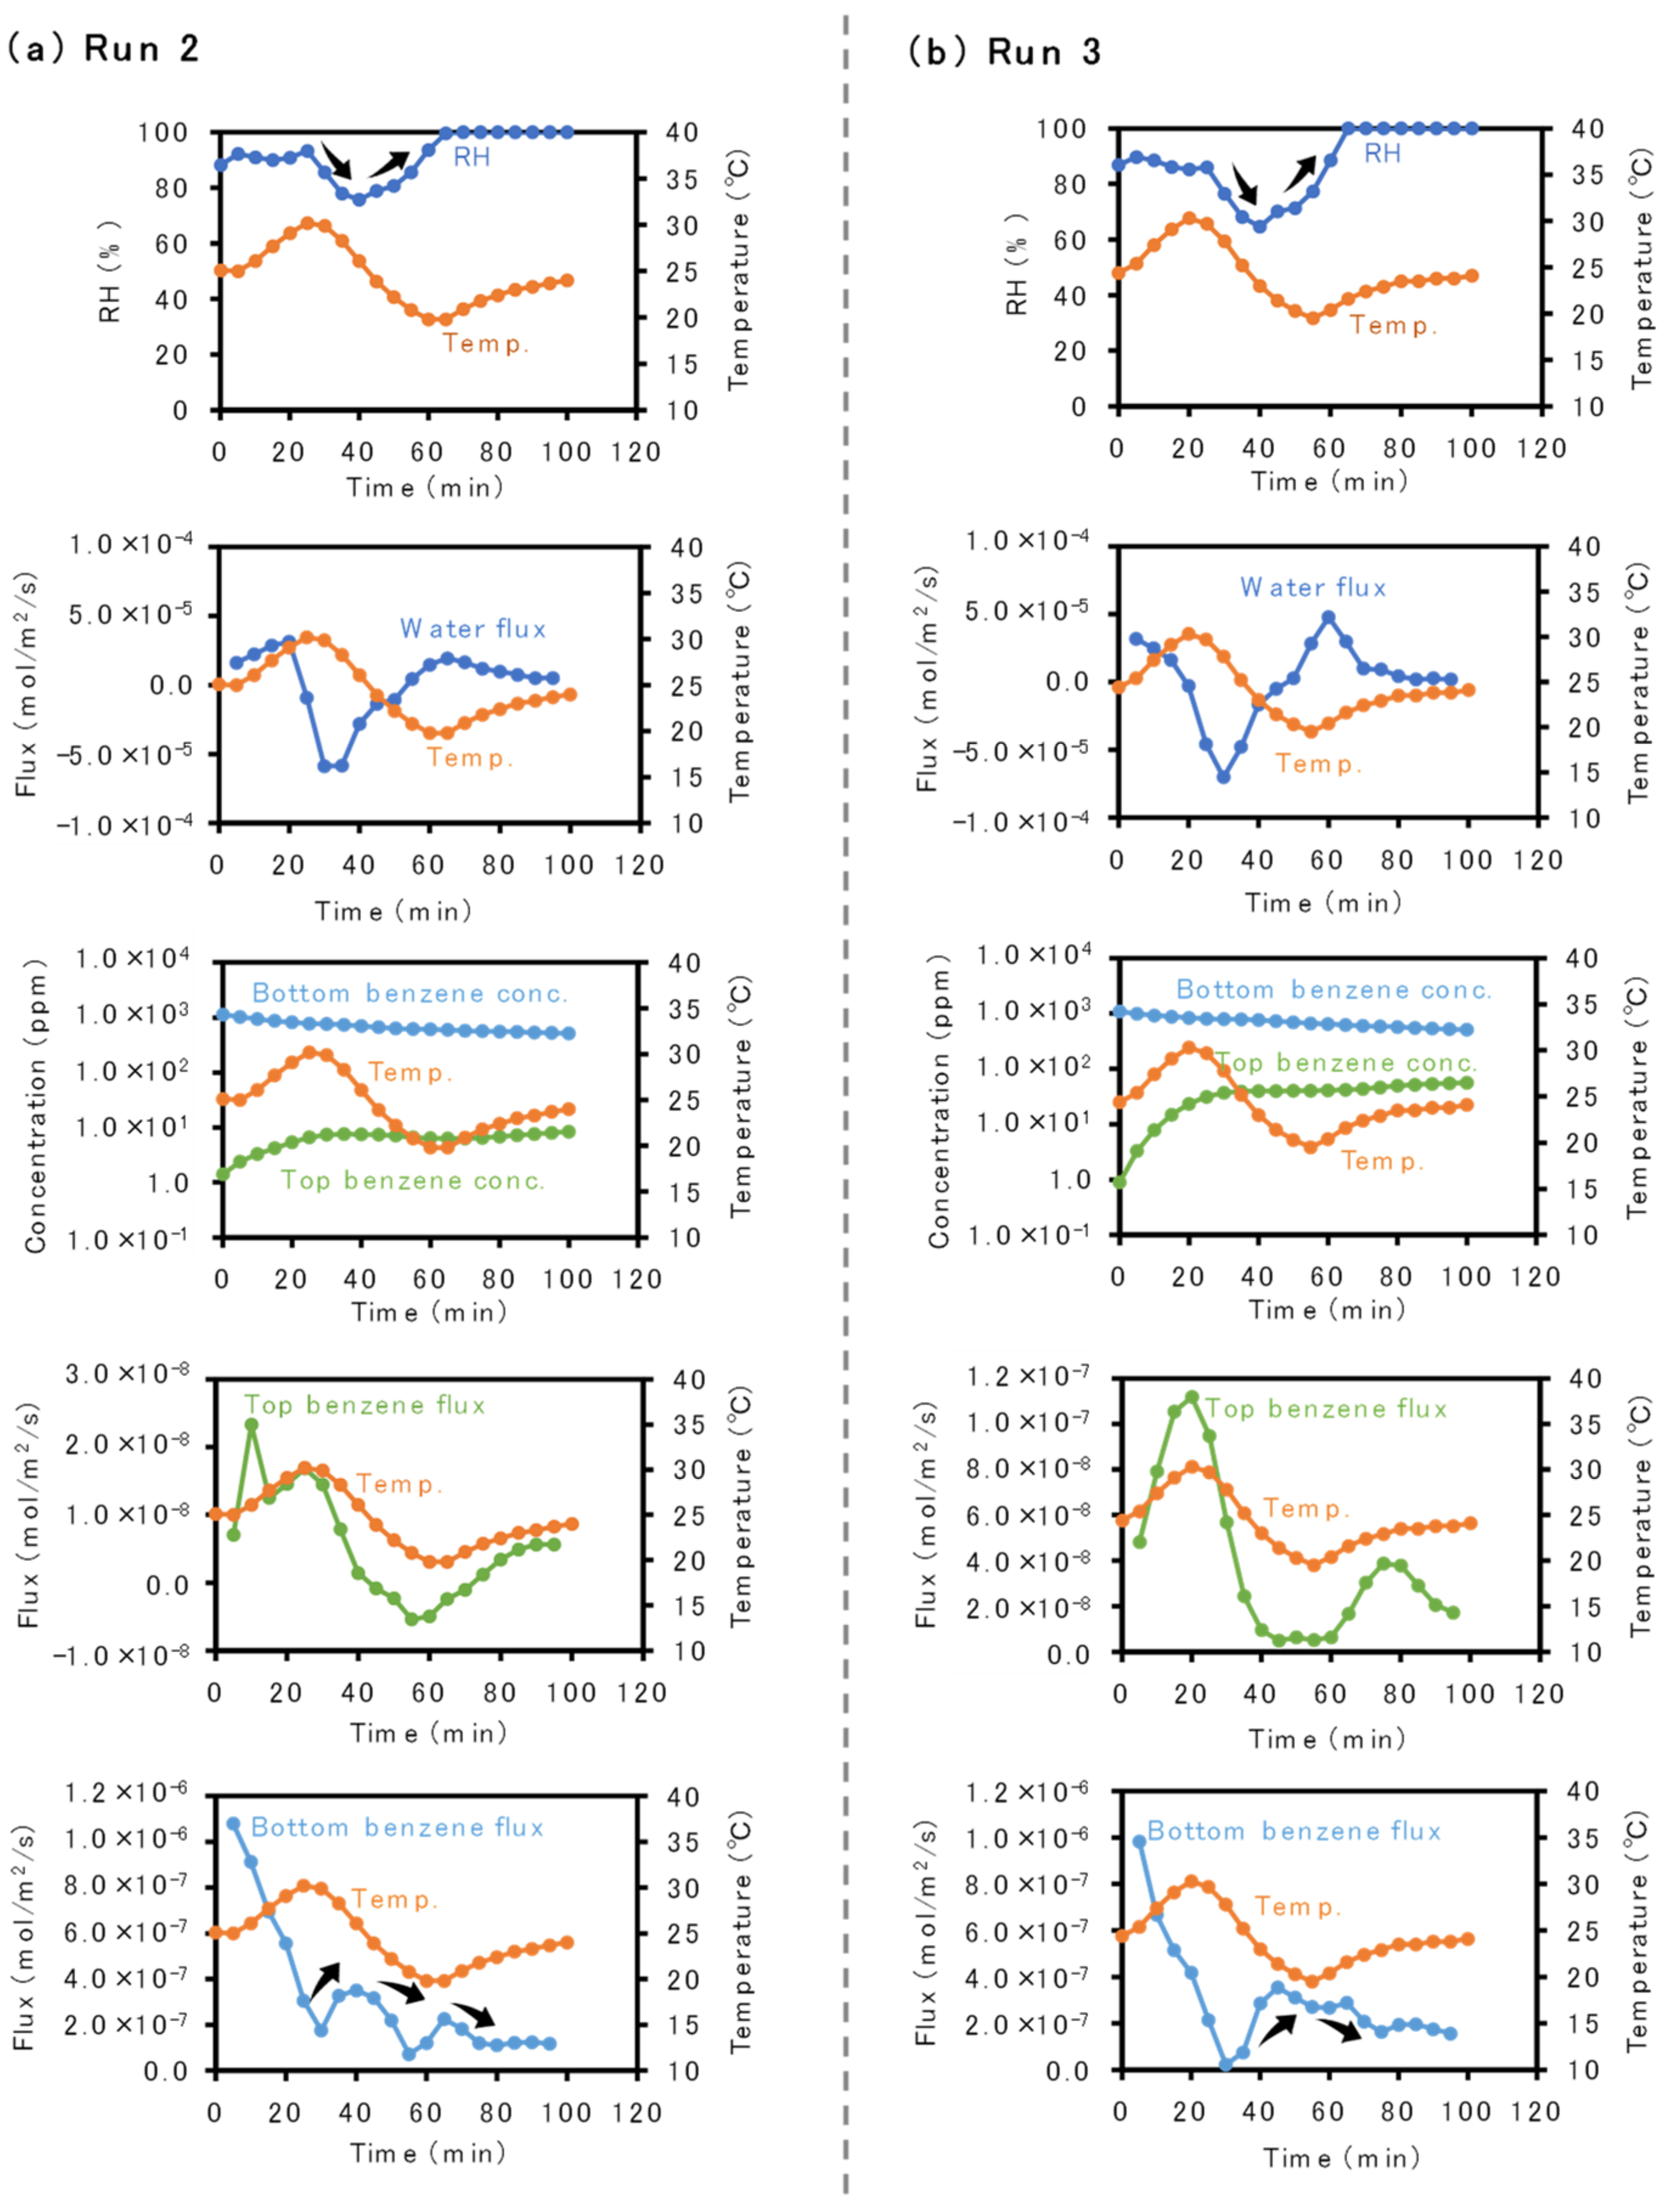
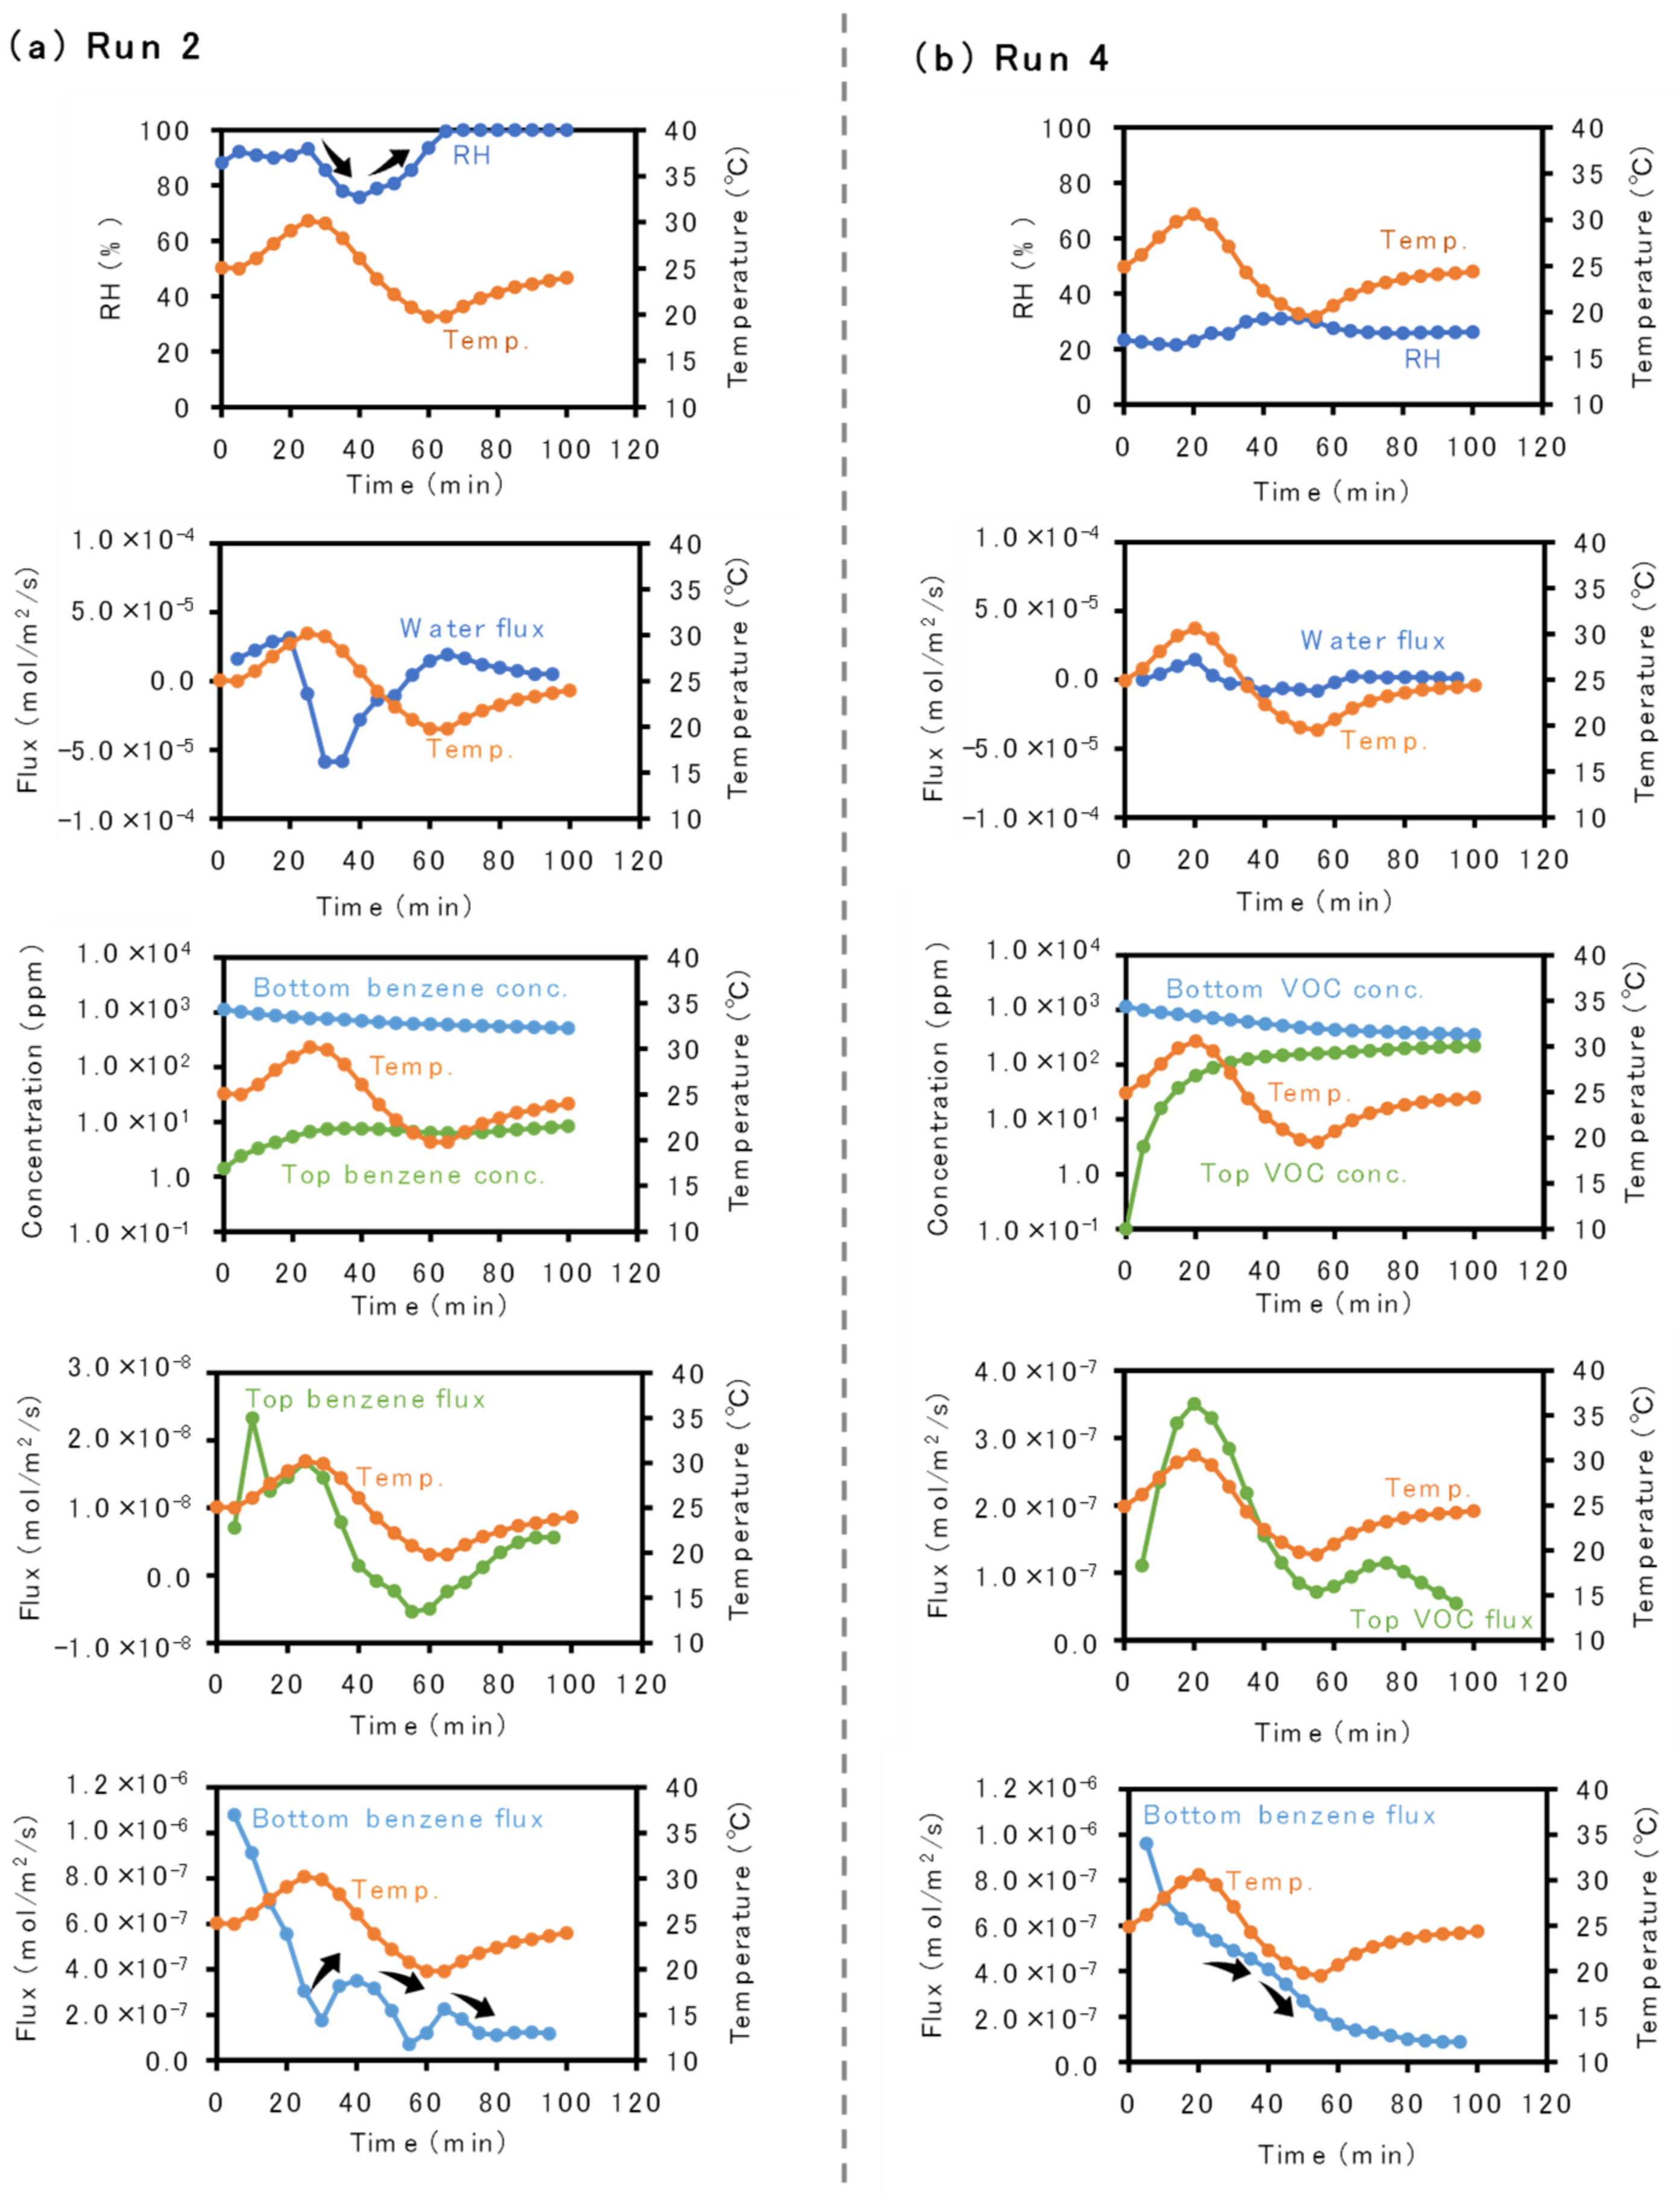
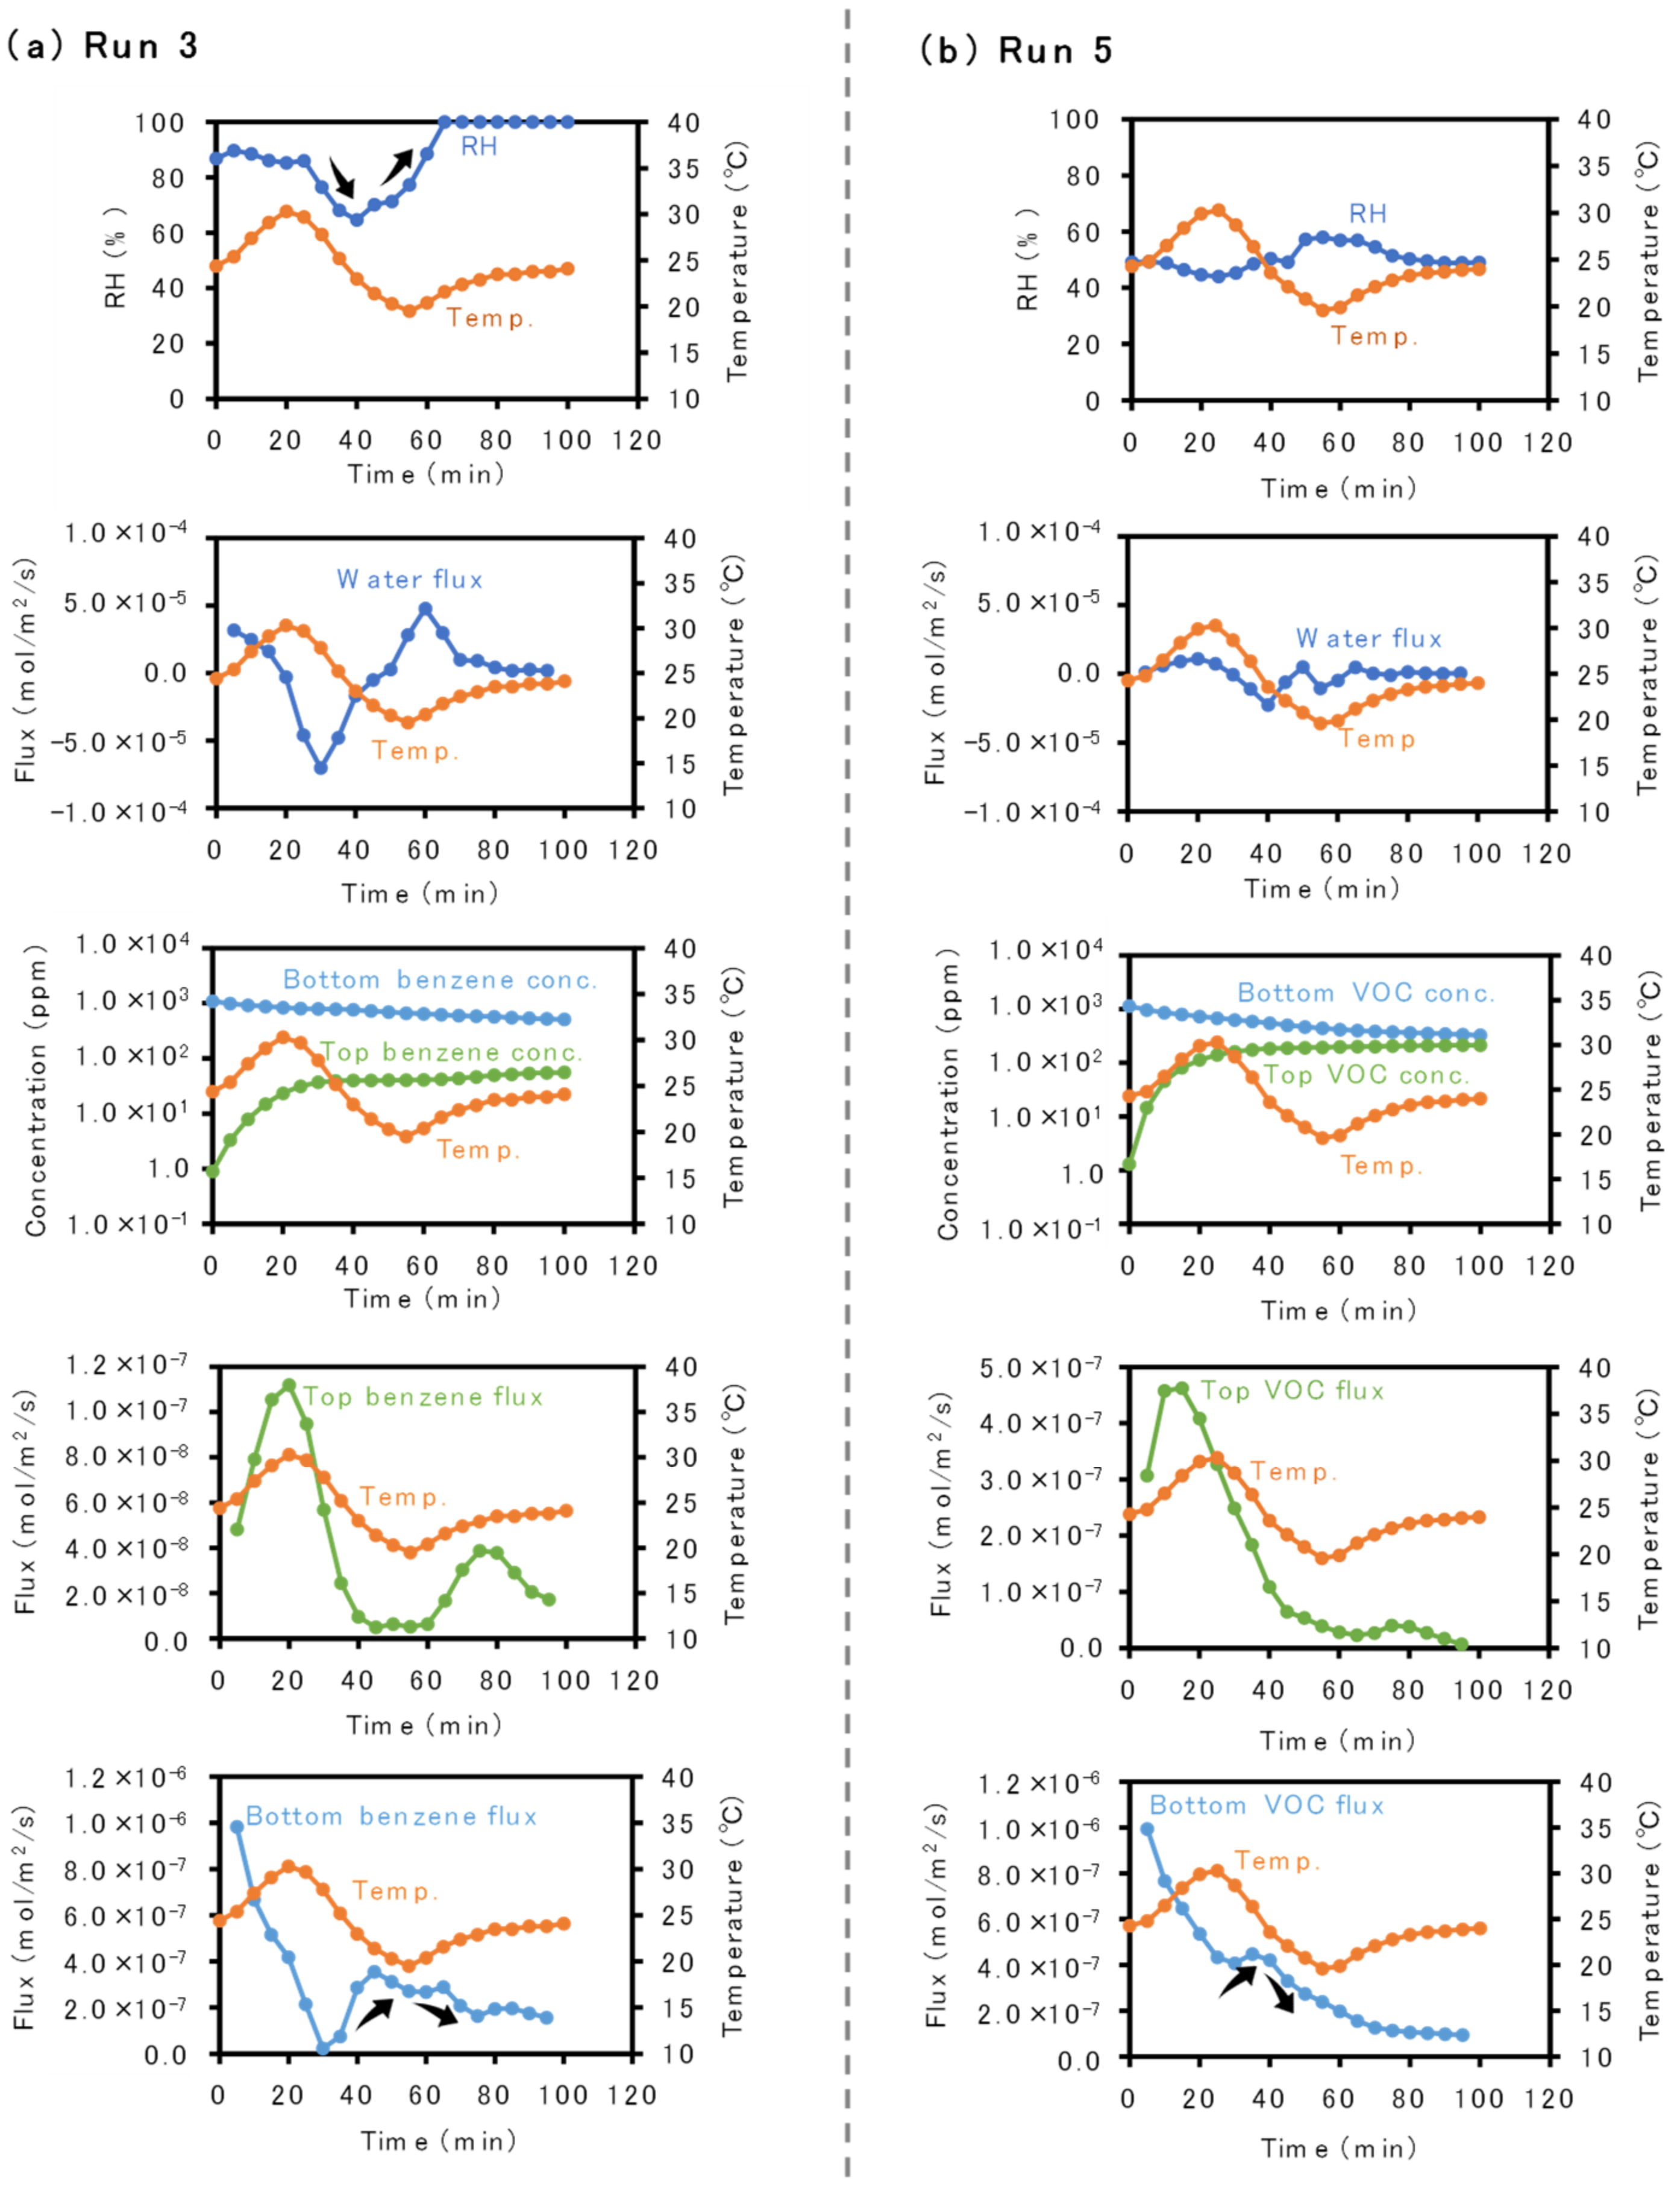
3.1. Inverse Correlation between Temperature and Benzene Flux Changes

Figure 4 shows a comparison of the changes in the RH and corresponding water flux measured at the top (outlet) space, and the benzene concentrations and corresponding fluxes measured for the bottom (inlet) and top spaces between the static (Run 1) and dynamic (Run 2) temperature experiments. In Run 1 under the static temperature condition (Figure 4a), the RH was initially close to 100% and, therefore, increased slightly and gradually with time at a constant temperature owing to the slow evaporation of water. Correspondingly, an insignificant water vapor flux was observed throughout the experiment. The benzene concentration at the bottom decreased with time as a result of benzene intrusion into the soil sample. Simultaneously, the benzene concentration at the top increased with time as a result of benzene emission from the soil sample. As the difference between the bottom and top benzene concentrations generally decreased with time, the bottom and top fluxes decreased in the overall trend. The bottom flux was generally larger than the top flux owing to benzene infiltration into ineffective pore spaces and/or the dissolution of benzene into water within the soil.
On the other hand, in Run 2 under the dynamic temperature condition (Figure 4b), a decrease and subsequent recovery in the RH occurred in response to the temperature rise and drop, as indicated by the arrows. The decrease in RH may have largely reflected an increase in the amount of saturated water vapor as a result of rising temperature, while the recovery of the RH may have largely reflected a decrease in the amount of saturated water vapor as a result of the decreasing temperature. Peaks of negative and positive water fluxes were shown; therefore, peaks of water condensation and evaporation within the column were also shown. Consequently, the water flux change was inversely correlated with the temperature change. The bottom and top benzene concentrations showed changes similar to those observed in Run 1 under static temperature conditions (Figure 4a). However, the top and bottom fluxes changed differently from those in Run 1. The change in the top benzene flux was largely correlated with temperature change, as can be expected from the larger rate of diffusive transport for VOCs in higher temperature soils reported in previous studies [11,12,13]. In contrast, an inverse correlation was found between the changes in the temperature and bottom benzene flux, as indicated by the arrows. It appeared that the onset and termination of the increased bottom benzene fluxes occurred near the peaks of negative and positive water vapor fluxes (i.e., peaks of condensation and evaporation of water).

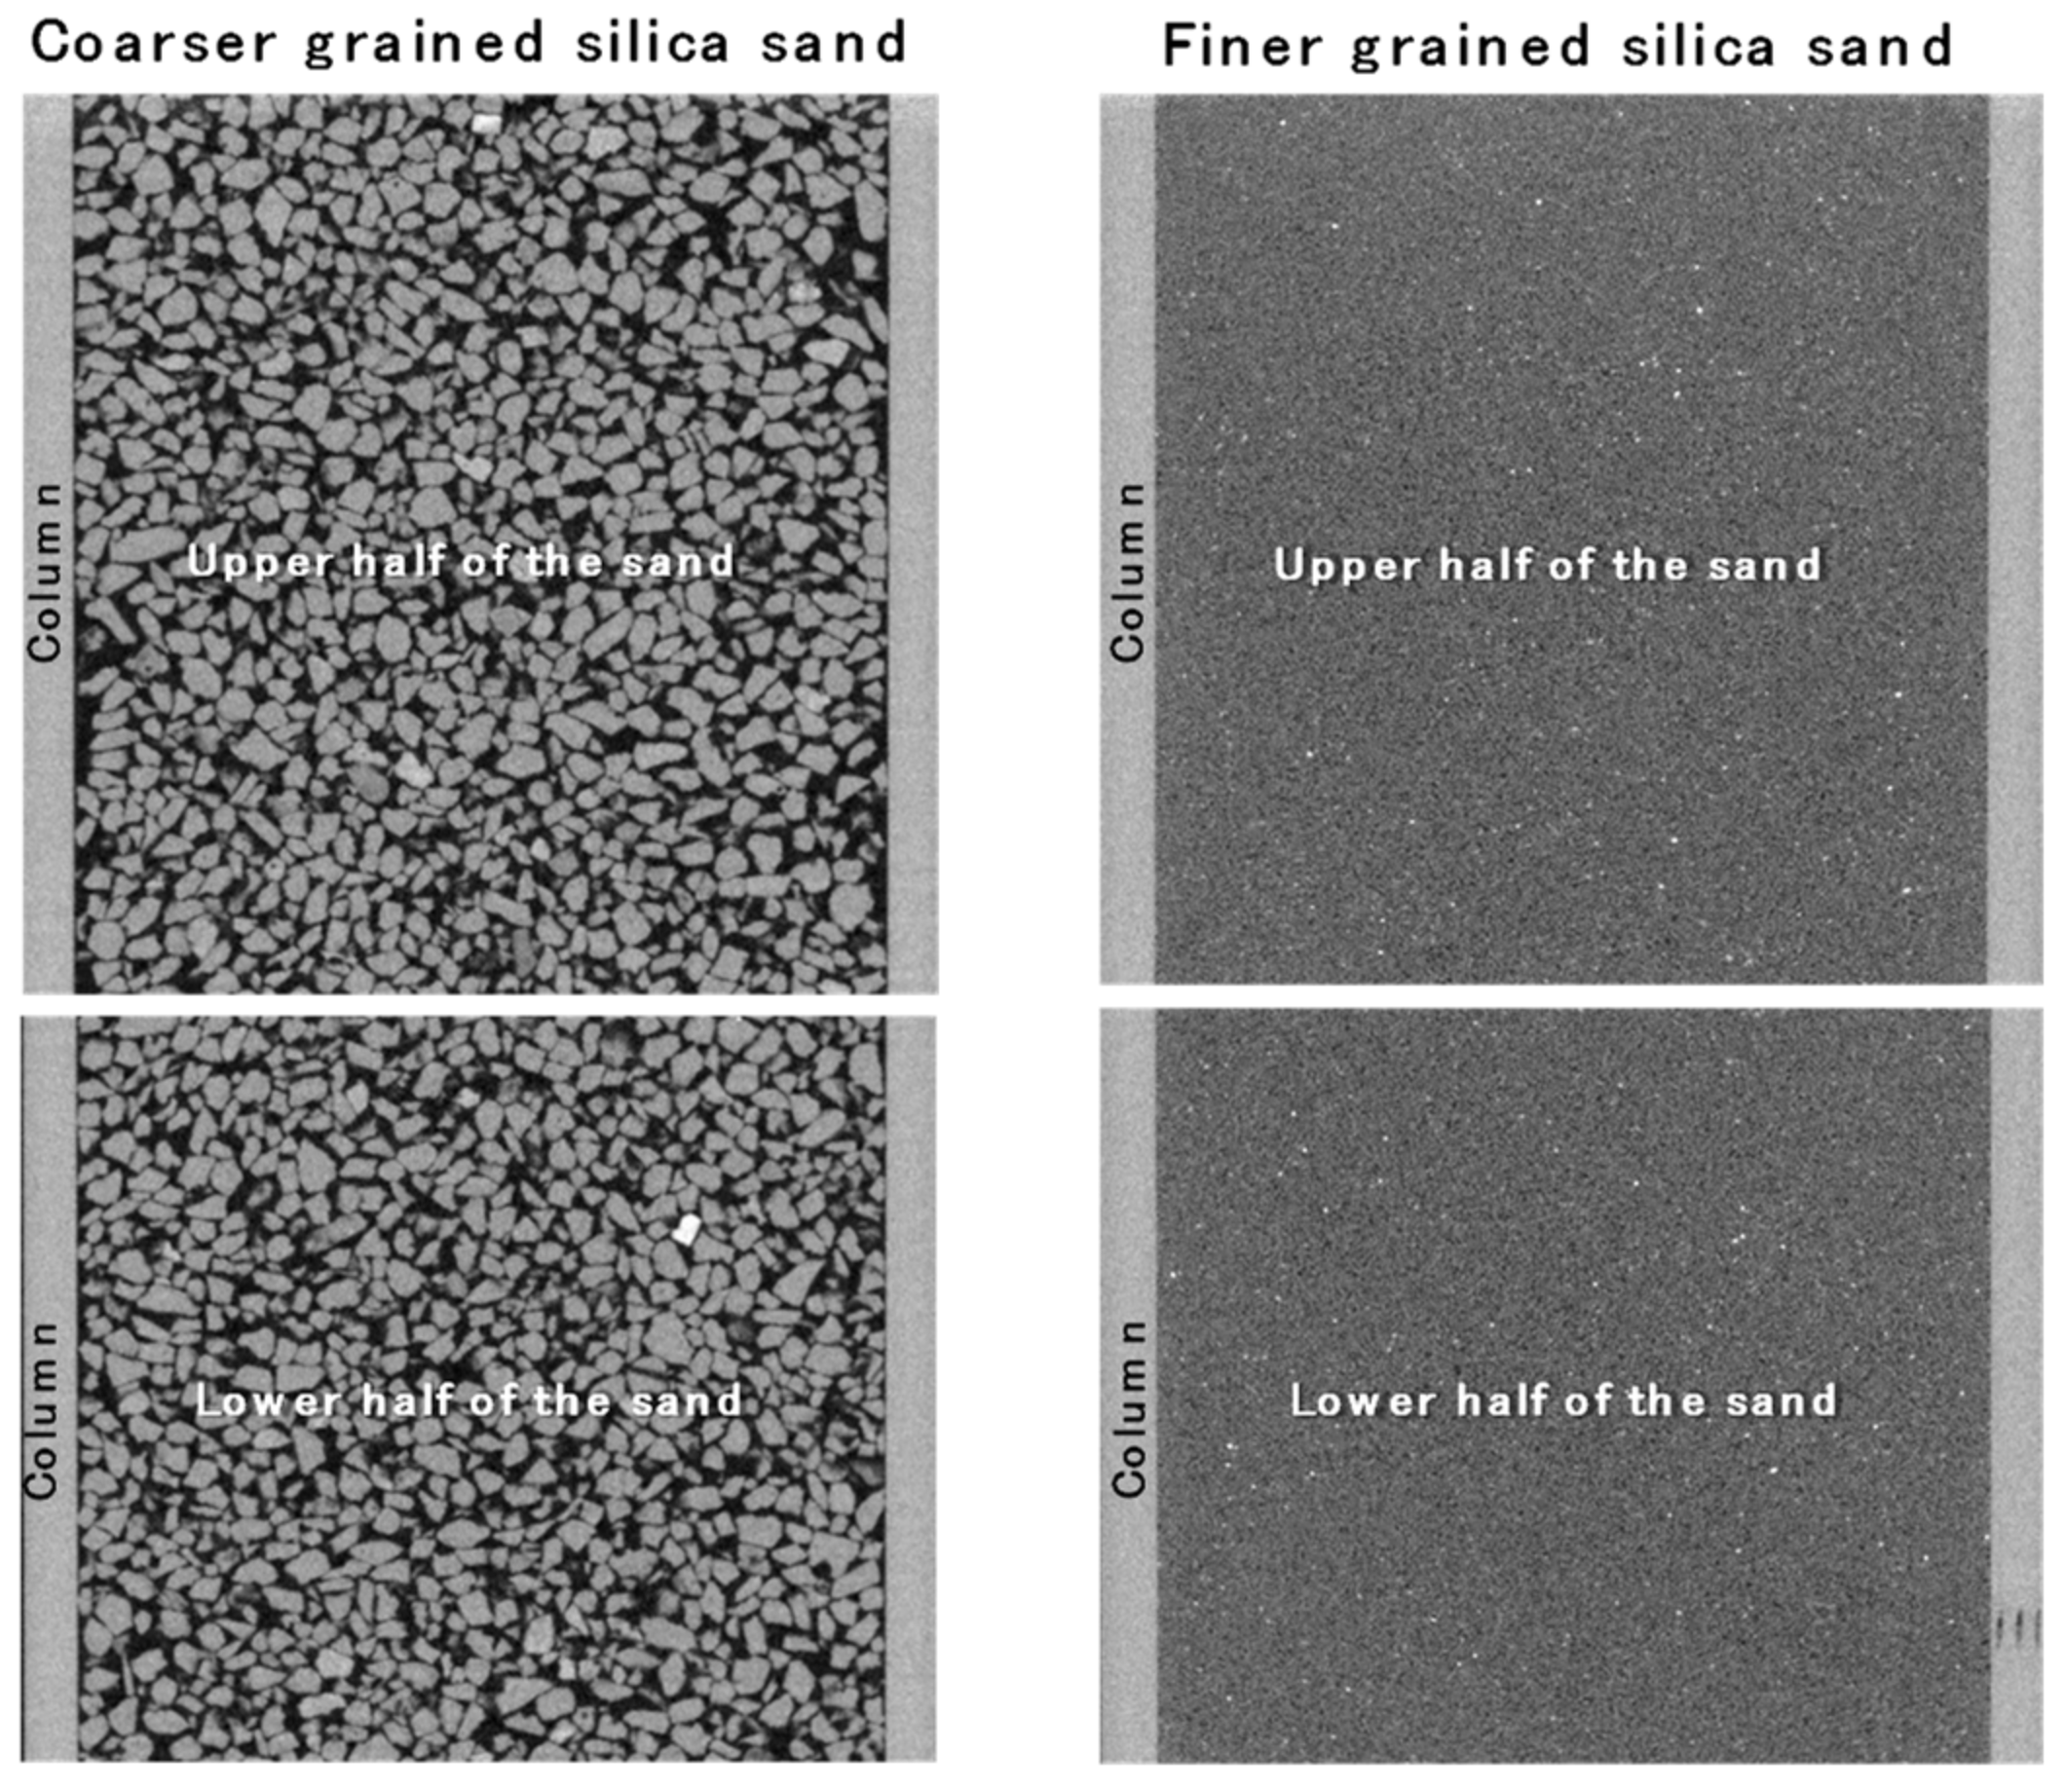
3.2. Influences of Sand Grain Size and Water Content on Inverse Correlation

Figure 5 shows a comparison of the changes in the RH and corresponding water flux, and benzene concentrations and corresponding fluxes between the aforementioned dynamic temperature experiment with the coarser-grained silica sand (Run 2) and the dynamic temperature experiment with the finer-grained silica sand (Run 3). The results for Run 3 with the finer-grained silica sand (Figure 5b) were very similar to those obtained in Run 2 with the coarser-grained silica sand (Figure 5a). A decrease and subsequent recovery in the RH occurred in response to temperature change, as indicated by the arrows, and peaks of negative and positive water fluxes (i.e., condensation and evaporation of water) were shown. The bottom and top benzene concentrations showed changes similar to those observed in Run 2. The change in the top benzene flux correlated with the temperature change, while an inverse correlation was observed between the changes in the temperature and bottom benzene flux, as indicated by the arrows. Moreover, the aforementioned link between the changes in the bottom benzene flux and the water vapor flux was present.
Figure 6 shows a comparison of the changes in the RH and corresponding water flux, and benzene concentrations and corresponding fluxes between the aforementioned dynamic temperature experiment using the coarser-grained silica sand with 10 wt% water content (Run 2) and the dynamic temperature experiment using the same silica sand under air-dried conditions (Run 4). The results for Run 4 involving the coarser-grained silica sand under air-dried conditions (Figure 6b) were different from those obtained in Run 2 for the coarser-grained silica sand with 10 wt% water content (Figure 6a). The changes in the RH and corresponding water vapor flux were much smaller. Nevertheless, it can be seen that RH changes are inversely correlated with temperature changes owing to the increasing/decreasing amount of saturated water vapor under rising/dropping temperatures. The peaks of negative and positive water fluxes were unclear, although the fluxes showed both negative and positive values. The bottom and top benzene concentrations showed qualitatively similar changes to those observed in Run 2, wherein the faster changes were attributed to the larger effective diffusion coefficients at smaller water contents [33,34,35,36]. Preliminary experiments revealed that the effective diffusion coefficient for the coarser-grained silica sand at 25 °C was of the order of 10−6 m2/s under air-dried conditions and 10−7 m2/s at 10 wt% water content. As observed in Run 2, the change in the top benzene flux was positively correlated with the temperature change to a large extent. However, the inverse correlation was found to be less significant, even though it was demonstrated as indicated by the arrows.
Figure 7 shows a comparison of the changes in the RH and corresponding water flux, and benzene concentrations and corresponding fluxes between the aforementioned dynamic temperature experiment using the finer-grained silica sand with 10 wt% water content (Run 3) and the dynamic temperature experiment using the same silica sand under air-dried conditions (Run 5). The differences between the Run 5 results and Run 3 results (i.e., influences of water content) were similar to the differences observed for the coarse-grained silica sand. The changes in the RH and corresponding water vapor flux were much smaller, although the RH change was inversely correlated with temperature change, and the water vapor flux showed negative and positive values. The bottom and top benzene concentrations showed qualitatively similar changes, where the faster changes were attributed to the larger effective diffusion coefficients at smaller water contents. Preliminary experiments revealed that the effective diffusion coefficient for the finer-grained silica sand at 25 °C was also of the order of 10−6 m2/s under air-dried conditions and 10−7 m2/s at 10 wt% water content. The change in the top benzene flux correlated positively with the temperature change to a large extent, while the inverse correlation was observed at a much smaller intensity, as indicated by the arrows. It appeared that the onset and termination of the increased bottom benzene flux occurred near the peaks of negative and positive water vapor flux (i.e., condensation and evaporation of water), respectively, although this was not very explicit.

4. Discussion

This study experimentally investigated and demonstrated the occurrence of an inverse correlation between the changes in temperature and the vertical vapor-phase VOC diffusive flux in soils, which was previously observed in the field study [8], but has not yet been investigated or demonstrated. Herein, we discuss the possible mechanisms for the inverse correlation. Based on Fick’s first law, the flux increases with an increase in the effective diffusion coefficient and/or vertical concentration gradient. Changes in the effective diffusion coefficient can be assumed to be correlated with temperature changes, considering that a higher molecular diffusion rate is observed at higher temperatures. Therefore, changes in the vertical concentration gradient should be inversely correlated with temperature changes.
One possible process that causes the inverse correlation between temperature and concentration gradient changes is VOC desorption and sorption within the soil. In other words, rising and dropping temperatures induce VOC desorption and sorption, respectively [37,38,39], which in turn increases and decreases the VOC concentration in the soil gas, respectively, such that they may change the vertical VOC concentration gradient. However, the influence of the sorption and desorption of VOCs may not be significant, based on the present experimental results. The VOC sorption capacity is proportional to the available area within the sand [37] and is, therefore, higher for finer-grained silica sand and/or under air-dried conditions [16]. However, this trend is inconsistent with the fact that the intensity of the inverse correlation appears independent of grain size and larger at 10 wt% water content. Moreover, the sand employed in this study contained only a trace amount of organic material, which also suggests that desorption and sorption have a small influence [15].
Another possible process is the VOC volatilization from and dissolution into pore water [40,41]. Rising temperature induces the volatilization of VOCs from water, where the volatilization of water also occurs, which further induces the volatilization of the VOCs. In contrast, a declining temperature induces the dissolution of VOCs in water, where the condensation of water also occurs and further induces the dissolution of the VOCs. In this case, VOC volatilization and dissolution, enhanced by the accompanying volatilization and condensation of water, respectively, may have relatively larger impacts on the vapor-phase VOC concentration at the parts with initially lower concentrations (i.e., shallower parts); thus, the vertical concentration gradient would ultimately be reduced and increased, respectively. This hypothesis is consistent with the fact that the inverse correlation in the present study appeared to be much more significant at 10 wt% water content and was linked to the occurrences of negative and positive water vapor fluxes (i.e., condensation and evaporation of water). This hypothesis should, therefore, be examined further in future studies, in which the transport phenomena of water and water–VOC interactions need to be addressed with thorough consideration of the reality of near-surface soil environments, including variations occurring in temporal and spatial scales because the temperature changes daily and seasonally as well as with depth.
In this study, the employed experimental conditions are limited, and the suggested mechanism of the inverse correlation was not examined. However, this study suggests that, in many cases, temperature changes may have an inverse correlation with changes in vertical gas-phase VOC flux in relatively deeper parts of near-surface soils. Therefore, extensive future studies on the depth dependence of VOC transport behaviors in near-surface soil environments are encouraged to obtain more reasonable estimations of VOC emissions from soils and intrusion into buildings for risk management purposes.

5. Conclusions

It is most likely that variations in soil temperature have a significant influence on the transport behavior of VOCs in near-surface soils and the resultant vapor intrusion into buildings. Recent field studies have suggested the existence of an inverse correlation between changes in in situ temperature and vertical VOC flux for relatively deeper soils. To further investigate this phenomenon and reveal the underlying mechanisms, we experimentally explored the vertical vapor-phase diffusive transport of VOCs in near-surface soils under dynamic temperature environments. That is, the changes in benzene flux into the overlying sandy soil and benzene flux from the soil surface were tested for different combinations of sand grain size and water content under temperatures varying sinusoidally between 20 and 30 °C.
Under all the experimental conditions, the changes in the flux into the overlying soil showed an inverse correlation with the temperature changes, whereas the changes in the flux from the soil surface were correlated with temperature changes. The intensity of the inverse correlation is independent of sand grain size and is larger at a higher water content. Moreover, an inverse correlation appeared to exist in response to the condensation and evaporation of water. This inverse correlation may thus have been caused by changes in the vertical VOC concentration gradient resulting from the volatilization of benzene from pore water with increasing temperature and the dissolution of benzene into the water with decreasing temperature.

Author Contributions

Conceptualization, A.A.P., N.W. and K.N.; Data curation, A.A.P. and N.W.; Formal analysis, A.A.P. and N.W.; Funding acquisition, A.A.P. and T.K.; Investigation, A.A.P. and K.N.; Methodology, A.A.P., N.W. and K.N.; Project administration, N.W.; Resources, N.W. and K.N.; Supervision, T.K.; Validation, M.Y.; Visualization, A.A.P., N.W. and M.Y.; Writing—original draft, A.A.P. and N.W.; Writing—review and editing, K.N. and J.W. All authors have read and agreed to the published version of the manuscript.

Funding

This research was performed by the Environment Research and Technology Development Fund (JPMEERF20191005) of the Environmental Restoration and Conservation Agency of Japan, and by a scholarship from the Japanese Ministry of Education, Culture, Sports, Science and Technology (MEXT), grant number 173074.

Data Availability Statement

The original contributions presented in the study are included in the article, and further inquiries can be directed to the corresponding author.

Conflicts of Interest

The authors declare no conflict of interest.

References

  1. Roveda, L.; Polvara, E.; Invernizzi, M.; Capelli, L.; Sironi, S. Definition of an emission factor for VOC emitted from Italian and European refineries. Atmosphere 2020, 11, 564. [Google Scholar] [CrossRef]
  2. Labianca, C.; De Gisi, S.; Picardi, F.; Todaro, F.; Notarnicola, M. Remediation of a petroleum hydrocarbon-contaminated site by soil vapor extraction: A full-scale case study. Appl. Sci. 2020, 10, 4261. [Google Scholar] [CrossRef]
  3. Liang, Q.; Bao, X.; Sun, Q.; Zhang, Q.; Zou, X.; Huang, C.; Shen, C.; Chu, Y. Imaging VOC distribution in cities and tracing VOC emission sources with a novel mobile proton transfer reaction mass spectrometer. Environ. Pollut. 2020, 265, 114628. [Google Scholar]
  4. Johnston, J.E.; Gibson, J.M. Spatiotemporal variability of tetrachloroethylene in residential indoor air due to vapor intrusion: A longitudinal, community-based study. J. Expo. Sci. Environ. Epidemiol. 2014, 24, 564–571. [Google Scholar] [CrossRef]
  5. Environmental Protection Agency (EPA). OSWER Technical Guide for Assessing and Mitigating the Vapor Intrusion Pathway from Subsurface Vapor Sources to Indoor Air; EPA Office of Solid Waste and Emergency Response: Washington, DC, USA, 2015; pp. 2–154. [Google Scholar]
  6. Kponee, K.Z.; Nwanaji-Enwerem, J.C.; Fu, X.; Kakulu, I.I.; Weisskopf, M.G.; Jia, C. Elevated indoor volatile organic compound exposure in the Niger Delta Region of Nigeria. Int. J. Environ. Res. Public Health 2018, 15, 1939. [Google Scholar]
  7. Stefanakis, A.I. The fate of MTBE and BTEX in constructed wetlands. Appl. Sci. 2020, 10, 127. [Google Scholar]
  8. Bekele, D.N.; Naidu, R.; Chadalavada, S. Influence of spatial and temporal variability of subsurface soil moisture and temperature on vapour intrusion. Atmos. Environ. 2014, 88, 14–22. [Google Scholar] [CrossRef]
  9. Barnes, D.L.; McRae, M.F. The predictable influence of soil temperature and barometric pressure changes on vapor intrusion. Atmos. Environ. 2017, 150, 15–23. [Google Scholar]
  10. Song, C.; Liu, B.; Dai, Q.; Li, H.; Mao, H. Temperature dependence and source apportionment of volatile organic compounds (VOCs) at an urban site on the north China plain. Atmos. Environ. 2019, 207, 167–181. [Google Scholar] [CrossRef]
  11. Zhou, X.; Liu, Y.; Song, C.; Liu, J. Impact of temperature and microstructure on the emission characteristics of VOC in porous building materials. Procedia Eng. 2015, 121, 1067–1075. [Google Scholar] [CrossRef] [Green Version]
  12. Bai, Y.; Huo, L.; Zhang, Y.; Liu, J.; Shao, H.; Wu, C.; Guo, Z. A spatial fractional diffusion model for predicting the characteristics of VOCs emission in porous dry building material. Sci. Total Environ. 2020, 704, 135342. [Google Scholar] [CrossRef] [PubMed]
  13. Du, P.; Sagehashi, M.; Terada, A.; Hosomi, M. Characterization of benzene emission to the atmosphere from contaminated soil. Environ. Sci. 2010, 23, 467–475. [Google Scholar]
  14. Voudrias, E.A.; Li, C. Benzene vapor transport in unsaturated soil: Adequacy of the diffusion equation. J. Hazard. Mater. 1993, 34, 295–311. [Google Scholar] [CrossRef]
  15. Lin, T.F.; Little, J.C.; Nazaroff, W.W. Transport and sorption of volatile organic compounds and water vapor within dry soil grains. Environ. Sci. Technol. 1994, 28, 322–330. [Google Scholar] [CrossRef] [PubMed]
  16. Lin, T.F.; Loy, M.D.; Nazaroff, W.W. Gas-phase transport and sorption of benzene in soil. Environ. Sci. Technol. 1996, 30, 2178–2186. [Google Scholar] [CrossRef]
  17. Kim, J.Y.; Edil, T.B.; Park, J.K. Volatile organic compound (VOC) transport through compacted clay. J. Geotech. Geoenviron. 2001, 127, 126–134. [Google Scholar] [CrossRef]
  18. Osagie, E.I.; Cn, O. Investigation of mixture effects on the adsorption rates of aromatics from aqueous solution on clay and sandy soil. Chem. Sci. J. 2015, 6, 1–5. [Google Scholar]
  19. Cabbar, C.H.; Bostanci, A. Moisture effect on the transport of organic vapors in sand. J. Hazard. Mater. 2001, 82, 313–322. [Google Scholar] [CrossRef]
  20. Cotel, S.; Schäfer, G.; Barthes, V.; Baussand, P. Effect of density-driven advection on trichloroethylene vapor diffusion in a porous medium. Vadose Zone J. 2011, 10, 565–581. [Google Scholar] [CrossRef]
  21. Du, P.; Sagehashi, M.; Tarada, A.; Zhou, S.; Li, F.; Hosomi, M. Adequacy of a simple diffusion model to predict benzene behavior in soil. Soil Sci. Soc. Am. J. 2011, 75, 2147–2157. [Google Scholar] [CrossRef]
  22. Bekele, D.N.; Naidu, R.; Chadalavada, S. Influence of soil properties on vapor-phase sorption of trichloroethylene. J. Hazard. Mater. 2016, 306, 34–40. [Google Scholar] [CrossRef] [PubMed]
  23. Shonnard, D.R.; Bell, R.L. Benzene emissions from a contaminated air-dry soil with fluctuations of soil temperature or RH. Environ. Sci. Technol. 1993, 27, 2909–2913. [Google Scholar] [CrossRef]
  24. Ausma, S.; Edwards, G.C.; Gillespie, T.J. Laboratory scale measurement of trace gas fluxes from land farm soils. J. Environ. Qual. 2003, 32, 8–22. [Google Scholar] [CrossRef]
  25. Huang, C.W. Study on Particle Breakage of Sands Subjected to Various Confining Stress and Shear Strain Levels. Ph.D. Thesis, Tokyo Metropolitan University, Tokyo, Japan, 30 September 2015. [Google Scholar]
  26. Nakarai, K.; Yoshida, T. Effect of carbonation on strength development of cement treated Toyoura silica sand. Soils Found. 2015, 55, 857–865. [Google Scholar] [CrossRef] [Green Version]
  27. Simatupang, M.; Sukri, A.S.; Nasrul; Sulha; Putri, T.S. Effect of confining pressures on the shear modulus of sand treated with enzymatically induced calcite precipitation. IOP Conf. Ser. Mater. Sci. Eng. 2019, 615, 012042. [Google Scholar] [CrossRef]
  28. Kojima, T.; Saito, H.; Fukuda, K.; Takuma, Y.; Kato, S.; Satokawa, S. The influence of soil and organic matter on trichloroethylene decomposition by Fenton reaction. J. Chem. Eng. Jpn. 2009, 42, s23–s28. [Google Scholar] [CrossRef] [Green Version]
  29. Kimura, S.; Kaneko, H.; Ito, T.; Minagawa, H. Investigation of fault permeability in sands with different mineral compositions (evaluation of gas hydrate reservoir). Energies 2015, 8, 7202–7223. [Google Scholar] [CrossRef] [Green Version]
  30. Yokura, K.; Yamamoto, H.; Wu, Y. Crushing tests of soil particles by high pressure true tri-axial compression apparatus. Jpn. Geotech. Soc. Spec. Publ. 2015, 1, 51–56. [Google Scholar] [CrossRef] [Green Version]
  31. Siegrist, R.L. Volatile organic compounds in contaminated soils: The nature and validity of the measurement process. J. Hazard. Mater. 1991, 29, 3–15. [Google Scholar] [CrossRef]
  32. USEPA (United States Environmental Protection Agency). EPA On-Line Tools for Site Assessment Calculation. Available online: https://www3.epa.gov/ceampubl/learn2model/part-two/onsite (accessed on 12 February 2021).
  33. Mäki, M.; Krasnov, D.; Hellén, H.; Noe, S.M.; Bäck, J. Stand type affects fluxes of volatile organic compounds from the forest floor in hemiboreal and boreal climates. Plant Soil 2019, 441, 363–381. [Google Scholar] [CrossRef] [Green Version]
  34. Ingram, S.; Cai, C.; Song, Y.-C.; Glowacki, D.R.; Topping, D.O.; O’Meara, S.; Reid, J.P. Characterising the evaporation kinetics of water and semi-volatile organic compounds from viscous multicomponent organic aerosol particles. Phys. Chem. Chem. Phys. 2017, 19, 31634–31646. [Google Scholar] [CrossRef] [PubMed] [Green Version]
  35. Bartelt-Hunt, S.L.; Smith, J.A. Measurement of effective air diffusion coefficients for trichloroethene in undisturbed soil cores. J. Contam. Hydrol. 2002, 56, 193–208. [Google Scholar] [CrossRef]
  36. Gao, W.; Liu, F.; Chan, H. Gas phase effective diffusion coefficient of gasoline and characteristic components in dry fine sand. In Proceedings of the 2009 3rd International Conference on Bioinformatics and Biomedical Engineering, Beijing, China, 11–13 June 2009. [Google Scholar]
  37. Pandey, P.; Yadav, R. A review on volatile organic compounds (VOCs) as environmental pollutants: Fate and distribution. Int. J. Plant Environ. 2018, 4, 14–26. [Google Scholar] [CrossRef]
  38. Delle Site, A. Factors affecting sorption of organic compounds in natural sorbent/water systems and sorption coefficients for selected pollutants: A review. J. Phys. Chem. Ref. Data 2001, 30, 187–439. [Google Scholar] [CrossRef] [Green Version]
  39. Chiang, Y.C.; Chaing, P.C.; Huang, C.P. Effects of pore structure and temperature on VOC adsorption on activated carbon. Carbon 2001, 39, 523–534. [Google Scholar] [CrossRef]
  40. Baioni, E.; Porta, G.M.; Mousavi Nezhad, M.; Guadagnini, A. Assessment of turbulence effects on effective solute diffusivity close to a sediment-free fluid interface. Stoch. Environ. Res. Risk Assess. 2020, 34, 2211–2228. [Google Scholar] [CrossRef]
  41. Schaper, J.L.; Posselt, M.; Bouchez, C.; Jaeger, A.; Nuetzmann, G.; Putschew, A.; Singer, G.; Lewandowski, J. Fate of trace organic compounds in the hyporheic zone: Influence of retardation, the benthic biolayer, and organic carbon. Environ. Sci. Technol. 2019, 53, 4224–4234. [Google Scholar] [CrossRef]
Figure 1. Experimental system for vertical vapor-phase diffusive transport of VOC through soil sample.
Applsci 11 03489 g001
Figure 2. Vertical X-ray computed tomography slice images of upper and lower halves of columns packed with air-dried courser-grained and finer-grained silica sands.
Applsci 11 03489 g002
Figure 3. Schematic diagram representing the temperature changes in the dynamic temperature experiments.
Applsci 11 03489 g003
Figure 4. Changes in relative humidity (RH) and corresponding water flux, top and bottom benzene concentrations, and corresponding top and bottom benzene fluxes in (a) static temperature experiment Run 1 and (b) dynamic temperature experiment Run 2.
Applsci 11 03489 g004
Figure 5. Changes in RH and corresponding water flux, top and bottom benzene concentrations, and corresponding top and bottom benzene fluxes in the dynamic temperature experiments Run 2 and Run 3, respectively, with (a) coarser-grained silica sand and (b) finer-grained silica sand.
Applsci 11 03489 g005
Figure 6. Changes in RH and corresponding water flux, top and bottom benzene concentrations, and corresponding top and bottom benzene fluxes in the dynamic temperature experiments Run 2 and Run 4, respectively, using coarser-grained silica sand (a) at 10 wt% water content and (b) under air-dried condition.
Applsci 11 03489 g006
Figure 7. Changes in RH and corresponding water flux, top and bottom benzene concentrations, and corresponding top and bottom benzene fluxes in the dynamic temperature experiments Run 3 and Run 5, respectively, using finer-grained silica sand (a) at 10 wt% water content and (b) under air-dried conditions.
Applsci 11 03489 g007
Table 1. Silica sand, water content, and temperature in each experiment.
ExperimentSilica SandWater Content (wt%)Temperature
Run 1Coarser-grained10Static
Run 2Coarser-grained10Dynamic
Run 3Finer-grained10Dynamic
Run 4Coarser-grainedAir-dried (~0.3)Dynamic
Run 5Finer-grainedAir-dried (~0.3)Dynamic
Publisher’s Note: MDPI stays neutral with regard to jurisdictional claims in published maps and institutional affiliations.

