Article

Design Study of Steel Fibre Reinforced Concrete Shaft Lining for Swelling Ground in Toronto, Canada

Department of Earth Resources and Environmental Engineering, Hanyang University, Seoul 04763, Korea
*
Author to whom correspondence should be addressed.
Appl. Sci. 2021, 11(8), 3490; https://doi.org/10.3390/app11083490
Submission received: 29 January 2021 / Revised: 2 April 2021 / Accepted: 9 April 2021 / Published: 13 April 2021

Abstract

:
Reinforced concrete (RC) is a widely used construction material around the world. RC has many advantages in terms of structural stability. However, the reinforcement of RC requires extensive labour costs. Steel fibre reinforced concrete (SFRC) has been widely studied to replace steel bars in concrete structures over the decades. However, most underground structures, such as tunnel lining, are usually designed using conventional RC for long-term stability due to unexpected geotechnical characteristics, such as directional and depth-dependent varied lateral pressure, earthquakes, groundwater, and time-dependent swelling behaviour. In this paper, an alternative design of shaft structure using SFRC, based on the original RC designed data in the Toronto region, was studied to evaluate the feasibility of SFRC replacing conventional RC. A key geological feature of the site is that the bedrock is comprised of Georgian Bay shale, which exhibits long-term time-dependent deformation (TDD). The capacities of RC and SFRC for the shaft lining were calculated based on the Canadian concrete design codes CSA A23.3 and RILEM TC 162-TDF, to assess the benefit of adding steel fibre, and several analytical solutions were used to calculate the applied load on the lining. A specialised TDD constitutive model in Fast Lagrangian Analysis of Continua (FLAC) 2D was developed to estimate whether the optimum installation time of the shaft lining, based on the geological reports, is appropriate under swelling behaviour, and evaluate the resultant long-term stability. The calculated hoop thrust and bending moment for several loading cases were within the capacity of the SFRC shaft lining. The numerical analysis demonstrated that the proposed lining installation time could be reduced, despite consideration of the long-term TDD behaviour.

1. Introduction

Underground spaces have been developed to accommodate various types of infrastructure in congested urban areas. Underground structures are significantly different from superstructures because they are constantly subjected to various vertical/horizontal loading from surrounding ground, depending on geotechnical factors such as density, porosity, permeability, elastic modulus, Poisson’s ratio, rock strength, joint sets, depth, and groundwater [1,2,3]. In addition, accidental events, such as earthquakes, can cause structural problems to underground structures [4,5,6].
Vertical shafts are essential in order to access the tunnel level necessary for construction, ventilation, and maintenance purposes from the ground level. In general, shaft structures have been constructed in a circular shape to sustain the lateral pressure using the arching effect [7,8,9]. Generally, these shaft linings are predominantly loaded in compression with low flexural loading due to their circular shape. Therefore, in these cases, plain concrete linings are structurally adequate; however, most underground structures are designed with steel reinforcements to withstand the high bending moment from the varied lateral loads in different directions. Reinforced concrete (RC) has many advantages in terms of strength, durability, fire, and weather resistance, that make it ideal for usage in lining structures, especially in increasing cracking resistance, which is a weakness of concrete material [10,11]. However, the installation of RC lining in underground structures generally accounts for the largest portion of costs; it requires a longer construction time and generally exhibits low resistance to corrosion, and it can cause spalling and the associated loss of the structural capacity of the concrete [12,13,14,15]. Moreover, southern Ontario is known for its cold climates in winter; thus, there are many restrictions on construction works in winter in terms of labour cost, working efficiencies, and construction period [16].
Recently, many types of fibre reinforced concrete (FRC), including steel and synthetic materials, have been investigated to serve as a material that can partially or fully substitute for RC in structures [17,18,19,20,21,22]. In particular, steel fibre reinforced concrete (SFRC) is becoming increasingly used in structures because it has advantages over RC in terms of increasing cracking resistance and residual strength of cracked concrete due to the fibres bridging effect [23,24,25,26,27,28,29]. In general, the addition of steel fibres does not affect the compressive strength of the concrete [30], but provides a tensile capacity after the first crack occurs. In tunnelling works, steel fibres distributed throughout the lining strengthens the corner for the segmental lining in the TBM (tunnel boring machine) tunnel, resulting in enhanced durability [31,32]. Therefore, SFRC could replace the steel bars utilised in the traditional RC solution because the use of SFRC can lead to substantially increased productivity, while also reducing the construction cost and time [33,34,35,36,37,38].
The Hydro One Midtown Tunnel is an electric utility tunnel in Toronto, Canada that was designed 60 m below the ground with a length of 2.3 km. The vertical shafts were designed in Georgian Bay shale, which generally exhibits long-term rock stress release behaviour (swelling) [39]. The swelling behaviour of the bedrock can result in significant deformation of the linings over time, after the linings are installed. Thus, it was essential to estimate a substantial increase in the lining forces in the long-term, through experimental or numerical analysis. Geological Baseline Reports recommended that the shaft lining must be installed after permitting ground displacement for at least three months after shaft excavation [40]. The original design consists of a conventional RC lining with steel bars for the vertical shafts to accommodate for the swelling behaviour of the bedrock, based on the geological reports.
In this study, an alternative shaft lining design, using SFRC, has been studied by combining several design codes to consider the possibility of SFRC replacing the original RC in terms of theoretical and geotechnical approaches. There was no design code that fully integrated the use of steel fibres with the design of a segment concrete section [41]. For the use of steel fibres, several performance criteria are presented, including German guideline DVB, RILEM TC 162-TDF recommendations, Italian guidelines CNR-DT 204, Spanish code EHE-08, and FIB model code [42]. The capacities of RC and SFRC lining designs were compared based on the Canadian concrete design codes CSA A23.3, together with RILEM TC 162-TDF in this study [43]. Four loading cases were applied to evaluate the load on the shaft lining. Numerical analysis using Fast Lagrangian Analysis of Continua (FLAC) 2D, which is a continuum finite difference analysis code, was performed to assess the maximum unrestrained convergence of the shaft wall due to the long-term time-dependent deformation (TDD) of the shaley rock prior to lining installation. For this numerical analysis, the “swello” TDD constitutive model developed by the author was used to simulate the swelling behaviour of the Georgian Bay shale [44]. In addition, the numerical analysis was carried out to evaluate whether it is appropriate to install the lining 90 days after excavation, as initially recommended by geological studies, and to determine the mobilised lining forces along the shaft wall to estimate long-term stability.

2. Project Description

The Hydro One Midtown Tunnel project involved the construction of an electric utility tunnel to accommodate six high voltage cables carrying an additional 100 MW of power, sufficient to supply 25,000 homes. This project comprised of a 2.3 km-long tunnel between the existing Hydro One Birch Junction (on the west side of Yonge Street just north of the Canadian Pacific Railway (CPR) line) and Bayview Junction (at the south end of Bayview Heights Drive) substations, as depicted in Figure 1. A tunnel boring machine was used to excavate the 3 m-diameter tunnel in both directions, from a central mining shaft (to be located at the east end of Carstowe Road), to connect with the proposed terminal shafts (to be located at both ends of the tunnel). Three vertical shafts were designed for tunnelling work, and the shaft linings were initially designed as 400 mm-thick concrete reinforced with steel bars. The shafts were constructed through an overburden consisting of water-bearing soil, using a ground freezing technique as part of the temporary excavation support method.

3. Key Design Issues

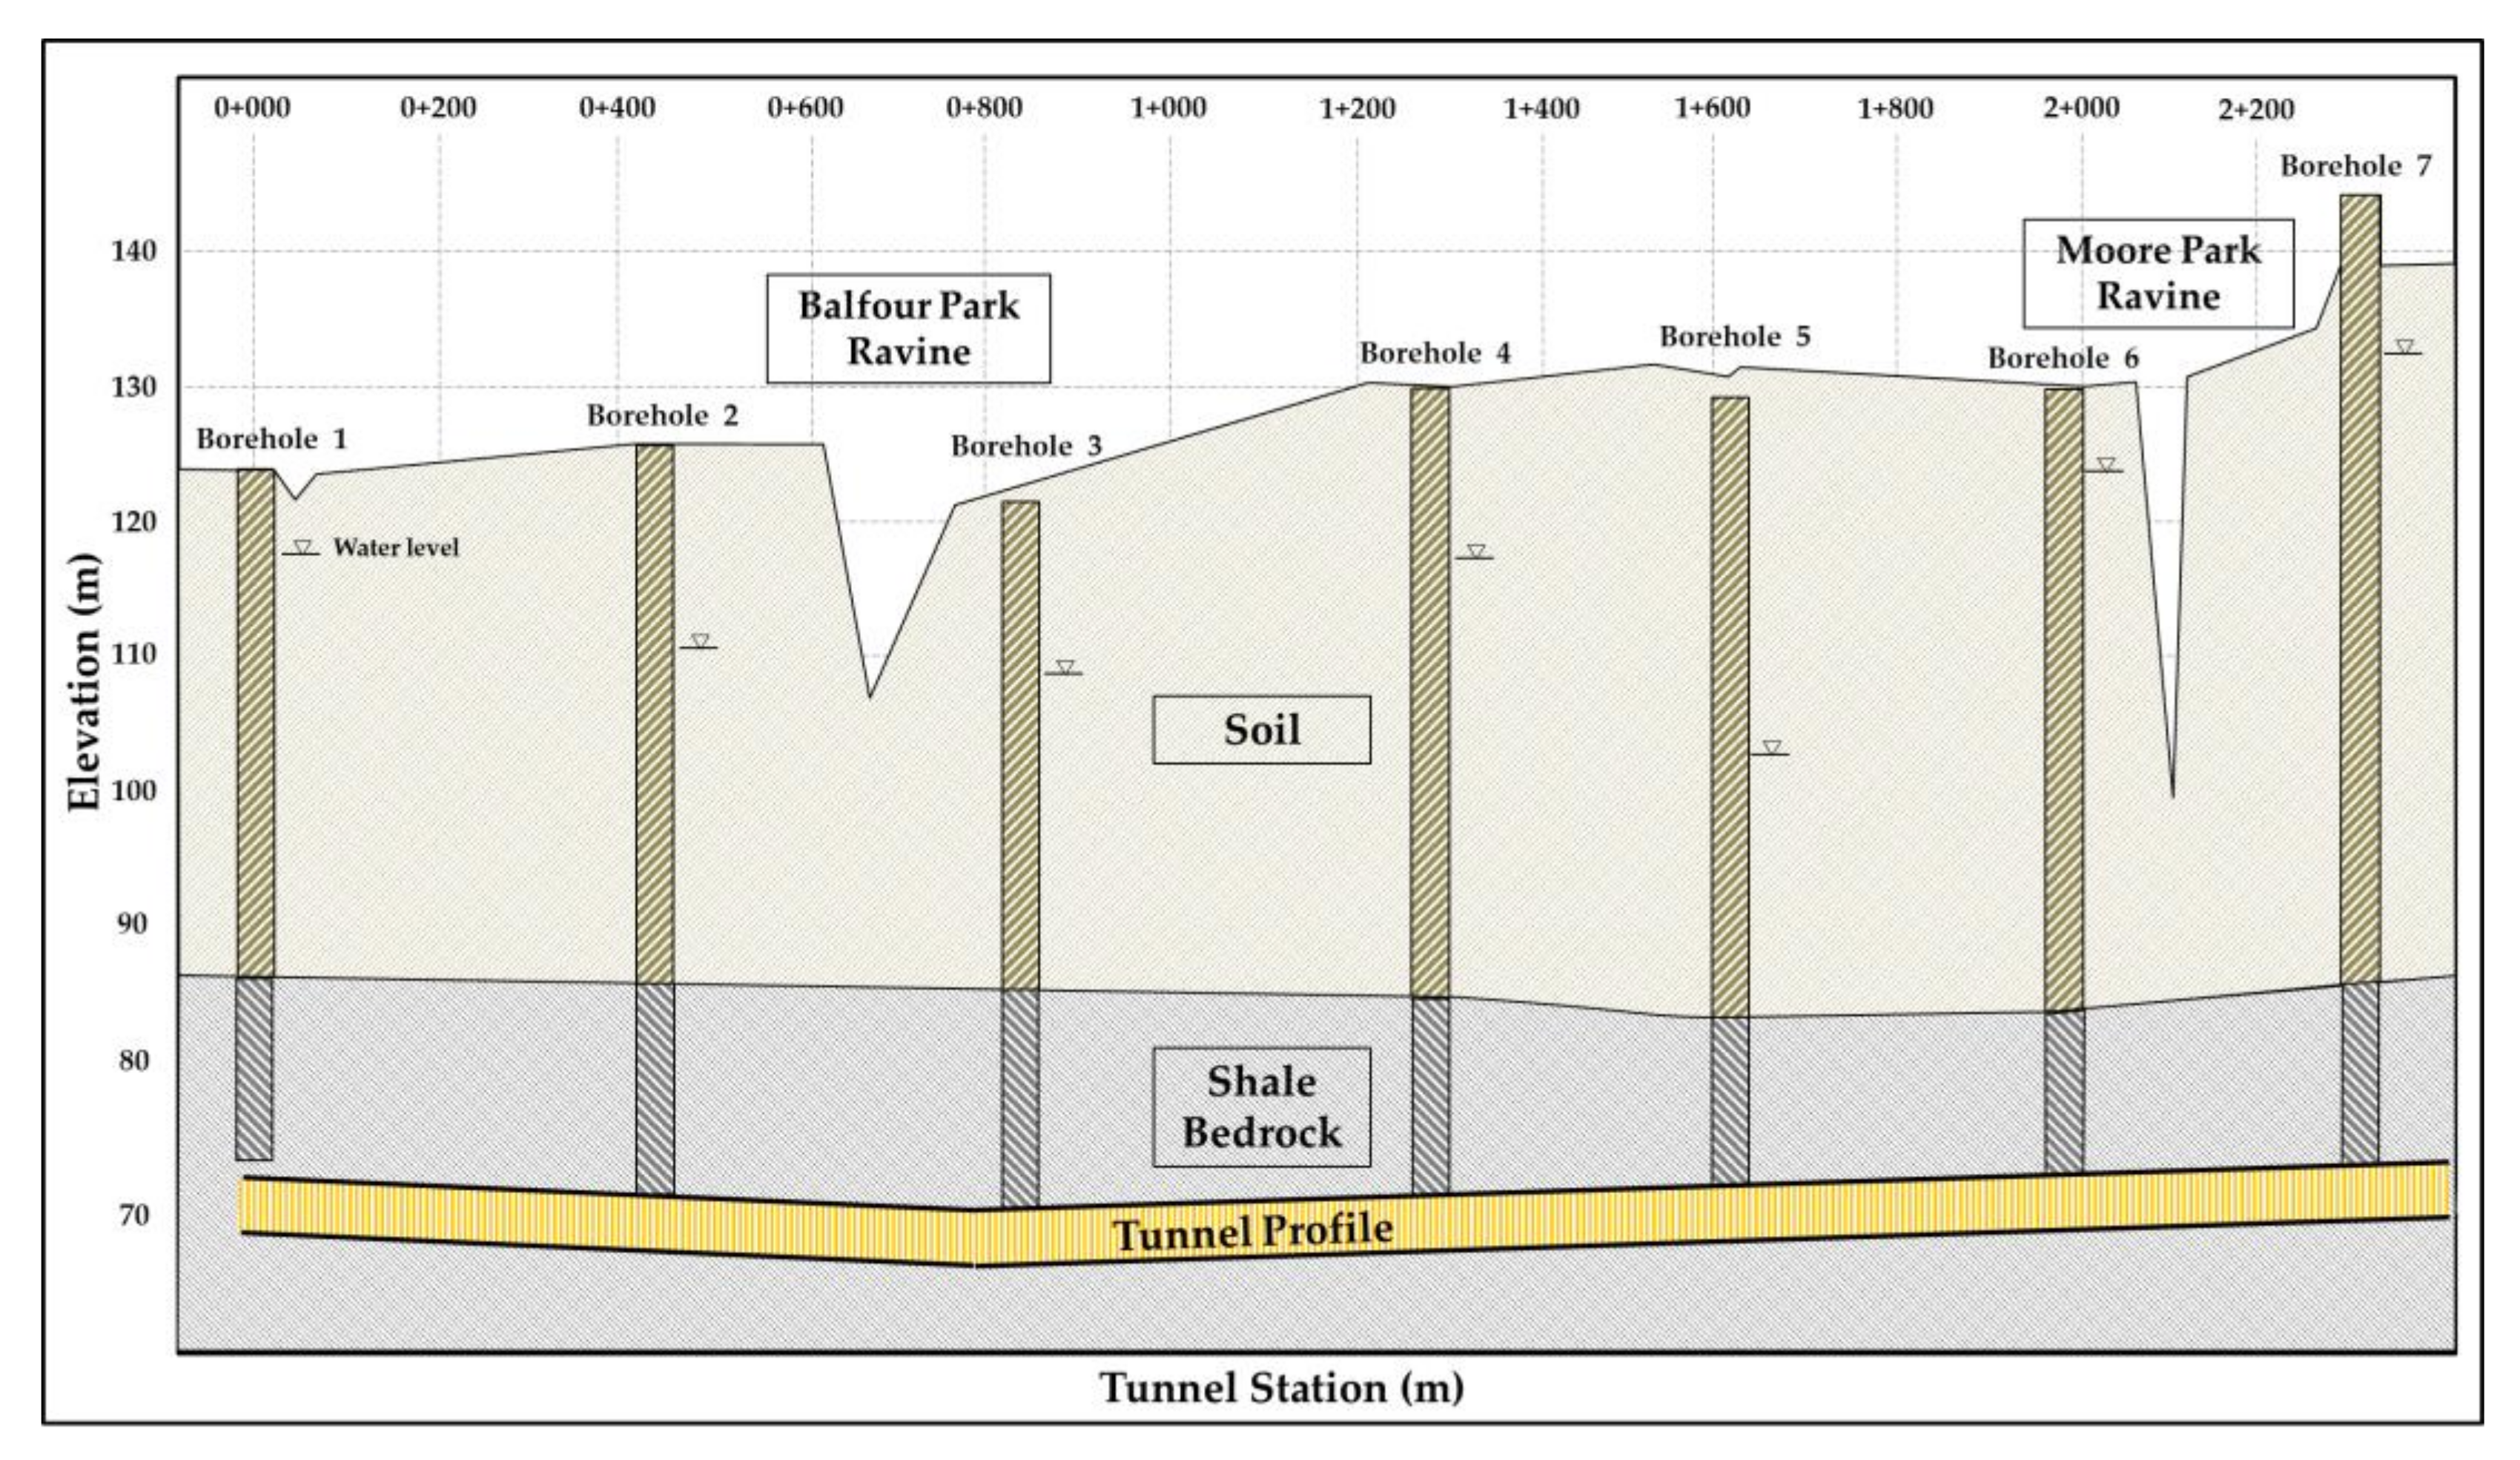
The bedrock below the city of Toronto is known for being comprised of Georgian Bay shale and contains inter-beds of significantly stronger limestone, siltstone, and sandstone. Additionally, it is reported that the bedrock exhibits long-term TDD behaviour when the shale experiences stress relief and is exposed to freshwater [39]. Therefore, a potential heave of the base and swell of the sidewalls of the shaft structure in the bedrock were anticipated. Geological studies for the projected area were conducted to establish the geotechnical baselines for the project, by describing the prevalent soil, bedrock, and groundwater conditions [40]. In consideration of the fully developed nature of the area and the presence of 20 and 30 m-deep ravines along the route, it was proposed to construct the tunnel entirely within the underlying shale bedrock, which lies at a depth of approximately 40–50 m to reduce the risk of impacts on the ground surface. Therefore, the tunnel was designed at a depth of 60–80 m to obtain sufficient unweathered fresh rock cover, as shown in Figure 2.
Various geotechnical laboratory tests were performed to evaluate the ground properties using retrieved rock cores from each borehole: (1) soil overburden testing to evaluate the water content, grain size, and atterberg limit, (2) bedrock strength testing to estimate unconfined compressive strength (UCS), (3) 100-days free swell tests of bedrock to investigate the swelling potential, (4) geophysics investigation to establish the elevation and variation in underlying bedrock. Standpipe piezometers with 31 mm diameter polyvinyl chloride (PVC) pipe were typically installed at the bottom of each borehole to estimate the groundwater level [45]. Based on the above laboratory tests, as a baseline condition, it was assumed that construction of a permanent shaft liner can only commence once the convergence monitoring results indicate that stable shaft convergence conditions have been achieved and a minimum period of 3 months have passed between shaft excavation and lining construction [40].

4. Structural Design of Lining

4.1. Theoretical Approaches for the Alternative Design Using SFRC

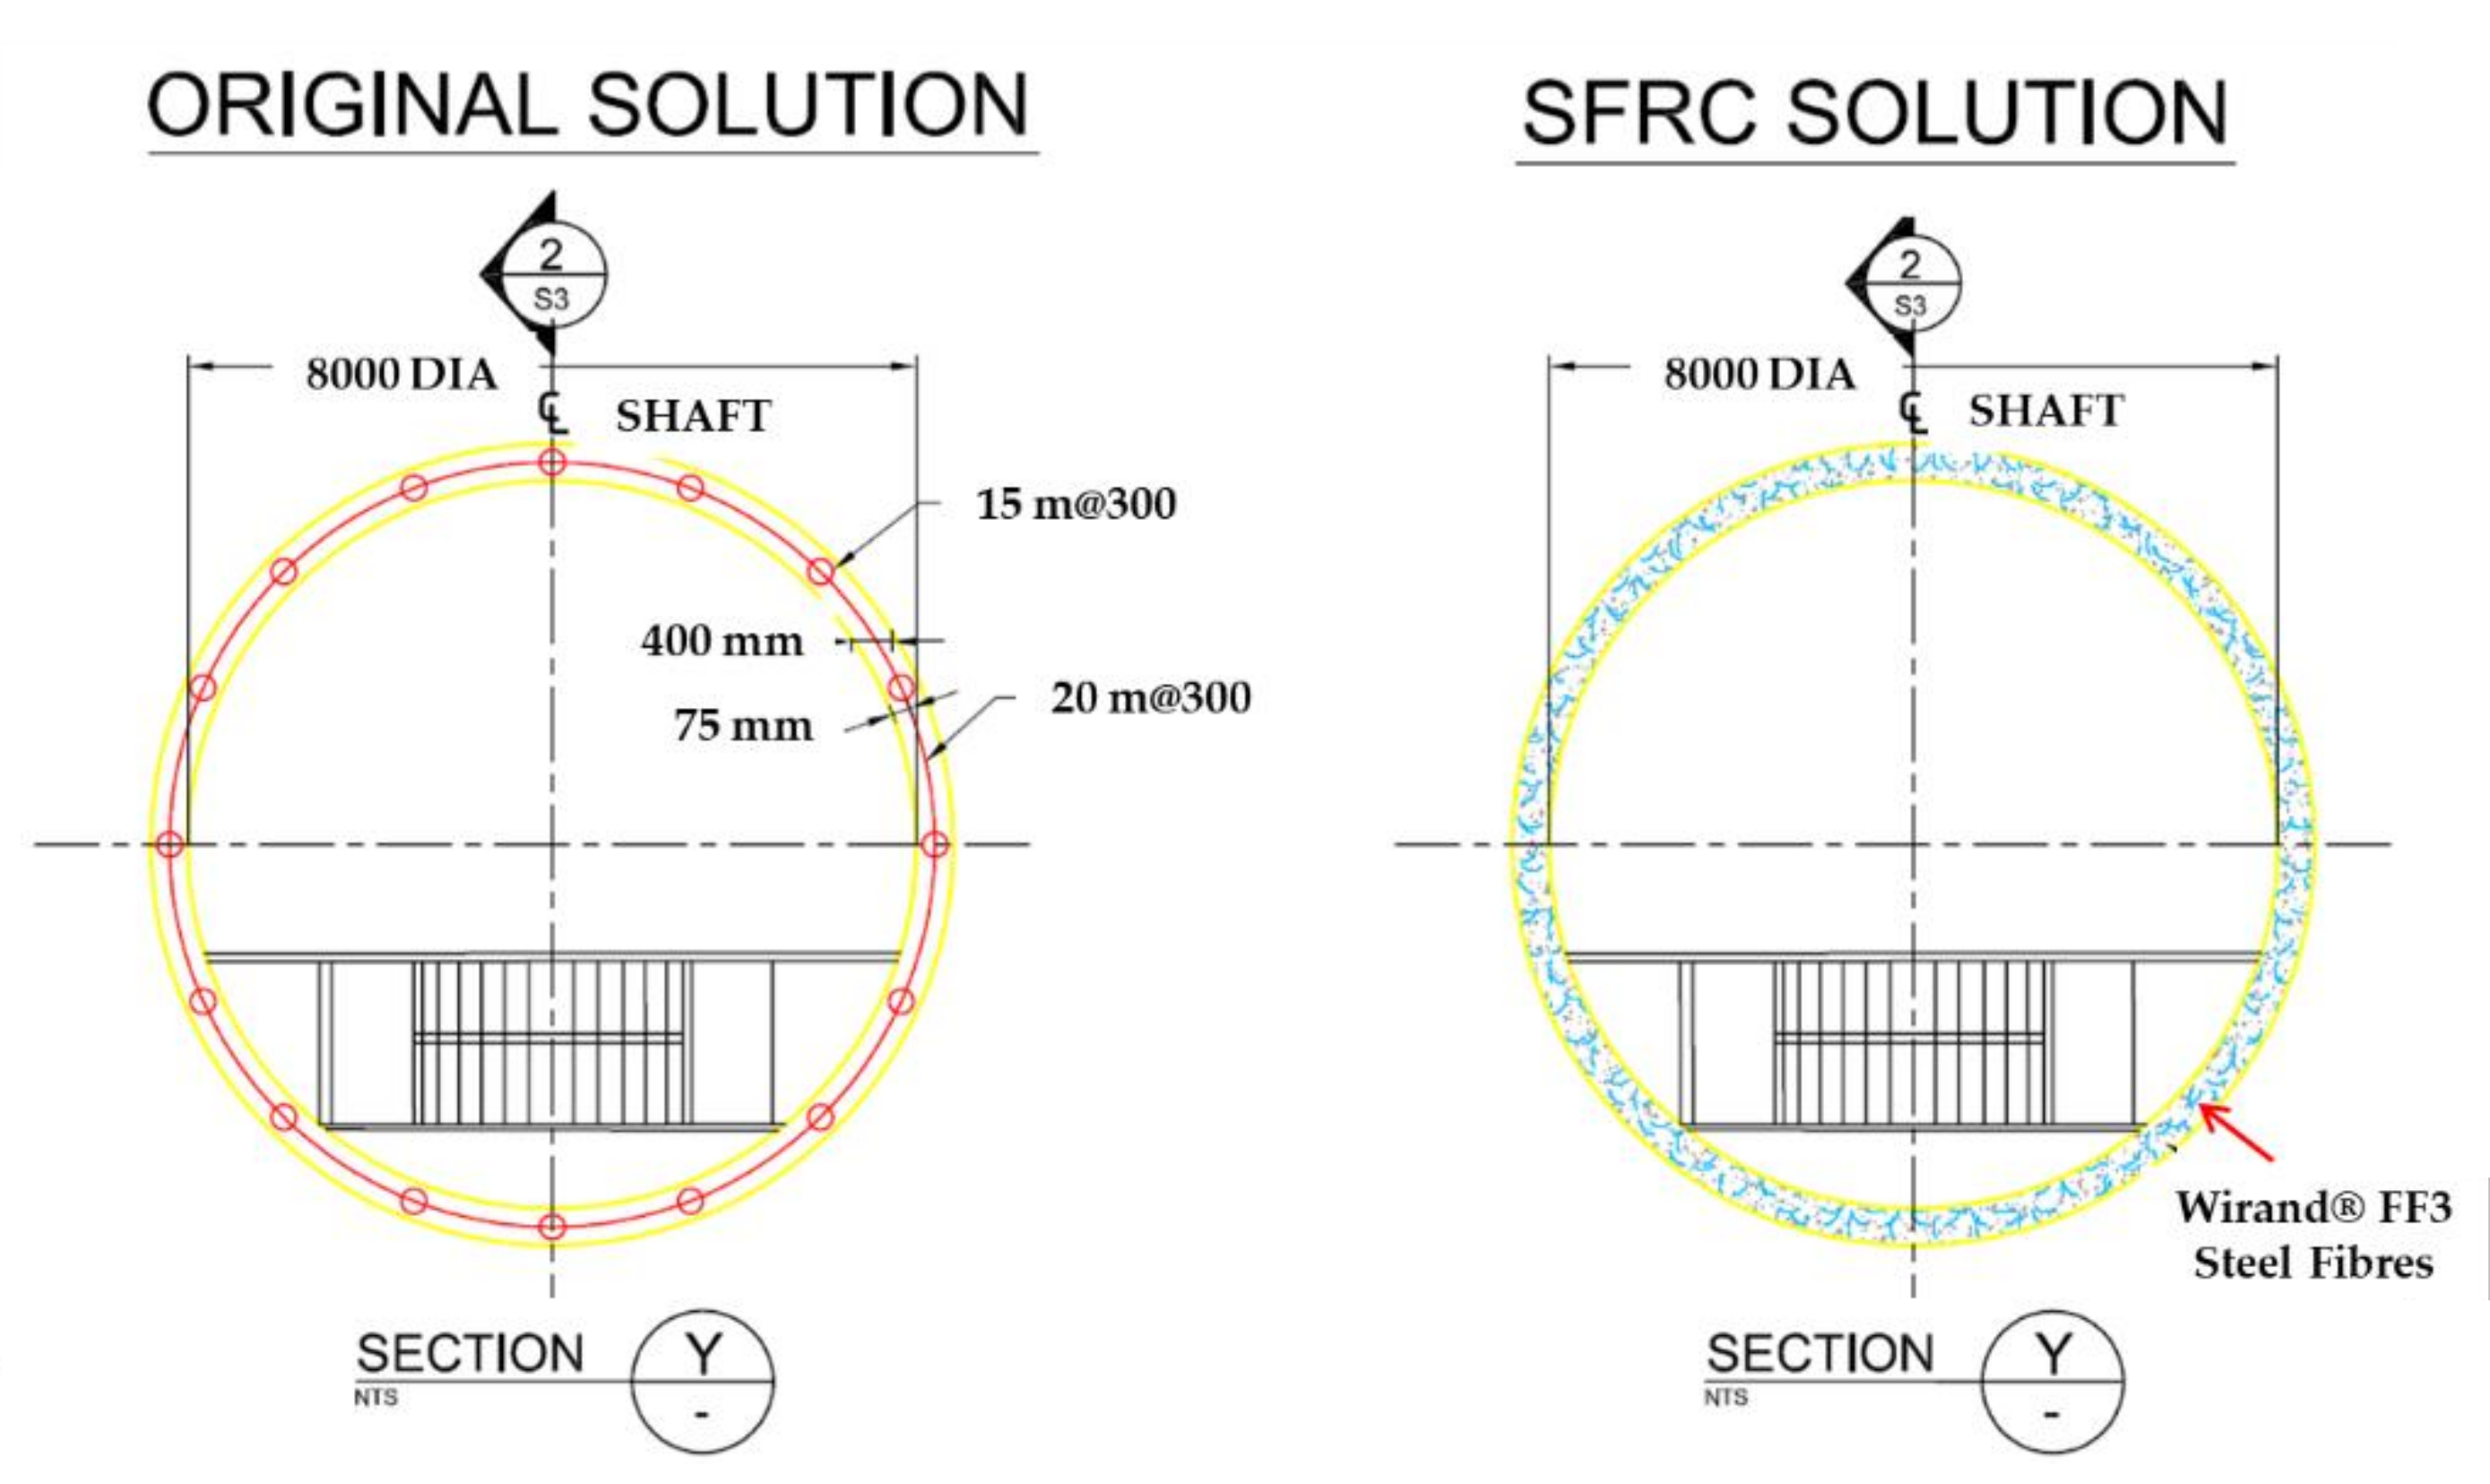
This section describes the methodology used to analyse the possibility of substituting SFRC for reinforcement bar in concrete solutions. The RILEM TC 162-TDF [43], which is based on the conventional design of standard RC, was used to generate a thrust-moment interaction curve. The bending tests on beams with three-points or four-points are generally used to evaluate the post-cracking behaviour of SFRC for precast segmental linings [46]. According to the RC design reports, the original design for the shaft included a 400 mm-thick RC lining with 20 mm and 15 mm-diameter radial and vertical reinforcements respectively, both spaced at 300 mm. The analysis was based on a rigid method [47], in which both materials acting in the ultimate state of resistance and ultimate capacity were compared. To evaluate the performance of the original RC design, its mechanical properties of RC under flexural and tension stress were assessed, and an equivalent structure using SFRC was proposed. The maximum flexural capacity of the traditional flat cross-section was calculated using the following formula (ACI 318-05) for simplified flexural capacity for a flexural member:
M r e s = 0.9 f y A S d
where M r e s is the flexural resistance for cross-section with reinforcement bar, f y is the ultimate tensile strength of the steel, A s is the steel area of reinforcement bar, and d is the depth of flexural reinforcement bar position. The performance of SFRC depends on the types of fibre, volume fraction, aspect ratio [48]; thus, in order to evaluate the performance of SFRC, two types of steel fibre were used. The volume fraction of steel fibres was chosen based on the literature review of previous research, and the dimensions and properties of the fibre are shown in Table 1 [41,49,50,51].
Rectangular cross-section flexural response in SFRC can be calculated using
M r = R e q b h 2 6
where M r is the resistant flexural moment and R e q is the equivalent resistance for fibre-RC obtained by the flexural test based on ASTM C1609, assuming the cross-section to be uniform and homogeneously reinforced, b and h are the base and thickness of cross-section, respectively.
To determine the equivalent resistance of the SFRC, the flexural test results for codes ASTM C1609 and UNI 11039 were considered, taking into account a first crack moment of 3.8–4.5 MPa, with a minimum ductility of 35–120% by a dosage of 0, 20 (0.25%), 30 (0.38 %), 40 (0.51%) kg / m 3 of Wirand®/MasterFiber® FF1 and FF3 fibres. The concrete specimens were made based on cast-in-place concrete specification section 03300 with compressive strength class of 35 MPa , and four-point bending tests were carried out with a closed-loop hydraulic testing machine by using crack mouth opening displacement (CMOD) as a control parameter. A linear variable differential transformer (LVDT) was used to measure the crack tip opening displacement (CTOD), and the test setup and geometry are shown in Figure 3.
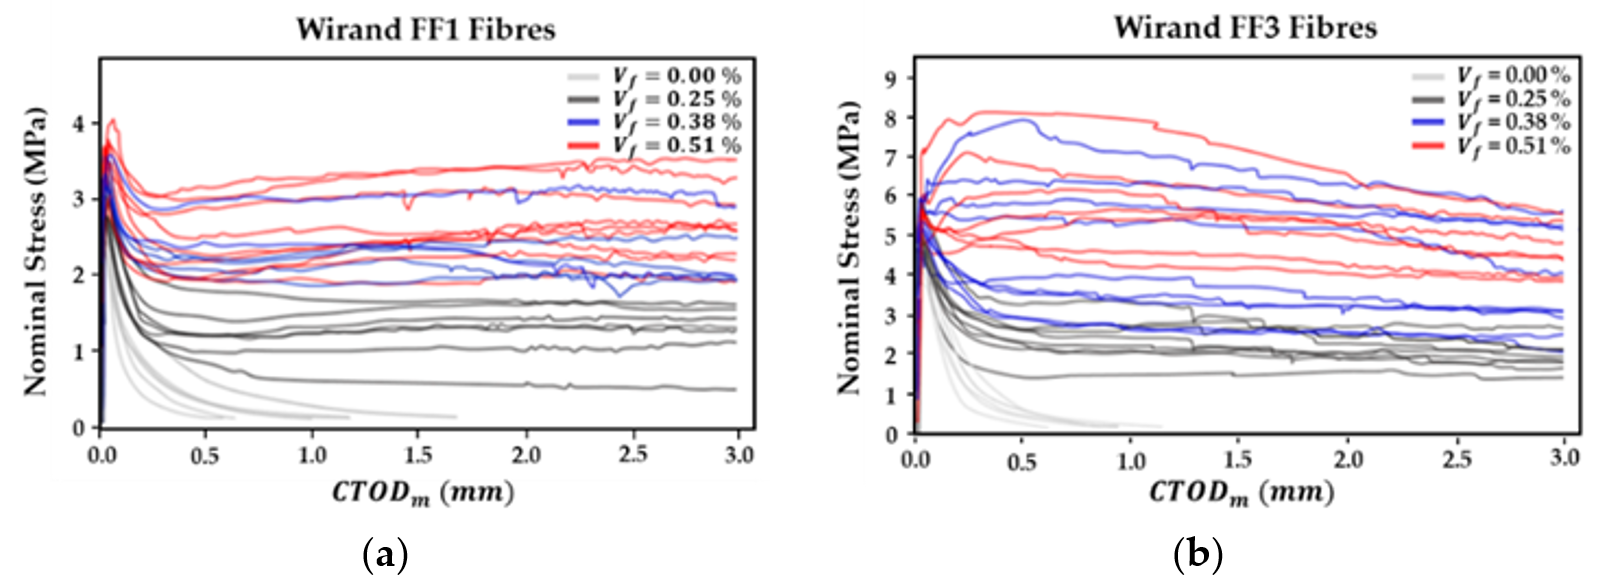
Figure 4 illustrated the nominal stress-crack tip opening displacement (CTOD) curves of SFRC for several types of fibre and dosage rates based on ASTM C1609/UNI 11039. Overall, plain concrete and SFRC for all fibre types demonstrated a similar trend with linear elastic behaviour up to the first-peak, and plain concrete and SFRC shows different behaviour after first-peak. Plain concrete showed brittle failure after the first-peak, while SFRC demonstrated ductile behaviour due to the bridging effect of fibres. The nominal stresses increased with increasing the volume of steel fibres for all cases, and the residual stresses also increased after the first-peak. The FF3 type of steel fibre showed significantly higher nominal stress than the FF1 type. In particular, the FF3 type showed a strain hardening characteristic with ultimate strength, and continued a softening behaviour after the hardening behaviour at a dosage rate larger than 0.38%. Therefore, the FF3 type of fibre with 40 kg / m 3 (0.51%) was chosen as alternative reinforcement material for the concrete section, and the calculated moment resistances for RC and SFRC based on the tests are shown in Table 2.
In order to determine the tensile capacity of the critical cross-section for the original design with reinforcement bar, the tensile strength of concrete was not considered based on the CSA A23.3 and literature reviews [52,53]; it can be assumed that
T = 0.9 ( f y A S )
where T is the tensile force, f y is the steel ultimate tensile strength, and A s is the steel area of reinforcement bar. CNR-204 was used to evaluate the SFRC solution in tension. This code proposes the tensile behaviour of SFRC by dividing it into a linear-elastic model, represented by a stress-deformation perspective and a plastic-rigid model, represented by a stress-crack perspective. For the linear-elastic model, the behaviour of strain softening and strain hardening is presented separately. The main characteristic of this code is not the use of residual flexural tensile strength used by the RILEM code, but the use of equivalent flexural tensile strength. It is required to be calculated from a uniaxial tensile test based on a four-point bending test or UNI 11039/11188. The linear elastic model identifies two reference values, SFRC service residual tensile strength ( f F t s ) and SFRC ultimate residual tensile strength ( f F t u ), and can be defined through equivalent values of flexural strength, using the following equations:
f F t s = 0.45 f e q 1
f Ftu = k f Fts w u w i 2 f F t s 0.5 f e q 2 + 0.2 f e q 1 0
where f e q 1 and f e q 2 are the post-cracking equivalent strengths, which are useful for the serviceability limit states (SLS) and ultimate limit states (ULS), respectively. The coefficient k is assumed to be a cross-section, fully subjected to tensile stresses. The parameter w u is the ultimate crack opening value and w i 2 is the mean value of the crack opening at the endpoints of the interval. The calculated tensile forces capacity for RC and SFRC are summarised in Table 3.
Based on the theoretical and experimental approaches, the final proposed concrete solution using steel fibres is the 35 MPa -grade concrete, reinforced with 40   kg / m 3 of Wirand® FF3 steel fibres, conforming to ASTM A820 and ASTM C1116, as depicted in Figure 5.

4.2. Design of Shaft Using SFRC

The capacity of the lining can be determined by plotting an interaction diagram by calculating the bending moment and hoop force values. The lining design was based on a shaft diameter of 8 m with a 400 mm-thick lining of 35 MPa-grade concrete. The RC and SFRC lining capacities were derived based on the Canadian concrete design code CSA A23.3, using the RILEM method [43] for the SFRC lining. Four different methods with uniform and non-uniform loading cases were adopted to calculate the applied load on the shaft lining.
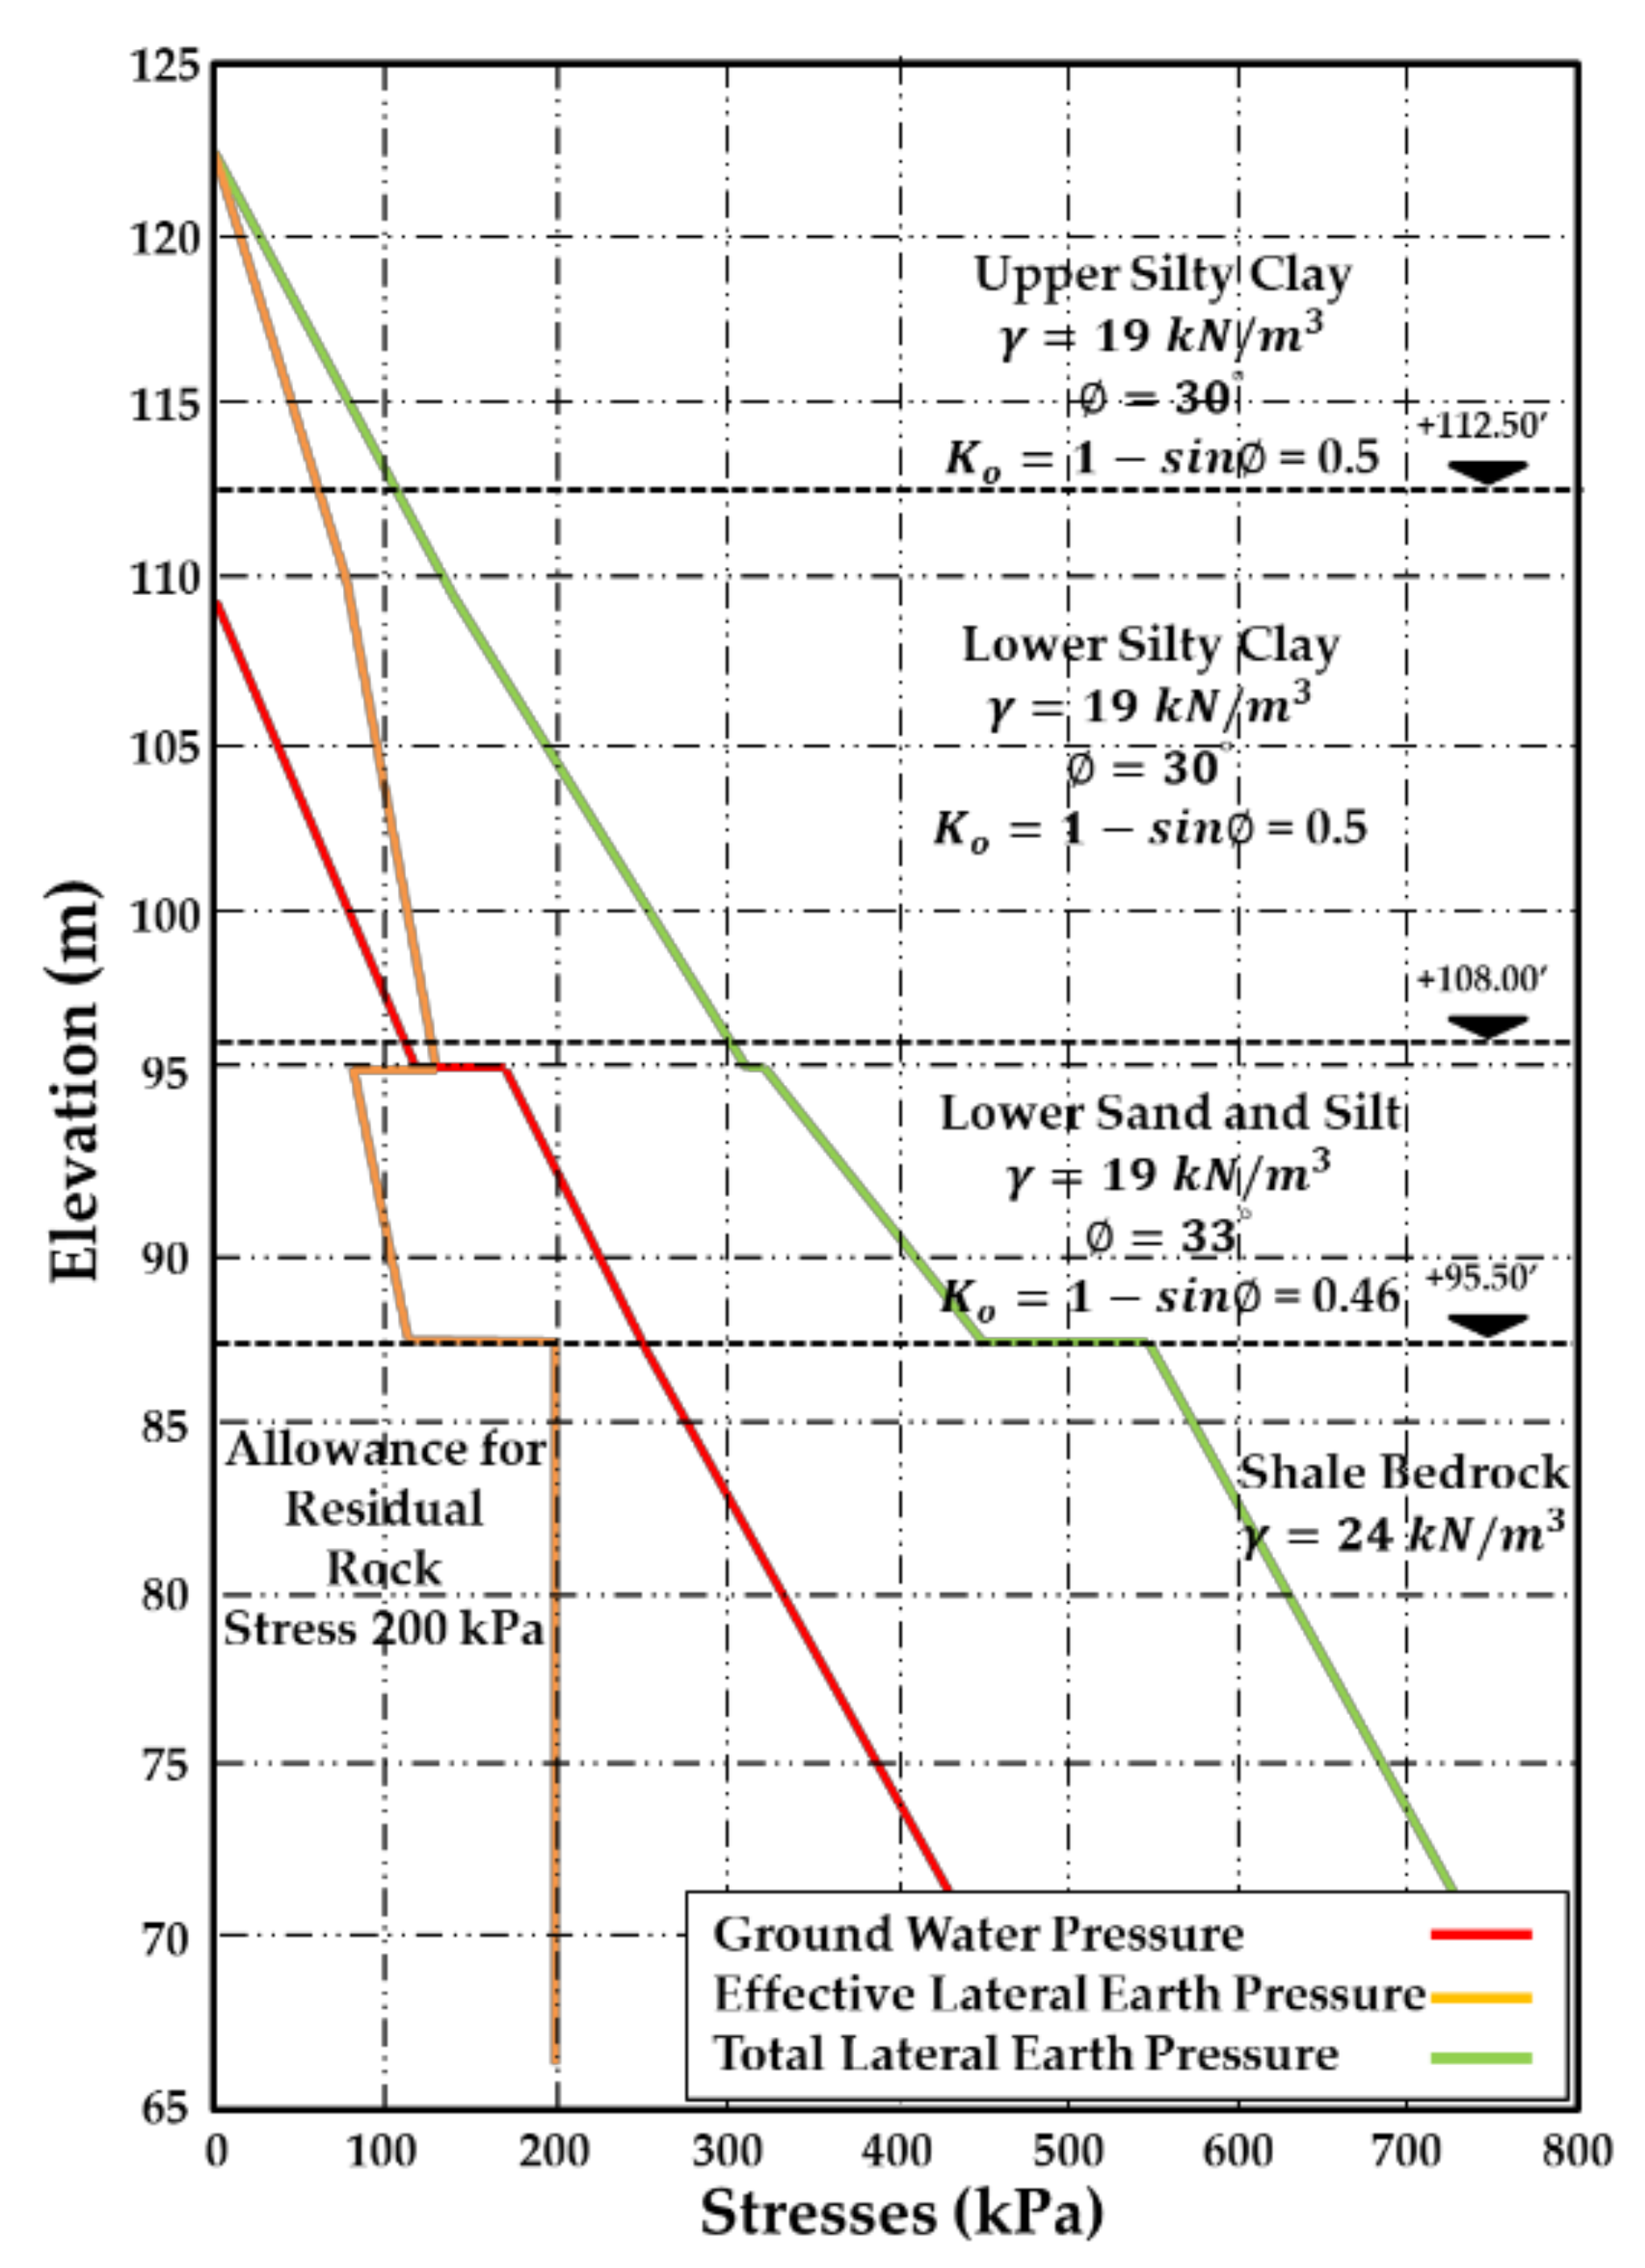
The loading conditions from the soil and groundwater are depicted in Figure 6. The standard penetration test (SPT) is a widely used subsurface exploration geotechnical in-situ test method to measure the bearing capacity of the ground, and the total blow count number required to penetrate the 30 cm-depth becomes the standard penetration resistance (N-value). The modulus of the ground was calculated as 4 N for silts, silty sands, and a slightly cohesive mixture of soil with an N-value of 30 taken from Figure 2, which indicated that the lowest N-value of the interpreted stratigraphy was in the range of 30–40. The maximum lateral pressure exerted on the shaft in the soil layers was calculated from the soil densities and friction angles presented in the geotechnical baseline report with K o calculated as 1 sin (Load Case 1). The load factor was 1.4 for the ultimate limit state (National Annex to BS EN 1990:2002) and Load Case 1 was calculated using Equation (6):
N = P gw + P soil × r × L . F .  
where N is axial force, P gw is groundwater pressure, P soil is soil pressure, r is radius of tunnel, and L . F . is load factor. The load from a residual 200 kPa rock swelling pressure was applied to the lining below the shale bedrock level (Load Case 2). The total load from the rock swelling pressure in addition to the water pressure at the deepest shaft level was plotted against the capacity in the interaction diagram and calculated using Equation (7):
N = P gw + P swell × r × L . F .  
where N is axial force, P gw is groundwater pressure, P swell is rock swelling pressure, r is radius of tunnel, and L . F . is load factor.
A non-uniform loading case (Load Case 3) was considered as an extreme case and was based on the assumption that the full soil and groundwater pressures were present on only one side of the shaft, with 80% ground loading and 100% water pressure on the other side. The bending moment of the lining has been assessed by the Duddeck and Erdmann equation; it is based on the closed-form solutions to estimate the ground-structure interaction for circular tunnels [54]. This model was assumed to be in a continuous elastic environment under plane strain conditions; therefore, it does not consider any volume lost or relaxation of the ground. The equations shown in Table 4 are generally used for low-stress levels and enable either tangential slip, or full bonding between the lining and ground. The calculations employ the full bonding assumption between the lining structure and surrounding ground.
The seismic loads (Load Case 4), as detailed in the Ontario Building Code assuming a Class B site, were considered separately for the shaft. The maximum deflection from the seismic loads was assessed as below:
γ = V s C se  
where V s is peak wave velocity and C se is shear wave velocity. Based on the Ontario Building Code, the shear wave velocity ranges from 760 to 1500 m / s , and peak wave velocity is 0.8 m / s . The induced radial displacement from the seismic loads is calculated as below:
D e = 2 γ 1 γ D
The mobilised maximum bending moment from the seismic loads can be calculated as below and added to the uniform load in Cases 1 and 2:
M = D e 2 EI R 2 Morgan
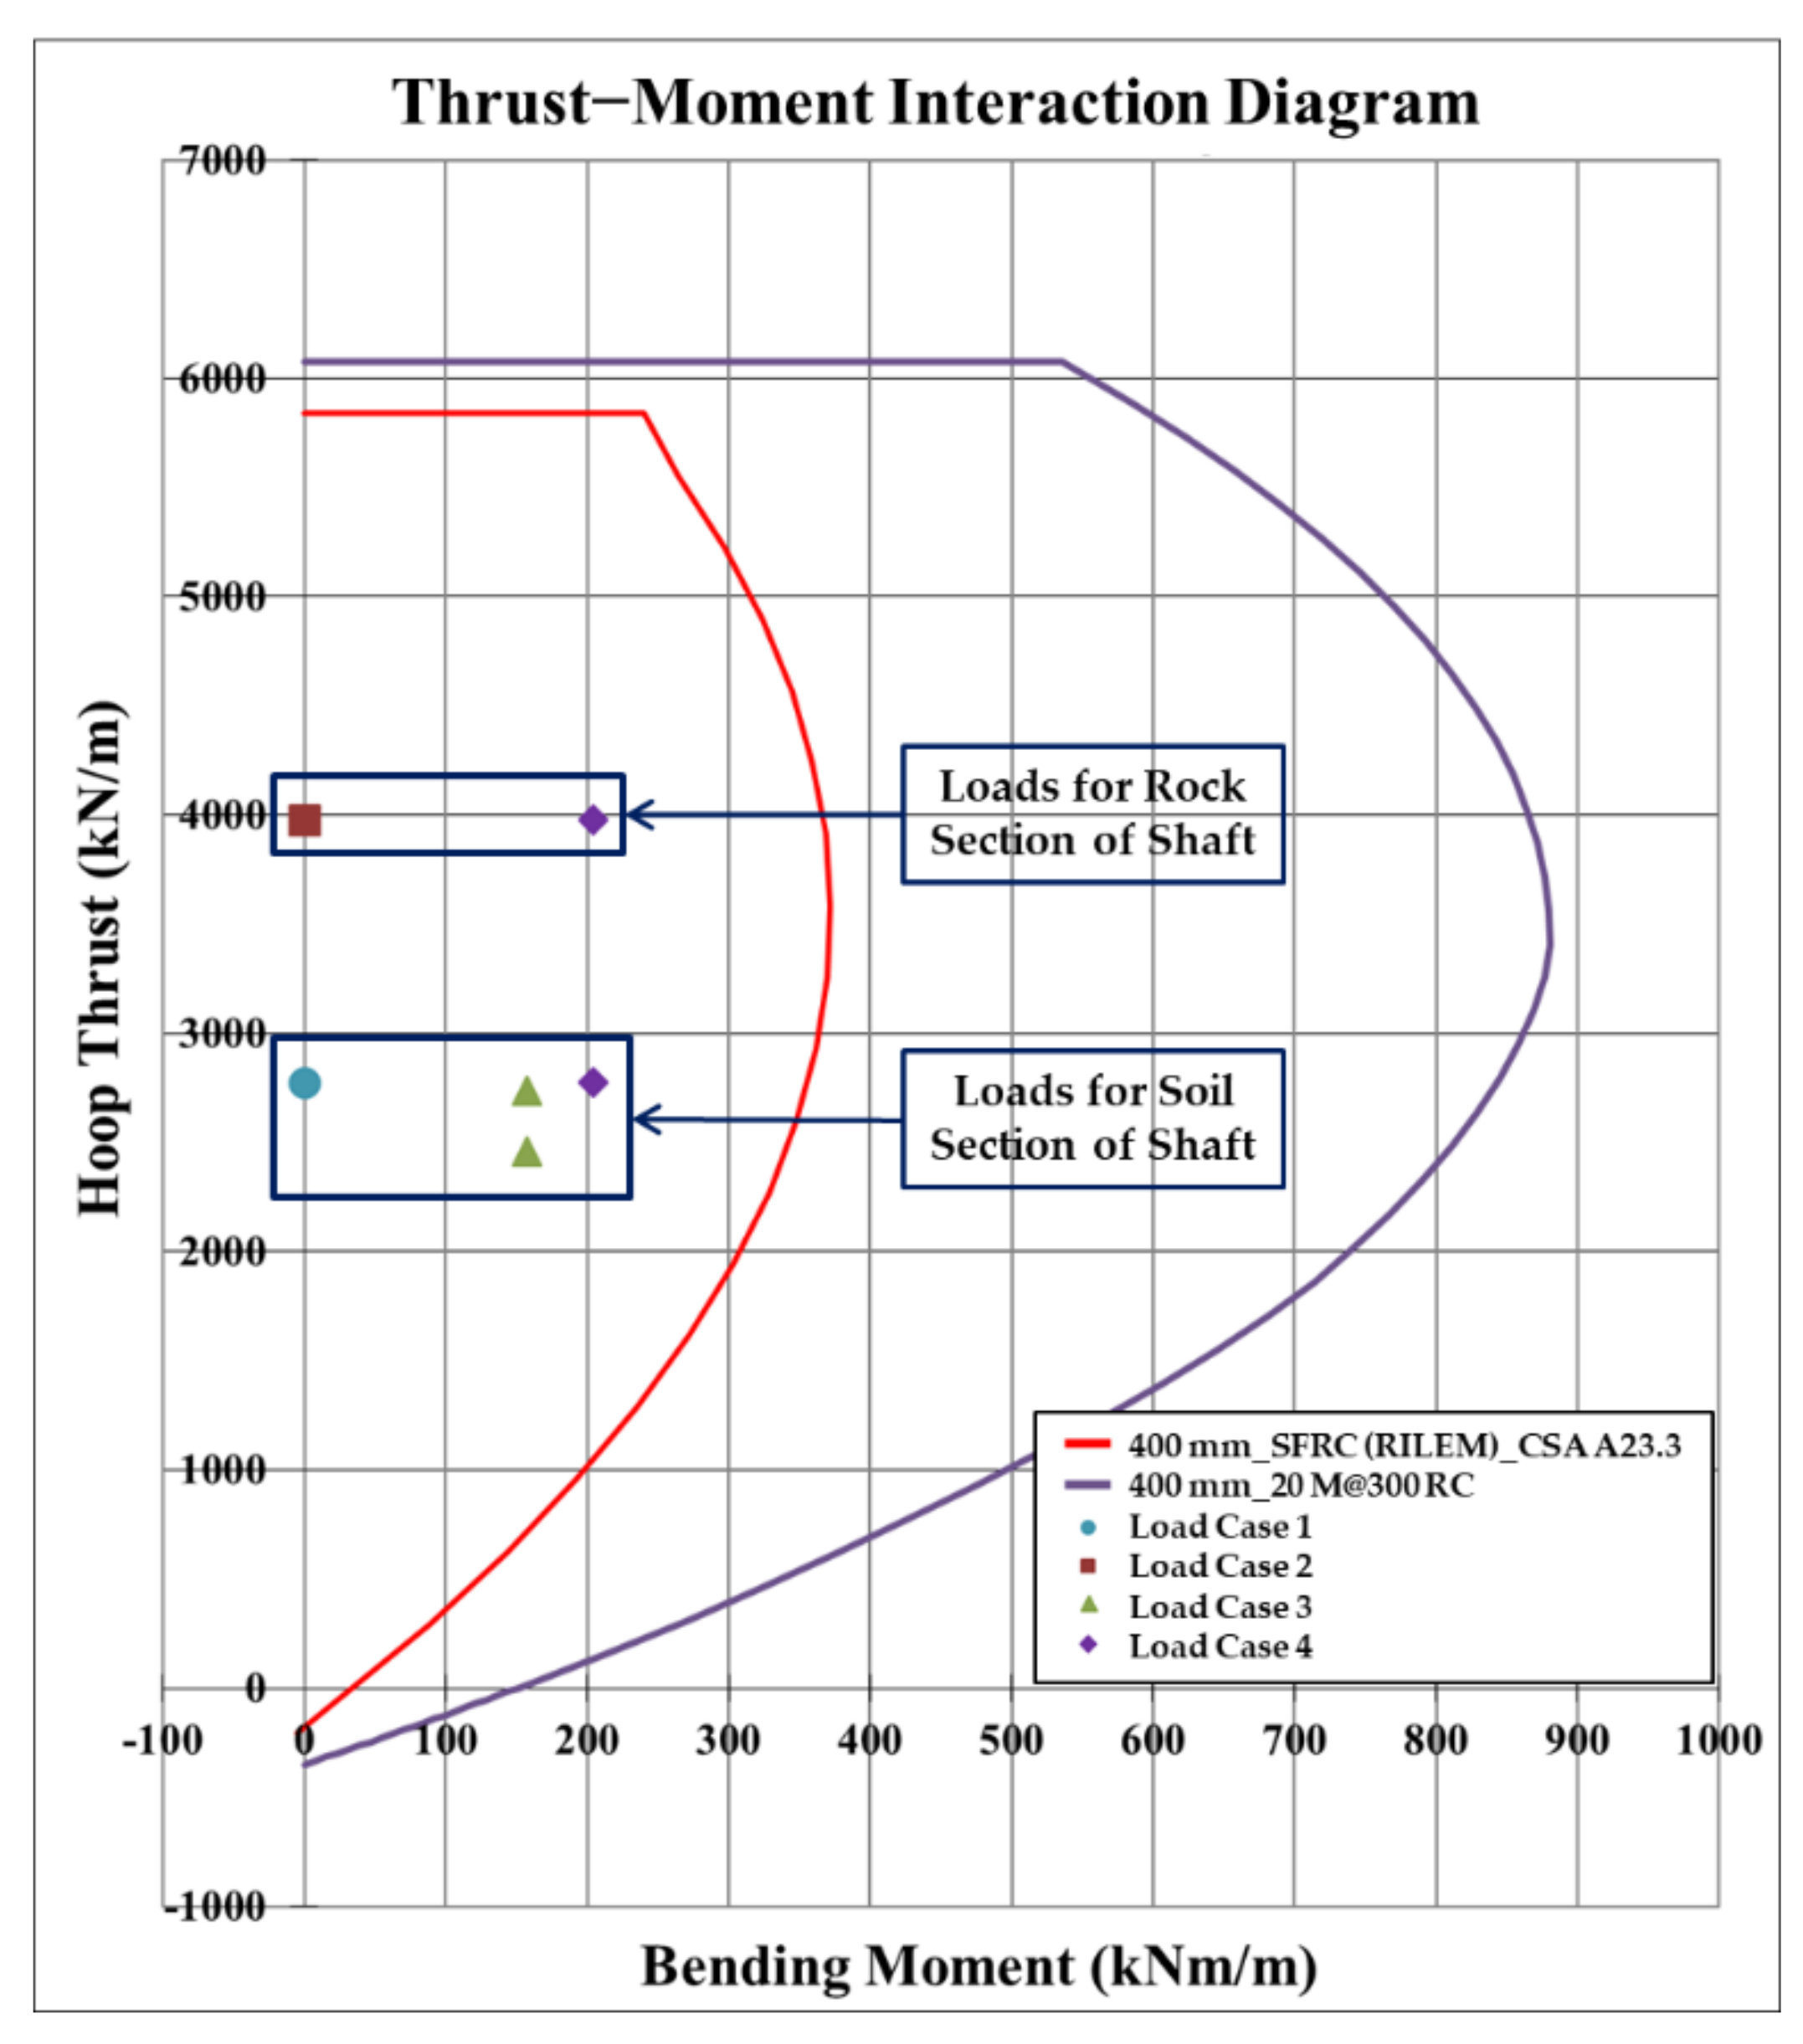
The lining capacity envelope can be determined by plotting an interaction diagram, and the interaction diagram is plotted by calculating the bending moment and hoop force values. This gives a parabolic curve, which defines the limit of the concrete lining capacity. Three possible cases can be defined after the determination of design loads in the interaction diagram. If the load case coincides with the interaction diagram curve, it represents the limit state. In addition, values plotted inside the capacity curve indicated that the lining was structurally within the section capacity, whereas values plotted outside of the capacity curve indicated that it is estimated as insufficient to this criterion and considered unsafe [55]. Figure 7 illustrates the capacity curves for RC and SFRC lining, calculated from the spreadsheet, to check the structural capacity of designed linings. It was apparent that RC demonstrated relatively high hoop thrust and bending moment capacities. SFRC had an axial load corresponding to RC, it is estimated that the compressive strength of SFRC is not affected by the fibres. In addition, SFRC showed a bending moment of up to about 380 kNm / m , even without reinforcement steel bars, it is estimated that the steel fibres improved the cracking resistance and residual strength of the concrete. The interaction diagram also depicts the final design force/moment combinations for the four cases considered; these combinations were based on the deepest soft ground and bedrock sections. The maximum lateral loads for the shaft in soil layers and shale bedrock were 2772 and 3979 kN , respectively. The factored maximum and minimum design hoop loads derived from the Duddeck and Erdmann equations were 2738.3 and 2455.7 kN / m , respectively, and the maximum bending moment was 157.2 kNm / m . The mobilised maximum bending moment, due to the seismic loads and based on the Ontario Building Code, was 204 Nm / m , as plotted in the interaction diagram depicted in Figure 7. All the lining forces from both rock and soil under the uniform, non-uniform, and seismic loading cases were within the capacity of the 400 mm SFRC lining. Therefore, it is estimated that the alternative SFRC lining possessed sufficient capacity and can replace the traditional reinforcement in the shaft lining for the Hydro one Midtown Tunnel.

5. Numerical Analysis

5.1. Analysis Method and Input Data

The numerical analysis was performed to investigate whether the recommended installation timing of the shaft lining is appropriate under the swelling behaviour of Georgian Bay Formation bedrock [40]. In addition, the long-term stability of the shaft lining installed 90 days after excavation was assessed. The Fast Lagrangian Analysis of Continua (FLAC) 2D, two-dimensional continuum explicit finite element analysis code developed by Itasca consulting group Inc., was used. This software has been widely used for geotechnical analysis application in the fields of civil mining engineering [56,57,58].
A user-defined time-dependent deformation (TDD) constitutive model developed by the author, specifically for Georgian Bay shale, was used with a creep process in FLAC 2D to simulate the swelling behaviour of the bedrocks [44]. This constitutive model, based on the Mohr-Coulomb elastic/perfectly plastic material model, is derived from observations in the laboratory experiments that the swelling strains in the principle swelling directions of a shaley rock specimen increase linearly with the logarithm of time, and the swelling strains are reduced in both the parallel and perpendicular directions by the application of stress on the rock specimen [59,60,61,62,63].
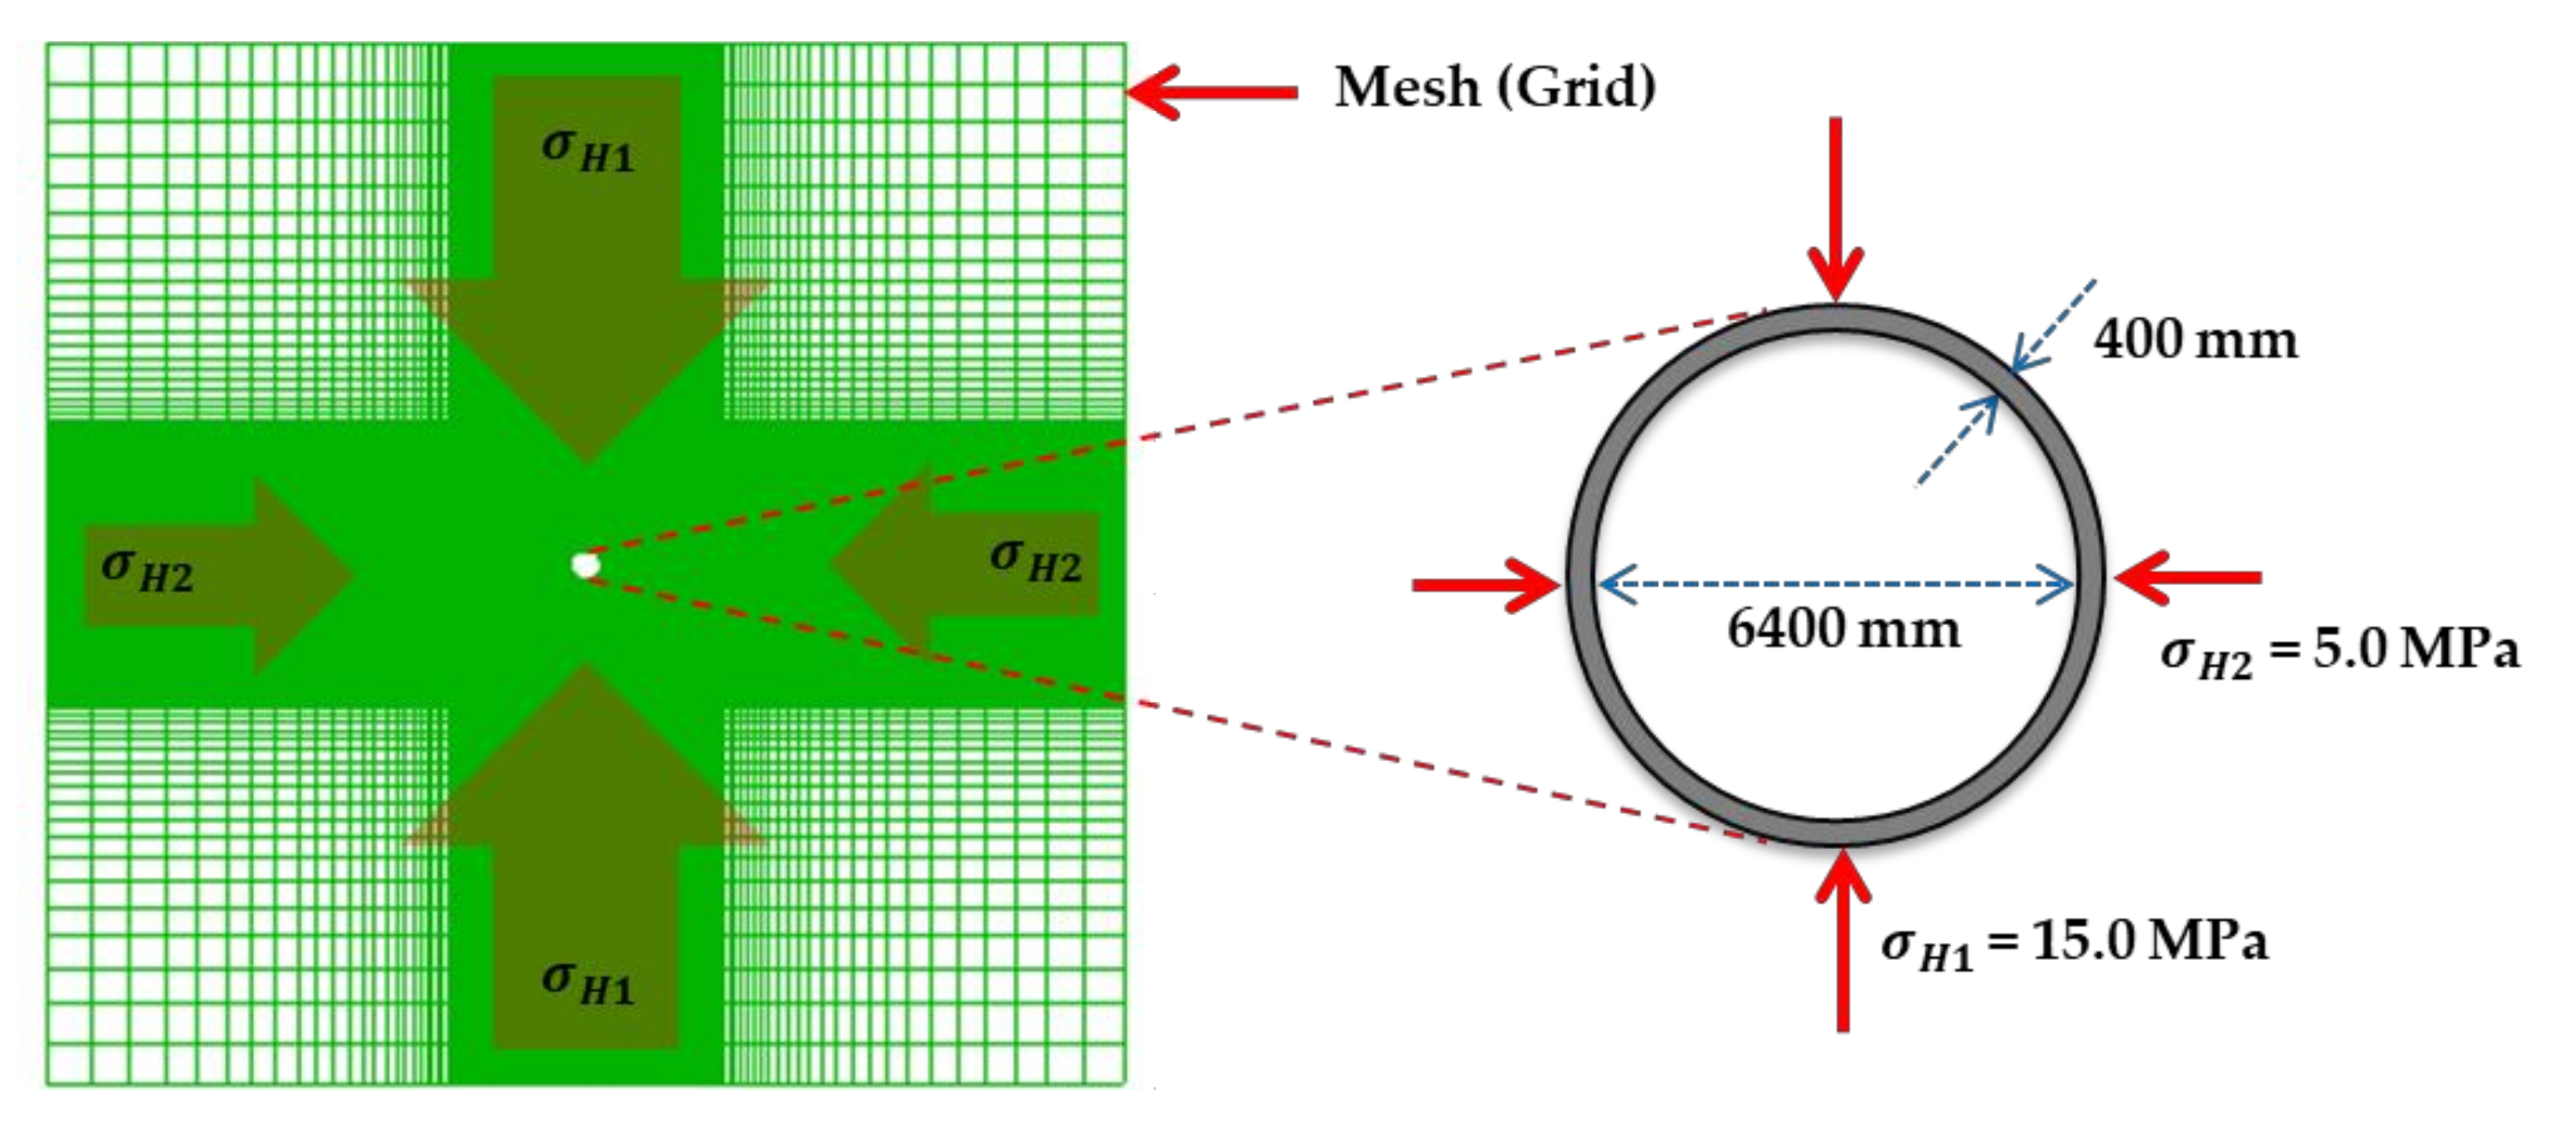
The geotechnical parameters required for numerical analysis in the FLAC model were derived from geological reports, lab test results, and historical project data from around the proposed Toronto region. It is known that the shaley bedrock in the Southern Ontario region in Toronto shows high horizontal in-situ stresses. The maximum and minimum vertical stresses at the bottom of the excavation (70 m-deep) determined by the weight of overburden and the maximum and minimum horizontal stresses were 15.0 and 5.0 MPa , respectively, based on the geological baseline report [40]. The estimated parameters applied in the numerical analysis are summarised in Table 5.
First, the initial ground and circular shape of the shaft boundary were modelled using the mesh (green cross lines) generation technique to divide a component into a large number of finite elements, as depicted in Figure 8. For computational efficiency, fine mesh was used around the shaft, which is the region of interest, while a coarser mesh was used other regions. The model boundaries were set to at least four times the excavation dimensions of the shaft wall to minimise the boundary effect. The maximum and minimum in-situ horizontal field stresses were initially applied to the ground. Joints and dilation of rock were not considered in this analysis, and surcharge loads also were not considered because the vertical stress includes both the soil and rock overburden stress depending on the depth. Adequate drainage during the construction process was assumed to relieve any hydrostatic pressures within the rock joints. The effect of the long-term groundwater pressure was included in both the in-situ stress condition and the modelling of the shaft excavation. After the initialisation of the model, the entire shaft was excavated in one stage, and surrounding rock mass was modelled left to freely deform elastically with swelling behaviour for 90 days. After the relaxation of the ground, the shaft lining was installed. The shaft linings were subjected to the stresses because of the swelling behaviour and field horizontal stresses. The concrete lining is considered as a linear-elastic material. The mobilised lining forces were analysed for 100-years to assess the long-term TDD-related pressure on the shaft walls. The shaft wall was designed for a 200 kPa TDD loading, and a Mohr-Coulomb elastic/perfectly plastic failure criterion was applied to the intact rock mass.

5.2. Results of Inward Wall Movement

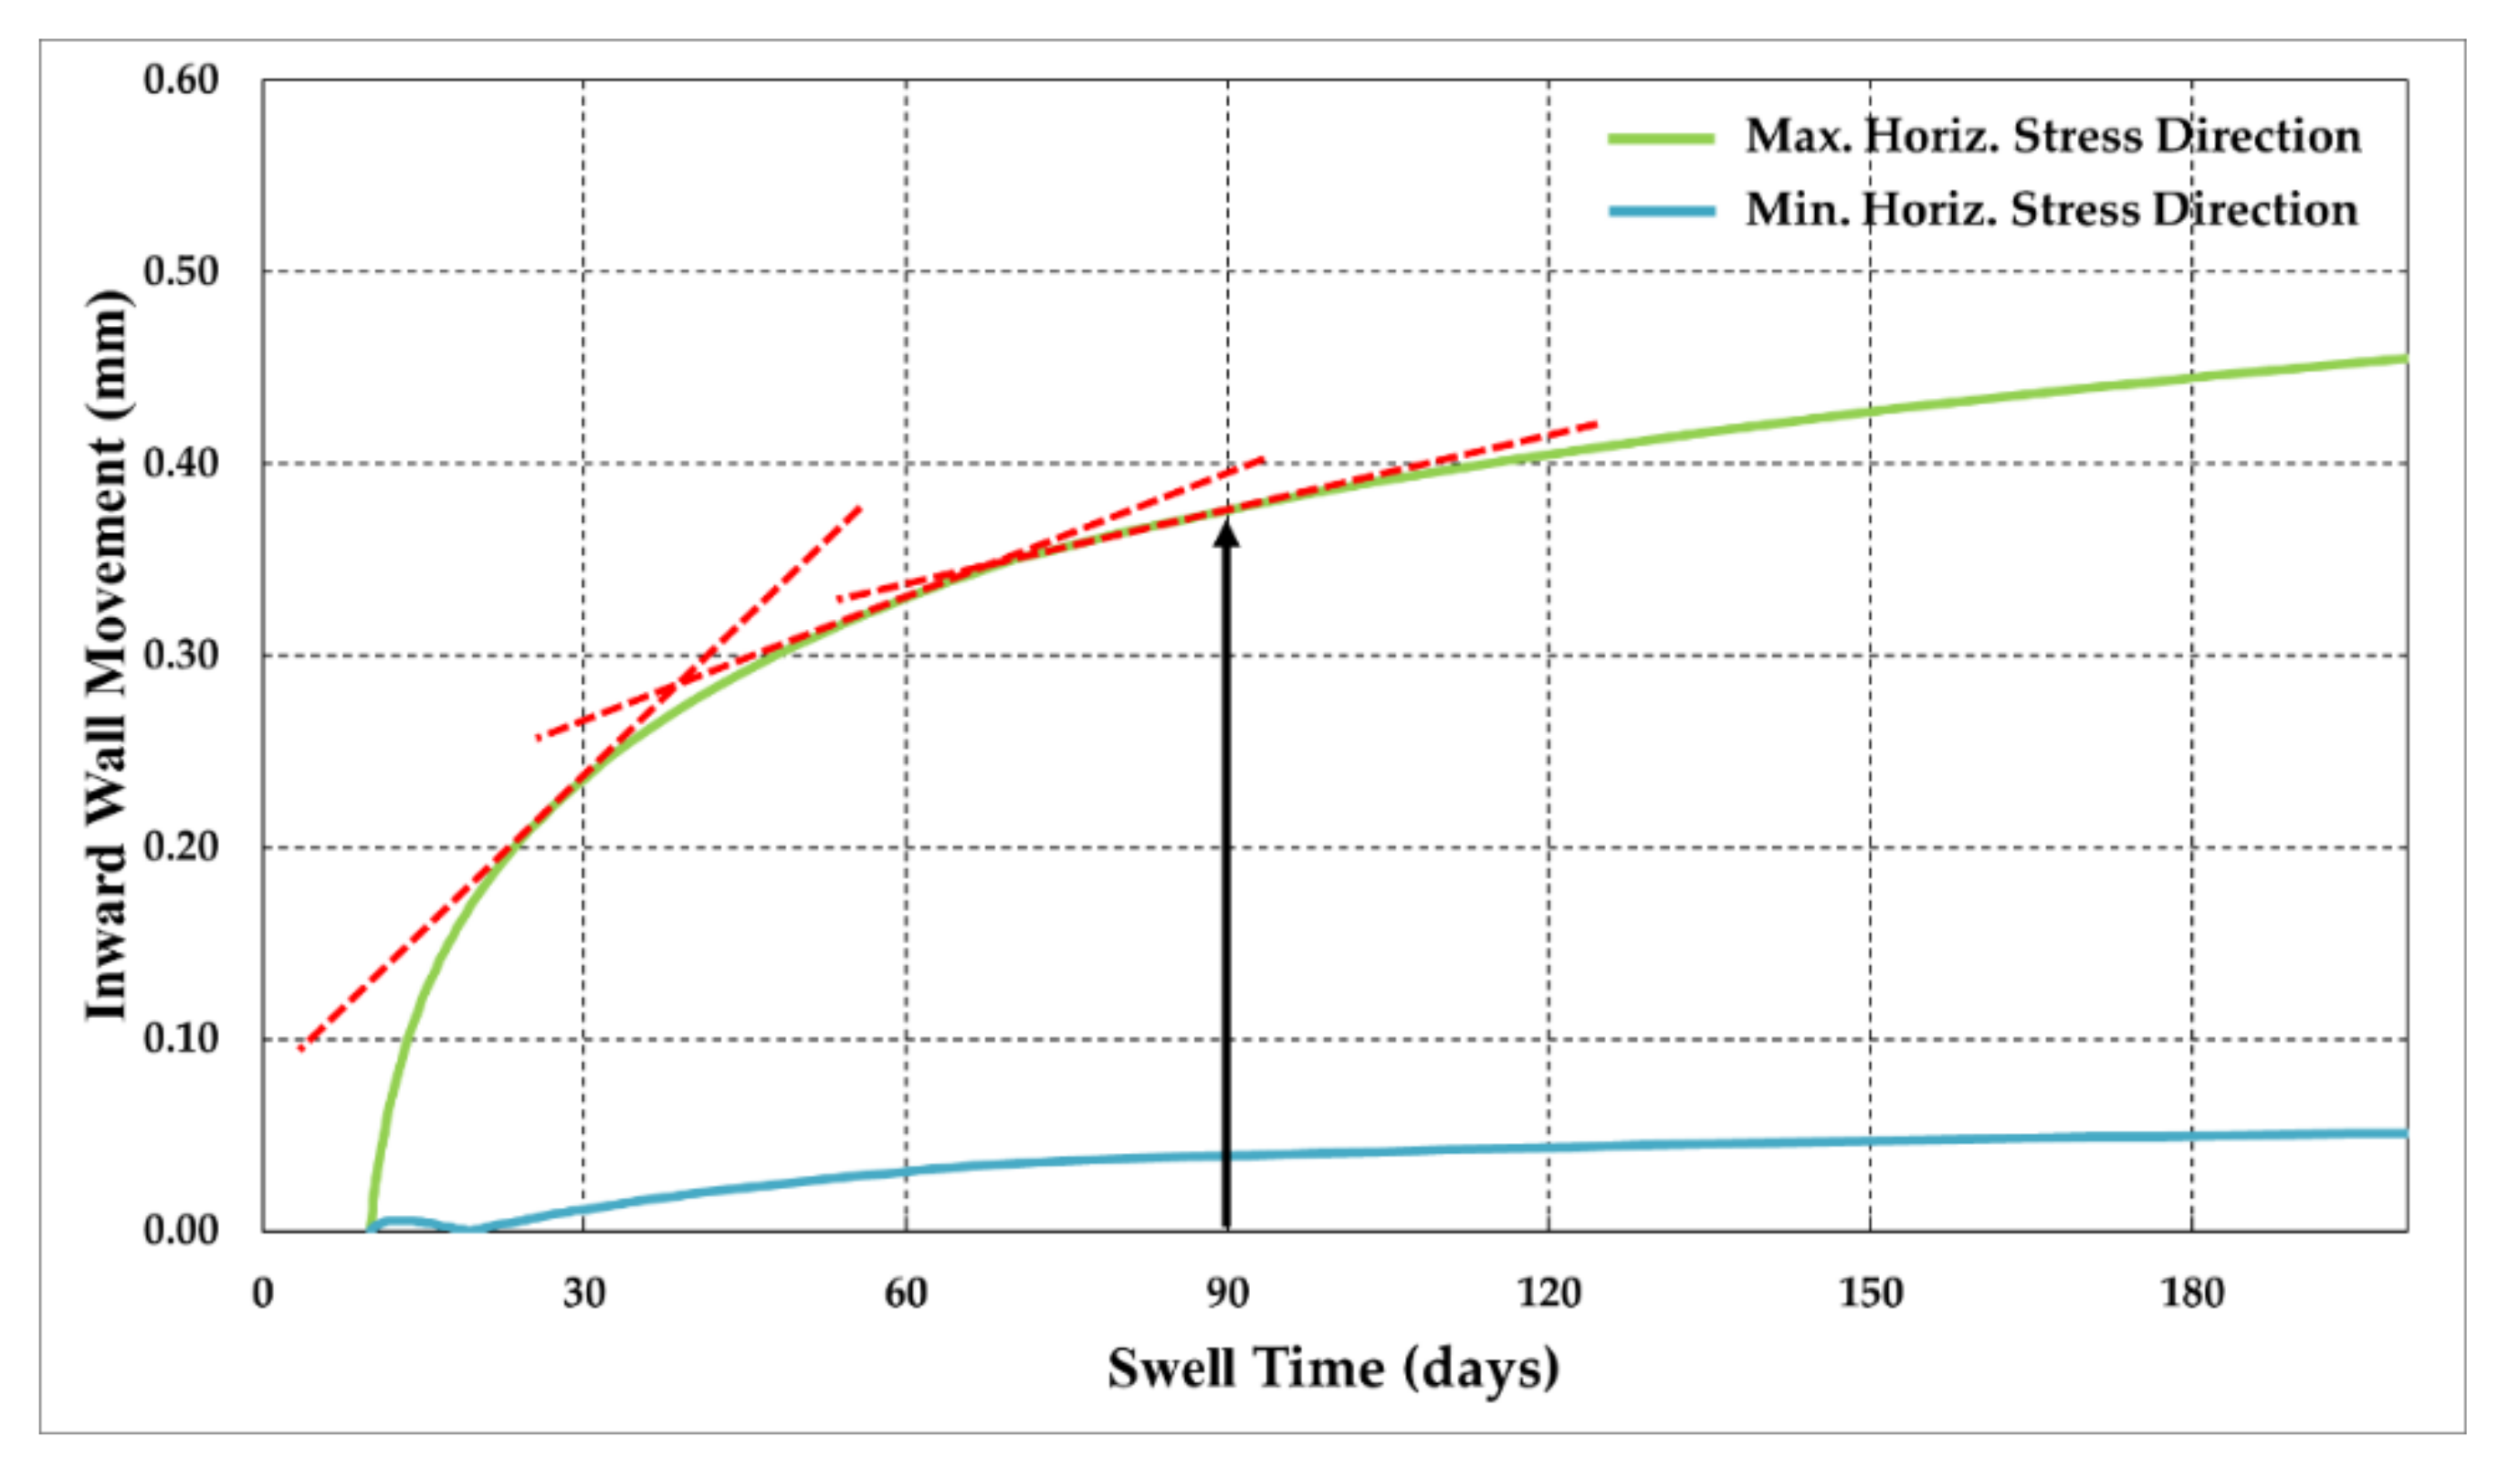
The convergence of the excavation boundaries 90 days after the shaft excavation was extracted from the numerical analysis, and the result of the inward wall movement caused by stress relaxation over swell time, is plotted in Figure 9. After excavation, displacement occurred rapidly in the maximum horizontal stress direction for approximately 30 days, due to the swelling behaviour. The maximum unrestrained convergence of the shaft excavation boundaries at 90 days was estimated to be approximately 0.38 mm, and then inward wall movement gradually decreased. Given the inward wall movement curve, the displacement generated from swelling behaviour has been decreased a lot, to approximately 70 days. Therefore, it is estimated that the SFRC lining could structurally sustain the total stress caused by ground movement occurring after 90 days, as recommended by the geological studies, and also it could be considered that the lining installation time can be reduced to 70 days, to decrease the construction period and cost.

5.3. Results of Mobilised Lining Forces

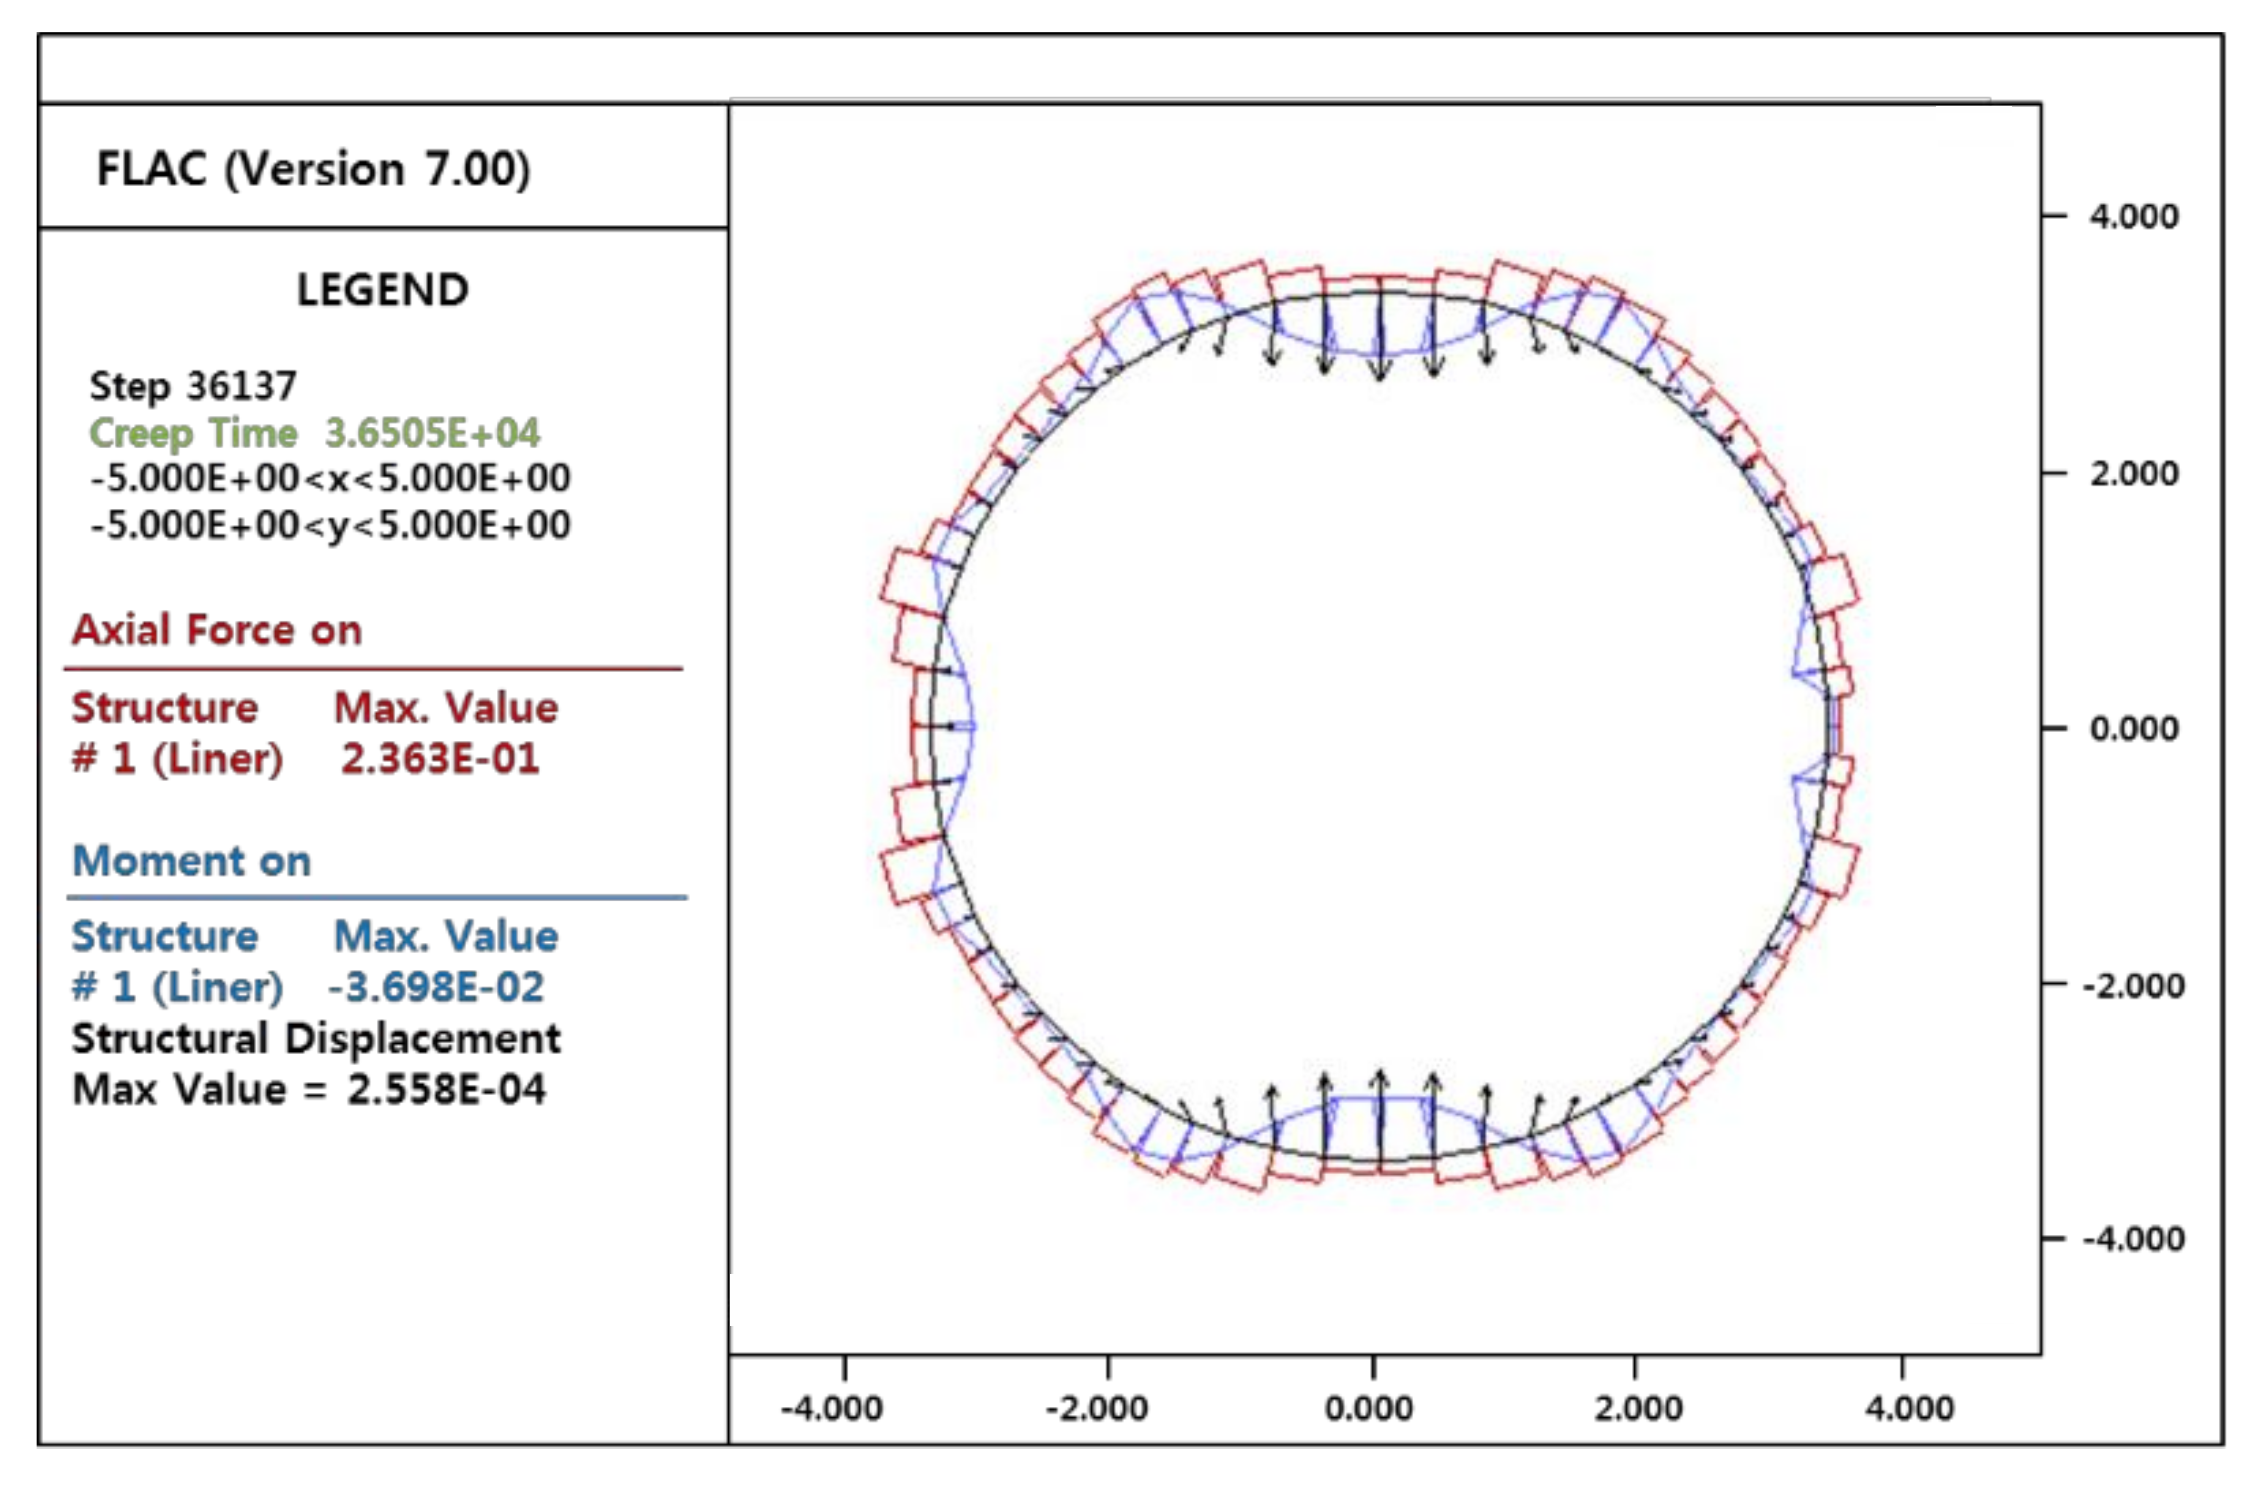
Figure 10 illustrates the mobilised lining forces along the shaft wall 100 years after installed for 70 days. The result revealed the maximum unfactored mobilised thrust and bending moment to be 240 kN / m and 37 kNm / m , respectively, 100 years after the installation of the shaft walls. Based on the maximum mobilised lining forces from the analysis of TDD behaviour, the maximum TDD-related pressure on the shaft wall was back-calculated and the resulting factored (L.F. = 1.4) TDD pressure was estimated to be 94 kPa . Because the shaft wall was designed against 200 kPa of TDD-related pressure; the designed SFRC shaft wall was expected to exhibit satisfactory performance even in the case of installing the shaft lining at 70 days after the completion of the excavation, instead of waiting for 90 days, as initially proposed before performing this analysis.

6. Conclusions

SFRC has been studied and used as an alternative material to take advantages of their workability and economic benefits over traditional RC. In this paper, a design study was conducted to replace originally designed RC shaft lining using SFRC in terms of geotechnical engineering. Several geological and structural design reports used in original lining designs were utilised, and theoretical and experimental approaches were used to determine SFRC designs corresponding to the original RC. The axial load and bending moment of the shaft lining were derived using Canadian concrete design codes CSA A23.3 combined with RILEM TC-162 TDF, and several analytical solutions with uniform and non-uniform loading cases were adopted for the evaluation of SFRC shaft lining performance. In addition, a numerical analysis model developed for Georgian Bay shale with swelling behaviour was used to determine if the proposed installation timing of the shaft lining is appropriate, and to evaluate the long-term stability of the shaft lining.
According to the structural analysis, RC with 20 M@300-radial and 15 M@300-vertical steel bars are characterised by an extremely high axial load and bending moment capacity of approximately 6100 kN / m and 880 kNm / m , respectively. The SFRC showed a relatively low bending moment with 370 kNm / m , while showing a high axial force corresponding to the RC with 5800 kN / m . The calculated hoop thrust and bending moment under both uniform and non-uniform loading cases were within the capacity of the SFRC lining, and thus it is estimated that an alternative design of a circular shaft, using SFRC, possesses sufficient load-bearing resistance. Therefore, it has been demonstrated that the SFRC lining poses an excellent alternative to steel bars in conventional RC for use as circular shaft structures, with both improved construction efficiency and structural capacity. Numerical analysis using the “swello” constitutive model, coded in FLAC 2D finite difference program, was performed to evaluate whether the proposed timing of the shaft lining is appropriate, and estimate the long-term stability. According to the results of the numerical analysis, the shaft lining installed at the proposed timing is expected to be structurally stable in the long-term, and furthermore, it could be considered that the installation time can be reduced by up to 20 days. Therefore, it can be concluded that the SFRC lining, installed 70 days after excavation, can sufficiently withstand the long-term ground swelling behaviour and can reduce the construction schedule by reducing the delays due to TDD. The construction cost could also decrease by reducing the waiting time for the shaft lining installation.

Author Contributions

Conceptualisation, S.S.L.; methodology, S.S.L.; validation, M.S.K.; formal analysis, M.S.K.; data collection, M.S.K.; writing—original draft preparation, M.S.K.; writing—review, S.S.L.; supervision, S.S.L. All authors have read and agreed to the published version of the manuscript.

Funding

This research received no external funding.

Institutional Review Board Statement

Not applicable.

Informed Consent Statement

Not applicable.

Data Availability Statement

Not applicable.

Conflicts of Interest

The authors declare no conflict of interest. The funders had no role in the design of the study; in the collection, analyses, or interpretation of data; in the writing of the manuscript, or in the decision to publish the results.

References

  1. Shin, Y.W.; Moon, K.S.; Joo, K.W. A study on asymmetric load on circular shaft due to engineering characteristics of discontinuous rock masses. J. Korean Tunn. Undergr. Sp. Assoc. 2008, 10, 119–128. [Google Scholar]
  2. You, K.H.; Song, W.Y. A case study on a tunnel back analysis to minimize the uncertainty of ground properties based on artificial neural network. J. Korean Tunn. Undergr. Sp. Assoc. 2012, 14, 37–53. [Google Scholar] [CrossRef]
  3. Qin, H.; Xie, X.G.; Vrugt, J.A.; Zeng, K.; Hong, G. Underground structure defect detection and reconstruction using cross GPR and Bayesian wave form inversion. Autom. Constr. 2016, 68, 156–169. [Google Scholar] [CrossRef] [Green Version]
  4. Gazetas, G.; Gerolymos, N.; Anastasopoulos, I. Response of three Athens metro underground structures in the 1999 Parnitha earthquake. Soil. Dyn. Earthq. Eng. 2005, 25, 617–633. [Google Scholar] [CrossRef]
  5. Zhang, X.P.; Jiang, Y.J.; Sugimoto, S. Seismic damage assessment of mountain tunnel: A case study on the Tawarayama tunnel due to the 2016 Kumamoto Earthquake. Tunn. Undergr. Sp. Tech. 2018, 71, 138–148. [Google Scholar] [CrossRef] [Green Version]
  6. Zhang, X.P.; Jiang, Y.J.; Maegawa, K.H. Mountain tunnel under earthquake force: A review of possible causes of damages and restoration methods. J. Rock Mech. Geotech. Eng. 2020, 12, 414–426. [Google Scholar] [CrossRef]
  7. Shin, Y.W.; Moon, K.S.; Kang, H.T.; Lee, S.H. Investigation of earth pressure on vertical shaft by field monitoring. J. Korea Geo Environ. Soc. 2008, 9, 63–76. [Google Scholar]
  8. Kim, K.Y.; Lee, D.S.; Cho, J.Y.; Jeong, S.S.; Lee, S.J. The effect of arching pressure on a vertical circular shaft. Tunn. Undergr. Sp. Tech. 2013, 37, 10–21. [Google Scholar] [CrossRef]
  9. Park, S.C.; Moon, H.G. Stress-path and stress-mode analyses of a circular-shaped shaft excavated in various in-situ rock stress states. J. Korean Soc. Miner. Energy Resour. Eng. 2014, 51, 794–807. [Google Scholar] [CrossRef]
  10. Zhao, Z.; Jing, L.; Pei, Q.; Ma, H.W.; Wang, Z.H. An experimental study of the dynamic split tension properties of reinforced concrete. Strength Mater. 2016, 48, 63–68. [Google Scholar] [CrossRef]
  11. Simonsson, E. Complex shapes with textile reinforced concrete. Master’s Thesis, Chalmers University of Technology, Gothenburg, Sweden, 2017. [Google Scholar]
  12. ITA Working Group on Maintenance and Repair of Underground Structures. Report on the damaging effects of water on tunnels during their working life. Tunn. Undergr. Sp. Tech. 1991, 6, 11–76. [Google Scholar] [CrossRef]
  13. Garden, H.N.; Hollaway, L.C.; Thorne, A.M. The strengthening and deformation behaviour of reinforced concrete beams upgraded using prestressed composite plates. Mater Struct. 1998, 31, 247–258. [Google Scholar] [CrossRef]
  14. Chang, S.H.; Lee, G.P.; Choi, S.W.; Bae, G.J. State of the art of segment lining in shield tunnel and statistical analysis of its key design parameters. Tunn. Undergr. Space 2011, 21, 427–438. [Google Scholar]
  15. Song, J.L.; Li, Y.X.; Xu, W.; Lui, H.; Lu, Y. Inexpensive and non-fluorinated superhydrophobic concrete coating for anti-icing and anti-corrosion. J. Colloid Interface Sci. 2019, 541, 86–92. [Google Scholar] [CrossRef]
  16. Bowser, M.; Stephenson, J. Segmental construction in the cold: Bridging the grand river. Struct. Eng. Int. 2017, 27, 29–31. [Google Scholar] [CrossRef]
  17. Babaie, R.; Abolfazli, M.; Fahimifar, A. Mechanical properties of steel and polymer fiber reinforced concrete. J. Mech. Behav. Mater. 2019, 28, 119–134. [Google Scholar] [CrossRef]
  18. Zhang, L.J.; Zhao, J.; Fan, C.Y.; Wang, Z. Effect of surface shape and content of steel fiber on mechanical properties of concrete. Adv. Civ. Eng. 2020, 6, 1–11. [Google Scholar] [CrossRef]
  19. Martinelli, E.; Pepe, M.; Franternali, F. Meso-scale formulation of a cracked-hinge model for hybrid fiber-reinforced cement composites. Fibers 2020, 8, 56. [Google Scholar] [CrossRef]
  20. Chu, S.H.; Li, L.G.; Kwan, A.K.H. Development of extrudable high strength fiber reinforced concrete incorporating nano calcium carbonate. Addit. Manuf. 2021, 37, 1–9. [Google Scholar]
  21. Ghalehnovi, M.; Karimipour, A.; Brito, J.D.; Chaboki, H.R. Crack width and propagation in recycled coarse aggregate concrete beams reinforced with steel fibres. Appl. Sci. 2020, 10, 7587. [Google Scholar] [CrossRef]
  22. Son, D.H.; Bae, B.I.; Lee, M.S.; Lee, M.S.; Choi, C.S. Flexural strength of composite deck slab with macro synthetic fiber reinforced concrete. Appl. Sci. 2021, 11, 1662. [Google Scholar] [CrossRef]
  23. Wafa, F.F. Properties and application of fiber reinforced concrete. Eng. Sci. 1990, 2, 49–63. [Google Scholar] [CrossRef]
  24. Musmar, M. Tensile strength of steel fiber reinforced concrete. Contemp. Eng. Sci. 2013, 6, 225–237. [Google Scholar] [CrossRef]
  25. Herrmann, H.; Pastorelli, E.; Kallonen, A.; Suuronen, J.P. Methods for fibre orientation analysis of X-ray tomography images of steel fibre reinforced concrete (SFRC). J. Mater. Sci. 2016, 51, 3772–3783. [Google Scholar] [CrossRef]
  26. Choi, W.C.; Jung, K.Y.; Jang, S.J.; Yun, H.D. The influence of steel fiber tensile strength and aspect ratio on the fracture properties of high-strength concrete. Materials 2019, 12, 2105. [Google Scholar] [CrossRef] [Green Version]
  27. Concrete Society Working Group. Guidance for the design of steel-fibre-reinforced concrete. Concr. Soc. 2007, 63, 1–109. [Google Scholar]
  28. Chu, S.H.; Kwan, A.K.H. A new method for pull out test of reinforcing bars in plain and fibre reinforced concrete. Eng. Struct. 2018, 164, 82–91. [Google Scholar] [CrossRef]
  29. Fang, Q.; Zhang, J.H. Three-dimensional modelling of steel fiber reinforced concrete material under intense dynamic loading. Constr. Build. Mater. 2013, 44, 118–132. [Google Scholar] [CrossRef]
  30. Ou, Y.C.; Tsai, M.S.; Liu, K.Y.; Chang, K.C. Compressive behavior of steel-fiber-reinforced concrete with a high reinforcing index. J. Mater. Civ. Eng. 2012, 24, 207–215. [Google Scholar] [CrossRef]
  31. Liao, W.C.; Perceka, W.; Liu, E.J. Compressive stress-strain relationship of high strength steel fiber reinforced concrete. J. Adv. Concr. Technol. 2015, 13, 379–392. [Google Scholar] [CrossRef] [Green Version]
  32. Paul, S.C.; Zijl, G.P.A.G.; Savija, B. Effect of fibers on durability of concrete: A practical review. Materials 2020, 13, 4562. [Google Scholar] [CrossRef]
  33. Yang, K.H.; O, S.J. Effect of volume fraction and length of fiber on the mechanical properties of fiber reinforced concrete. J. Korea Inst. Build. Constr. 2008, 8, 43–48. [Google Scholar] [CrossRef] [Green Version]
  34. Mangat, P.S.; Gurusamy, K. Long-term properties of steel fibre reinforced marine concrete. Mater. Struct. 1987, 20, 273–282. [Google Scholar] [CrossRef]
  35. Chiaia, B.; Fantilli, A.P.; Vallini, P. Combining fiber-reinforced concrete with traditional reinforcement in tunnel linings. Eng. Struct. 2009, 31, 1600–1606. [Google Scholar] [CrossRef]
  36. Funete, A.; Pujadas, P.; Blanco, A.; Aguado, A. Experiences in Barcelona with the use of fibres in segmental linings. Tunn. Undergr. Sp. Tech. 2012, 27, 60–71. [Google Scholar]
  37. Tiberti, G.; Minelli, F.; Plizzari, G. Reinforcement optimization of fiber reinforced concrete linings for conventional tunnels. Compos. B Eng. 2014, 58, 199–207. [Google Scholar] [CrossRef]
  38. Meda, A.; Rinaldi, Z.; Spagnuolo, S.; Rivaz, B.D.; Giamundo, N. Hybrid precast tunnel segments in fibre reinforced concrete with glass fiber reinforced bars. Tunn. Undergr. Sp. Tech. 2019, 86, 100–112. [Google Scholar] [CrossRef]
  39. Cao, L.F.; Peaker, S.M.; Ahmad, S.; Sirati, A. Engineering characteristic of Georgian Bay Formation in Toronto. In Proceedings of the 67th Canadian Geotechnical Conference, Regina, SK, Canada, 30 September 2014. [Google Scholar]
  40. GEOTERRE. Geotechnical Baseline Report–Hydro One Midtown Toronto Tunnel Project; GEOTERRE: Brampton, ON, Canada, 2010. [Google Scholar]
  41. Koh, S.I. Mechanical characteristics of shield TBM segment reinforced with steel fiber and its application to tunnelling. Ph.D. Thesis, Dongguk University, Seoul, Korea, 2017. [Google Scholar]
  42. Yasmin, T.; Bitencourt, L.A.G., Jr.; Osvaldo, L.M. Design of SFRC members aided by a multiscale model: Part II–Predicting the behavior of RC-SFRC beams. Compos. Struct. 2020, 241, 1–13. [Google Scholar]
  43. RILEM. TC-162 TDF, Test and design methods for steel fibre reinforced concrete–Design of steel fibre reinforced concrete using the σ-ω method: Principles and applications. Mater. Struct. 2002, 35, 262–278. [Google Scholar]
  44. Lee, S.S. Numerical model for shaley rock masses displaying long-term time dependent deformation (TDD) behavior and its application to a pedestrian tunnel constructed under Lake Ontario. KSCE J. Civ. Eng. 2017, 21, 2919–2931. [Google Scholar] [CrossRef]
  45. GEOTERRE. Geotechnical Data Report–Hydro One Midtown Toronto Tunnel Project; GEOTERRE: Brampton, ON, Canada, 2010. [Google Scholar]
  46. U.S. Department of Transportation. Precast Concrete Segmental Liners for Large Diameter Road Tunnels-Literature Survey and Synthesis; U.S. Department of Transportation: Washington, DC, USA, 2020.
  47. Alshorafa, M.A. Modifications of conventional rigid and flexible methods for Mat foundation design. Master’s Thesis, Islamic University of Gaza, Gaza, Palestine, 2008. [Google Scholar]
  48. Yazici, S.; Inan, G.; Tabak, V. Effect of aspect ratio and volume fraction of steel fiber on the mechanical properties of SFRC. Constr. Build Mater. 2007, 21, 1250–1253. [Google Scholar] [CrossRef]
  49. Jeon, J.K.; Jeon, C.K.; Kim, N.Y.; Kim, S.M.; Lee, J.E. A study on controlling of cracks occurred at crown of tunnel concrete lining using model test. J. Korean Tunn. Undergr. Sp. Assoc. 2006, 8, 227–235. [Google Scholar]
  50. Yang, K.H. Slump and mechanical properties of hybrid steel-PVA fiber reinforced concrete. J. Korea Concr. Inst. 2010, 22, 651–658. [Google Scholar] [CrossRef] [Green Version]
  51. Lee, G.P.; Bae, G.J.; Moon, D.Y.; Kang, T.S.; Chang, S.H. Evaluation of steel fiber reinforcement effect in segment lining by full scale bending test. J. Korean Tunn. Undergr. Sp. Assoc. 2013, 15, 215–223. [Google Scholar]
  52. Gilbert, R.I. Tension stiffening in lightly reinforced concrete slabs. J. Struct. Eng. 2007, 133, 899–903. [Google Scholar] [CrossRef]
  53. Lee, J.H. Influence of concrete strength combined with fiber content in the residual flexural strengths of fiber reinforced concrete. Compos. Struct. 2017, 168, 216–225. [Google Scholar] [CrossRef]
  54. Duddeck, H.; Erdmann, J. Structural design models for tunnels in soft soil. Underground Space 1985, 9, 246–259. [Google Scholar]
  55. Christou, P.; Michael, A.; Neofytou, Z. Development of interaction diagrams for RC sections confined with CFRP composites. WIT Trans. Modelling Simul. 2011, 51, 385–396. [Google Scholar]
  56. Spagnoli, G.; Oreste, P.; Bianco, L.L. Estimation of shaft radial displacement beyond the excavation bottom before installation of permanent lining in nondilatant weak rocks with a novel formulation. Int. J. Geomech. 2017, 17, 1–9. [Google Scholar] [CrossRef]
  57. Showkati, A.; Salari-rad, H.; Aghchai, M.H. Predicting long-term stability of tunnels considering rock mass weathering and deterioration of primary support. Tunn. Undergr. Sp. Tech. 2021, 107, 1–15. [Google Scholar] [CrossRef]
  58. Kwon, S.Y.; Yoo, M.T. A study on the dynamic behavior of a vertical tunnel shaft embedded in liquefiable ground during earthquakes. Appl. Sci. 2021, 11, 1560. [Google Scholar] [CrossRef]
  59. Lo, K.Y.; Wai, R.S.C. Time-dependent deformation of shaley rocks in southern Ontario. Can. Geotech. J. 1978, 15, 537–547. [Google Scholar] [CrossRef]
  60. Lo, K.Y. Design of tunnel lining in rock for long term time effects. Can. Geotech. J. 1981, 18, 24–39. [Google Scholar] [CrossRef]
  61. Hawlader, B.C.; Lee, Y.N.; Lo, K.Y. Three-dimensional stress effects on time-dependent swelling behavior of shaly rock. Can. Geotech. J. 2003, 40, 501–511. [Google Scholar] [CrossRef]
  62. Hawlader, B.C.; Lo, K.Y.; Moore, I.D. Analysis of tunnels in shaley rock considering three-dimensional stress effects on swelling. Can. Geotech. J. 2005, 42, 1–12. [Google Scholar] [CrossRef]
  63. Lo, K.Y.; Micic, S. Research Report GEOT-10-05-Evaluation of Swelling Properties of Shales for the Design of Underground Structures; Western Geotechnical Research: Brampton, ON, Canada, 2009. [Google Scholar]
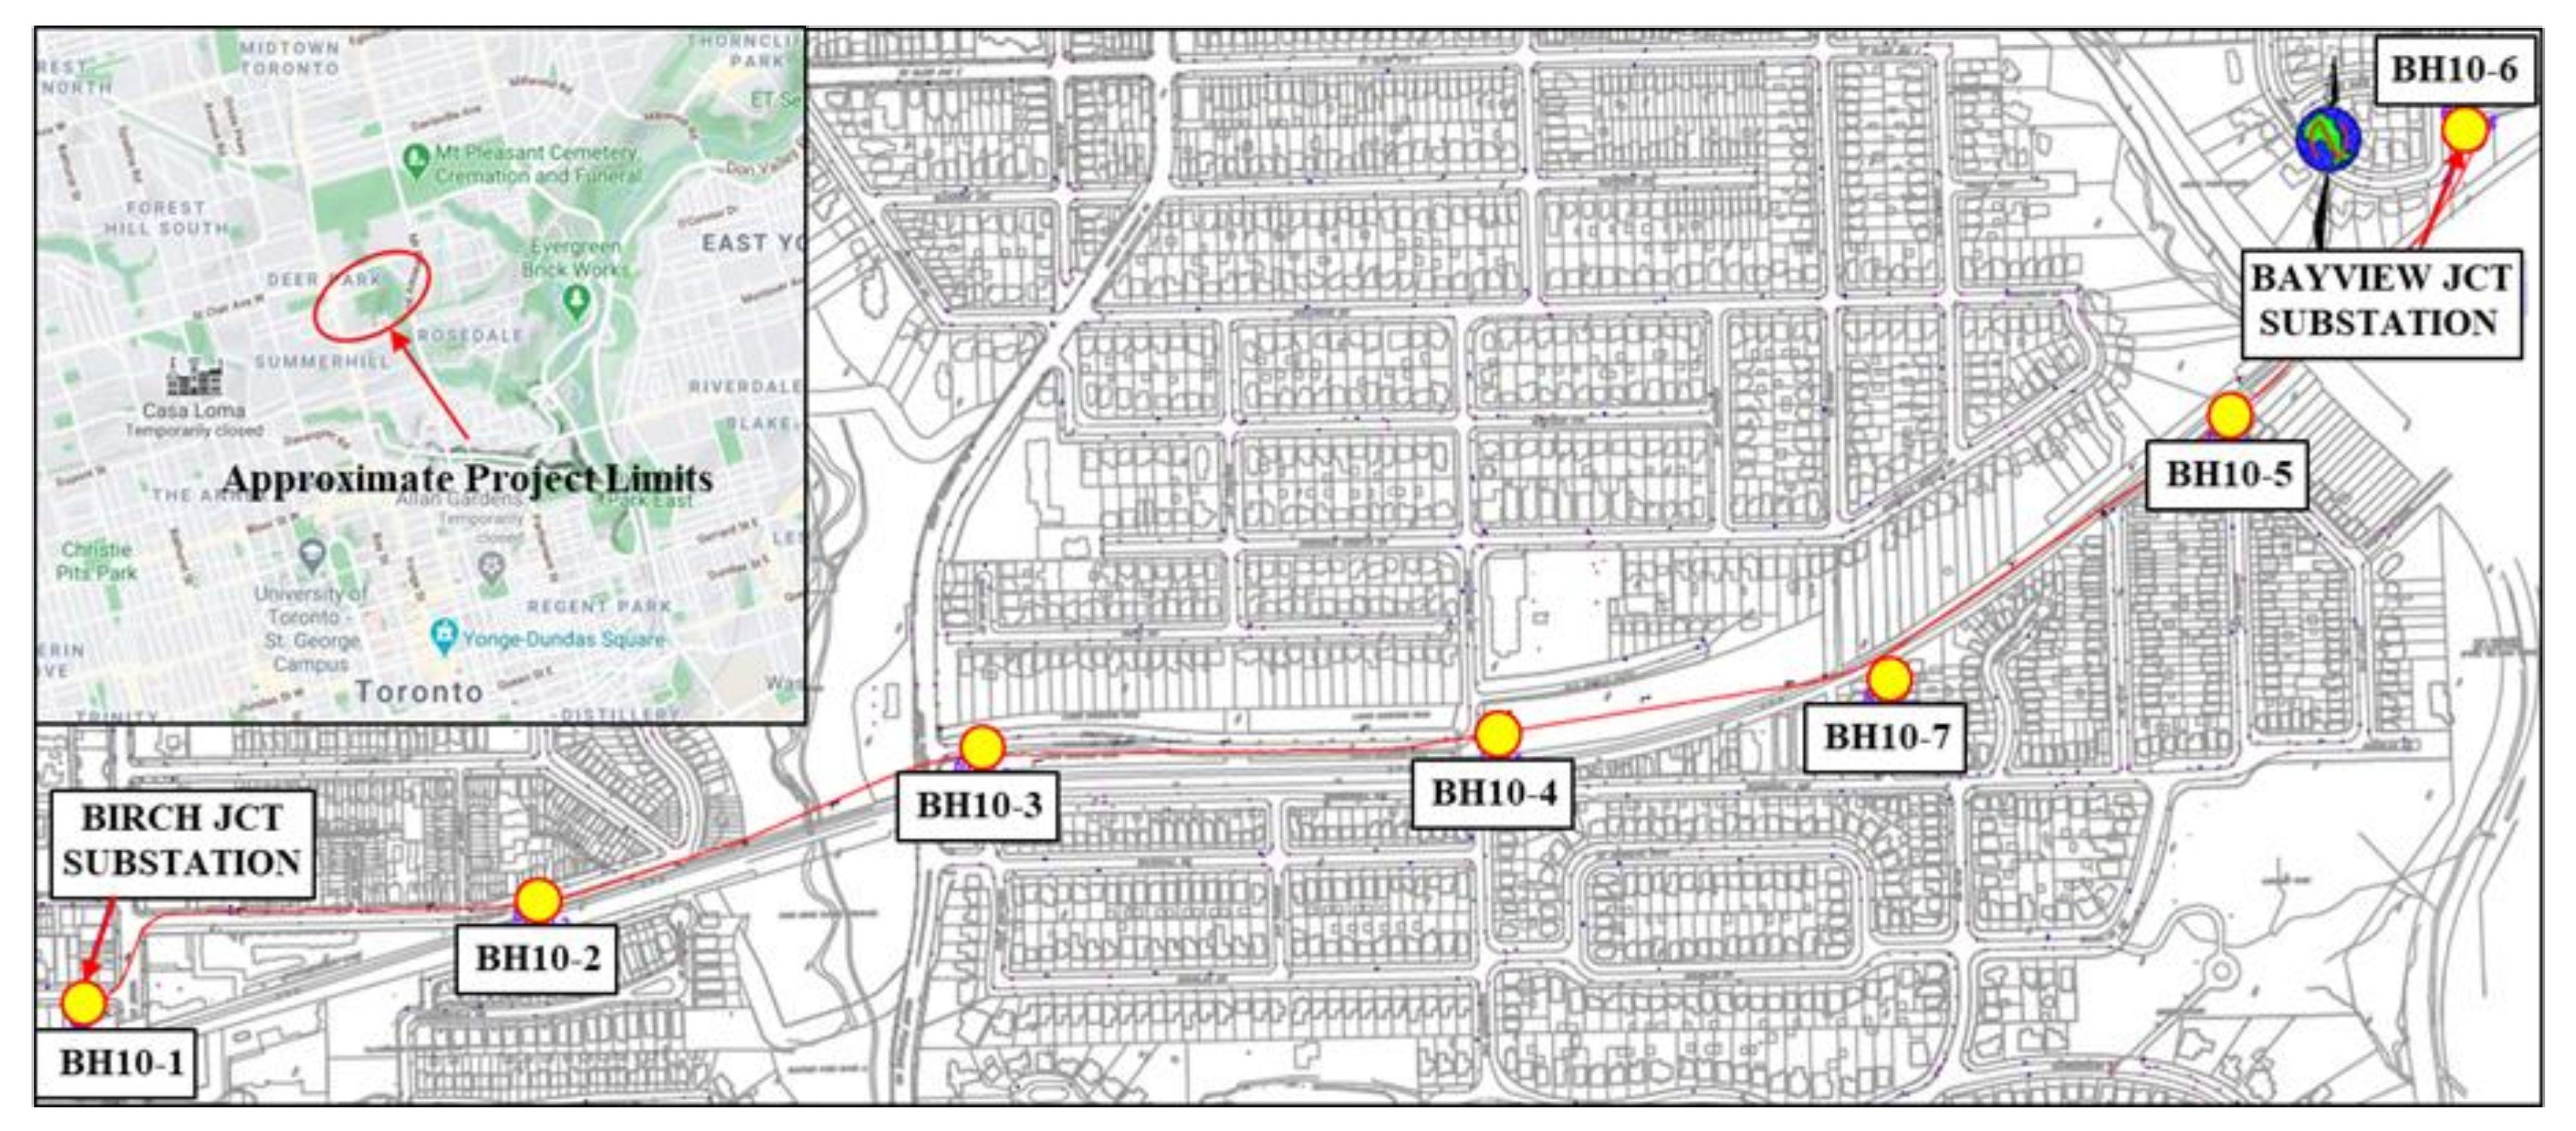
Figure 1. Detailed site and borehole location.
Applsci 11 03490 g001
Figure 2. Proposed tunnel profile on simplified stratigraphy.
Applsci 11 03490 g002
Figure 3. Four-point bending test: (a) Example of the test setup; (b) specimen geometry.
Applsci 11 03490 g003
Figure 4. Example of test curves of steel fibre reinforced concrete (SFRC) for dosage rates of 0–40 kg / m 3 : (a) FF1 type; (b) FF3 type.
Applsci 11 03490 g004
Figure 5. Final proposed SFRC solution for shaft lining.
Applsci 11 03490 g005
Figure 6. Shaft stress conditions with depth.
Applsci 11 03490 g006
Figure 7. Thrust—Moment interaction diagram for the shaft.
Applsci 11 03490 g007
Figure 8. Numerical analysis model of the shaft.
Applsci 11 03490 g008
Figure 9. The convergence of the excavation boundaries up until the installation of the shaft wall (90 days).
Applsci 11 03490 g009
Figure 10. Maximum lining forces on shaft walls.
Applsci 11 03490 g010
Table 1. Dimensions and mechanical properties of Fibres.
ParametersType of Steel Fibre
FF1FF3
Nominal dimensionsDiameter ( mm )1.000.75
Length ( mm )5050
Aspect ratio (length/diameter) ( )5067
Mechanical propertiesTensile strength of the wire (MPa)>1100>1100
Ultimate strain ( % )<4<4
Table 2. Flexural comparison of conventional reinforced concrete (RC) and SFRC.
PropertiesRCSFRC
Steel Bar
(20 mm@300)
FF3
( 0.75   ×   50 )
Base of the cross-section ( mm )10001000
Thickness of cross-section ( mm )400400
Tensile strength of reinforcement bar ( MPa )414-
Area of reinforcement bar ( mm 2 )1047.20-
Depth of flexural reinforcement bar position ( mm )325-
Ductility of SFRC (%)-102
Concrete first crack strength for 35 MPa-grade ( MPa ) -4.70
Equivalent resistance of SFRC by flexural test ASTM C1609 ( MPa )-4.79
Moment resistance for cross-section (MNmm)126.8127.7
Table 3. Comparison of tension resistance of conventional RC and SFRC.
PropertiesRCSFRC
Reinforcement Bar (20 mm@300)FF3
40   k g / m 3
Cross-section width ( mm )10001000
Thickness of cross-section ( mm )400400
Tensile strength of reinforcement bar ( MPa )414-
Area of reinforcement bar ( mm 2 )1047.20-
Reduction factor (-)0.90-
Reduction factor for tensile strength by CNR-204-0.45
Reduction factor for members in tension-1.30
Concrete first crack strength ( MPa )-4.70
Equivalent resistance by flexural test ASTM C1609 (%)-102
Equivalent resistance by flexural test ASTM C1609 ( MPa )-4.79
Cross-section tensile force (kN)390.2663.8
Table 4. Duddeck and Erdmann Formulae.
Full BondTangential Slip
Maximum bending moment σ v 1 K o R 2 1 4 + 3 2 v 3 1 + v 3 4 v E c R 3 EJ σ v 1 K o R 2 1 10 12 v 3 4 v + 2 3 1 + v 3 4 v E c R 3 EJ
Average hoop thrust σ v 1 + K o R 1 2 + 2 1 + V E c R EA
Variable hoop thrust σ v 1 + K o R 1 2 + 2 1 + v E c R EA σ v 1 K o R 1 10 12 v 3 4 v + 2 3 1 + v 3 4 v E c R 3 EJ
Constant radial displacement σ v 1 + K o 0.5 R 2 EA 1 + 1 1 + v E c R EA + J AR 2
Maximum radial displacement σ v 1 K o R 4 EJ 12 + 3 2 v 1 + v 3 4 v E c R 3 EJ σ v 1 K o R 4 EJ 6 5 6 v 3 4 v + 2 1 + v 3 4 v E c R 3 EJ
σ v : Vertical stress (MPa), σ h : Horizontal stress (MPa), v : Poisson’s ratio (-), E : Young’s modulus of the ground (MPa), E c : Young’s modulus of the lining (MPa), K o : Lateral earth pressure coefficient (-), R : Tunnel radius (m), A : Cross-section area of the lining per unit length along the tunnel axis ( m 2 ), J : Inertia moment of the lining cross-section ( m 4 ).
Table 5. Input parameters for the numerical analysis.
ParametersValuesSources
Unit weight of rock ( kN / m 3 )24Nearby project data
& calculation
Deformation modulus of rock ( MPa )6800
Rock mass tensile strength ( MPa )0.2
Rock mass cohesion ( MPa )2.0
Rock mass friction angle (°)40
Vertical stress ( MPa )1.4
Density ( kN / m 3 )250035 MPa -grade concrete
Elastic modulus (MPa)34,077
Poisson’s ratio (-)0.2
Max. horizontal stress ( σ H 1 ,   MPa )15.0Geotechnical baseline report
Min. horizontal stress ( σ H 2 ,   MPa )5.0
Pseudo Poisson’s ratio0.6Lab result & calculation
Swelling potential (%)Vertical0.9
Horizontal ( σ H 1 )0.22
Horizontal ( σ H 2 )0.22
Critical stress (MPa)Vertical1.3
Horizontal ( σ H 1 )1.8
Horizontal ( σ H 2 )1.8
Publisher’s Note: MDPI stays neutral with regard to jurisdictional claims in published maps and institutional affiliations.