Article

Sequential Data Fusion Techniques for the Authentication of the P.G.I. Senise (“Crusco”) Bell Pepper

by
Alessandra Biancolillo
1,
Francesca Di Donato
1,
Francesco Merola
2,
Federico Marini
2,* and
Angelo Antonio D’Archivio
1
1
Department of Physical and Chemical Sciences, University of L’Aquila, Via Vetoio, Coppito, 67100 L’Aquila, Italy
2
Department of Chemistry, University of Rome “La Sapienza”, Piazzale Aldo Moro, 5, 00185 Roma, Italy
*
Author to whom correspondence should be addressed.
Appl. Sci. 2021, 11(4), 1709; https://doi.org/10.3390/app11041709
Submission received: 25 January 2021 / Revised: 8 February 2021 / Accepted: 11 February 2021 / Published: 14 February 2021
(This article belongs to the Special Issue Application of Spectroscopy in Food Analysis: Volume II)

Abstract

:
Bell pepper is the common name of the berry obtained from some varieties of the Capsicum annuum species. This agro-food is appreciated all over the world and represents one of the key ingredients of several traditional dishes. It is used as a fresh product, or dried and ground as a seasoning (e.g., paprika). Specific varieties of sweet pepper present organoleptic peculiarities and they have been awarded by quality marks as a further confirmation of their unicity (e.g., Piment d’Espelette, Pimiento de Herbón, Peperone di Senise). Due to the market value of this aliment, it can be subjected to frauds, such as adulterations and sophistication. The present study lays on these considerations and aims at developing a spectroscopy-based approach for authenticating Senise bell pepper and for detecting its adulteration with common paprika. In order to achieve this goal, 60 pure samples of bell pepper from Senise were analyzed by mid- and near-infrared spectroscopies. Then, in order to mimic the adulteration, 40 mixtures of Senise bell pepper and paprika were prepared and analyzed (by the same spectroscopic techniques). Eventually, two different multi-block classification approaches (sequential and orthogonalized partial least squares linear discriminant analysis and sequential and orthogonalized covariance selection linear discriminant analysis) were used to discriminate between pure and adulterated Senise bell pepper samples. Both proposed procedures achieved extremely successful results in external validation, correctly classifying all the (thirty-five) test samples, indicating that both approaches represent a winning solution for the investigated classification problem.

1. Introduction

Bell pepper is the common name of the berry obtained from some varieties of the Capsicum annuum species. This product is appreciated all over the world and represents one of the key ingredients of several traditional dishes.
From the nutritional point of view, this aliment is valued for its relevant content in antioxidants and vitamins. In particular, bell peppers are rich in vitamin A, C and E, and, to a lesser extent, also in vitamin D and those belonging to the B group [1]. The levels of these compounds in capsicum berries depend on several factors: the genus, the variety, the production practices, the maturity at harvest and the storage conditions [2]. In Europe, several varieties of bell pepper are grown. Among these, some have been awarded quality marks by the European Union, as a further confirmation and protection of their quality. Some examples of these are the Protected Designation of Origin (PDO) Piment d’Espelette, grown in France, the PDO Pimiento de Herbón, harvested in Spain, or the Protected Geographical Indication (PGI) Peperone di Senise produced in southern Italy.
Customarily, the main quality controls conducted on these agro-foods are generally aimed at quantifying the specific substances they contain. For example, a lot of effort has been put in the quali- and quantitative analysis of carotenoids, as carried out by Gregory and collaborators [3], who used high performance liquid chromatography (stationary phase: octadecyl silica; mobile phase: methanol-ethyl acetate) for the quantification of carotenoids and carotenoid esters in bell peppers, or by Gentili et al. [4] who exploited HPLC-photodiode array detection-tandem mass spectrometry (HPLC-PAD-MS/MS) for the untargeted determination of carotenoids in three different varieties of sweet peppers. Similarly, in the literature it is possible to find different approaches for the quantification of capsaicinoids, polyphenols and for the estimation of the antioxidant capability of bell peppers. In this context, a valuable example is represented by the study proposed by Sora and collaborators, who analyzed all those families of compounds in the berries, by means of HPLC (for the quantification of capsaicin, dihydrocapsaicin, and the total phenols content), and radical tests (for estimating the scavenging activity) [5].
If, on the one hand, the analytical methodologies developed for the quality control of bell peppers are very advanced, then on the other hand, in the literature, there is a reduced number of papers focused on the authentication and the characterization of high value-added peppers.
Some authors have highlighted the possibility of using analytical approaches for discriminating greenhouse from outdoor-grown bell peppers [6], or to differentiate organic vegetables from those cultivated following the traditional systems, but not many have investigated the possibility of developing an analytical methodology for detecting adulterations on this agro-food product. This aspect is particularly relevant considering that, in many countries, bell pepper is not only consumed as a fresh product, but it is often dried and ground (e.g., paprika), and used as the main ingredient or seasoning in several traditional dishes. Given the powdery state of the product, this is easily subjected to frauds, such as adulterations and sophistications. Additionally, all of the production processes needed to obtain the final product greatly increase the market value of this aliment, furtherly motivating the possibility of deceits, hence the need to develop fraud detection methodologies for the prevention of possible illicit actions.
The present study lays on these considerations and aims to propose a non-destructive approach for the detection of adulterations on the Senise bell pepper. This typical aliment, produced in a restricted area in southern Italy (around Senise, a small town in Basilicata) is a Protected Geographical Indication product. It is generally dried and ground and used as seasoning in different typical dishes. This food can be easily adulterated with similar products, for instance, paprika, and, even reaching high levels of adulterations, the difference between the two products would not be visible by sight.
The proposed adulteration-detection tool is based on exploiting the coupling of mid- and near-infrared spectroscopies (MIR/NIR) with different sequential multi-block classification approaches. In particular, sequential and orthogonalized partial least squares linear discriminant analysis (SO-PLS-LDA) and sequential and orthogonalized covariance selection linear discriminant analysis (SO-CovSel-LDA) were used to process the spectroscopic signals.
These two instrumental techniques were chosen because they are relatively rapid, non-destructive, and they have demonstrated to be suitable allies against frauds in food matrices [7,8,9,10,11]. On the other hand, the choice of the classifier fell on data fusion (DF) approaches because, when applicable, multi-block methodologies are expected to perform better than the disjoint analysis of the individual data blocks [12,13,14]. Among the others, SO-PLS-LDA and SO-CovSel-LDA were chosen because their sequential nature provides a number of benefits related to the interpretation of the system [15], and, moreover, they demonstrated to represent a suitable tool in similar situations [16,17,18,19,20,21].

2. Materials and Methods

2.1. Samples

Ground Senise bell pepper samples were collected from local producers in Senise (Basilicata region in southern Italy). Forty adulterated samples were prepared in the laboratory by mixing, in different proportions, pure ground Senise bell pepper and lower-valued ground paprika samples, purchased from different retailers in Italy. Details about the relative composition of these samples are reported in Table 1.
In total, one hundred samples were available: sixty being pure ground Senise bell pepper and forty mixtures of Senise bell pepper and paprika.

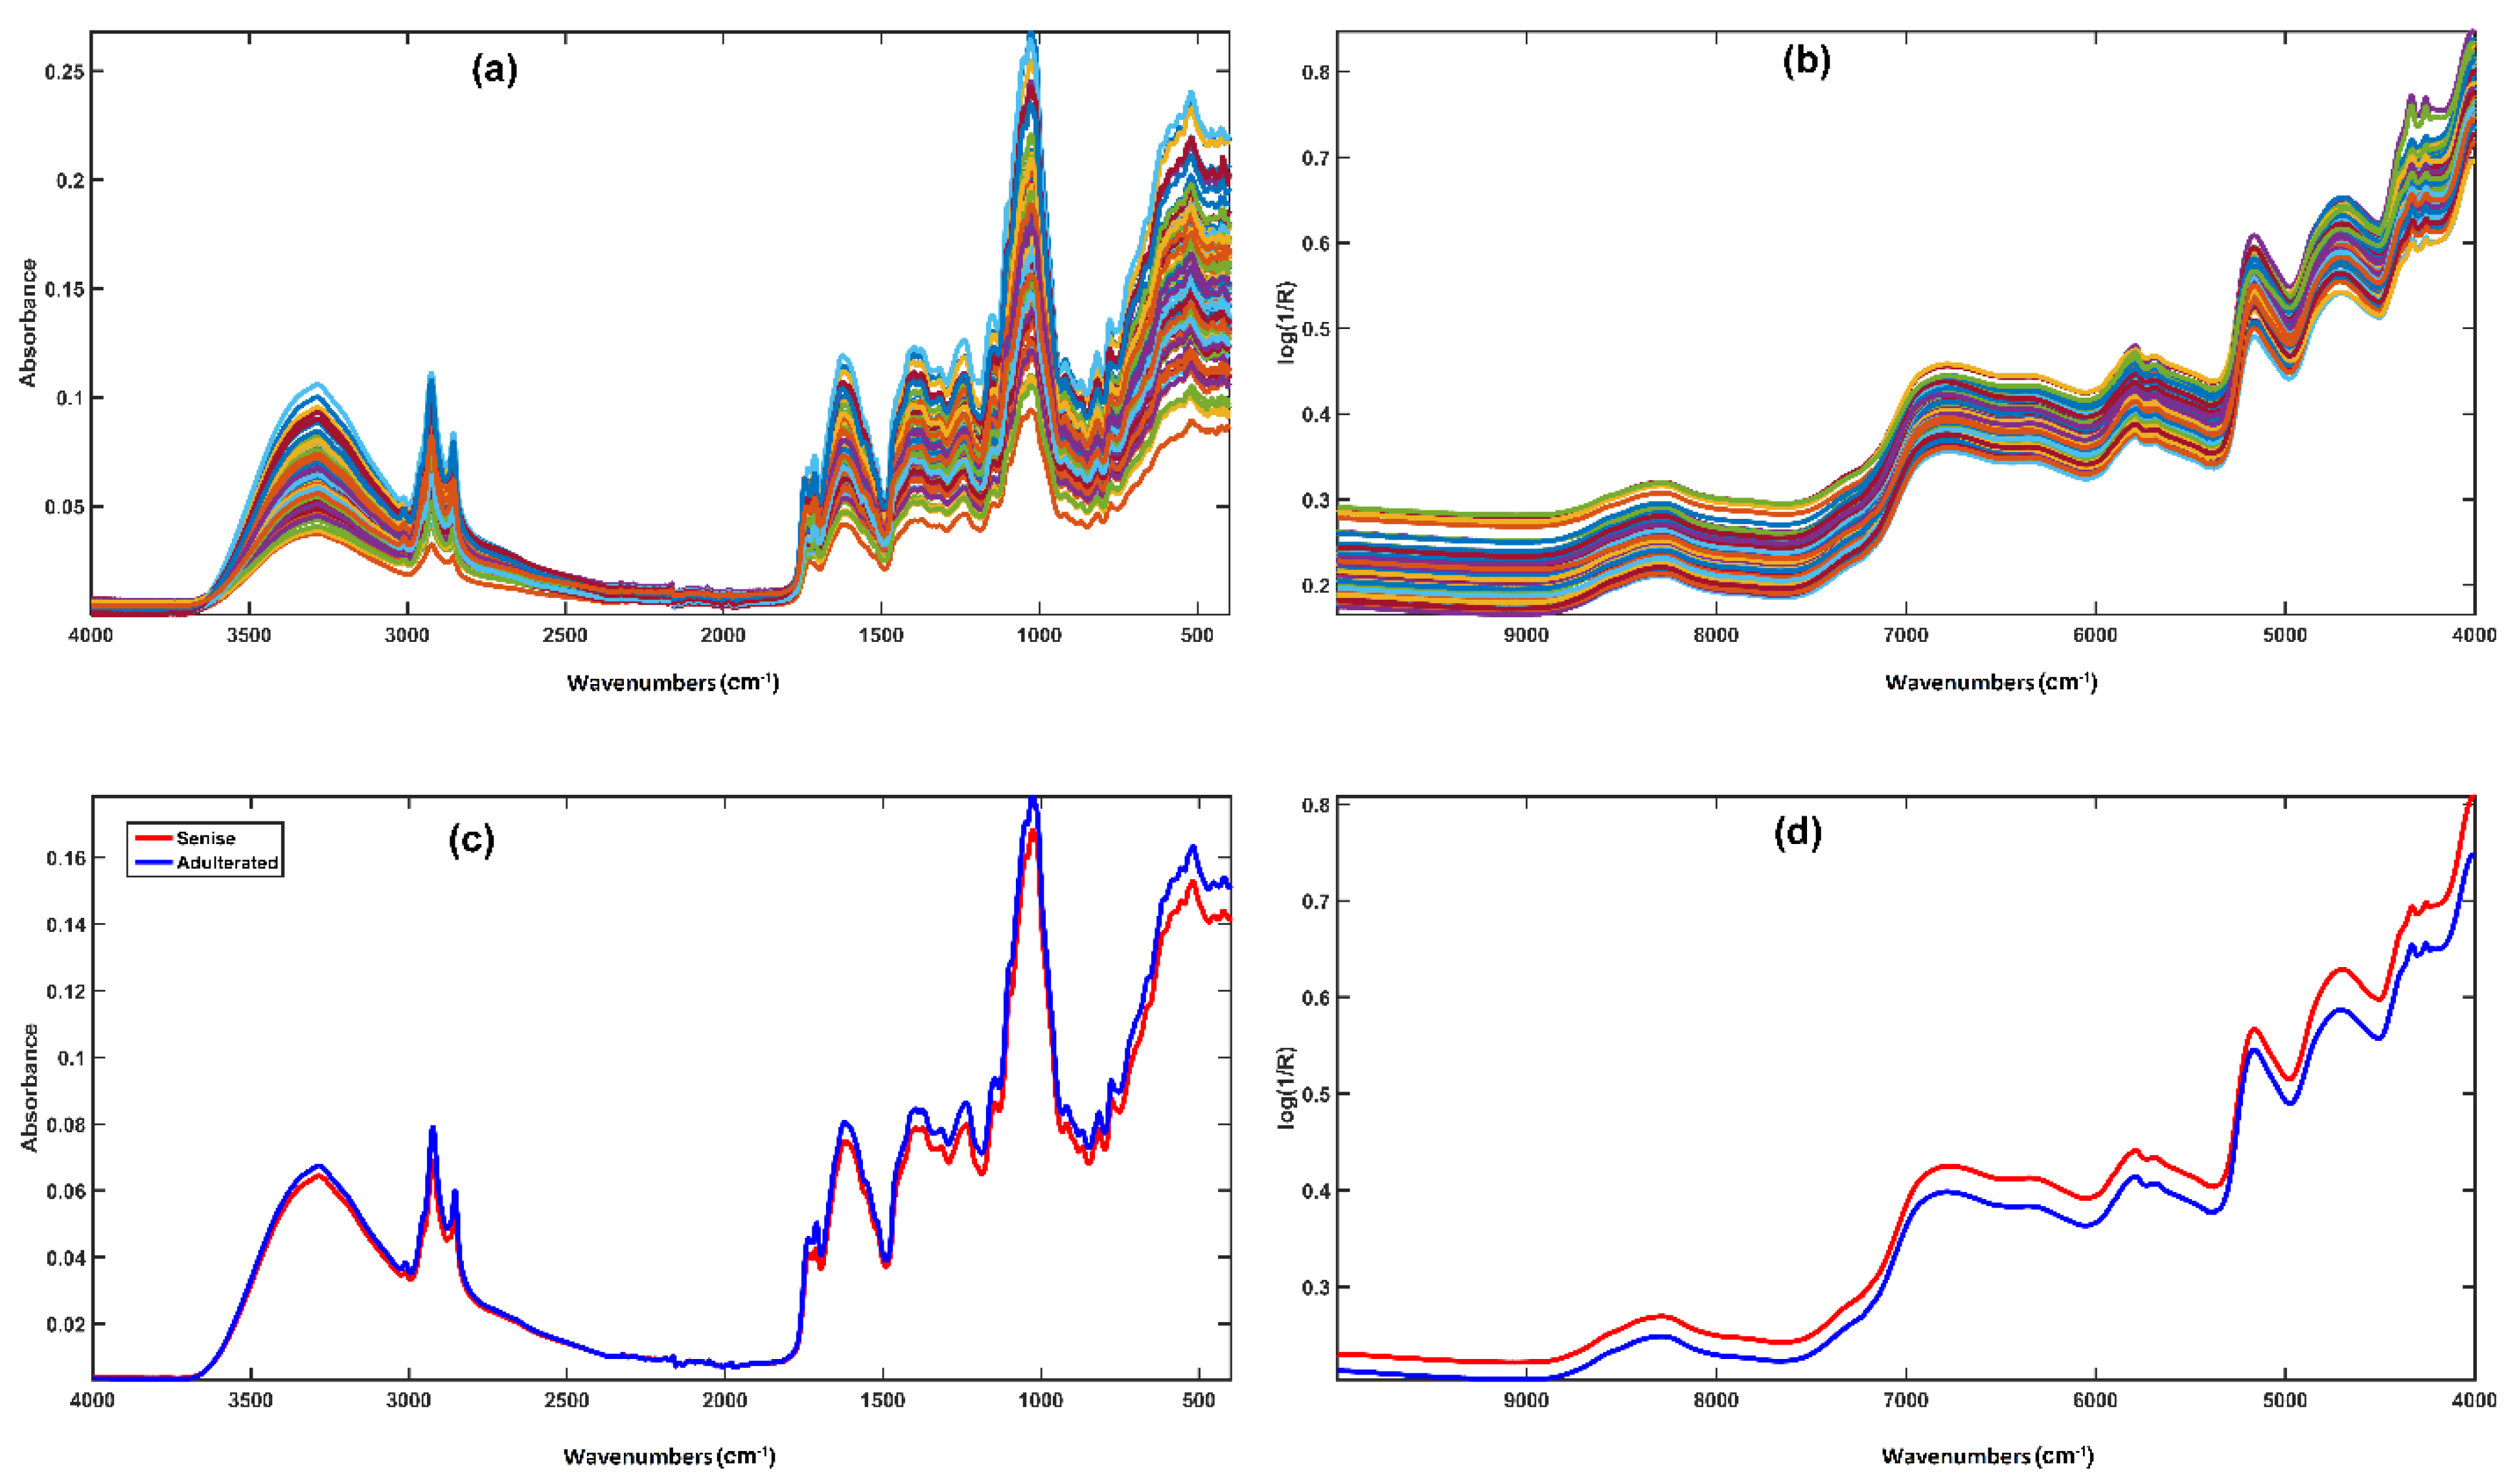
2.1.1. NIR Measurements

All the available samples were analyzed in diffuse reflectance by a Fourier transform- Near infrared (FT-NIR) instrument (Nicolet 6700, Thermo Scientific Inc., Madison, WI, USA) equipped with an integrating sphere which allowed the direct analysis of the samples without any further pretreatment.
An aliquot of each sample was introduced into a glass vial collocated on the top of the window of the integrating sphere. For each sample, two analytical replicates were analyzed in the spectral range between 4000 cm−1 and 10,000 cm−1, at a nominal resolution of 4 cm−1. Spectra were collected in reflectance mode, visualized by the OMNIC software (Thermo Scientific Inc., Madison, WI, USA) and exported as .CSV files to be further processed by means of in-house written functions running in MATLAB (R2015b; The Mathworks, Natick, MA, USA). Prior to the chemometric analysis, signals (originally acquired as reflectance, R) were converted to pseudo-absorbance (log(1/R)).

2.1.2. MIR Measurements

MIR spectra of both pure and adulterated bell pepper samples were collected using a PerkinElmer Spectrum Two™ (PerkinElmer, Waltham, MA, USA) FT-IR spectrometer, equipped with a PerkinElmer Universal Attenuated Total Reflectance (uATR) device (with single bounce diamond crystal) and a deuterated triglycine sulfate (DTGS) detector. The inspected spectral range was between 4000 cm−1 and 400 cm−1 (1 cm−1 nominal resolution). The background was collected with the crystal exposed to the air and updated (approximately) every hour. Any possible sample leftover on the attenuated total reflectance (ATR) crystal was removed using soft tissues and methanol. The cleaning procedure was carried out prior to every measurement and the crystal was air-dried before collecting a new spectrum. IR signals were recorded by pressing the ATR device on the ground samples. The pressure applied was optimized for each sample, by means of a monitoring system implemented in the software of the instrument.

2.2. Data Fusion Approaches: Sequential and Orthogonalized Partial Least Squares-Linear Discriminant Analysis (SO-PLS-LDA) and Sequential and Orthogonalized Covariance Selection-Linear Discriminant Analysis (SO-CovSel-LDA)

Sequential and orthogonalized partial least squares (SO-PLS) [15,22] is a multi-block method conceived for solving regression problems which has been extended to deal with classification problems by combination with linear discriminant analysis (LDA) [23,24]. SO-PLS allows a sequential extraction of non-redundant information from different data blocks and it is particularly suitable to handle highly correlated data sets. Considering the case where two sets of measurements ( X 1 and X 2 ), e.g., data collected by different analytical platforms, are used to estimate a response Y , the SO-PLS algorithm can be briefly summarized as follows:
(a)
Y is fitted to X 1 by PLS regression: Y ^ = X 1 B 1 .
(b)
X 2 is orthogonalized with respect to the X 1 -scores estimated in (a), obtaining X 2 , O r t h
(c)
X 2 , O r t h is fitted to the residuals from step (a) by partial least squares (PLS) regression.
(d)
The overall regression model is obtained by combining the outcomes of (a) and (c), and can be expressed as: Y ^ = Y ^ 1 + Y ^ 2 , o r t h = X 1 B 1 + X 2 ,   o r t h B 2 , o r t h , where the hat (^) indicates model predictions and B 1 and B 2 , o r t h are the regression coefficient matrices.
In order to use SO-PLS to deal with classification problems, i.e., in SO-PLS-LDA, at first, information about class belonging has to be encoded in a dummy response matrix, as it is customarily performed in partial least squares-discriminant analysis (PLS-DA). Then, a SO-PLS regression model is calculated between the independent blocks of data and the dummy Y and eventually, once the SO-PLS model is built, LDA can be applied either to the concatenated scores of scores of X 1 and X 2 , O r t h or to the predicted responses [15,24].
SO-CovSel is a multi-block regression method derived from SO-PLS [25]. The two approaches present a similar algorithm; the main difference lies in the fact that, while in SO-PLS feature reduction is achieved by extracting latent variables (PLS components) from the independent blocks, in SO-CovSel, experimental variables are selected by means of an algorithm known as covariance selection [26]. This leads to the fact that the regression steps in (a) and (c) involve ordinary least squares instead of PLS and that X 2 is orthogonalized with respect to the variables selected by CovSel on X 1 . Consequently, SO-CovSel (for a two-predictor blocks case) involves the following steps:
(a)
A set of X 1 -variables are selected by means of CovSel (obtaining X 1 S e l ).
(b)
Y is fitted to X 1 S e l by means of ordinary least squares (OLS).
(c)
X 2 is orthogonalized with respect to X 1 S e l (obtaining X 2 , O r t h ).
(d)
A set of X 2 , O r t h -variables are selected by means of CovSel (obtaining X 2 , O r t h S e l   ).
(e)
The Y -residuals from step (a) are fitted to X 2 , O r t h S e l by means of OLS.
(f)
The overall regression model is obtained by combining the outcomes of steps (b) and (e):   Y ^ = X 1 S e l B 1 + X 2 ,   O r t h S e l B 2 , O r t h .

3. Results

All the collected spectra were imported in MATLAB for the successive data processing. Since two spectra were acquired on each sample, at first, these two replicates were averaged, leading to two sets of 100 profiles each, one corresponding to the MIR results and the other to the NIR signals, which are displayed in Figure 1a,b, respectively. In the same Figure 1 (panels c, and d), the mean MIR and NIR spectra of the two investigated categories (pure Senise or adulterated) are compared: by looking at the profiles in Figure 1c,d it is apparent that the differences between pure Senise and adulterated samples are rather subtle and that the identification of adulterated samples cannot rely on visual inspection of the recorded signals only.
Prior to the creation of the classification models, samples were divided into a training and a test set by the Duplex algorithm [27], and the splitting was carried out on each class separately. In order to create two representative sets of samples taking into account the variability present in both data blocks, the same procedure as reported in [18] was followed. Briefly, for each category, the MIR and NIR spectra were concatenated row-wise, leading to the two augmented matrices: X S e n i s e A u g .   (= [ X S e n i s e M I R   X S e n i s e N I R ] ) and X A d u l t . A u g . (= [ X A d u l t M I R   X A d u l t N I R ] ). Afterwards, a Principal component analysis (PCA) model was separately calculated on each of the augmented matrices (after block-scaling) and, in both cases, the first five principal components (PCs) were extracted. Eventually, the Duplex algorithm was run individually on each of the two score matrices (i.e., category-wise) and signals were divided accordingly. Of the 100 investigated samples, 65 (40 pure Senise and 25 adulterated) were selected as the training set, while the remaining 35 (20 pure Senise and 15 adulterated) were left out for the validation of the models (test set).
At first, classification models were built on each spectroscopic block individually, both to investigate how efficient any of the two infrared regions could be in allowing the identification of the adulteration of the product and to compare the resulting outcomes with those obtained by the multi-block strategies. For the analysis of the individual data blocks, two different classifiers were used: partial least squares discriminant analysis (PLS-DA) [28] and a classification strategy based on the fusion of different pre-treatments through SO-PLS-LDA known as sequential preprocessing through orthogonalization (SPORT); [29].
Briefly, in the context of classification, SPORT is based on applying different pre-treatments to the spectroscopic matrix of interest, so as to create a multi-block data set, which is then processed by SO-PLS-LDA.

3.1. Classification Models Built on Individual Spectroscopic Blocks

In order to use the SPORT approach to build (and validate) the individual classification models for the MIR and the NIR data sets, each of the two matrices were pre-processed using the following pre-treatments: no pretreatment (raw data), standard normal variate (SNV); [30], first derivative and second derivative (both calculated with a 15 points window and a third order polynomial) [31]. Since SO-PLS-LDA is a sequential model, it is important to specify the order of the blocks, which was the one reported above; moreover, mean centering was always used as a further pre-processing step. For the sake of comparison, PLS-DA analysis was also performed on the MIR and NIR data set after the individual application of the abovementioned pretreatments; consequently, 8 different models (four per data block) were calculated.
The classification accuracy of the PLS-DA and SPORT models built on the MIR and the NIR data both for the training (in cross-validation) and the test sets are summarized in Table 2, together with their optimal complexity (the range of latent variables explored was 0–10). Here it should be stressed that for each data set, in the model selection stage, the number of latent variables (LVs) to be retained in each pre-processing block was selected as the one leading to the lowest classification error in a fivefold cross-validation procedure. Moreover, in the case of PLS-DA, the best pre-processing was also selected based on the maximum classification accuracy in cross-validation.
Looking at the Table, it is possible to notice how the use of SPORT not only allows one to fuse different pre-processings into a single model, but also straightforwardly indicates which ones are most effective to deal with the problem at hand. Indeed, in the case of the MIR signals, only two of the four matrices corresponding to the different pre-treatments contributed with a non-zero number of latent variables to the classification model, i.e., the raw data and the second derivative (with one and four LVs, respectively). The SPORT model on the MIR data performed very well on the training set (around 92% correct classification rate for both classes) but showed a lower though still good predictive accuracy (82.8%, corresponding to five Senise samples and one adulterated sample misclassified) on the test individuals. The comparison of these results with those of the best individual PLS-DA model (which is the one built on data pretreated with the second derivative) indicates that the fusion of different preprocessing strategies could help improving the classification accuracy on the training data; however, in this case, the classification error on the test set is the same. On the other hand, the best model on NIR spectra was created selecting only one LV from the block preprocessed by the first derivative. This led to the perfect classification of all the training objects in cross-validation and an overall accuracy of 94.3% on the test set, corresponding to the misclassification of two adulterated samples. Obviously, since only the first derivative block was selected by SPORT, in the case of the NIR data the results are identical to those of the best PLS-DA model. Anyway, it should be stressed that, for both data sets, the use of SPORT provides comparable or better results without the need to choose the optimal pre-processing strategy.

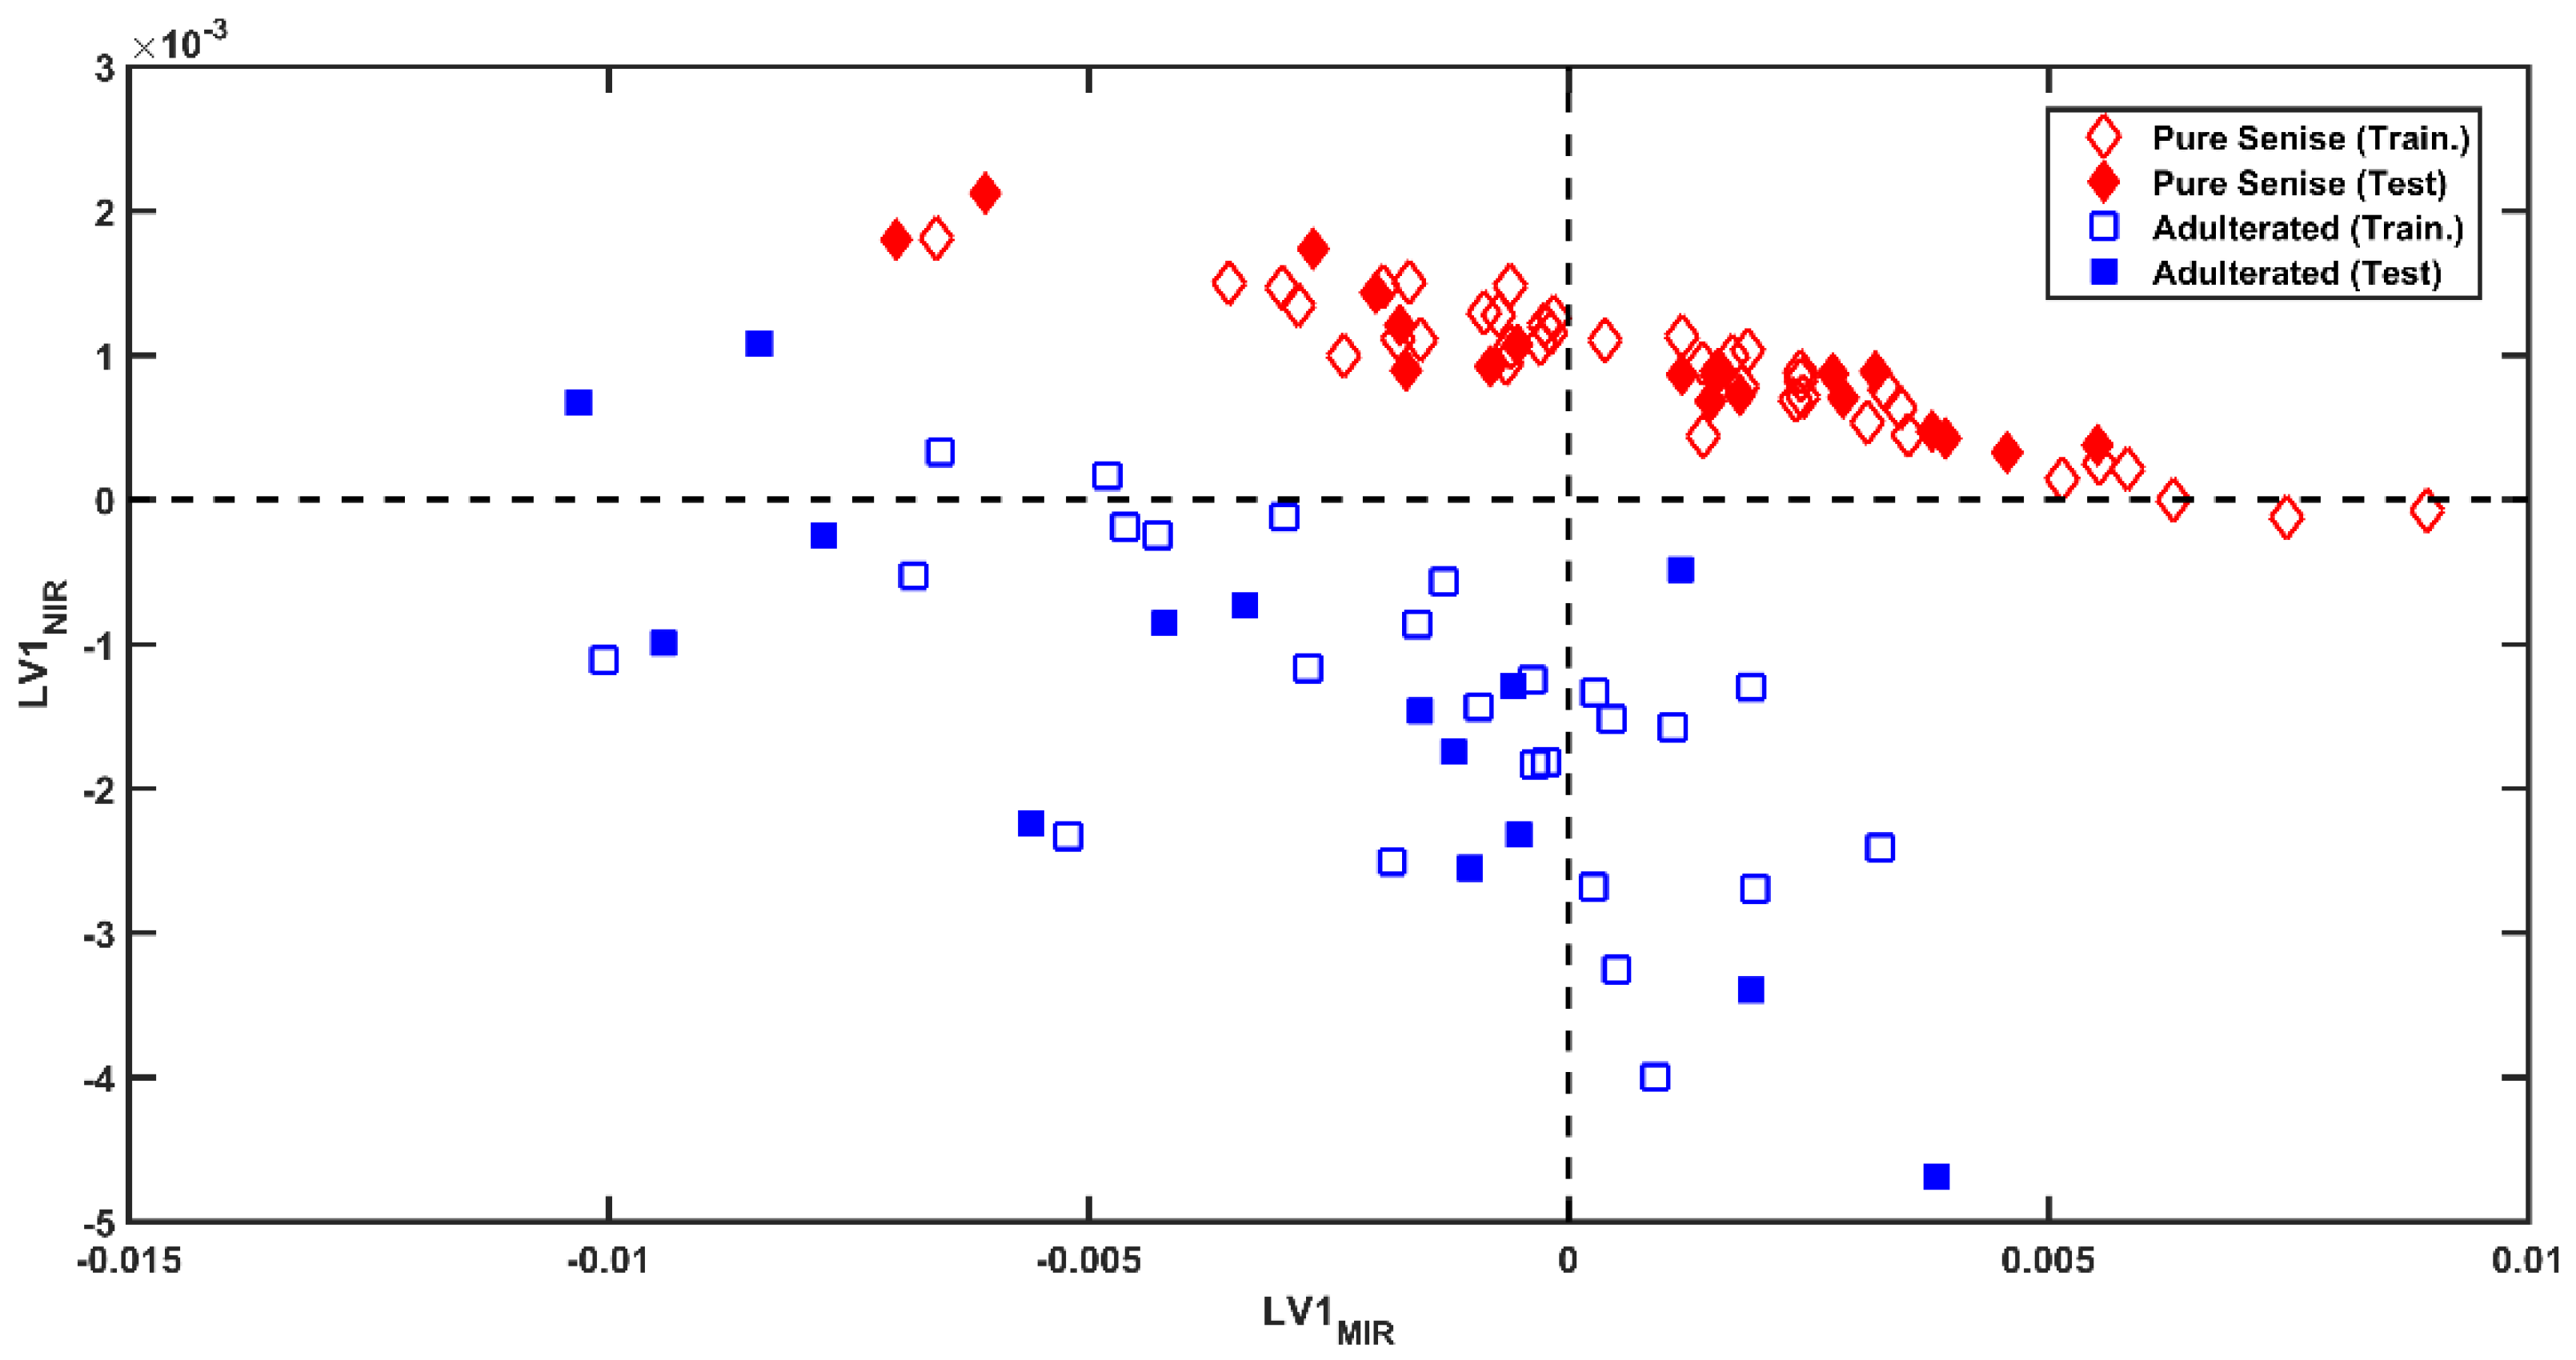
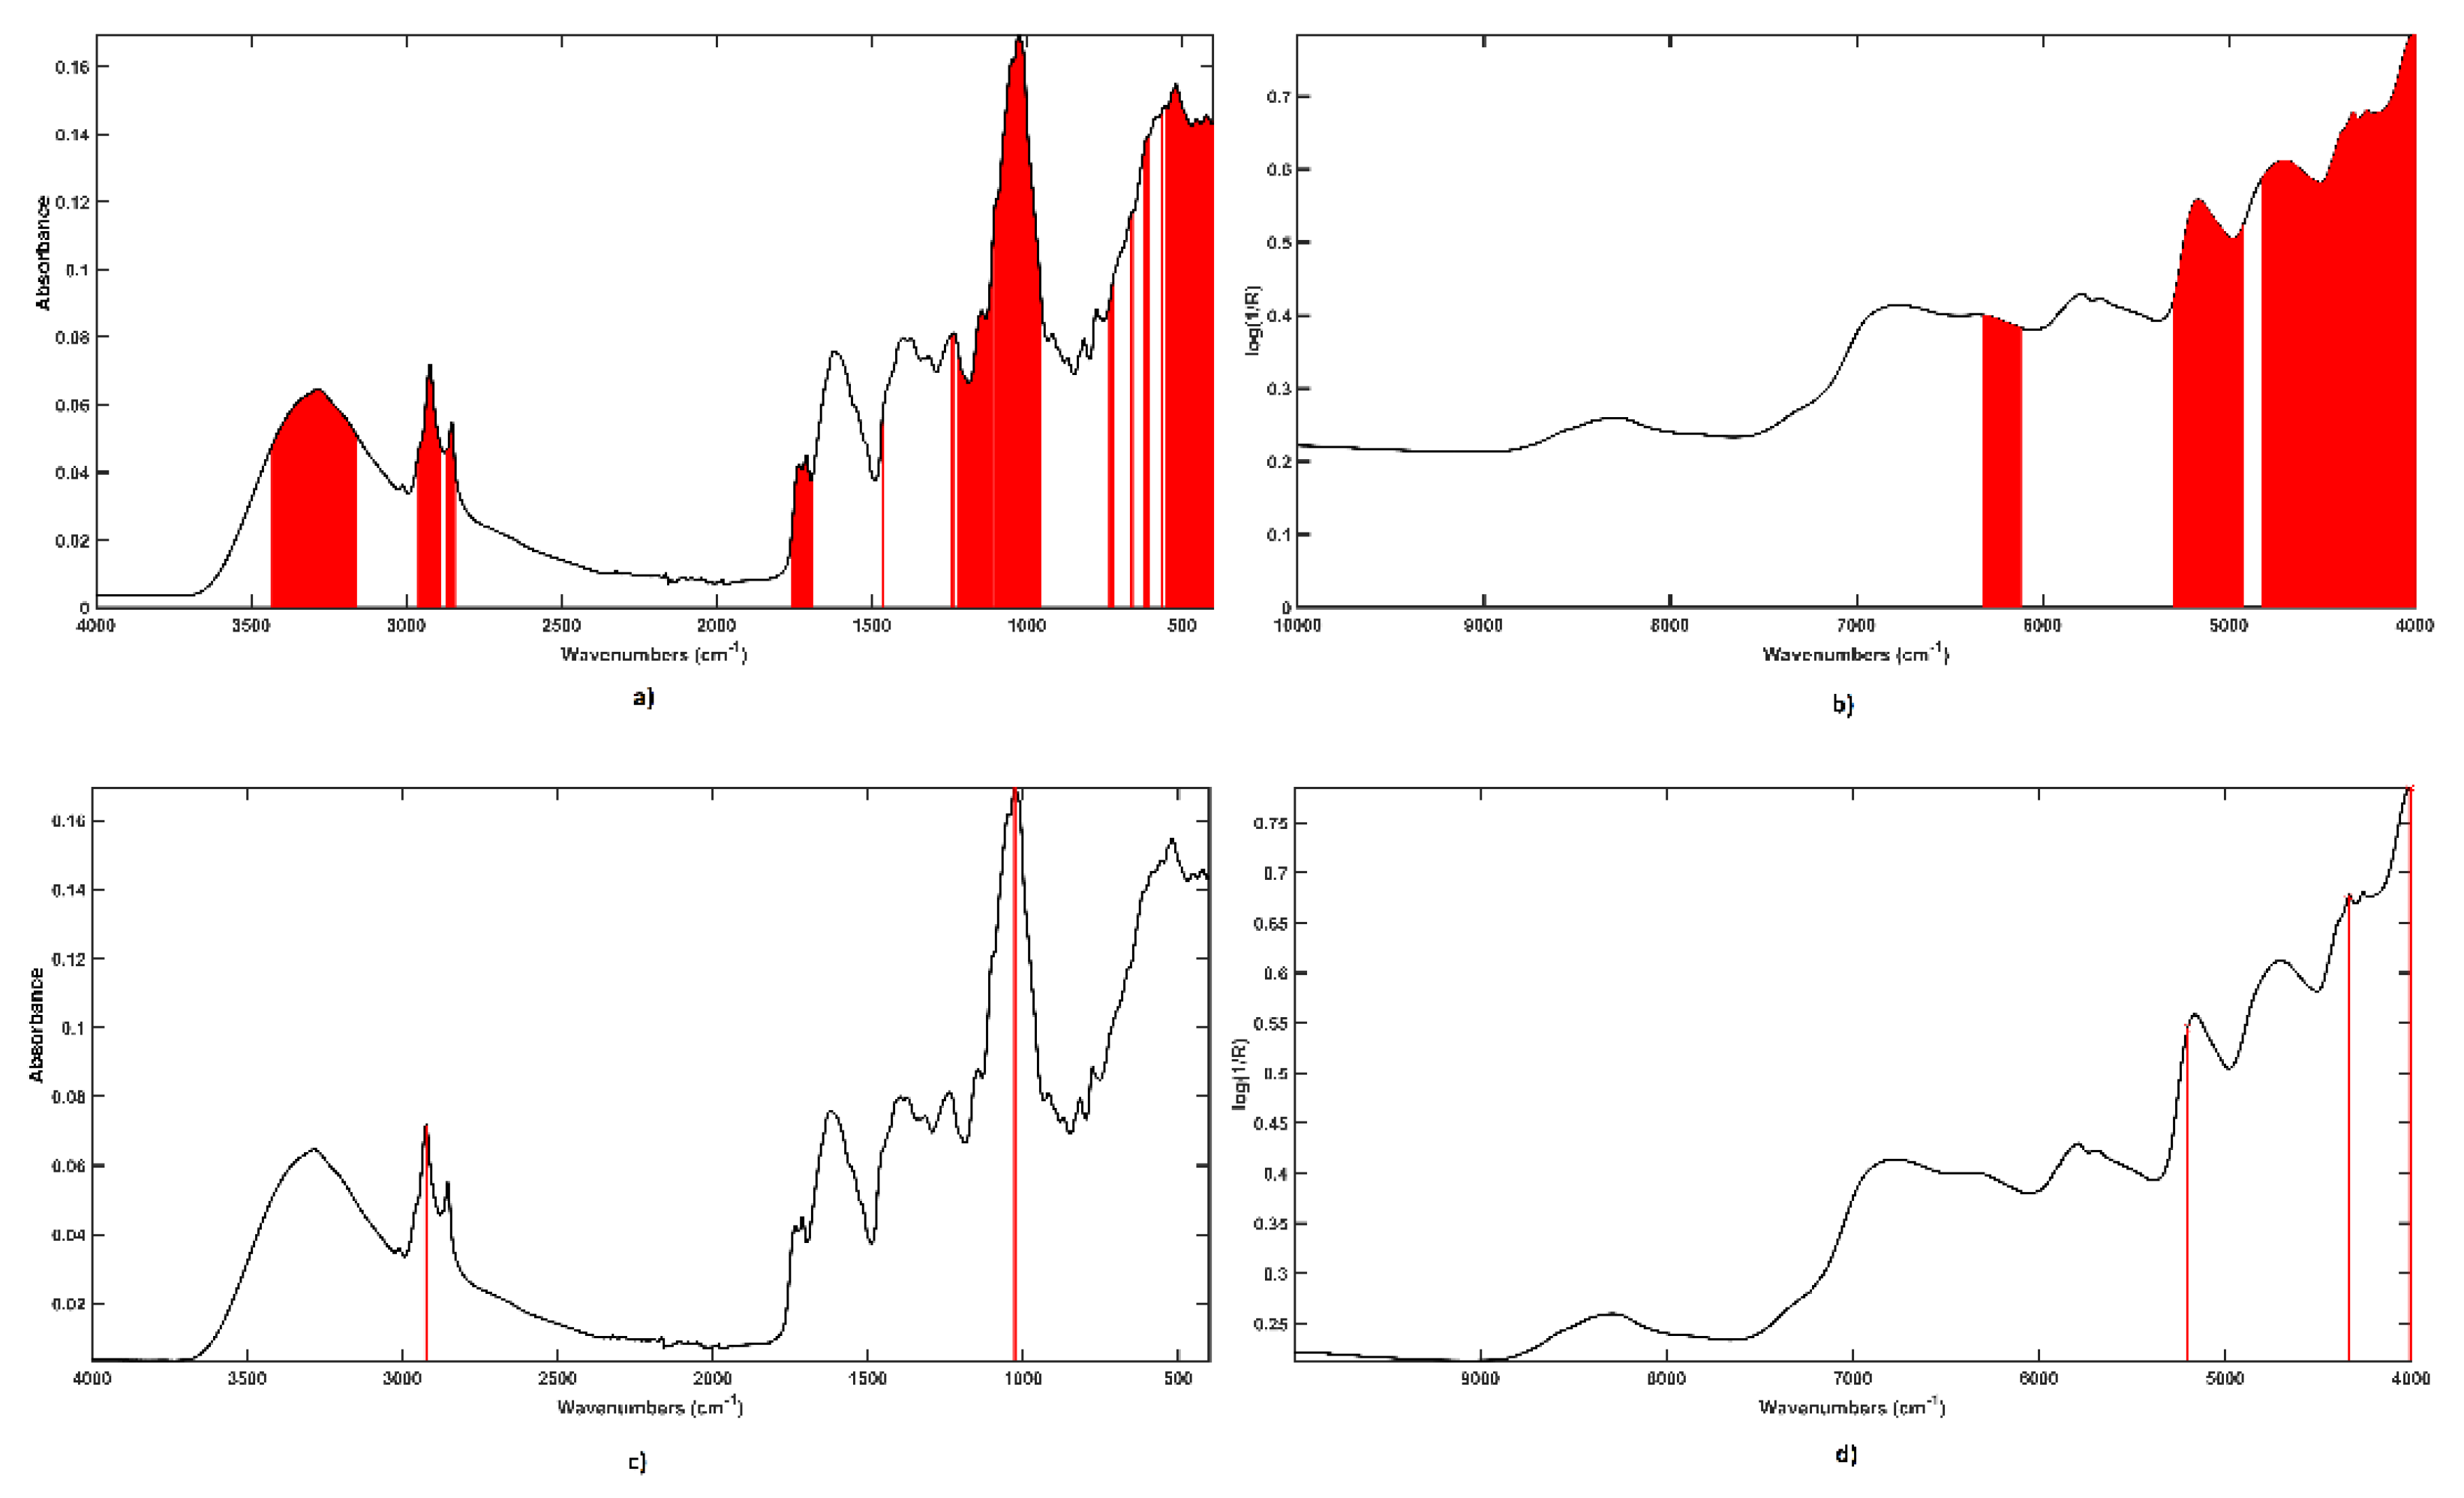
3.2. Multi-Block Analysis

Two multi-block classification approaches, namely SO-PLS-LDA and SO-CovSel-LDA, were used to integrate the information in the two spectroscopic data sets into a single model, hoping that this could also lead to better predictions. In the model selection stage, the best pre-processing and the optimal number of latent/original variables to be retained for each block were identified as those resulting in the lowest classification error in a fivefold cross-validation procedure. Specifically, for each block the same four pre-processings already discussed in the case of the SPORT models were tested, and the optimal combination, consistently with the results obtained on the individual spectroscopic data, was found to be second derivative for MIR and first derivative for NIR. The optimal SO-PLS-LDA model included one latent variable from the MIR block and three from the NIR data matrix. On the other hand, three and two original variables were selected from the NIR and MIR blocks, respectively, to build the SO-CovSel-LDA model. Regardless of the data fusion approach used, both models achieved 100% correct classification in both calibration and validation, correctly assigning all the training and test samples. A graphical representation of the classification accuracy of the SO-PLS-LDA model is displayed in Figure 2, where the projection of the training and test samples onto the space spanned by the first LVs extracted from the MIR and the NIR blocks is shown; this representation exploits the sequential multi-block nature of the SO-PLS algorithm allowing one to straightforwardly visualize the separation between the categories and the within-class scatter [24].The accurate model predictions result from the pure Senise (red diamonds) and adulterated (blue squares) samples were clearly separated in space. Moreover, inspection of Figure 2 also allows one to observe how, as it could be expected given the nature of the samples, the within-class variance of the adulterated category is higher than the one of pure Senise. The distribution of the samples also indicates that the information from both blocks is needed to discriminate between the two classes, since the separation occurs along a direction which is not parallel to any of the axes. At the same time, it is also evident that, consistently with the classification results obtained on the individual blocks, the NIR block is more discriminant than the MIR one, as the two classes are more separated along LV1NIR than on LV1MIR: indeed, almost all the pure Senise samples have positive scores on LV1NIR, while the large majority of the adulterated peppers fall at negative values of the component.
In addition to the excellent classification performances, not only on the training data but, more relevantly, on the test samples, both SO-PLS-LDA and SO-CovSel-LDA models can be interpreted so as to identify what the experimental variables are that contribute the most to the observed discrimination between the investigated categories. Relying on a variable selection algorithm, in SO-CovSel such information results directly from the model building stage, where the most relevant predictors from each block are extracted. On the other hand, in the case of SO-PLS the identification of the variables contributing the most requires a post-hoc analysis of the model parameters, which can be carried out, e.g., by inspecting the values of the variable importance in projection (VIP) scores, as discussed in [32], which was the strategy adopted in the present study. The variables identified as relevant for the SO-PLS-LDA model based on the VIP analysis and those selected by the SO-CovSel-LDA algorithm are graphically compared in Figure 3. In these plots, the relevant predictors in the two blocks are highlighted in red over the corresponding mean spectrum, which is plotted in black. SO-CovSel-LDA has an embedded variable selection step through an algorithm that is specifically designed to provide an extremely parsimonious solution: indeed, only five predictors (two from the MIR and three from the NIR blocks) are selected. On the other hand, the definition of the VIP scores, which are the basis for the identification of the relevant predictors in SO-PLS-LDA, is such that usually, a rather high number of variables is selected. In particular, by adopting the “greater-than-one” criterion to establish whether a predictor was significantly contributing to the model or not, VIP analysis identified 920 variables (over 3601) and 730 variables (over 3112) for the MIR and the NIR blocks, respectively. Despite the differences between the two approaches, it is evident from the Figure that they are consistent in terms of the spectral bands identified as relevant for the discrimination between pure and adulterated Senise samples.
In fact, as far as the MIR block is concerned, VIP analysis identifies as relevant the intervals of 955–1223 cm−1 and 2844–2960 cm−1, while, in the same spectral ranges, SO-CovSel-LDA selects two variables, the peak at 1024 cm−1 and the one at 2924 cm−1, attributable to the C-O-C, C-C and C-O stretching in organic acids and carbohydrates and to the (a) symmetric stretching of CH2 and CH3 [33], respectively. The other relevant spectral intervals selected based on the values of the VIP scores are those between 3171 cm−1 and 3429 cm−1 ascribable to the O-H stretching, and between 1691 cm−1 and 1757 cm−1, probably related to the absorption of the C=O, C=C and the O-H vibrations in phenolic compounds, carotenes and organic acids [33]. For the NIR block, the bands identified as relevant by the VIP analysis of the SO-PLS-LDA model and by SO-CovSel-LDA are highly consistent. In fact, VIP selects the range of 4923–5294 cm−1 while SO-CovSel-LDA the peak at 4337 cm−1, probably indicating that moisture could be a suitable parameter to differentiate pure and adulterated Senise samples. Moreover, SO-CovSel-LDA selected the spectral variable at 4007 cm−1, whereas VIP analysis highlighted as relevant the region between 4000 cm−1 and 4800 cm−1, which can be ascribed to sugars in bell peppers [6], suggesting that those compounds could also represent a marker for the identification of the adulteration of Senise bell peppers with paprika.

4. Conclusions

The present work aimed to develop a spectroscopic-based tool for the authentication of PGI Senise bell pepper, and for detecting its possible adulteration with common paprika. In order to achieve this goal, pure and adulterated Senise bell pepper samples were analyzed by MIR and NIR, and then spectra were jointly classified by means of two different multi-block approaches (SO-PLS-LDA and SO-CovSel-LDA). At the same time, classification models were also built on the individual blocks by means of SPORT, a recently proposed technique which exploits the possibility of combining multiple versions of the same data matrix, differently preprocessed, into a single, boosted model. Even if rather satisfactory results were obtained when using either the MIR (82.8% accuracy on the test set) or the NIR (93.4% accuracy on the test set) block, a perfect classification of all the training and validation samples could only be obtained when integrating the information from both spectral ranges through multi-block approaches.
In particular, in the case of SO-CovSel-LDA, only five variables (three from NIR and two from MIR) were necessary to achieve 100% accuracy. In general, the results have clearly shown that infrared spectroscopy coupled to chemometrics can represent a non-destructive and effective tool for authenticating ground Senise bell pepper, and for detecting its adulteration with common paprika.

Author Contributions

Conceptualization, A.A.D. and F.M. (Federico Marini); methodology, A.B., A.A.D. and F.M. (Federico Marini); software, A.B. and F.M. (Federico Marini); validation, A.A.D. and F.M. (Federico Marini); formal analysis, F.M. (Francesco Merola), F.D.D. and A.B.; investigation, F.M. (Francesco Merola), F.D.D. and A.B.; resources, A.A.D.; data curation, F.M. (Francesco Merola), F.D.D. and A.B.; writing—original draft preparation, A.B. and F.M. (Federico Marini); writing—review and editing, A.B., A.A.D. and F.M. (Federico Marini); visualization, A.B. and F.M. (Federico Marini); supervision, F.M. (Federico Marini) and A.A.D.; project administration, A.A.D.; funding acquisition, A.A.D. All authors have read and agreed to the published version of the manuscript.

Funding

This research received no external funding.

Institutional Review Board Statement.

Not applicable.

Informed Consent Statement

Not applicable.

Data Availability Statement

Data can be obtained from the authors upon request

Conflicts of Interest

The authors declare no conflict of interest.

References

  1. McClure, W.F. Near-Infrared Spectroscopy: The Giant is Running Strong. Anal. Chem. 1994, 66, 43A–53A. [Google Scholar] [CrossRef]
  2. Caballero, B.; Finglas, P.; Toldrá, F. Peppers and chilies. In Encyclopedia of Food and Health; Caballero, B., Finglas, P., Toldra, F., Eds.; Elsevier: Amsterdam, The Netherlands, 2015; pp. 301–306. [Google Scholar]
  3. Gregory, G.K.; Chen, T.-S.; Philip, T. Quantitative Analysis of Carotenoids and Carotenoid Esters in Fruits by HPLC: Red Bell Peppers. J. Food Sci. 1987, 52, 1071–1073. [Google Scholar] [CrossRef]
  4. Gentili, A.; Dal Bosco, C.; Fanali, S.; Fanali, C. Large-scale profiling of carotenoids by using non aqueous reversed phase liquid chromatography–photodiode array detection–triple quadrupole linear ion trap mass spectrometry: Application to some varieties of sweet pepper (Capsicum annuum L.). J. Pharm. Biomed. Anal. 2019, 164, 759–767. [Google Scholar] [CrossRef]
  5. Sora, G.T.S.; Haminiuk, C.W.I.; da Silva, M.V.; Zielinski, A.A.F.; Gonçalves, G.A.; Bracht, A.; Peralta, R.M. A comparative study of the capsaicinoid and phenolic contents and in vitro antioxidant activities of the peppers of the genus Capsicum: An application of chemometrics. J. Food Sci. Technol. 2015, 52, 8086–8094. [Google Scholar] [CrossRef] [PubMed] [Green Version]
  6. Sánchez, M.-T.; Torres, I.; de la Haba, M.-J.; Chamorro, A.; Garrido-Varo, A.; Pérez-Marín, D. Rapid, simultaneous, and in situ authentication and quality assessment of intact bell peppers using near-infrared spectroscopy technology. J. Sci. Food Agric. 2019, 99, 1613–1622. [Google Scholar] [CrossRef] [PubMed]
  7. Amirvaresi, A.; Nikounezhad, N.; Amirahmadi, M.; Daraei, B.; Parastar, H. Comparison of near-infrared (NIR) and mid-infrared (MIR) spectroscopy based on chemometrics for saffron authentication and adulteration detection. Food Chem. 2021, 344. [Google Scholar] [CrossRef] [PubMed]
  8. Aykas, D.P.; Menevseoglu, A. A rapid method to detect green pea and peanut adulteration in pistachio by using portable FT-MIR and FT-NIR spectroscopy combined with chemometrics. Food Control 2021, 121. [Google Scholar] [CrossRef]
  9. Di Donato, F.; Di Cecco, V.; Torricelli, R.; D’Archivio, A.A.; Di Santo, M.; Albertini, E.; Veronesi, F.; Garramone, R.; Aversano, R.; Marcantonio, G.; et al. Discrimination of potato (solanum tuberosum l.) accessions collected in majella national park (abruzzo, Italy) using mid-infrared spectroscopy and chemometrics combined with morphological and molecular analysis. Appl. Sci. 2020, 10, 1630. [Google Scholar] [CrossRef] [Green Version]
  10. Firmani, P.; Bucci, R.; Marini, F.; Biancolillo, A. Authentication of “Avola almonds” by near infrared (NIR) spectroscopy and chemometrics. J. Food Compos. Anal. 2019, 82, 103235. [Google Scholar] [CrossRef]
  11. Firmani, P.; La Piscopia, G.; Bucci, R.; Marini, F.; Biancolillo, A. Authentication of P.G.I. Gragnano pasta by near infrared (NIR) spectroscopy and chemometrics. Microchem. J. 2020, 152, 104339. [Google Scholar] [CrossRef]
  12. Biancolillo, A.; Boqué, R.; Cocchi, M.; Marini, F. Data Fusion Strategies in Food Analysis. Data Handl. Sci. Technol. 2019, 31, 271–310. [Google Scholar]
  13. Frank, I.E.; Kowalski, B.R. prediction of wine quality and geographic origin from chemical measurements by parital least-squares regression modeling. Anal. Chim. Acta 1984, 162, 241–251. [Google Scholar] [CrossRef]
  14. Skov, T.; Honoré, A.H.; Jensen, H.M.; Næs, T.; Engelsen, S.B. Chemometrics in foodomics: Handling data structures from multiple analytical platforms. TrAC Trends Anal. Chem. 2014, 60, 71–79. [Google Scholar] [CrossRef]
  15. Biancolillo, A.; Næs, T. The Sequential and Orthogonalized PLS Regression for Multiblock Regression: Theory, Examples, and Extensions. Data Handl. Sci. Technol. 2019, 31, 157–177. [Google Scholar] [CrossRef]
  16. Biancolillo, A.; Preys, S.; Gaci, B.; Le-Quere, J.-L.; Laboure, H.; Deuscher, Z.; Cheynier, V.; Sommerer, N.; Fayeulle, N.; Costet, P.; et al. Multi-block classification of chocolate and cocoa samples into sensory poles. Food Chem. 2021, 340. [Google Scholar] [CrossRef] [PubMed]
  17. Biancolillo, A.; Marini, F.; D’Archivio, A.A. Geographical discrimination of red garlic (Allium sativum L.) using fast and non-invasive Attenuated Total Reflectance-Fourier Transformed Infrared (ATR-FTIR) spectroscopy combined with chemometrics. J. Food Compos. Anal. 2020, 86, 103351. [Google Scholar] [CrossRef]
  18. Firmani, P.; Nardecchia, A.; Nocente, F.; Gazza, L.; Marini, F.; Biancolillo, A. Multi-block classification of Italian semolina based on Near Infrared Spectroscopy (NIR) analysis and alveographic indices. Food Chem. 2020, 309, 125677. [Google Scholar] [CrossRef] [PubMed]
  19. Giannetti, V.; Mariani, M.B.; Marini, F.; Torrelli, P.; Biancolillo, A. Grappa and Italian spirits: Multi-platform investigation based on GC–MS, MIR and NIR spectroscopies for the authentication of the Geographical Indication. Microchem. J. 2020, 157, 104896. [Google Scholar] [CrossRef]
  20. Schiavone, S.; Marchionni, B.; Bucci, R.; Marini, F.; Biancolillo, A. Authentication of Grappa (Italian grape marc spirit) by Mid and Near Infrared spectroscopies coupled with chemometrics. Vib. Spectrosc. 2020, 107, 103040. [Google Scholar] [CrossRef]
  21. Tao, L.; Via, B.; Wu, Y.; Xiao, W.; Liu, X. NIR and MIR spectral data fusion for rapid detection of Lonicera japonica and Artemisia annua by liquid extraction process. Vib. Spectrosc. 2019, 102, 31–38. [Google Scholar] [CrossRef]
  22. Næs, T.; Tomic, O.; Mevik, B.-H.; Martens, H. Path modelling by sequential PLS regression. J. Chemom. 2011, 25, 28–40. [Google Scholar] [CrossRef]
  23. Fisher, R.A. The use of multiple measurements in taxonomic problems. Ann. Eugen. 1936. [Google Scholar] [CrossRef]
  24. Biancolillo, A.; Måge, I.; Næs, T. Combining SO-PLS and linear discriminant analysis for multi-block classification. Chemom. Intell. Lab. Syst. 2015, 141, 58–67. [Google Scholar] [CrossRef]
  25. Biancolillo, A.; Marini, F.; Roger, J.-M. SO-CovSel: A novel method for variable selection in a multiblock framework. J. Chemom. 2020, 34, e3120. [Google Scholar] [CrossRef]
  26. Roger, J.M.; Palagos, B.; Bertrand, D.; Fernandez-Ahumada, E. CovSel: Variable selection for highly multivariate and multi-response calibration. Application to IR spectroscopy. Chemom. Intell. Lab. Syst. 2011. [Google Scholar] [CrossRef] [Green Version]
  27. Snee, R.D. Validation of Regression Models: Methods and Examples. Technometrics 1977, 19, 415–428. [Google Scholar] [CrossRef]
  28. Barker, M.; Rayens, W. Partial least squares for discrimination. J. Chemom. 2003. [Google Scholar] [CrossRef]
  29. Roger, J.-M.; Biancolillo, A.; Marini, F. Sequential preprocessing through ORThogonalization (SPORT) and its application to near infrared spectroscopy. Chemom. Intell. Lab. Syst. 2020, 199. [Google Scholar] [CrossRef]
  30. Barnes, R.J.; Dhanoa, M.S.; Lister, S.J. Standard normal variate transformation and de-trending of near-infrared diffuse reflectance spectra. Appl. Spectrosc. 1989. [Google Scholar] [CrossRef]
  31. Savitzky, A.; Golay, M.J.E. Smoothing and Differentiation of Data by Simplified Least Squares Procedures. Anal. Chem. 1964. [Google Scholar] [CrossRef]
  32. Biancolillo, A.; Liland, K.H.; Måge, I.; Næs, T.; Bro, R. Variable selection in multi-block regression. Chemom. Intell. Lab. Syst. 2016, 156. [Google Scholar] [CrossRef]
  33. Cortés-Estrada, C.E.; Gallardo-Velázquez, T.; Osorio-Revilla, G.; Castañeda-Pérez, E.; Meza-Márquez, O.G.; López-Cortez, M.D.S.; Hernández-Martínez, D.M. Prediction of total phenolics, ascorbic acid, antioxidant capacities, and total soluble solids of Capsicum annuum L. (bell pepper) juice by FT-MIR and multivariate analysis. LWT 2020, 126. [Google Scholar] [CrossRef]
Figure 1. Raw MIR (a) and NIR (b) spectra (after averaging replicated measurements) of the investigated samples. Comparison between the mean profiles of Senise (red) and adulterated (blue) samples: (c) MIR; (d) NIR. MIR/NIR: mid- and near-infrared spectroscopies.
Applsci 11 01709 g001
Figure 2. Sequential and orthogonalized partial least squares linear discriminant analysis (SO-PLS-LDA) analysis: projection of the training (empty symbols) and test (filled symbols) samples onto the sub-space spanned by the first LV extracted from the MIR block (LV1MIR) and the first LV extracted from the NIR block (LV1NIR). Legend: pure Senise: red diamonds; adulterated: blue squares.
Applsci 11 01709 g002
Figure 3. SO-PLS-LDA: MIR (a) and NIR (b) variables identified as relevantly contributing to the model based on the value of their variable importance in projection (VIP) score (highlighted in red). Sequential and orthogonalized covariance selection linear discriminant analysis (SO-CovSel-LDA): MIR (c) and NIR (d) variables selected by the model. In all cases, the mean spectroscopic profiles are displayed as black continuous line.
Applsci 11 01709 g003
Table 1. Adulterated samples, percentage of the adulterant (paprika).
Sample #Adulterant (%)Sample #Adulterant (%)Sample #Adulterant (%)Sample #Adulterant (%)
1 21162110.53129
22.5126.522113231
32.813723133333
43147.524153435
53.515825173537
64168.526193639
74.517927203743
85189.528233846
95.5199.729253948
105.7201030274050
Table 2. Results of partial least squares-discriminant analysis (PLS-DA) and sequential preprocessing through orthogonalization (SPORT) classification for the MIR and the NIR data sets.
MethodData SetOptimal Number of LVsCorrect Classification Rate (%)
RawSNV 1st Der. 2nd Der. Training Set
(Cross-Validation)
Test Set
(Prediction)
SeniseAdulteratedSeniseAdulterated
PLS-DAMIR3 80.072.0
4 80.076.0
3 80.084.0
387.580.075.093.3
PLS-DANIR2 100.092.0
3 100.092.0
1 100.0100.0100.086.7
2100.0100.0
SPORTMIR100492.592.075.093.3
NIR0010100.0100.0100.086.7
Publisher’s Note: MDPI stays neutral with regard to jurisdictional claims in published maps and institutional affiliations.

