1. Introduction
For some time, it has been possible to observe the interest of both producers and consumers in the confectionery market in products with the addition of functional ingredients. One of the categories of functional additions are components with antioxidative properties, which can reduce the level of oxidative stress in cells. Food by-products are mainly considered rich and cheap sources of valuable compounds for supplementation of confectionery and bakery products [
1,
2,
3,
4,
5,
6,
7,
8,
9,
10,
11,
12,
13,
14,
15]. Recently, the effect of different amounts (5–95%) of agro-industrial by-products such as olive stone powder, okara powder, prickly pear peel, fruit pomaces (rosehip, rowanberry, blackcurrant, elderberry, grape, and blueberry), fruit by-products (pineapple central axis, apple endocarp, melon peels, waste left after goji berry concentrate extraction), cocoa shell, soybean meal and fermented soybean meal, defatted chia flour, and defatted sunflower seed flour on the antioxidant capacity (AC) of biscuits, cookies, and muffins has been analyzed by 2,2-diphenyl-1-picrylhydrazyl (DPPH), 2,2′-azinobis-(3-ethylbenzo-thiazoline-6-sulfonic acid) (ABTS), ferric reducing antioxidant potential (FRAP), β-carotene/linoleic acid, phosphomolybdenum complex, oxygen radical absorbance capacity (ORAC), cupric reducing antioxidant capacity (CUPRAC), and Folin-Ciocalteu (F-C) assays [
1,
3,
5,
6,
7,
8,
9,
10,
11,
12,
13,
14,
15]. However, there is little information on the optimization of the dough formulations to maximize functional properties, mainly antioxidant potential of confectionery products enriched with agro-industrial by-products. This knowledge is needed for the improvement of production processes and commercial applications. Response surface methodology (RSM) was only applied to optimize antioxidant capacity determined by ABTS method and total phenolic content (TPC) in the formulation of cookies supplemented with blueberry pomace [
7]. Moreover, RSM-based models were proposed to study the effect of replacing WF with organic grape flour (13.06–16.74%), interesterified fat concentration (23.96–34.04%), and sucrose content (11.96–22.04%) on the sensory properties (appearance aroma, flavor, texture, overall impression) of the fortified cookies, and to evaluate the predictive ability of these mathematical models to describe general acceptability of final product [
4]. The combined impact of three independent variables, carrot pomace powder (10–20 g), finger millet flour (2.5–7.5 g), and baking time (21–25 min) on general acceptability and physiochemical properties (spread ratio, change in color, amounts of moisture, ash, fat, and fiber, hardness) of the biscuits enriched with waste of carrot juice industry was also optimized by the RSM [
2].
Additionally, the AC and TPC of cookies with cocoa shell, soy flour, and green banana flour developed by the simplex centroid design were analyzed by ABTS, FRAP, β-carotene/linoleic acid, phosphomolybdenum complex, and Fast Blue methods. This experimental design was effective for optimization of the acceptance of cookies made with cocoa shell, a by-product of the chocolate industry [
11].
However, to the best of our knowledge, there are no reports on the evaluation of the effect of rapeseed press cake (RPC) flour and type of fat on antioxidant properties and sensory quality of baked biscuits. Only the impact of cold pressed RPC, RPC fiber isolate, and RPC alkaline extract on the generation of acrylamide and 5-hydroxymethylfurfural in cookies was investigated. The cookies with RPC had a higher concentration of 5-hydroxymethylfurfural, while the alkaline extract from RPC caused a decrease of acrylamide content in the supplemented cookies [
16].
Rapeseed is the third most abundant oil plant worldwide (after palm and soya) and the primary oil seed crop in Poland. During rapeseed processing, several wastes are generated, and RPC is one of the major types of residual biomass from the rapeseed oil industry [
16,
17]. The RPC can provide a viable and economical source of bioactive compounds, because the varieties grown in Poland have an improved nutritional profile (low amounts of erucic acid and glucosinolates). Nevertheless, glucosinolates and products of their degradation present in RPC can create unique and characteristic flavor, thus, they can be applied as food additives for improvement of the sensory characteristics [
18]. Recently, with the increasing interest in circular economy and zero waste, there is intense effort to revalorize food by-products. For this reason, the RPC as natural source of proteins, carbohydrates, crude fiber, lipids, minerals, as well as polyphenols, glucosinolates, and isothiocyanates having antioxidant, antimicrobial and anticarcinogenic properties can be developed for confectionery applications [
17,
18]. On the other hand, an increase in rapeseed production implies larger domestic supplies of RPC, which would affect the stability of the prices of confectionery enriched with RPC.
Therefore, the aim of this study was to create biscuits with new and attractive for the consumer features that would improve the antioxidant potential and would not cause a deterioration in their sensory properties. The present work is focused for the first time on the optimization of the production of functional and acceptable confectionery products fortified with RPC rich in antioxidants and high quality fats. A central composite experimental design (CCD) and the RSM were used for evaluation of the effects of two independent variables (RPC content—a novel ingredient—and saturated fatty acids (SAFA) content) and their interactions on the response variables: AC determined by the modified DPPH assay and sensory characteristics (color, odor, texture, flavor, overall acceptability, and purchase intent scores) of wheat flour (WF)-based biscuits. Moreover, in the present study, DPPH results of extracts obtained from ingredients (RPC, WF, rapeseed oil, margarine, and coconut oil) and the baked biscuits by the conventional solid/liquid–liquid extraction and the ultrasound-assisted extraction (UAE) were compared and discussed.
The hedonic method was conducted to evaluate the acceptance, desirability, and preferences of biscuits without and with RPC containing various types of fats.
2. Materials and Methods
2.1. Reagents and Samples
All reagents were of analytical or high performance liquid chromatography (HPLC) grade. 2,2-Diphenyl-1-picrylhydrazyl radical (DPPH, 95%), 6-hydroxy-2,5,7,8- tetramethylchromane-2-carboxylic acid (Trolox (TE), 97%) and methanol (99.8%) were purchased from Sigma Aldrich (Poznań, Poland). Redistilled water was used for the preparation of solutions.
The RPC, the primary by-product of the rapeseed oil industry, and the refined rapeseed oil, the final product of a conventional technological process, were provided by a local vegetable oil factory and were stored in an airtight closed poly(ethylene terephthalate) (PET) bag and bottle, respectively, at room temperature. All the other baking ingredients in customary quality, such as WF, refined coconut oil, margarine, sugar, salt, baking powder, and non-carbonated spring water were purchased from the local market. All samples in the original packaging were stored at ambient temperature until treatment and further analysis.
2.2. Biscuits Preparation
Biscuits fortified with RPC were prepared on a laboratory scale according to the following recipe. RPC was milled in the mill (Model FW100, Chemland, Stargard, Poland) and sieved through a mesh sieve of 0.355 mm (Retsch Test Sieve, Haan, Germany) to obtain a uniform size of flour.
The composite flour blends were prepared using various combinations of WF and RPC flour in the ratio of 100:0, 80:20, 60:40, respectively. Three commercial fats such as refined rapeseed oil, margarine, and coconut oil, with a declared SAFA content of 7.5 g/100 g, 26 g/100 g and 83 g/100 g, respectively, were used for preparation of dough formulations. Initially, each flour blend (100 g), salt (1.0 g), and baking powder (2.0 g) were thoroughly mixed. Sugar (45 g) was dissolved in hot spring water (22 mL) and cooled. Finally, 30 g of refined rapeseed oil, margarine and coconut oil containing 2.3 g, 7.8 g and 24.9 g of SAFA, respectively was added separately into mixtures of various powdering ingredients and sugar solution. All ingredients were mixed for 6 min in a hand mixer (5-speed, 500 W, Moulinex, Powermix HM610130, Ecully Cedex, France) at medium speed for 6 min with scraping every 2 min to obtain a homogenous mixtures. Afterwards, solid dough formulations were cooled in a refrigerator at 4 °C for 30 min. Each dough type was kneaded and sheeted to a uniform thickness of 5 mm and cut into circular shapes of 6.5 cm diameter.
The dough pieces were placed on a baking tray with baking paper and baked at 180 °C for 18 min in an electrically heated oven (Electrolux, Warszawa, Poland). Biscuit samples were cooled and stored in airtight plastic containers at ambient temperature before AC and sensory analyses were conducted.
2.3. Determination of Antioxidant Capacity
2.3.1. Samples Preparation by Conventional Solid (Liquid)–Liquid Extraction
Portions of RPC (2.0 g), WF (2.0 g), fats (2.0 g), biscuits (5.0 g of five ground biscuits baked from the same dough formulation), and 70% methanol (20, 15, 5, and 20 mL, respectively), were transferred into Erlenmeyer flasks and shaken using a shaker SK-L 330-Pro (Chemland, Stargard, Poland) at room temperature for 30 min.
Each sample was extracted in triplicate, and the residual samples were separated by centrifugation (centrifuge MPW-54, Chemland, Stargard, Poland, 3120× g, 15 min). The pooled extracts were filtered using polytetrafluorethylene syringe filters (PTFE, pore size 0.20 μm/diameter 13 mm, Sigma Aldrich, Poznań, Poland) and stored in a refrigerator at 4 °C prior to analysis.
2.3.2. Samples Preparation by Ultrasound-Assisted Extraction
Portions of RPC (2.0 g), WF (2.0 g), fats (2.0 g), biscuits (5.0 g of five ground biscuits baked from the same dough formulation), and 70% methanol (20, 15, 5, and 20 mL, respectively), were transferred into Erlenmeyer flasks and placed in an ultrasonic cleaner bath (5200DTD, Chemland, Poland) with a frequency of 40 kHz, ultrasound input power of 180 W and heating power of 800 W, equipped with a digital timer and temperature controller. The ultrasonic bath’s water level was adjusted so that it was slightly higher than the level of samples and solvent into Erlenmeyer flasks. The UAE was performed for 5 min, and the temperature was kept constant at 25 ± 0.3 °C.
The same sample was sonicated in triplicate and centrifuged at 1880× g for 15 min (centrifuge MPW-54, Chemland, Stargard, Poland). The supernatants were filtered through a PTFE syringe filter (0.20 μm/13 mm) and collected for subsequent determination of the AC.
2.3.3. DPPH Method
The AC of major ingredients and prepared biscuits were analyzed spectrophotometrically according to a modified DPPH procedure described previously [
19]. Briefly, 0.01–0.70 mL of methanolic extracts obtained by conventional solid (liquid)/liquid extraction and UAE were added to 1.99–1.30 mL of methanol and 0.5 mL of DPPH methanolic solution (304.0 μmol/L). The changes in color from deep violet to light yellow were measured at 517 nm against a reagent blank (2 mL of methanol + 0.5 mL of DPPH methanolic solution) after 15 min of reaction using a Hitachi U-2900 spectrophotometer (Tokyo, Japan). The DPPH values were expressed as micromoles of Trolox equivalents (TE) per 100 g of the studied samples.
2.4. Sensory Acceptance Test
Sensory analysis of the baked biscuits was performed using an effective acceptance test with 72 untrained panelists (35 male and 37 female) in the age range of 18–69 recruited among students, staff, and professors of the Faculty of Chemistry, Nicolaus Copernicus University in Toruń, Poland. The sensory test was conducted two days after baking trials using a 9-point hedonic scale (1—“disliked extremely”, 2—“disliked very much”, 3—“disliked moderately”, 4—“disliked slightly”, 5—“neither liked nor disliked”, 6—“liked slightly”, 7—“liked moderately”, 8—“liked very much”, 9—“liked extremely”), according to Stone and Sidel [
20]. The participants were asked to assess the following attributes: liking of color, liking of odor, liking of texture, liking of flavor, and overall acceptability. Additionally, the purchase intent was evaluated using a 5-point scale (1—“certainly would not buy” and 5—“certainly would buy”). For this reason, there was a question: “How likely is it that you will buy this product if it will be available at stores?” at the end of the questionnaire card.
Each untrained panelist evaluated a total of eleven biscuits in an odor-free plastic container with a lid labeled with a 3-digit code in a randomized order to avoid an order effect [
21]. Warm dark tea was used by the panelists to rinse the mouth between samples testing.
2.5. Determination of Biscuit Physical Properties
The physical properties, such as diameter, thickness, spread ratio, and weight of biscuits were measured according to the procedures described by Mildner-Szkudlarz et al. [
8]. Six biscuits were laid edge to edge and measured for diameter (mm). The biscuits were rotated through 90° and the diameter were remeasured. Than the average value was taken. Thickness was measured by stacking six biscuits on top of each other and taking average thickness (mm). Spread ratio was calculated by dividing the value of diameter by value of biscuits’ thickness. Biscuits’ weight was determined using an analytical electronic balance (precision—0.0001 g, model AS 110.R2, Radom, Poland).
2.6. Statistical Analysis and Experimental Design for Optimization
The AC values of the baked biscuits were analyzed by five-fold determination of each methanolic extract obtained by conventional extraction and UAE within the same day using the modified DPPH method. The results obtained were presented as the mean ± standard deviation (SD). All data were statistically evaluated by the analysis of variance (ANOVA) test. A post hoc Duncan’s test was applied for the calculation of the significant differences among mean values of characteristic oil parameters at the probability level p < 0.05.
The RSM was applied to study the simultaneous effects of the RPC content and SAFA content in fats used for biscuits preparation on their AC determined by DPPH method and sensory characteristics. The levels of RPC and SAFA for a CCD and RSM were determined on the basis of preliminary experiments carried out and were varied from 0 to 40 g and 2.3–24.9 g, respectively. The experimental design used for the analysis was a CCD with two factors and three levels. In this experimental design, the factor levels were coded using “−1” for the lowest level (0 g and 2.3 g for RPC content and SAFA content, respectively), “1” for the highest level (40 g and 24.9 g for RPC content and SAFA content, respectively), and “0” for neutral (middle) level (20 g and 7.8 g for RPC content and SAFA content, respectively). The experiments consisted of 11 runs with two factors and two replicates of the central point for the estimation of pure error. The effect of the two independent variables (RPC content and SAFA content) on the responses (Y
n, Y
1—DPPH
CE, Y
2—DPPH
UAE, Y
3—color, Y
4—odor, Y
5—texture, Y
6—flavor, Y
7—overall acceptability, and Y
8—purchase intent) was modeled using a polynomial response surface. The second-order response function for the experiments was predicted by the following equation:
where Y
n is one of the eight responses; RPC and SAFA represent the independent variables; β
0 is the constant; β
1, β
2 are the linear-term coefficients; β
11, β
22 are the quadratic-term coefficients; and β
12 is the cross-term coefficient.
The fitness of the model was evaluated by the determination coefficient R2, the fraction of the variation explained by the model, and analysis of variance (ANOVA). The F-test was applied to confirm whether the variance explained by the regression model was significantly larger than the variance of the residual and to evaluate the model lack-of-fit (model error).
The effects of two factors (RPC content and SAFA content) and their interactions on DPPH in methanolic extracts of biscuits obtained by conventional extraction and UAE, as well as sensory characteristics, were displayed in surface and contour plots. The chemometric analyses were constructed using the Statistica 8.0 software (StatSoft, Tulsa, OK, USA). However, Fizz software (Biosystemes, Courtenon, France) was applied for the collection of all sensory data.
3. Results and Discussion
3.1. Antioxidant Properties of Biscuits’ Ingredients
A low-cost and simple DPPH assay based on spectrophotometric mixed-mode (having both electron transfer (ET) and hydrogen atom transfer (HAT) mechanisms) was proposed as the most suitable method to determine the AC of ingredients used in the preparation of functional biscuits. This assay was chosen due to the fact that DPPH radical is known to work well with lipophilic (rather than hydrophilic) antioxidants in alcohol solvents [
22]. The AC of RPC, WF, rapeseed oil, margarine, and coconut oil was determined by the modified DPPH method after conventional extraction and UAE, and the obtained results are listed in
Table 1.
It is noteworthy that the DPPH values of biscuits’ ingredients differ significantly from each other (Duncan test). Moreover, DPPH results of WF, margarine, and coconut oil extracts prepared using the classical extraction method over 30 min were significantly lower than those obtained by the UAE for 5 min (
Table 1). However, the Duncan test indicated that methanolic extracts from RPC and rapeseed oil after classical extraction, and sonication did not differ significantly in DPPH results.
The UAE permits higher extraction yields in a shorter time, thereby reducing the electrical energy input. An increase in the AC can be explained by the action of the cavitation bubbles generated during the propagation of the acoustic waves. The cavitation bubbles can disrupt the material cell wall, causing solvent diffusion and increasing the release of antioxidant compounds. On the other hand, ultra-sonication contributes to reducing the particle size of the raw material, which increases the surface area. Moreover, the ultrasound waves generate shear force during ultra-sonication thus, the mass transfer of the original material into an extract solution is enhanced [
23].
It is evident that the RPC incorporated into the biscuits was the richest source of antioxidants. The methanolic extracts of RPC revealed the highest DPPH values (15,358 and 15,630 μmol TE/100 g for conventional extraction and UAE, respectively). In our previous report the DPPH ranged between 8770 and 33,980 μmol/100 g for ethanolic, methanolic, and aqueous RPC extracts [
24]. These differences between the DPPH results for RPC samples can be explained by the influences of genetic, agronomic, environmental, and technological factors, as well as conditions of extract preparation, mainly polarity of the used solvent, which affect the total level of antioxidants.
However, among the evaluated fats, rapeseed oil had the highest DPPH results (424 and 456 μmol TE/100 g after conventional extraction and UAE, respectively), whereas the antioxidant potential of coconut oil determined by the same method was the lowest (87 and 118 μmol TE/100 g after conventional extraction and UAE, respectively) (
Table 1).
Also, Casoni et al. [
25] observed significantly higher radical scavenging capacity of rapeseed oil (RSC = 35.12%) to scavenge DPPH radical than coconut oils (RSC = 0.46–2.26%). This suggests that rapeseed oil is a rich source of antioxidants, mainly tocopherols (78.51 mg/100 g) and phenolic compounds (5.77 mg/100 g), while coconut oil contains a trace amount of tocopherols (2.90 mg/100 g) and phenolics (less than 0.01 mg/100 g) [
26].
Nevertheless, margarine revealed approximately twofold lower DPPH results (171–217 μmol TE/100 g) in comparison with the refined rapeseed oil (DPPH = 424–456 μmol TE/100 g). Although, somewhat lower AC results (126–149 μmol TE/100 g) were determined for WF.
For comparison, WFs used for the preparation of functional shortbread cookies with fruit pomace, and biscuits incorporated with prickly pear peel, revealed significantly higher DPPH values (377–860,000 μmol TE/100 g) [
6,
14].
3.2. Antioxidant Capacity of Biscuits with Rapeseed Press Cake
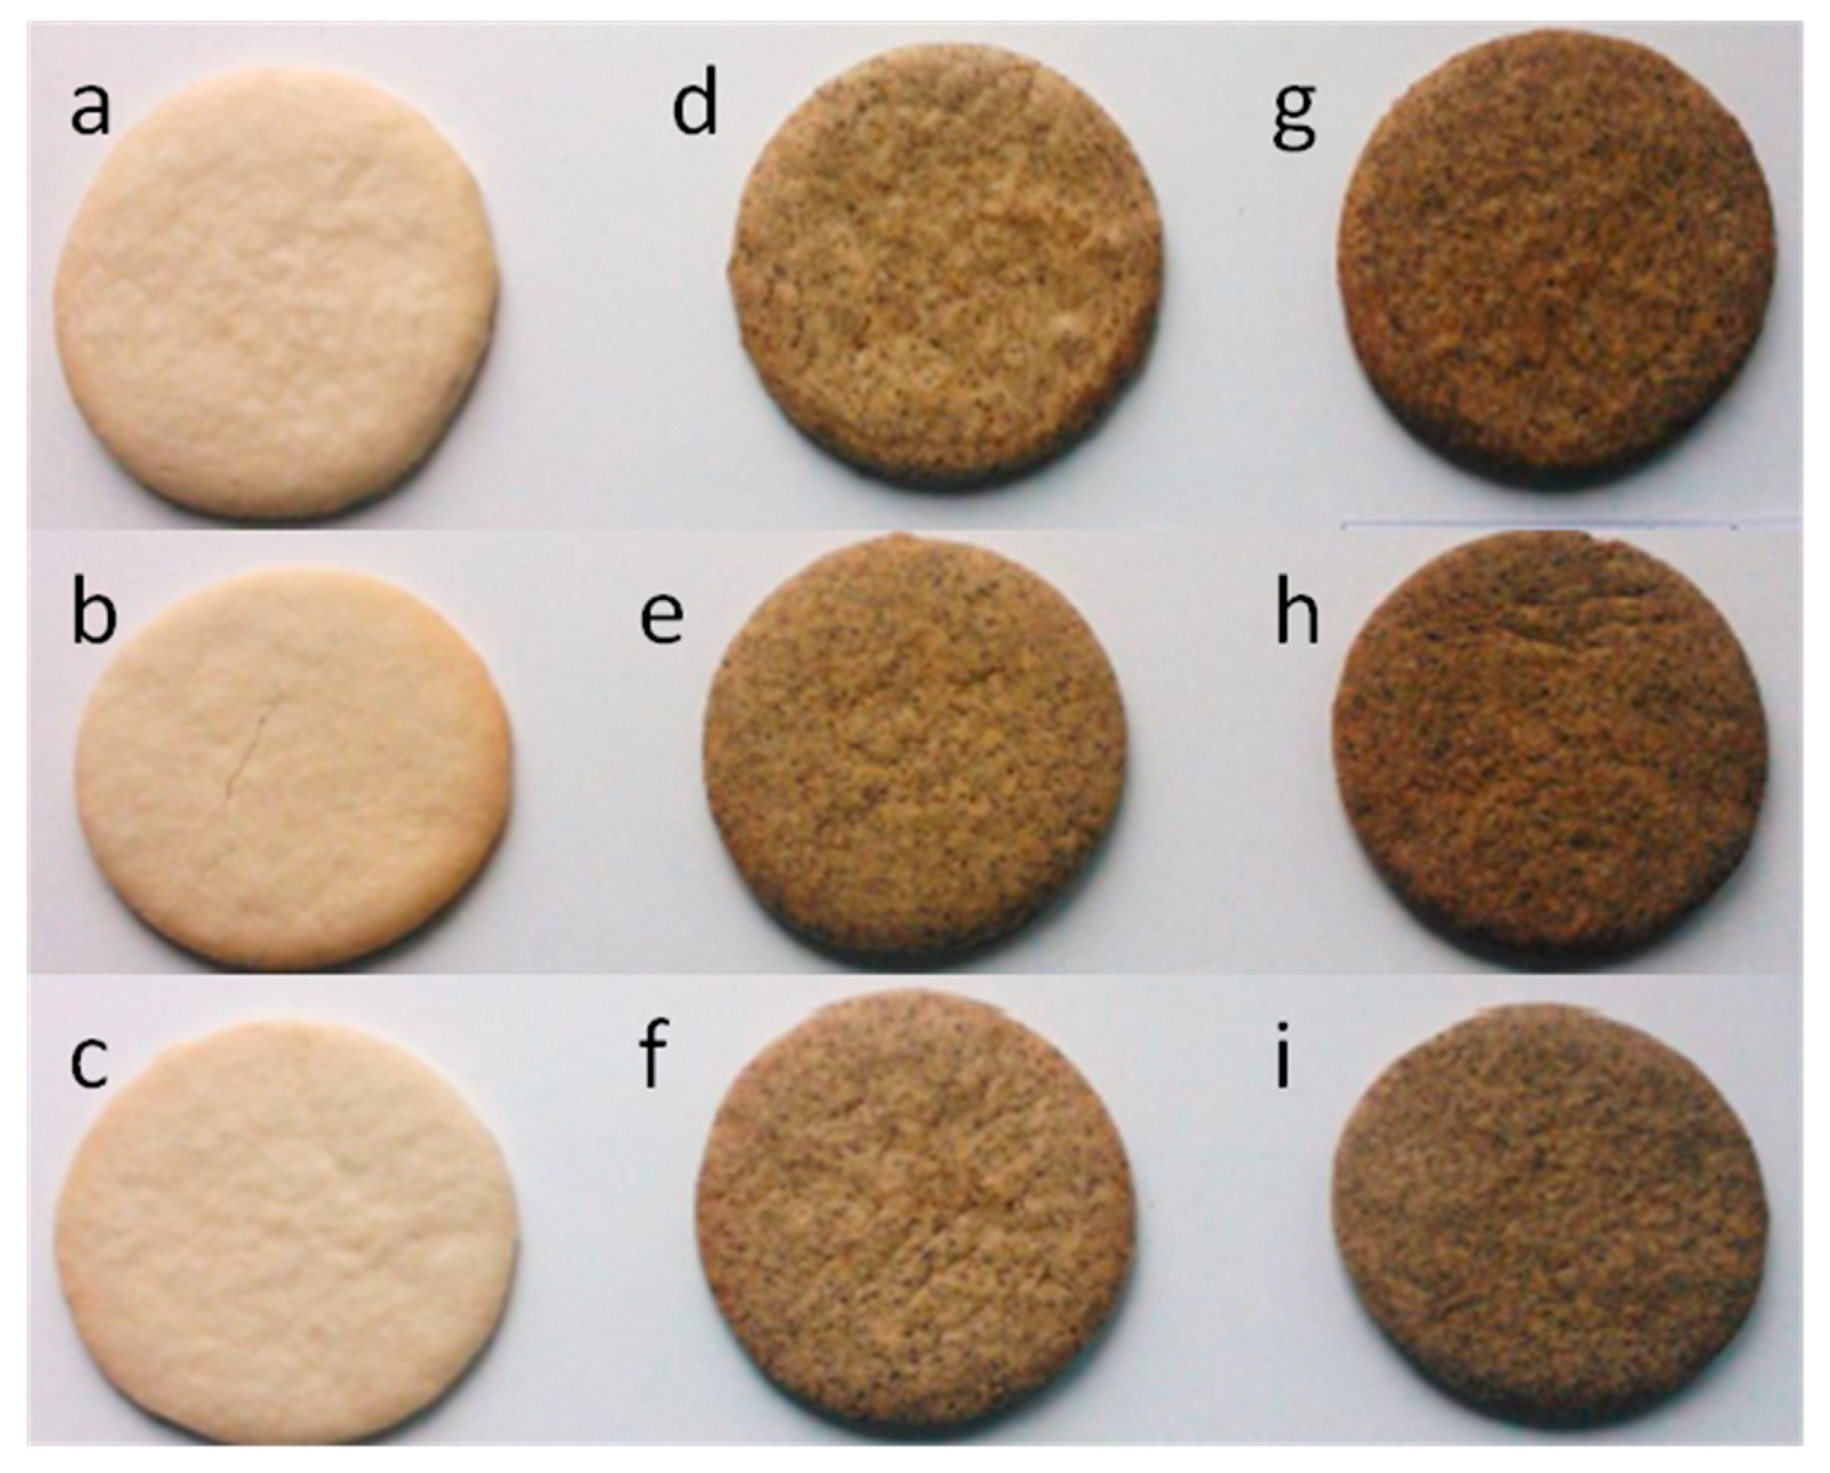
The different fats such as rapeseed oil, margarine, and coconut oil with the declared amounts of SAFA at 2.3, 7.8, and 24.9 g, respectively, and increasing RPC powder levels from 0 to 40 g, were used for the preparation of functional biscuits. It can be noted that as the concentration of RPC in the baked products increased, the biscuits became darker in color (
Figure 1).
The biscuits fortified with RPC were found to be darker than the control sample without RPC flour. This suggests that RPC flour is a rich source of chlorophyll. Moreover, the darkening of biscuits enriched with RPC can be due to the browning of RPC carbohydrates during baking.
For comparison, with increasing concentrations of by-products, such as olive stone powder (5–15%), white grape pomace (10–30%), goji berry by-product (10–40%), defatted chia flour (5–20%), okara powder (20–40%), prickly pear peel (10–30%), defatted sunflower seed flour (18–36%) in doughs, the color of the enriched biscuits and cookies changed gradually from light brown to brown and finally to dark brown [
1,
8,
10,
12,
13,
14,
15].
Furthermore, the DPPH values of the baked biscuits increased rapidly with the increasing content of the added RPC (
Table 2).
Therefore, the highest DPPH results (8375–10,088 μmol TE/100 g and 4761–7395 μmol TE/100 g) were revealed for methanolic extracts of biscuits with the highest RPC level (40 g) obtained after classical extraction and UAE, respectively. However, the DPPH (535–843 μmol TE/100 g and 598–890 μmol TE/100 g) were the lowest for the studied samples without RPC.
The increase in DPPH values from 20.12 to 30.44%, 3.39–7.55 mmol TE/g, 198–236 mmol TE/g, and 1.5–2.9 mg TE/g was also observed when the biscuit doughs were fortified with increasing amounts of olive stone powder (5–15%), white grape pomace (10–30%), prickly pear peel (10–30%), and defatted sunflower seed flour (18–36%), respectively [
1,
8,
14,
15].
Interestingly, biscuits prepared by replacing coconut oil (lower DPPH = 87–118 μmol TE/100 g) with margarine (higher DPPH = 171–217 μmol TE/100 g) and the same content of RPC had a lower level of antioxidants capable of scavenging the free DPPH radical (
Table 1 and
Table 2). Thus, replacement of fat with a richer in SAFA insignificantly increased the DPPH activity of the baked biscuits (
Table 2, Duncan test). This can be explained by the fact that SAFA are strongly resistant to deterioration reactions during thermal oxidation, while antioxidants present in the dough are not consumed for the termination of oxidative processes by trapping free radicals.
Unexpectedly, the DPPH results of fortified biscuits’ extracts decreased significantly after ultrasonic treatment (
Table 2, Duncan test). A decrease in DPPH values for extracts obtained by UAE indicates that natural antioxidants present in RPC were degraded by free radicals generated upon the ultrasound irradiation [
27]. On the other hand, the thickness of the boundary layer (the fortified biscuits–solvent interface) did not sufficiently decrease during mixing by means of ultrasound due to the ultrasonic power dissipation (180 W) used for too short treatment time (5 min × 3 times), and the transfer of antioxidants was limited.
3.3. Hedonic Scale Sensory Evaluation of Biscuits with Rapeseed Press Cake
It can be noted that there were significant differences in consumer acceptability between 11 biscuit samples containing 0, 20 and 40 g of RPC flour, respectively (
Table 3, Duncan test).
Therefore, the samples studied can be divided into three groups according to the mean sensory scores for overall acceptability. The baked biscuits with the highest amount of RPC flour (40 g) had the lowest sensory score values for overall acceptance. The most preferred samples by Polish consumers were biscuits prepared without RPC (
Table 3).
The consumers’ results revealed that the mean sensory scores for color, odor, texture, flavor, and overall acceptability of the non-supplemented biscuits prepared by using different types of fats ranged between 5.81 and 6.10, 5.73–6.10, 5.52–6.88, 5.85–6.89, and 6.07–6.79, respectively, and corresponded to the classifications “liked slightly” and “liked moderately” on the hedonic scale where the maximum score is 9. In the context of the proposed products’ purchase intent frequency, the biscuits without RPC received the highest scores (3.19–3.33) on a 5-point scale and qualification as “would buy”.
On the contrary, with increasing RPC content in the dough, the fortified biscuits’ color changed gradually from light (biscuits without RPC) to dark for biscuits with the highest amount of RPC flour (40 g). Therefore, these samples scored the lowest for color (4.45–4.62), odor (3.45–3.93), flavor (3.03–3.52), and overall acceptability (2.89–3.44). The biscuits with the highest RPC level were characterized by a typical intensity of bitter and grassy flavor due to the high concentration of phenolic compounds present in RPC.
Nevertheless, insignificant differences in the mean texture scores were found between control samples (without RPC) and biscuits after the replacement of WF with 20 g of RPC flour (
Table 3, Duncan test). However, biscuits incorporated with the highest RPC amount (40 g) scored the lowest for texture (4.93–5.33). For this reason, biscuits formulated with 40 g of RPC flour had the lowest purchase intent scores (1.78–1.90), being largely qualified with “would not buy”. The biscuits enriched with 20 g of RPC flour were predominantly qualified as “would probably buy”, but there were significant differences with the qualification “would buy” for the control samples without RPC (
Table 3, Duncan test).
The Duncan test indicated insignificant differences in scores for color, odor, flavor, overall acceptability, and purchase intent between biscuits obtained from different types of fats with the same content of RPC (
Table 3). Only biscuits without RPC and with 20 g of RPC flour prepared by using margarine had significantly lower texture scores than those baked from dough containing rapeseed and coconut oils.
The obtained results suggest that the replacement of WF with varying RPC levels in the recipe affects the overall acceptability of the functional biscuits due to atypical attributes such as bitter and grassy flavor and strange odor. A new component such as chocolate could probably mask the negative attributes and increase the overall acceptability of biscuits fortified with RPC.
3.4. Optimization Process
3.4.1. Fitting the Models
Experimental results of the responses, including the DPPH values and sensory characteristics of biscuits fortified with RPC, were fitted to the CCD, and the least-squares technique was used for calculation of the regression coefficients of the individual linear, quadratic, and interaction terms (
Table 4).
The second-order polynomial equations generated were used to predict the responses (
Table 2 and
Table 3). The ANOVA results for the predicted response quadratic models are listed in
Table 5. ANOVA test revealed that the quadratic polynomial models adequately represent responses of DPPH for extracts obtained by conventional extraction and UAE as well as sensory properties due to an insignificant lack-of-fit (F ranged between 2.89 and 18.83,
p > 0.05) for each estimated response (
Table 5).
Moreover, high F-values ranged between 154.89 and 1281.56, and the probability values less than 0.05 and 0.001 indicated that the empirical models were significant (
Table 5). For this reason, these proposed mathematical models are valid and convenient for predicting the antioxidant potential and sensory properties of functional biscuits prepared under any combination of RPC amount and fat type.
Additionally, determination coefficients (R
2) and adjusted R
2 were calculated to estimate the proposed models’ goodness of fit (
Table 5). The R
2 values (0.9664–0.9969) ensure a satisfactory fit of the proposed models to represent actual relationships between the responses (DPPH
CE, DPPH
UAE, color, odor, flavor, overall acceptability, and purchase intent) and the independent variables (RPC content and SAFA content). However, high values of adjusted R
2 = 0.9328–0.9938 indicated a close agreement between experimental and predicted results. On the contrary, the values of R
2 = 0.7751 and adjusted R
2 = 0.5503 for the response of biscuits’ texture suggest that a high proportion of variability cannot be explained by the model, because R
2 should be at least 0.80 for a good fit.
All linear and quadratic parameters of the empirical models were highly significant (F = 19.73–4554.65, p = 0.00022–0.047) for the DPPH results of methanolic extracts obtained by conventional extraction and overall acceptability of the biscuits enriched with RPC, while the interaction between amounts of RPC and SAFA in functional biscuits produced a significant negative effect only on their odor (F = 66.85, p = 0.015). However, the quadratic parameter of the SAFA content and linear term of RPC of the models significantly influenced (F values ranged between 19.10 and 3221.88, p < 0.05) on flavor and purchase intent of the prepared biscuits. In addition, only two parameters (RPC and RPC2) had significant effects on color of the novel biscuits (F = 19.64–846.11, p = 0.047–0.0012). Both linear (RPC, SAFA) and quadratic (SAFA2) parameters of the models were highly significant (F = 27.44–1332.02 and p = 0.035–0.00075) for DPPH of methanolic extracts after UAE, whereas linear term of SAFA and interaction between independent variables (RPC × SAFA) caused insignificant effects (F = 0.00026–10.98, p = 0.080–0.99) on the texture of studied samples.
It is noteworthy that the variable with the largest positive effect on the antioxidant potential of the baked biscuits determined by DPPH assay was the linear term of RPC content (F = 1332.02–4554.65, p < 0.001). Nevertheless, this independent contributed variable the most negatively to all sensory characteristics of the fortified biscuits (F = 76.73–5902.97, p < 0.05).
3.4.2. Analysis of the Response Surfaces
The effects of the two independent variables (amounts of RPC and SAFA) on antioxidant potential of biscuits extracted by classical extraction and analyzed by the DPPH assay as well as their five sensory characteristics (color, odor, flavor, overall acceptability, and purchase intent) were illustrated using surface response and contour plots of the quadratic polynomial models (
Figure 2).
As can be seen, the generated shapes of the response surfaces for AC results differ from those obtained for sensory scores. The DPPH of baked biscuits significantly increased with the increasing concentration of RPC in the dough (
Figure 2a). The parabolic shape of the response surface for DPPH was caused by the positive values of the quadratic terms of RPC amount and content of SAFA in the fat used.
On the contrary, scores for color, odor, flavor, and overall acceptability and purchase intent of the biscuits analyzed were the highest when RPC was not added to WF and rapeseed oil or coconut oil were used for dough preparation (
Figure 2b–f). The surface plots of odor, flavor, overall acceptability, and purchase intent indicate that the negative linear of RPC content and positive quadratic term of SAFA content were significant (
Figure 2c–f). The elliptical contour of the odor plot confirms that there was an interaction between independent variables (
Figure 2c), whereas the significant negative linear and quadratic effects of RPC amount resulted in a decrease of the score for biscuit color after the fortification with a higher RPC amount (
Figure 2b).
3.4.3. Verification of Predictive Models
Optimization of the prepared functional biscuits was performed to measure the optimum levels of independent variables (amounts of RPC and SAFA) to achieve the desired response goals. The antioxidant potential and sensory characteristics were specified as desired to be maximized. To evaluate the sufficiency of the proposed mathematical models, verification experiments were carried out at the predicted conditions derived from the RSM analysis. The predicted and experimental results are presented in
Table 6.
Insignificant differences (p > 0.05) between the predicted and experimental response values confirmed that the proposed models were accurate and adequate for the optimization of amounts of two ingredients to baking functional biscuits with acceptable levels of RPC and sensory characteristics.
3.4.4. Physical Properties of Biscuits for Optimum Levels of Ingredients
The doughs were prepared by using RPC flour and SAFA at optimum levels for antioxidant potential (RPC = 40 g, SAFA = 2.3 g), and overall acceptability (RPC = 0 g, SAFA = 24.9 g) and physical properties of the baked biscuits were determined (
Table 7).
The Duncan test indicated that RPC flour incorporation significantly decreased the diameter, thickness, and weight of the studied biscuits.
The decrease in diameter and thickness of cookies and biscuits with increasing amounts of added goji berry by-product (10–40%), okara powder (20–40%), prickly pear peel (10–30%), and sunflower seed flour (18–36%) was observed by other authors [
10,
13,
14,
15]. In contrast, the diameter value (52.36 mm) of control biscuit was lower than those (52.52–55.88 mm) measured for biscuits with 10–30% of white grape pomace, whereas the thickness of the studied samples decreased significantly (13.83–9.05 mm) after supplementation [
8].
However, insignificant differences in the mean spread ratio were found between samples without RPC containing coconut oil and biscuits prepared with 40 g of RPC and rapeseed oil.
The insignificant increase in spread ratio and the significant contraction of diameter after addition of RPC flour can be attributed to the reduction of total gluten content as well as the increase in protein amount [
10]. Probably, the weight of fortified biscuits was lower due to low oil absorption capacity of RPC flour [
28]. For comparison, the spread ratio of biscuits before (48.9) and after (48.0–48.2) the addition of prickly pear peel did not differ significantly [
14]. On the other hand, the changes in spread ratio of biscuits with white grape pomace (3.79–6.18) were significant at substitution levels between 10% and 30% [
8].
4. Conclusions
The incorporation of RPC flour and the replacement of margarine by rapeseed oil into the formulation of WF-based biscuits resulted in a nutritionally enhanced product with a higher amount of antioxidants. Moreover, the UAE of ingredients used for dough preparation produced higher recoveries of total antioxidants in comparison with the conventional extraction.
A higher percentage of RPC in the formula increased the antioxidant potential of the proposed biscuits. However, these biscuits had lower sensory scores for color, odor, texture, flavor, overall acceptability, and purchase intent.
The estimated parameters, RPC content, and SAFA content affected the DPPH results, and sensory characteristics of the baked biscuits. However, the amount of RPC flour had a greater positive effect on the antioxidant potential of biscuits than the fat type used for dough preparation. Nevertheless, the added level of RPC was a more negatively effective independent variable on the sensory properties of the biscuits studied.
The good agreement between the predicted values and experimental results verified the validity of the proposed models and the optimal ingredient amounts for the baking of biscuits incorporating by-products of rapeseed oil industry.


