Article

An Aerodynamic Design Method to Improve the High-Speed Performance of a Low-Aspect-Ratio Tailless Aircraft

1
School of Aeronautics, Northwestern Polytechnical University, Xi’an 710072, China
2
The First Aircraft Institute of AVIC, Xi’an 710089, China
*
Authors to whom correspondence should be addressed.
Appl. Sci. 2021, 11(4), 1555; https://doi.org/10.3390/app11041555
Submission received: 25 December 2020 / Revised: 2 February 2021 / Accepted: 5 February 2021 / Published: 9 February 2021
(This article belongs to the Section Aerospace Science and Engineering)

Abstract

:
This paper puts forward an aerodynamic design method to improve the high-speed aerodynamic performance of an aircraft with low-aspect-ratio tailless configuration. The method can ameliorate the longitudinal moment characteristics of the configuration by designing and collocating the key section airfoils with the constrains of fixed parameters of planform shape and capacity. Firstly, the effect of twisting the wing, fore-loading and aft-reflexing key section airfoils on the high-speed aerodynamic performance of the configuration is evaluated by high-fidelity numerical methods, and quantified by defining trimming efficiency factors. Then, a linear superposition formula is obtained by analyzing the effect rule of trimming efficiency factor, and based on the formula the design and collocation methods of key section airfoils are achieved. According to the methods, a trimmed configuration is obtained. The results of computational fluid dynamics (CFD) and wind tunnel tests show that the trimmed configuration has smaller zero-lift pitching moment and higher available lift-to-drag ratio than the initial configuration at cruise, besides the trimmed configuration achieves the design principle raised for tailless configuration, which can be described as the zero-pitching moment, cruising design lift coefficient, and maximum lift-to-drag ratio are coincident. In addition, at off-design conditions, the trimmed configuration shows favorable drag divergence characteristics, satisfactory aerodynamic characteristics at medium-altitude maneuvering condition, and good stall and pitching-moment performance at low speed state.

1. Introduction

The essential prerequisites for advanced fighter aircraft are excellent aerodynamic performance, strong maneuverability, and favorable stealth performance. Currently, low-aspect-ratio tailless configurations are the focused research on future fighters, such as the Boeing F/A-XX program. This configuration employs a detached vortex pattern to generate the high lift required for take-off, landing, and high angle of attack maneuvering at low speed, and uses the attached flow pattern for efficient high-speed cruise [1]. The low-aspect-ratio wing retards the deterioration of longitudinal stability, increases the critical Mach number, and improves the drag divergence characteristics. Furthermore, the tailless configuration reduces the structural weight and improves the aerodynamic and stealth performance of the aircraft, and is of great significance in the design of fighter aircraft. So, low-aspect-ratio tailless configurations are potential for future fighter.
However, owing to the absence of a traditional tail, longitudinal control of a low-aspect-ratio tailless configuration is a major issue. To deal with the issue, some technologies are applied in advanced fighters, such as all moving canard wings and thrust vectors, but there is little literature about the aerodynamic design of a low-aspect-ratio tailless configuration with consideration of longitudinal trimming. Besides, civil aircraft with tailless configurations also suffer the same issue [2]. During cruise, all control surfaces should be faired to avoid trim drag [3]. Therefore, for practical purposes, the aircraft should be trimmed at cruise. The early flying wing configuration utilized a swept wing and downloaded wingtip to attach static stability, wherein the wingtip acted as a horizontal tail [4]. However, this approach made the outer wing highly loaded, leading to local lift loss at the wing tip as it was prone to stall. In addition, the induced drag increased owing to the worsening spanwise lift distribution [5]. In recent years, there has been significant development in aerodynamic design and multidisciplinary optimization, and several new approaches have been proposed. Boeing developed the WingMOD to achieve the trim requirements of a blended-wing-body (BWB) configuration at cruise by designing a new transonic airfoil for the centerbody and adjusting the twist distribution [6], the centerbody leading-edge carving was incorporated into the airframe design, making the configuration trimmed and statically stable without the need to download another part of the aircraft. In addition, the outer wing was optimized to improve aerodynamic efficiency without the constraint of the pitching moment, which enabled effective trimming with proper airframe design [7]. Subsequently, the design idea that the cruise point, maximum lift-to-drag ratio point, and pitch trim point should lie along the same flight attitude, was firstly put forward for BWB aerodynamic design [8]. Based on this idea, numerous practical aircraft were designed by optimizing the planform and airfoil design [2,8,9]. Although there has been significant research on the aerodynamic design of a tailless configuration with trim constraints, most studies focus on the tailless configuration with high-aspect ratio. Consequently, research on the aerodynamic design of a low-aspect-ratio tailless configuration with trim constraints is lacking.
For a low-aspect-ratio tailless configuration, the constraints should include not only the requirement for aerodynamics and structure, such as lift-to-drag ratio, pitching trim, and loading, but also the requirement for Radar stealth, which is mainly decided by the planform shape of the configuration [10]. This study focuses on the aerodynamic design of a low-aspect-ratio tailless configuration based on the principle [8] for tailless configuration that the zero-pitching moment, cruising design lift coefficient, and maximum lift-to-drag ratio are coincident.
The study of this paper is organized as follows: Section 2 verifies the numerical method. Section 3 describes the initial configuration and analyzes the aerodynamic performance of initial configuration. Section 4 analyzes and quantifies the aerodynamic effect of different geometric parameters of wing and typical section airfoils on the configuration, proceeds the design method to improve the aerodynamic performance of the low-aspect-ratio tailless configuration, achieves and assesses the trimmed configuration. Finally, the conclusion is obtained in the last section.

2. Numerical Method and Validation

Nowadays, the stake-wing and delta wing are typical low-aspect-ratio configurations, adopted by modern fighters. At low angles of attack and speed, the flow separates from the leading edge forming a stable vortex. As the angle of attack increases, the strength of the vortex is enhanced [11,12,13,14]. At transonic speeds, shock wave boundary layer interference, induced separation, and other complex flow phenomenon exist [14,15,16,17,18].

2.1. Numerical Method and Boundary Conditions

The numerical simulations in the present study are implemented on ANSYS-CFX platform. The numerical method is based on the finite volume approach [19] to solve high-fidelity Reynolds Averaged Navier-Stokes (RANS) equations. The equation is as follows:
U t + F x i = G x i ,
where U, F, and G are conservative variable, inviscid flux, and viscous flux, respectively. The viscous term is discretized by a second-order central difference scheme and a second order backward Euler scheme is adopted for time discretization [20]. The Shear Stress Transport (SST) [21] turbulence model is employed for its satisfactory simulative ability of typical flow phenomena including the low-speed turbulent boundary layer [22], transonic shock wave, and shock-boundary layer interaction and separation, which could occur in the low-aspect-ratio configuration. Free-flow conditions and no-slip boundary conditions are separately assigned to far-field surfaces and all solid surfaces [23].

2.2. Validation

To verify the simulative ability and the numerical computing capacity of the subsonic and transonic methods, the Low Speed Straked Delta Wing (LSSDW) model provided by National Aerospace Laboratory NLR [24] and the delta wing model provided by the Second International Vortex Flow Experiment (VFE-2) [25] are used herein.

2.2.1. LSSDW

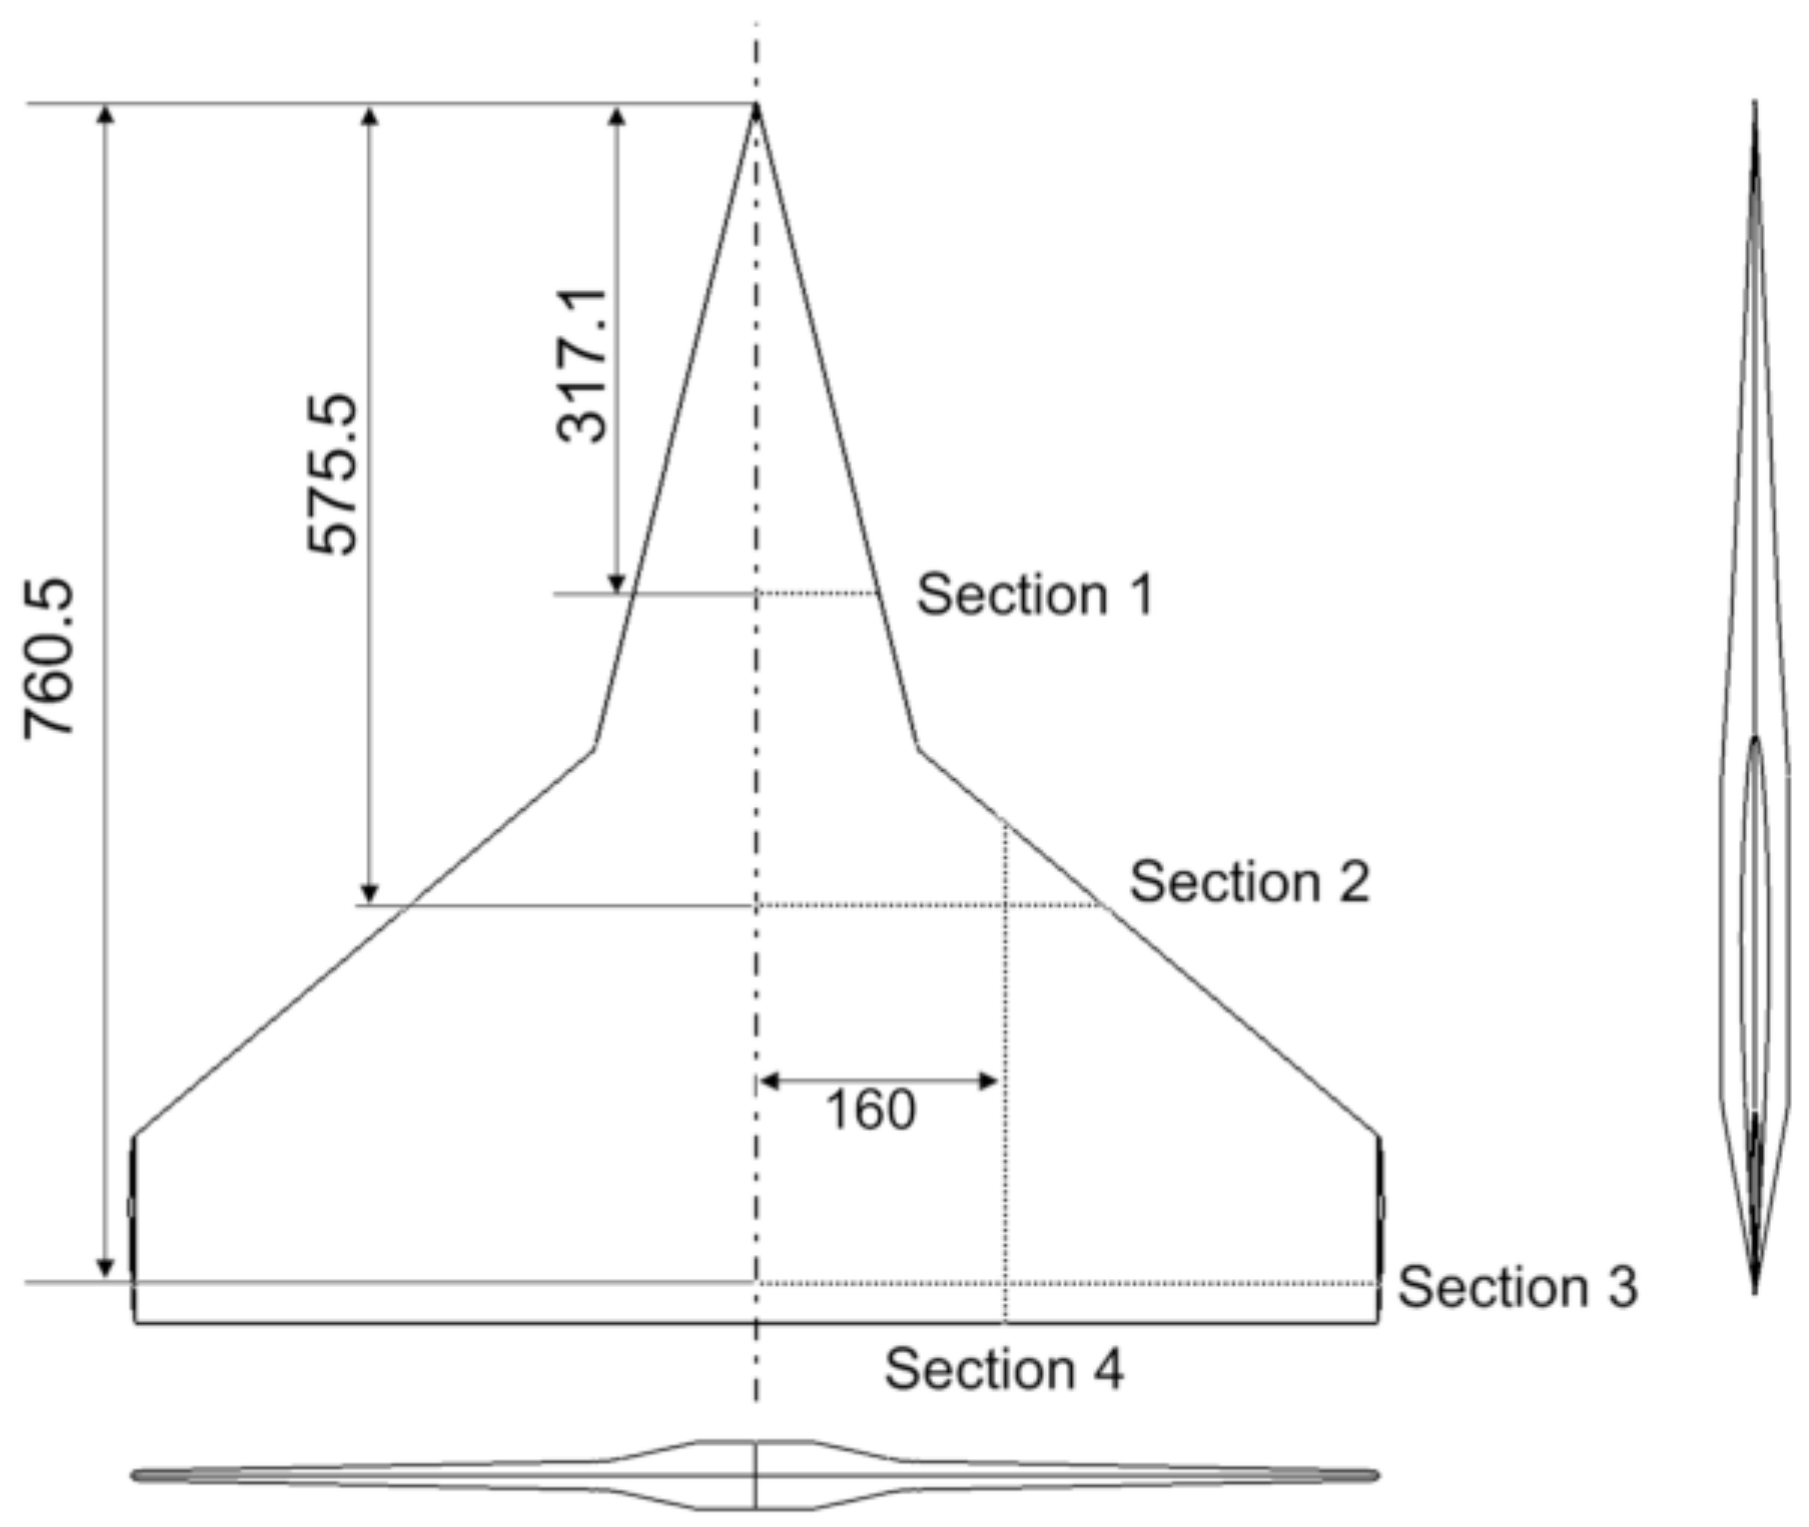
The LSSDW model provided by NLR, as shown in Figure 1, was used to verify the low-speed method. Its basic configuration is a trapezoidal main wing with a simple strake. The computing states from reference [24] are listed in Table 1, where α represents the angle of attack.
A multi-block structured H-H type grid consisting of 181 × 125 × 81 grid nodes is generated, with an O-type mesh around the model, as shown in Figure 2. The grid grows by 1.2 with a y+ of 1. The far field is 20 times the length of the mean aerodynamic chord.
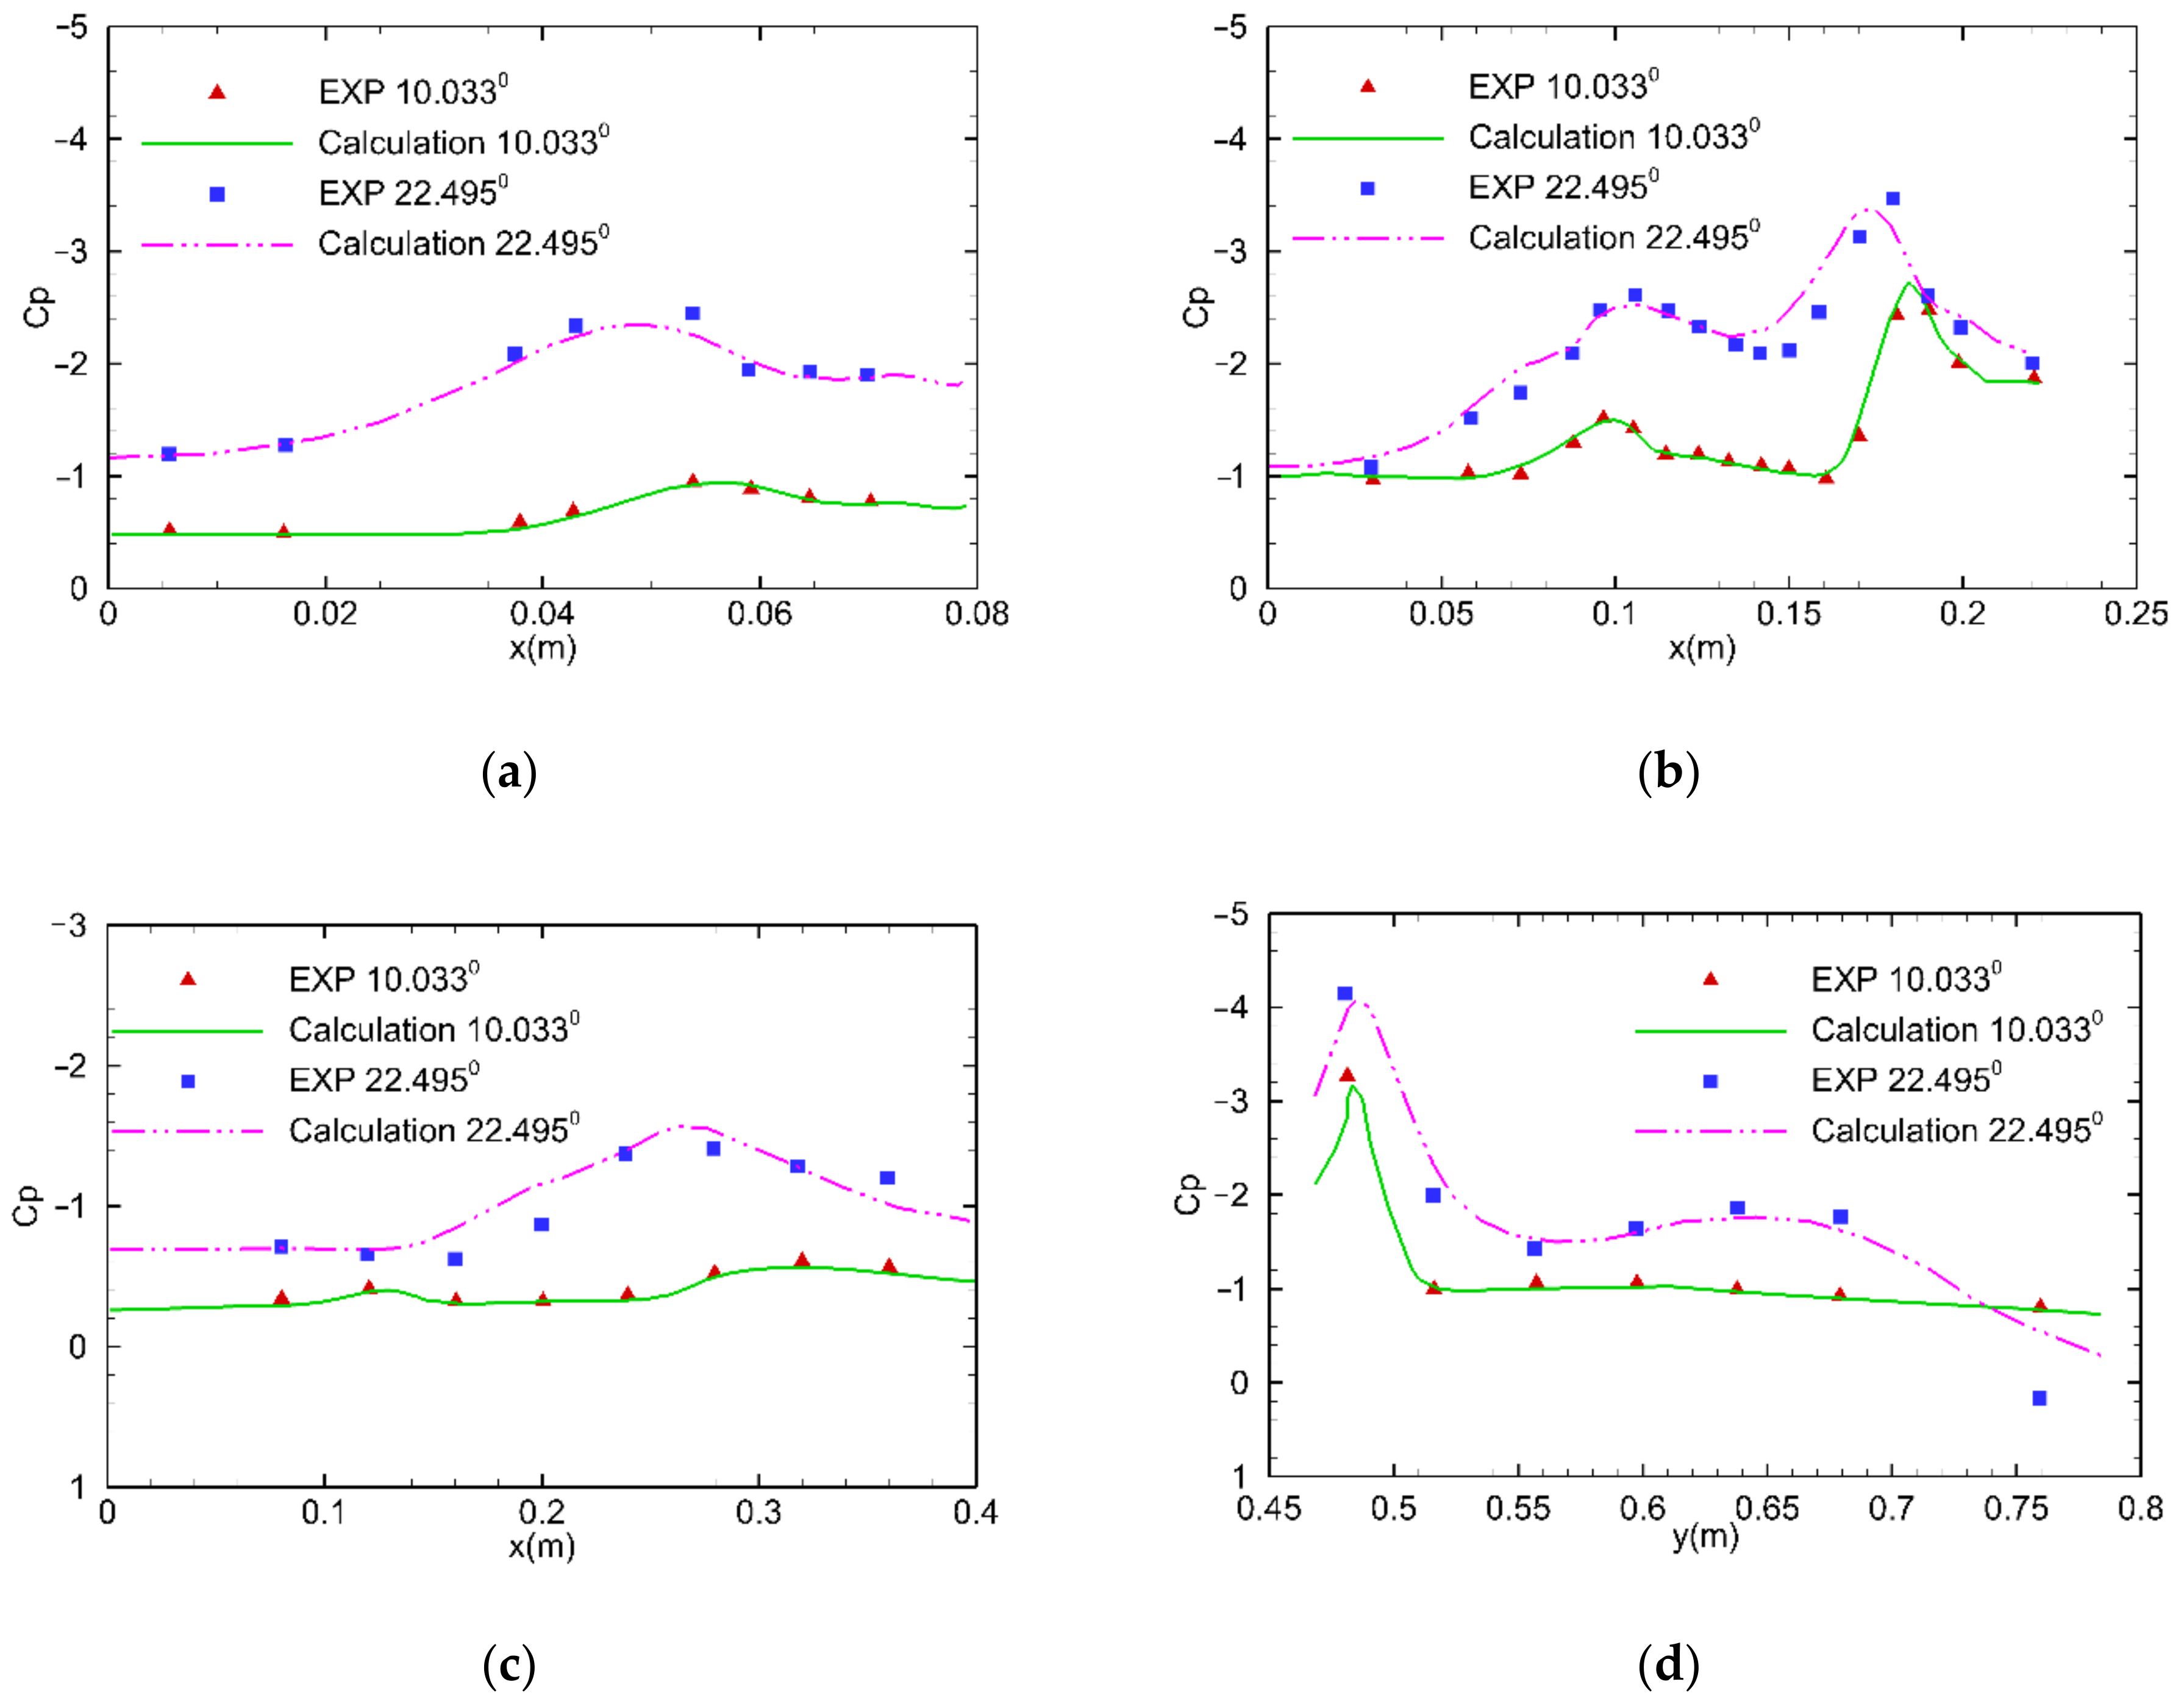
The CFD calculation results (Calculation) are obtained utilizing the above grid, while the experimental (EXP) results are gained from the reference [24]. The axial force (CN), normal force (CT), and pitching moment (Cm) of the experimental [24] and CFD calculations, are shown in Table 2. A comparison of the pressure coefficients (Cp) between the experimental and CFD calculation, at typical sections on the upper surface, are shown in Figure 3. At the angle of attack α = 10.033°, the calculated aerodynamic forces, moment, and pressure distribution are in good agreement with the experimental values. In contrast, at α = 22.495°, there are differences between the calculated and experimental. Considering the Cp distributions at Sections 3 and 4, it can be inferred that the strake vortices breakdown at the trailing edge of the main wing, resulting in an extremely unsteady phenomenon that is difficult to simulate.

2.2.2. Delta Wing

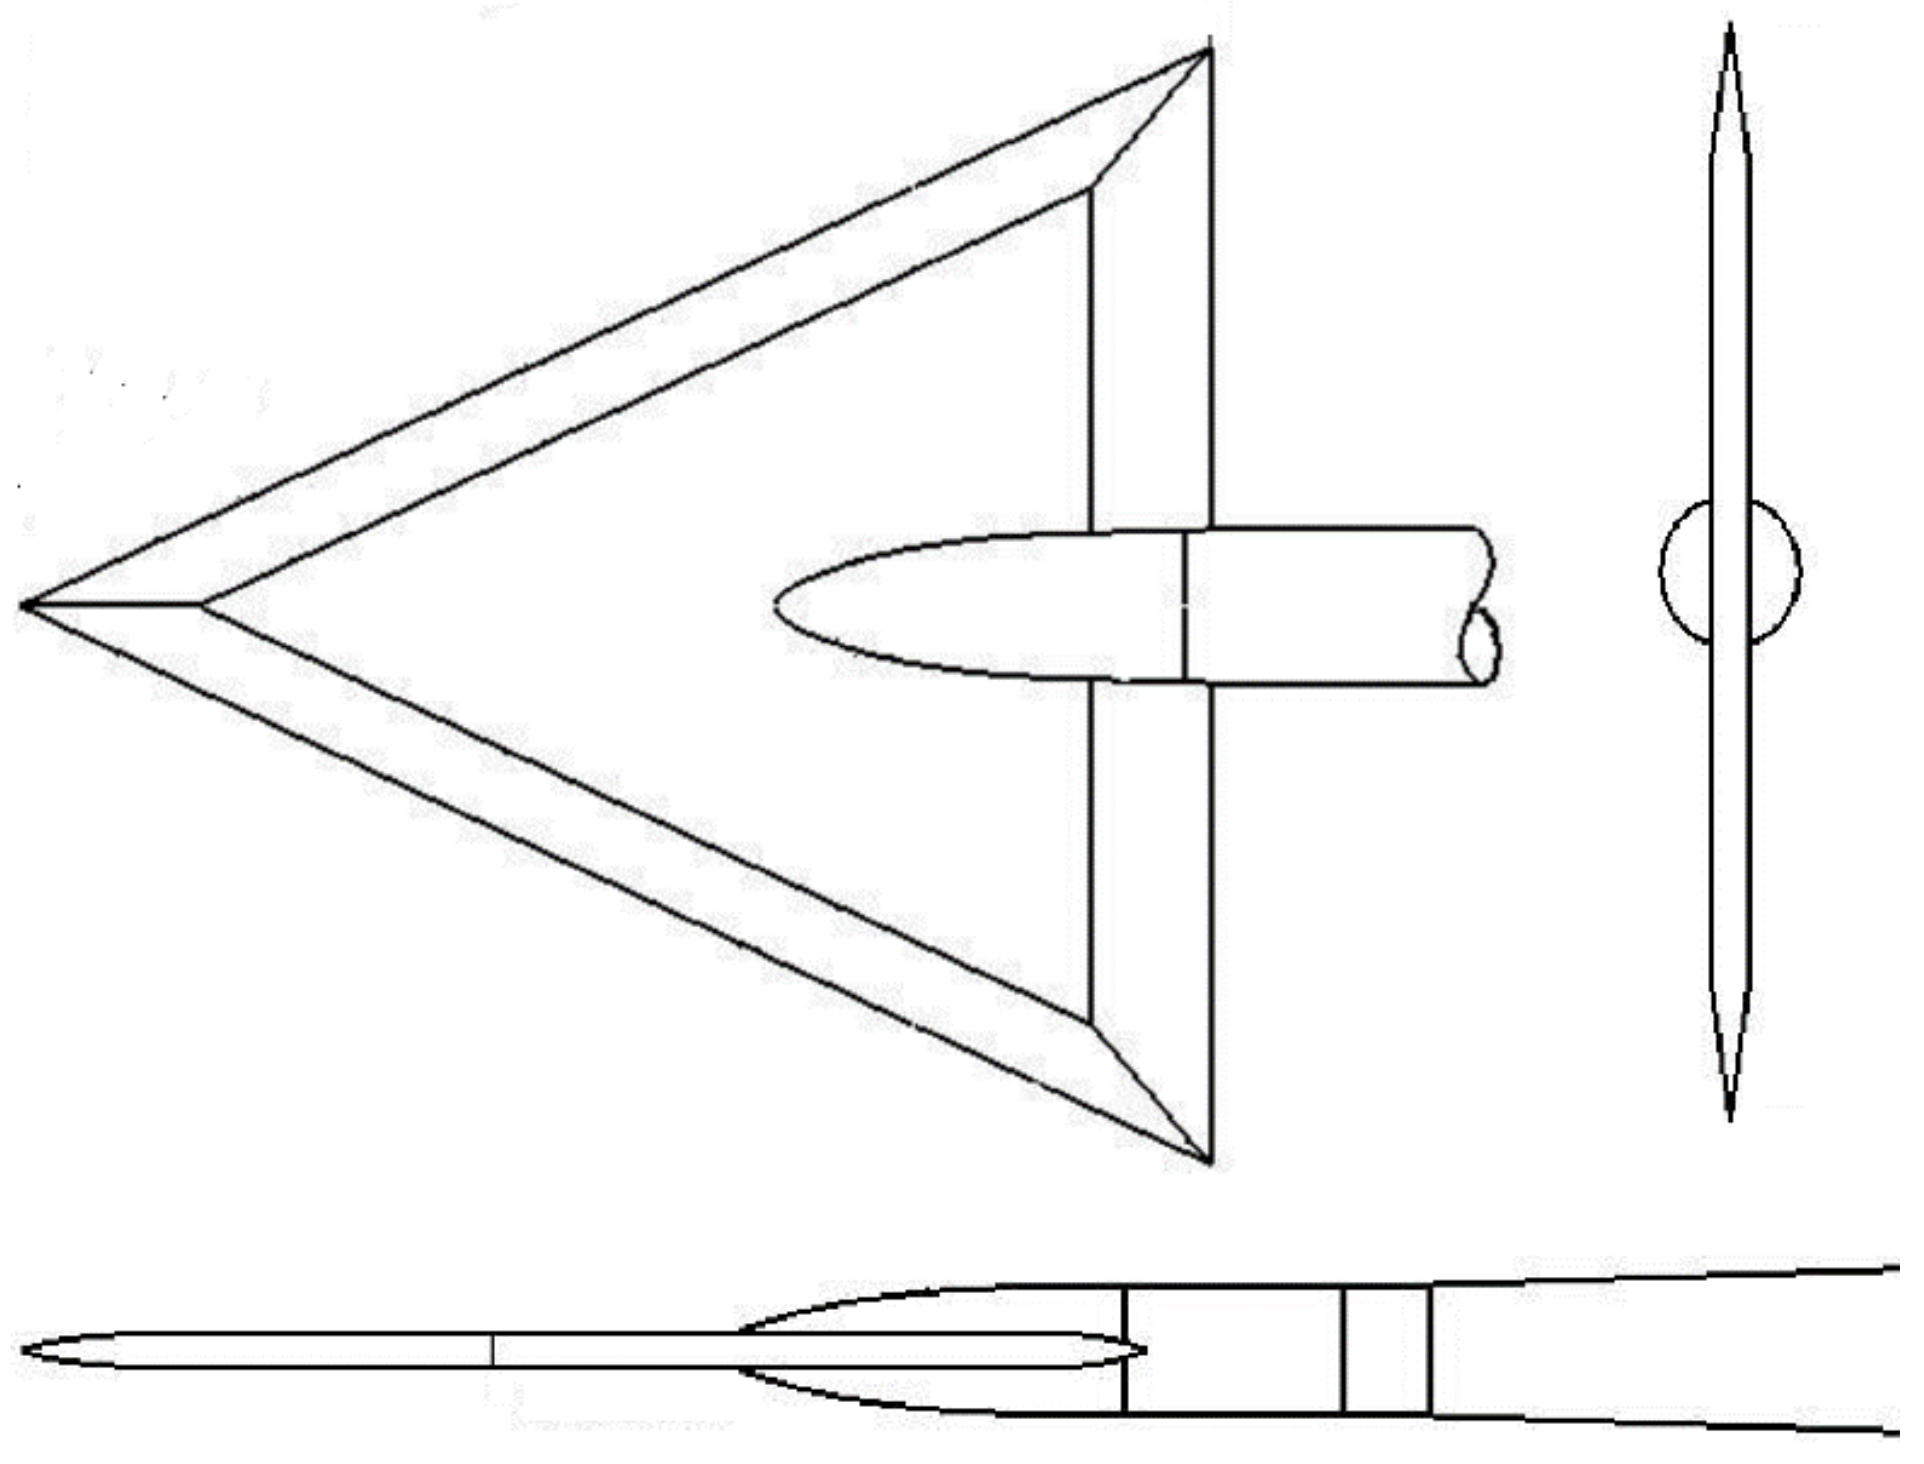
Extensive and systematic studies on the transonic vortex and fracture characteristics of the delta wing models provided by VFE-2 have been conducted by National Transonic Facility (NTF) [14,25], European Aeronautic Defense and Space (EADS) Company, NLR, and The University of Glasgow (Glasgow) [26]. As depicted in Figure 4, the model used to verify the transonic calculation method has a sharp leading edge with a sweep angle of 65°. The computation states from reference [26] are listed in Table 3.
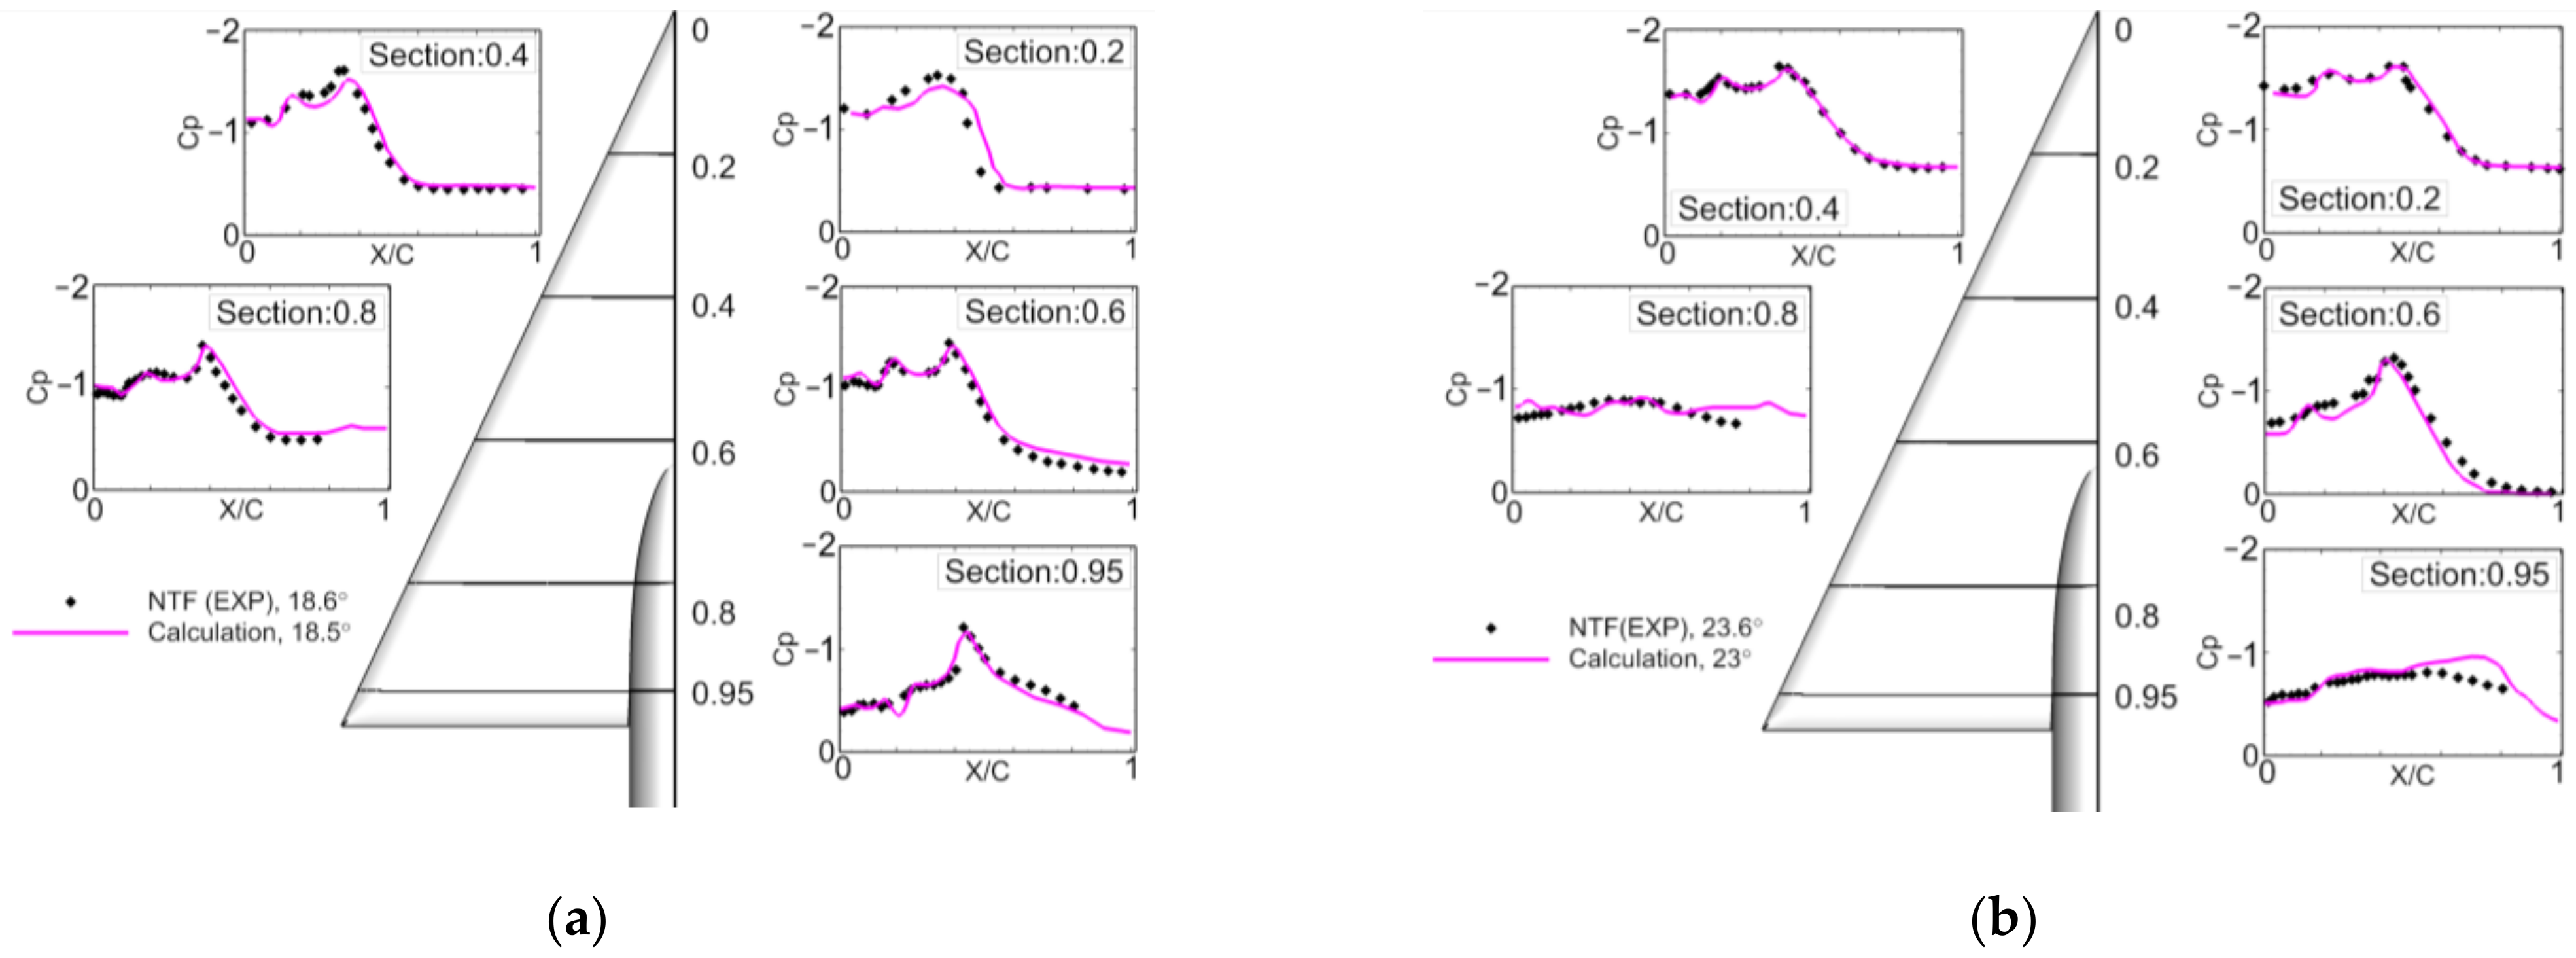
A multi-block structured H-H type grid consisting of 161 × 129 × 81 grid nodes is generated, as shown in Figure 5. Figure 6 shows a comparison of the upper surface pressure distribution between the NTF wind tunnel experiment [25] and the numerical calculation performed herein at typical locations. At α = 18.5°, the calculated suction peak value and location of the main vortex are in good agreement with the wind tunnel results. In addition, the predicted location of the second vortex is reasonably accurate, but its predicted suction peak value is slightly higher. At α = 23° and x/Cr = 0.2 and 0.4, where x is the x coordinate of the section location and the Cr is the chord length of the root of the model, the Cp distributions of the calculation are in good agreement with the wind tunnel results. However, at other sections, there are considerable differences between the wind tunnel results and the numerical calculation owing to the breakdown of the main vortex, which cannot be accurately simulated by the numerical method. The upper surface pressure contours of the calculation are shown in Figure 7. The calculated pressure contour obtained herein are almost the same to those of the other numerical calculations [26].

3. Initial Configuration Analysis

3.1. Brief Introduction of the Initial Configuration

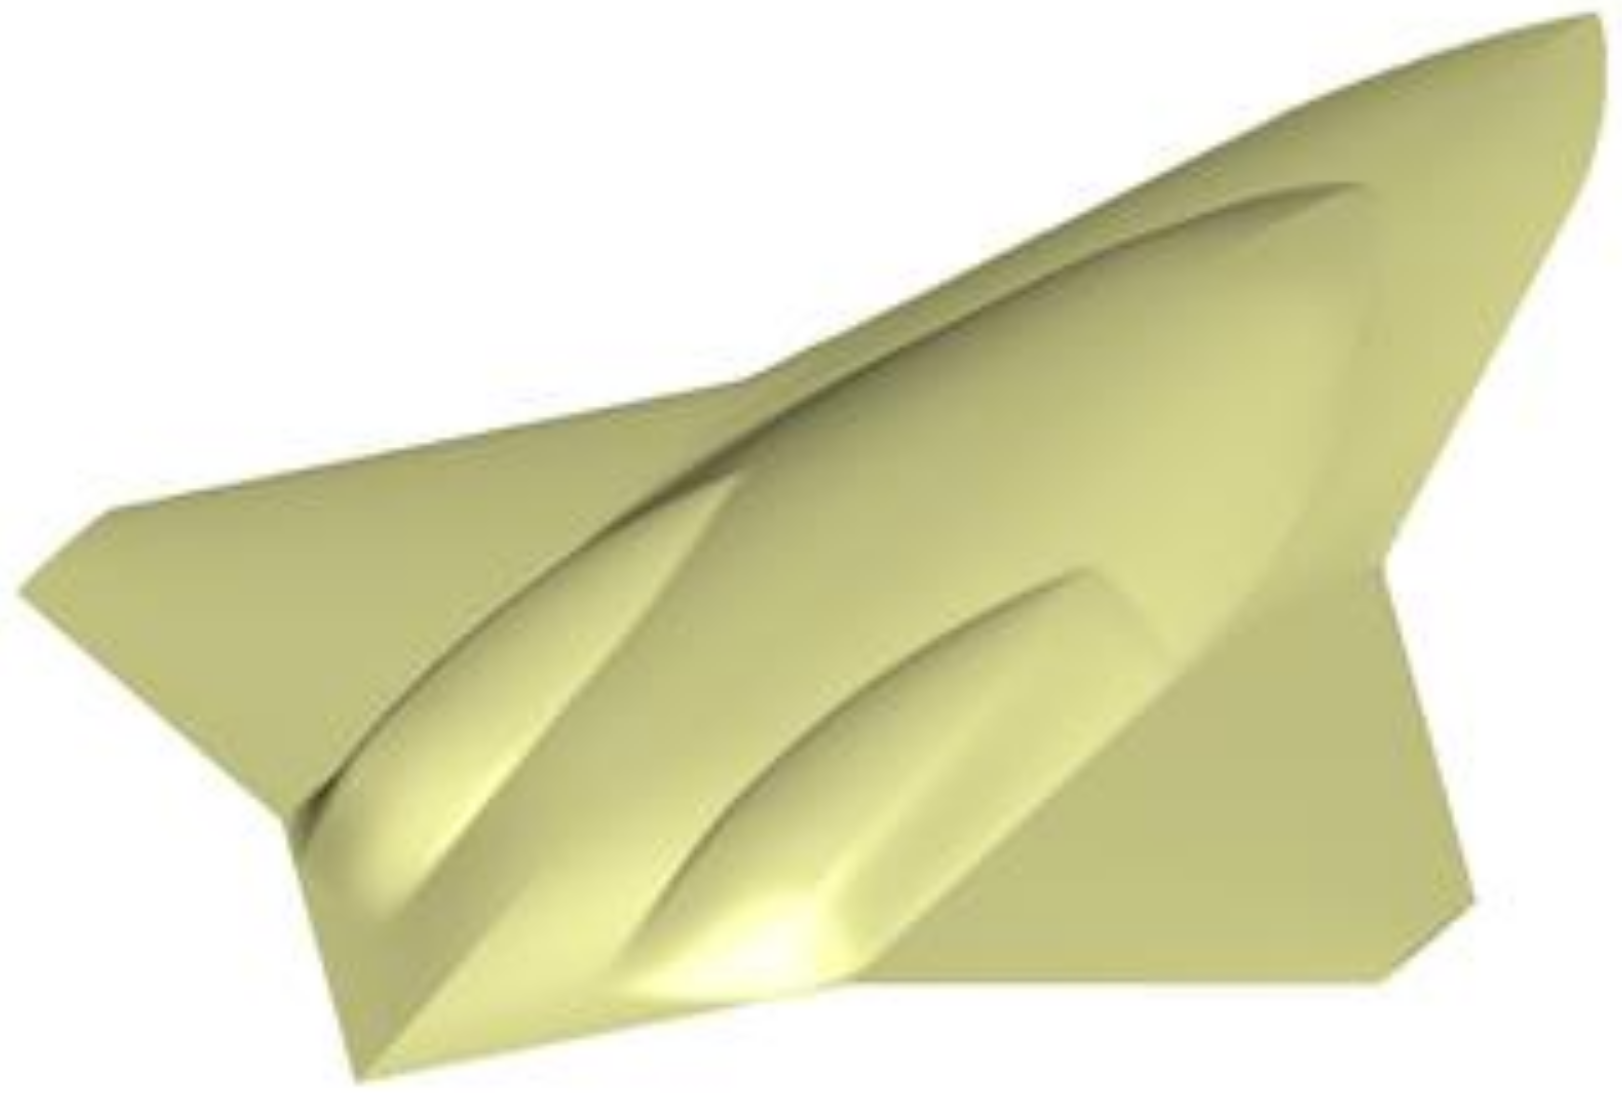
This study of this paper is an initial part of a study on combat fighters. Some graphs presented the paper are non-dimensional for confidentiality reasons. Firstly, the mission requirements are obtained according to [27,28]. Based on the mission requirements, the gross mass has been approximated at 15,000 kg by the method of Raymer [4]. According to the mission requirements, it is obtained that the design lift coefficient (CL_dedign) at cruise (H = 11 km, Ma = 0.85) should be equal to 0.141, and the maximum lift-to-drag ratio should be about 11. Referred to aircraft with similar missions, an initial layout consisting of a tapered wing and a lift-fuselage with a sharp leading-edge strake are assumed for its good aerodynamic performance, as shown in Figure 8. A modified top-mounted inlet and two engine bumps are arranged on the upper surface, while the lower surface is relatively flat. NACA 6 series airfoils are supposed as the initial airfoils. The main parameters of the aircraft are as follows:
  • Aspect ratio = 1.7
  • Wingspan = 12 m
  • Total Length = 18.9 m
Figure 8. The model of initial configuration.
Applsci 11 01555 g008

3.2. Grid Convergence Study

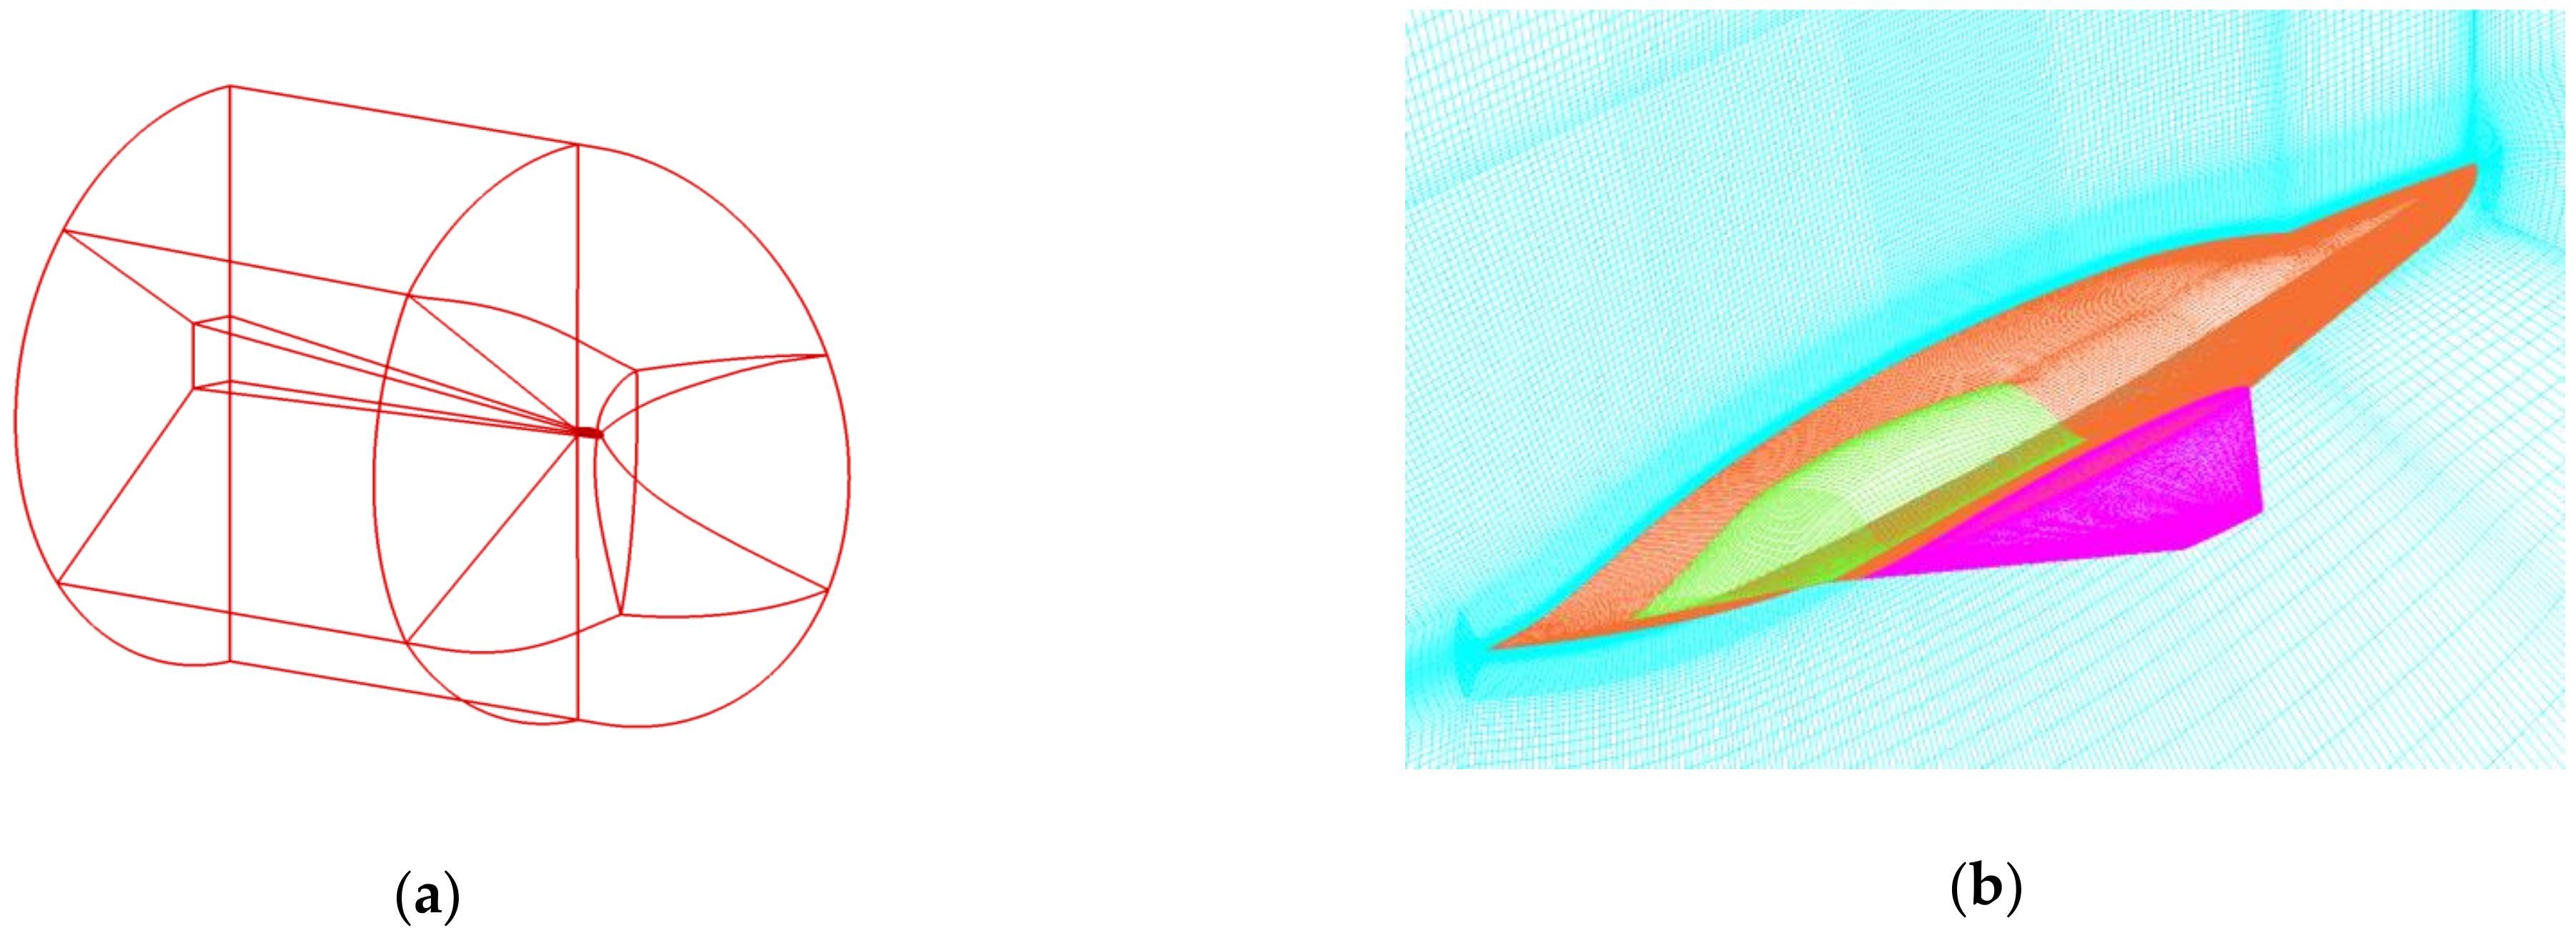
A grid convergence study [29] is performed using the initial configuration at Ma = 0.85 and α = 0°. Five different multi-block structured C-H type grids with 1,064,960 cells, 2,075,008 cells, 4,013,056 cells, 8,160,896 cells and 15,883,677 cells, respectively, are employed with the same computing domain and grid topology. Table 4 shows the results of the lift coefficient (CL), drag coefficient (CD), pitching moment coefficient (Cm) and simulation time (the accumulated time when the monitoring forces remain constant). The coefficients of the Grid 3, Grid 4, and Grid 5 are almost same. Considering the simulate accuracy and efficient, Grid 3 is chosen in this study. Grid 3 with 4,013,056 cells has a multi-block structured C-H type topology with an O-type mesh around the model (Figure 9). The grid around the model grows by 1.2 with a y+ of 1, and the far field is 20 times as long as the mean aerodynamic chord. For the geometric complexity of the upper surface, the grid is refined in typical regions, such as the leading edges of the fuselage and wing, the inlet and the engine bumps.

3.3. Aerodynamic Performance Analysis of Initial Configuration

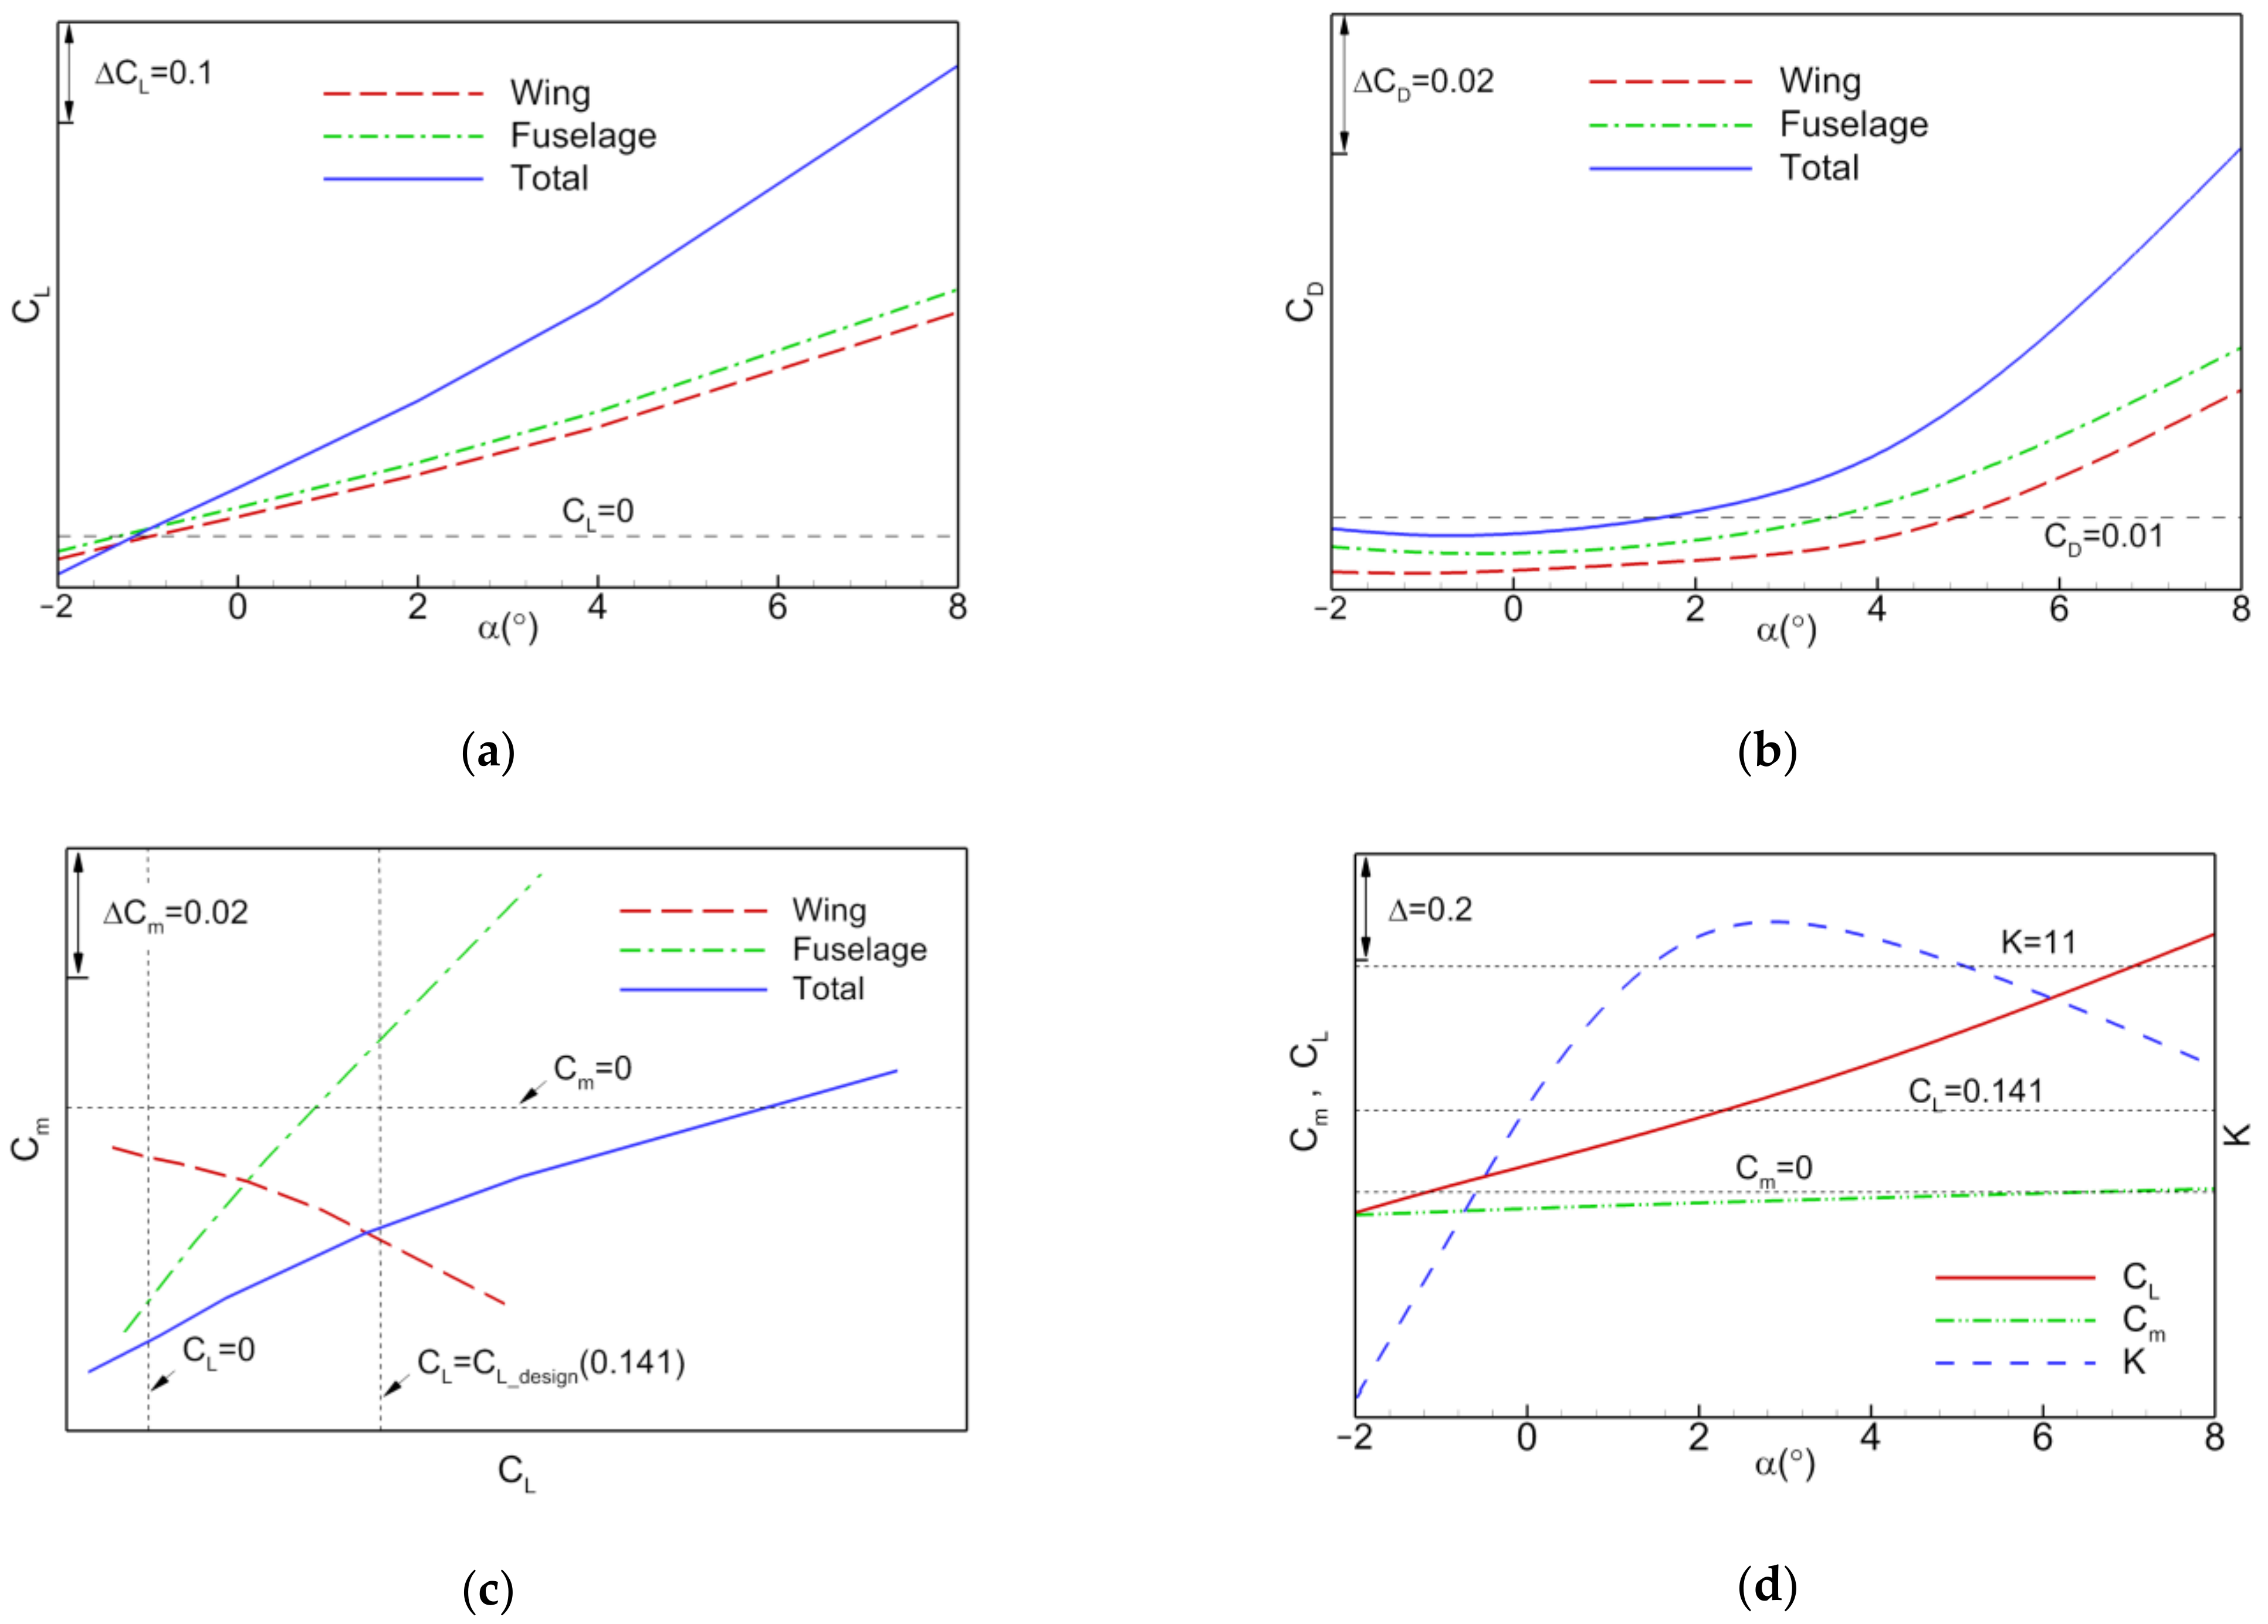
As shown in Figure 10a, the model is divided into the fuselage and wings. Figure 11 illustrates the aerodynamic forces on the fuselage, wing, and composite configuration. As shown, the wing provides more than 50% of the total lift, while the fuselage provides the rest. The fuselage generates more drag than the wing. Moreover, the fuselage and composite configuration are statically unstable, while the wing is statically stable. Figure 11d indicates that the angles corresponding to the cruise lift coefficient and the maximum lift-to-drag ratio (K) are almost equal, while the angle corresponding to the zero-lift pitching moment is considerably larger. Consequently, the configuration has a nose-down moment at cruise, Table 5 lists the zero-lift pitching moments (Cm0) and the cruising pitching moments (Cm,c) of each component. The fuselage offers the main zero-lift moment of the configuration, while the wing offers a major component of the pitching moment during cruise. Notably, the values of Cm0 and Cm,c are negative, which implies that these moments result in a nose-down condition. Thus, the longitudinal pitching characteristics of the initial configuration in typical states are very poor. Therefore, the aerodynamic design must be conducted with the constraint of longitudinal trim.

4. Aerodynamic Design Method Investigation

4.1. Design Objective

To deal with the longitudinal trim problems, the aerodynamic design target is established as improving the pitching characteristic without substantially altering the maximum lift-to-drag ratio. As the geometric parameters of the configuration planform are constant, the surface pressure distribution of the configuration determines the longitudinal moment characteristics. The trimmed design can be achieved by twisting the wing and designing the key section airfoils.

4.2. Influence of Wing Twist on the Aerodynamic Performance of the Configuration

Generally, twisting the wing clockwise is an effective way of improving the stall characteristics of the aircraft. Twisting also changes the longitudinal moment characteristics of the aircraft. However, the twist angle of the wing should not be too large. Although it reduces the aerodynamic characteristics of the aircraft, it increases the difficulties of the structure and manufacturing. Therefore, all aspects of the design requirements must be taken into consideration to determine the twist angle of the wing.
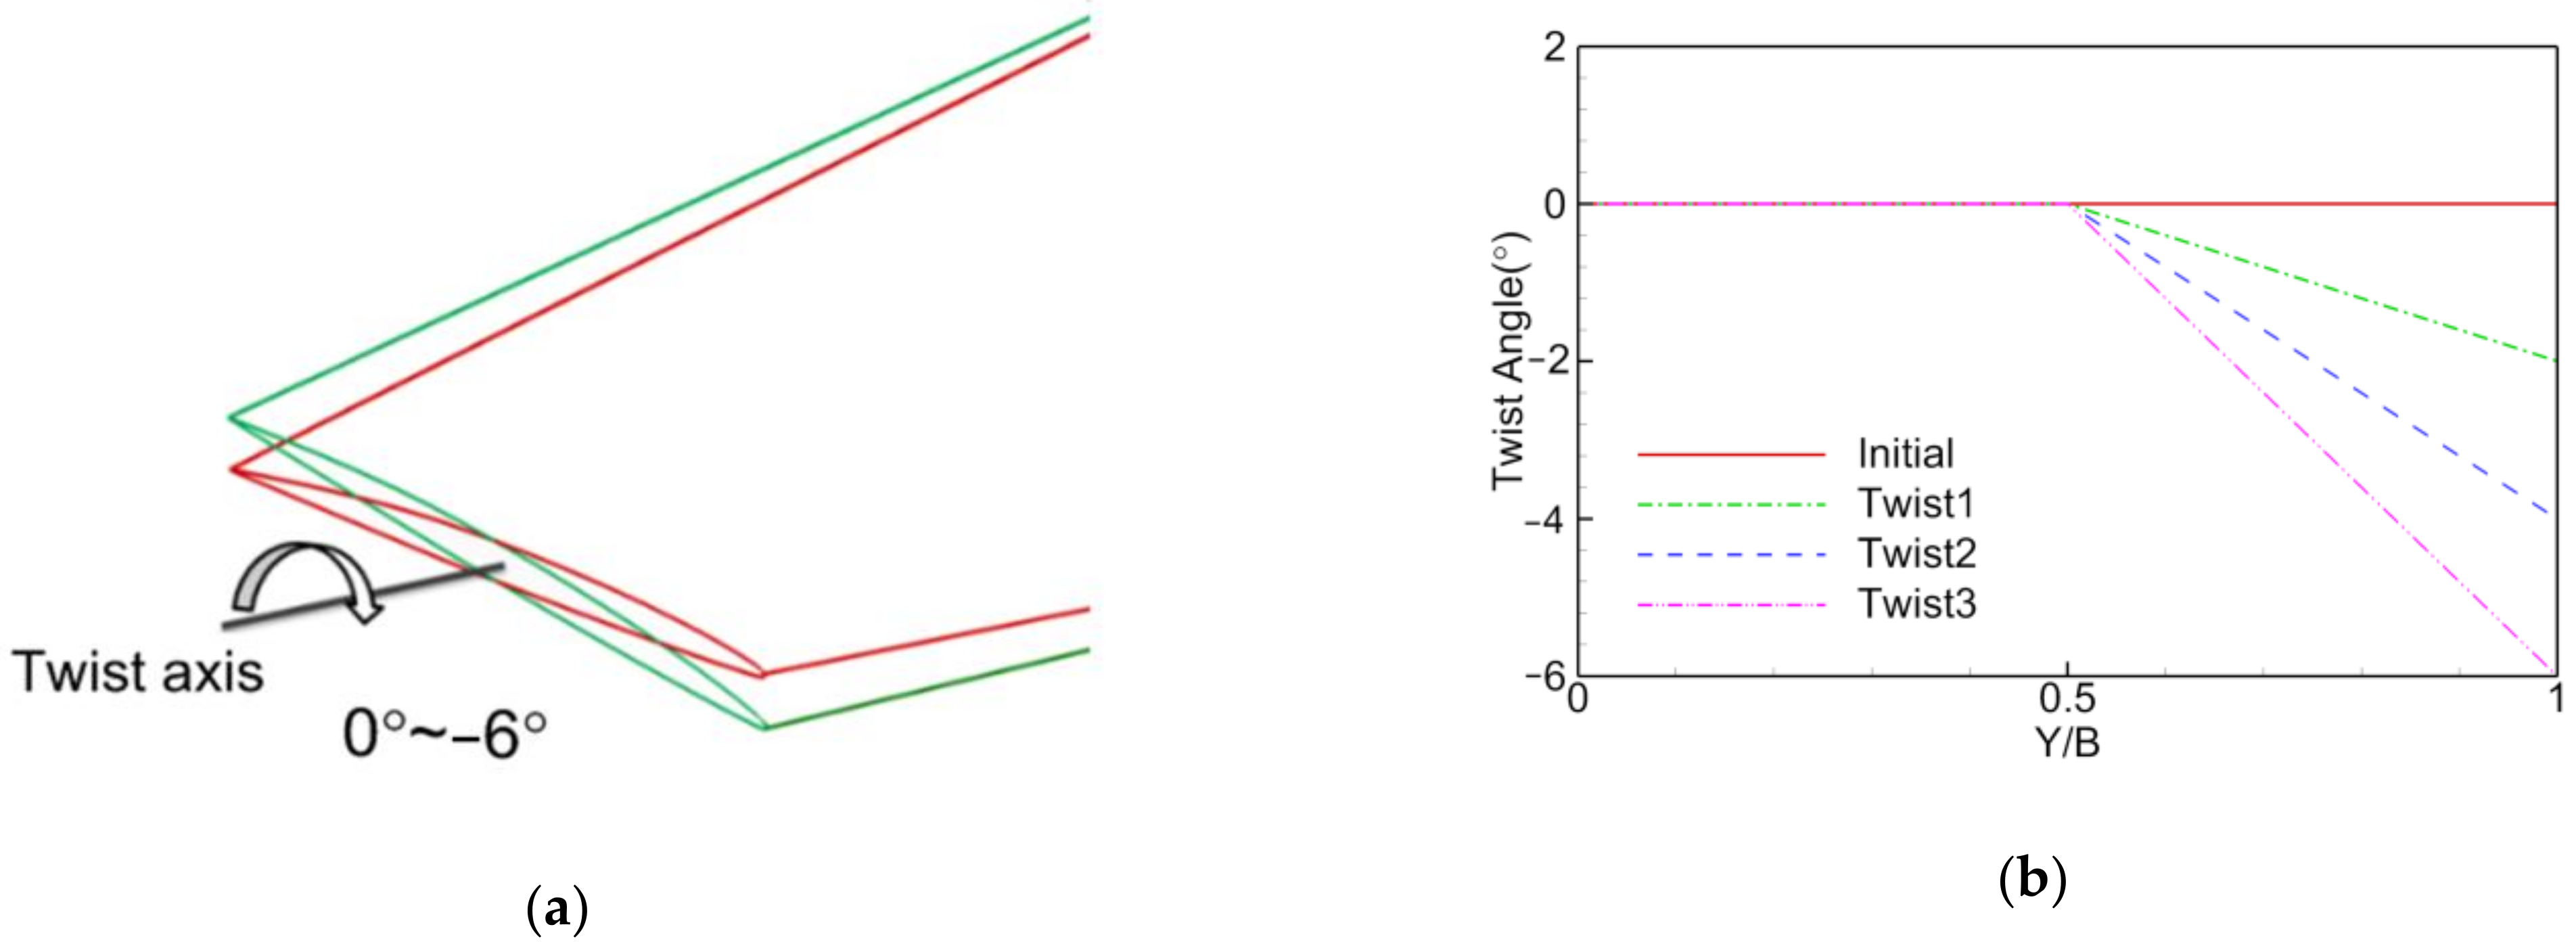
In the initial configuration, the twist angle of the wing is 0°. As shown in Figure 12, the midpoint of the chord of the wing tip is considered as the twist axis, and the wings of three configurations are twisted by −2°, −4°, and −6°, which are represented by Twist1, Twist2, and Twist3, respectively. The twist angles show a linear distribution along the spanwise of the wing.
Figure 13 shows the aerodynamic characteristics of the initial and twisted configurations at H = 11 km and Ma = 0.85. The lift coefficients of the twisted configurations decrease with the twist angle of the wing-tip increasing. The pitching moment curve translates upward as the twist angle increases. When α < 4°, the lift-to-drag ratio of the aircraft decreases. The larger the twist angle of the wing tip, the higher the reduction in the lift-to-drag ratio. The maximum reduction in the lift-to-drag ratio with Twist3 is about 3%, as shown in Figure 14b. When α ≥ 4°, the lift-to-drag ratio of the aircraft increases slightly. The larger the twist angle of the wing tip, the higher the increase in the lift-to-drag ratio. Furthermore, as the twist angle increases, the cruise angle of attack increases as well.
Although the longitudinal pitching nose-down moment of the aircraft is reduced, for a trapezoidal wing with low aspect ratio, the aerodynamic center of the wing is close to the center of gravity, and the wing tip twist has a little effect on the longitudinal moment of the aircraft. Notably, even the largest twist angle in the Twist3 configuration cannot satisfy the cruise trim requirements.
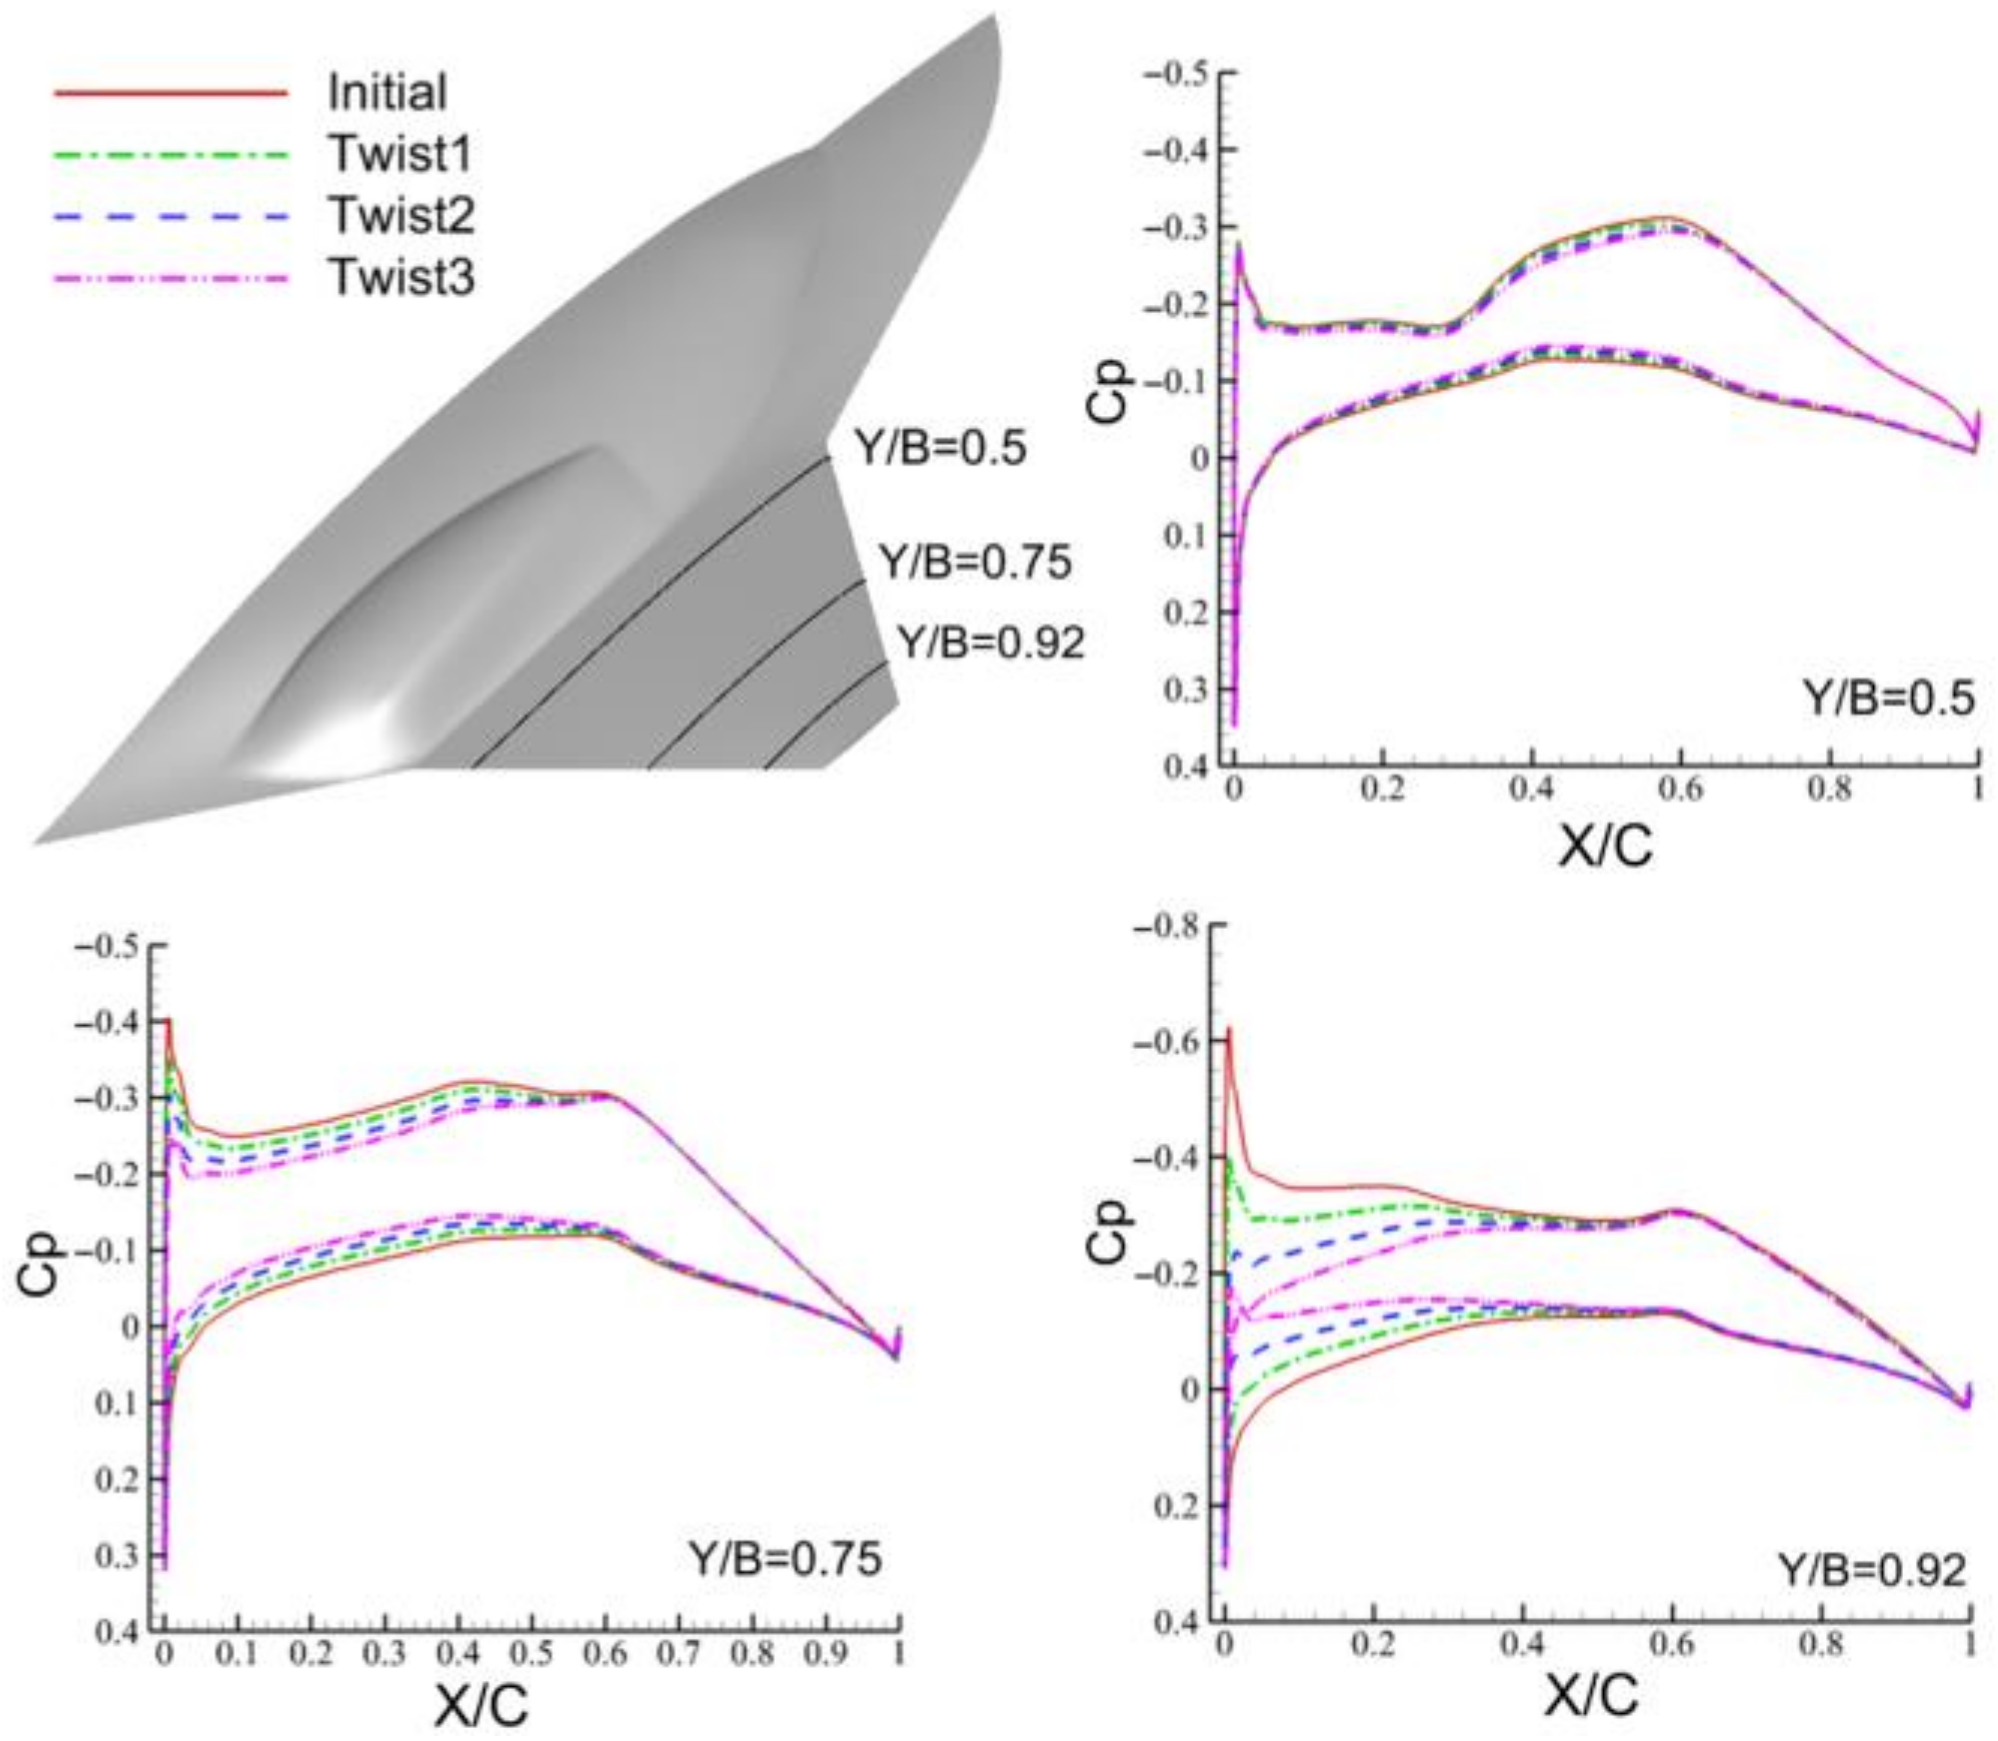
Figure 15 depicts the comparison of the pressure distribution of the initial configuration and the three twisted configurations at Y/B = 0.5, 0.75, and 0.92, and α = 2°, where Y is the y coordinate of the section location and B represents for half of the wingspan. As shown, the twist angle of the wingtip reduces the wing loading along the spanwise direction. The larger the twist angle, the larger the reduction in wing loading.
As shown in Figure 14, the increment in the nose-up moment is essentially proportional to the twist angle, the factor γ is defined to describe the longitudinal trimming efficiency of twisting as follows:
γ = Δ C m T w i s t V a l ,
where ΔCm is the increment in the nose-up moment and TwistVal is the twist angle. When H = 11 km and Ma = 0.85, the efficiency factor γtip is about 0.001.

4.3. Influence of Key Section Airfoils on the Aerodynamic Performance of the Configuration

As shown in Figure 10, key section airfoils are selected at Sections 1, 4, and 5, while the geometry airfoils at Sections 2 and 3 are fixed to afford the locations and stowage spaces of engines. The airfoil design is realized primarily by changing the camber of the leading/trailing edge. The expression of the new camber distribution function is as follows:
C a m b e r n e w = C a m b e r 0 + Δ C a m b e r ,
where Camber0 is the initial camber and ΔCamber is the increment. Its value is dimensionless, based on the local chord length. Notably, to ensure the loading space requirement, the area of the airfoil is unchanged.

4.3.1. Kink Airfoil Fore-Loading Design

Owing to the presence of the inlet and engines bumps, the fuselage surface of the initial configuration is complex. This increases the difficulty of designing the fuselage section airfoils. Therefore, the first consideration is the airfoil at the kink section. The kink airfoil is the Section 4 airfoil, shown in Figure 10. The airfoils of the other sections are unchanged.
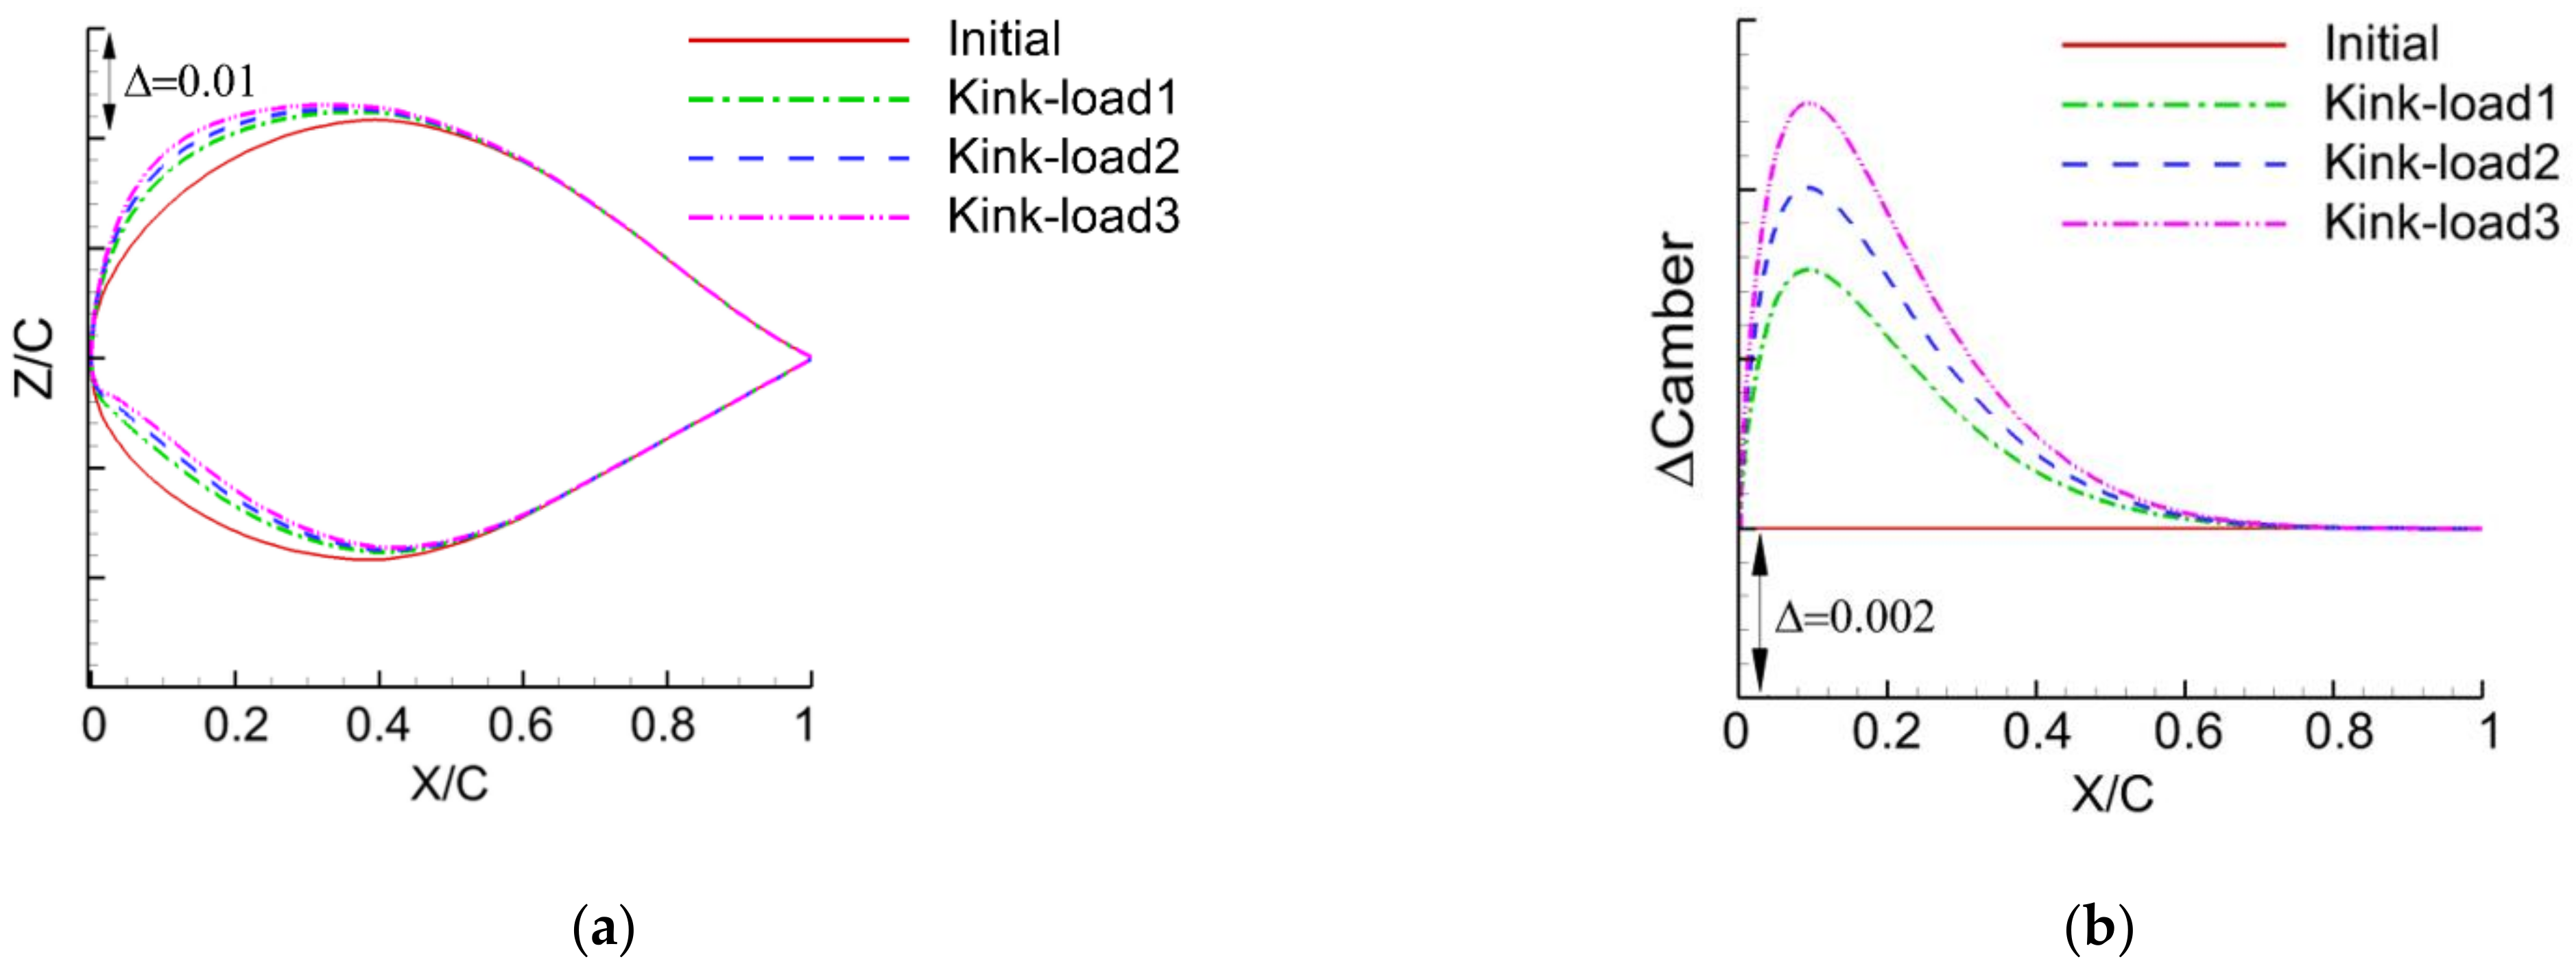
Based on the airfoil design method, three fore-loading configurations—Kink-load1, Kink-load2, and Kink-load3—are obtained. Figure 16a,b compare the shape of the three fore-loading and initial airfoils at the kink position, and the camber increments of the corresponding airfoils.
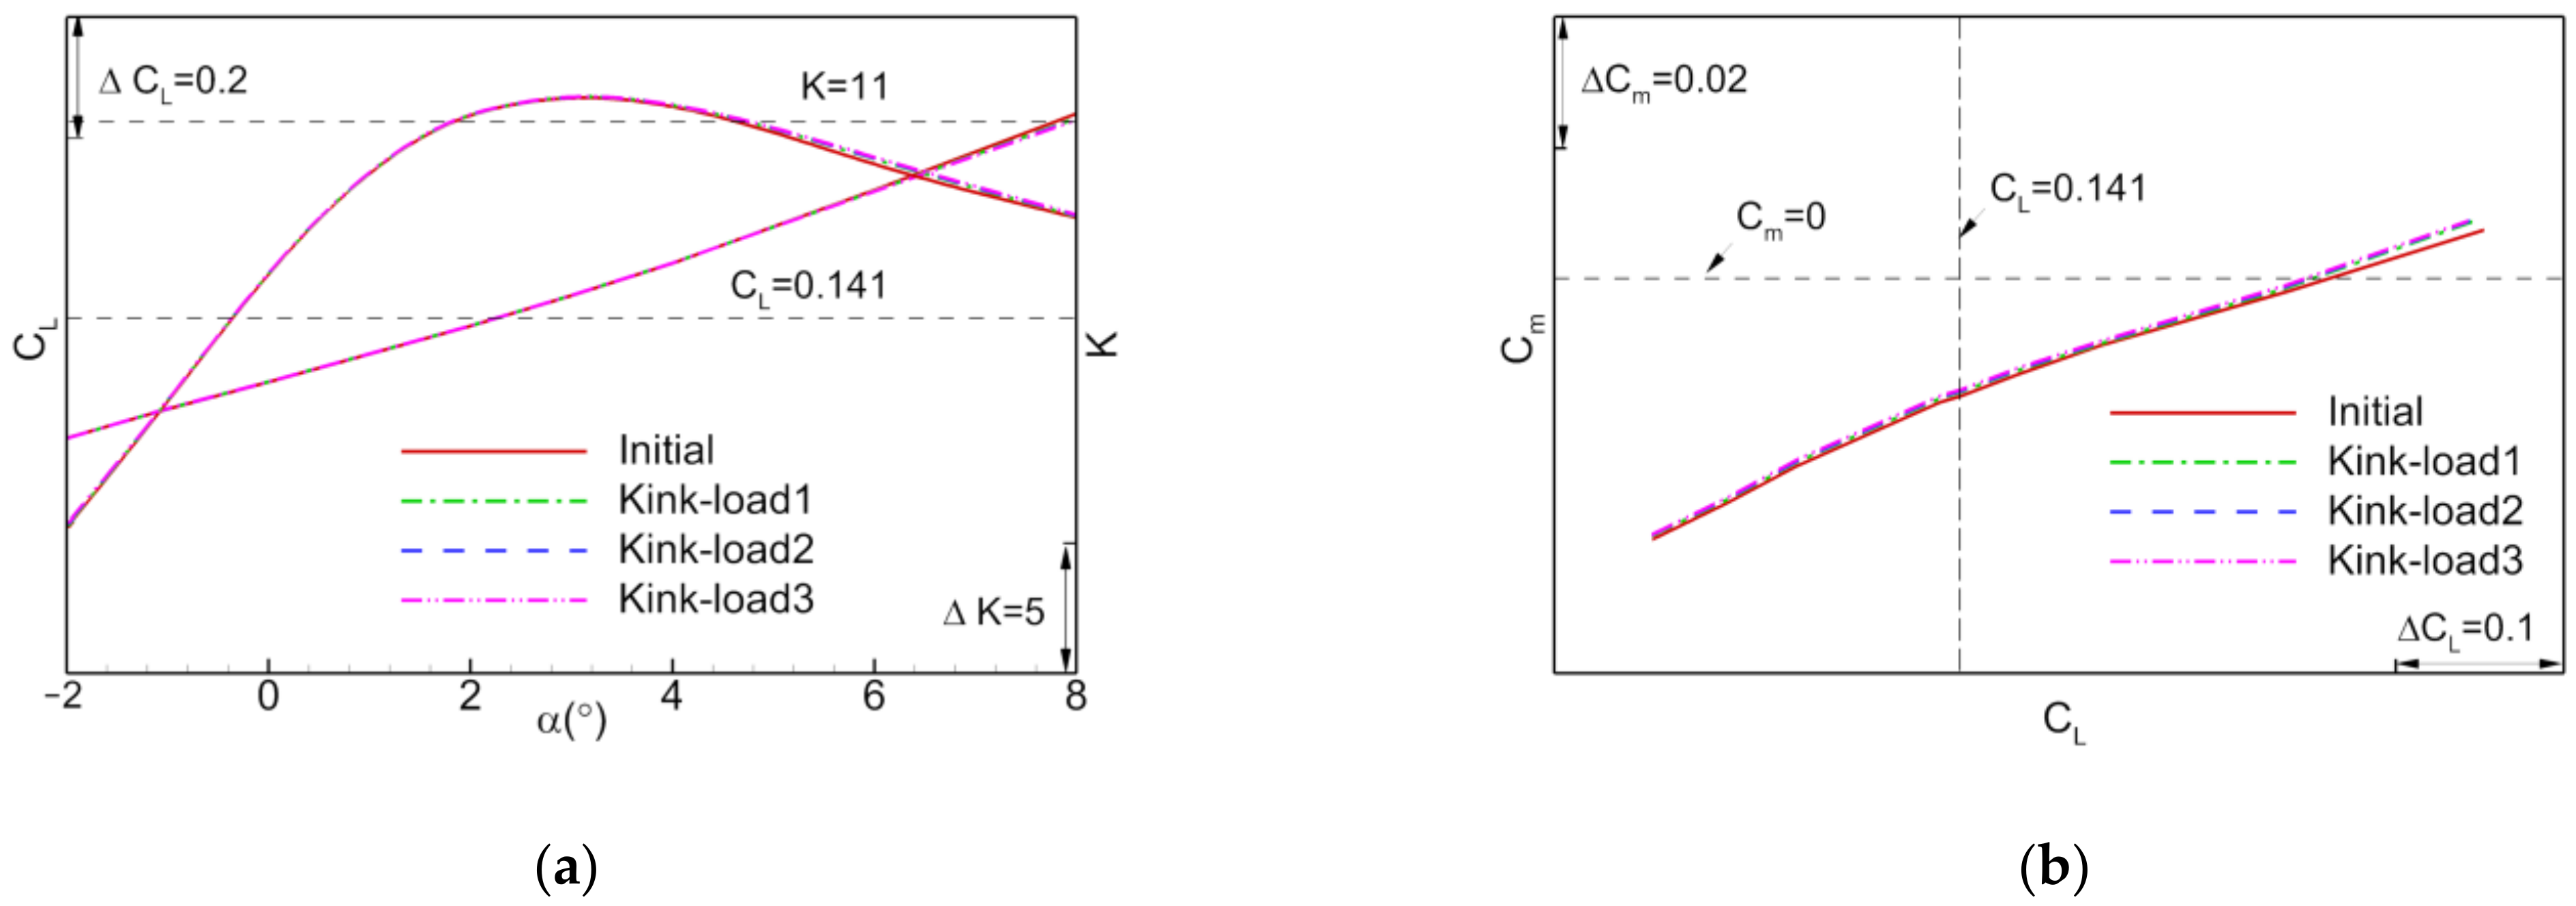
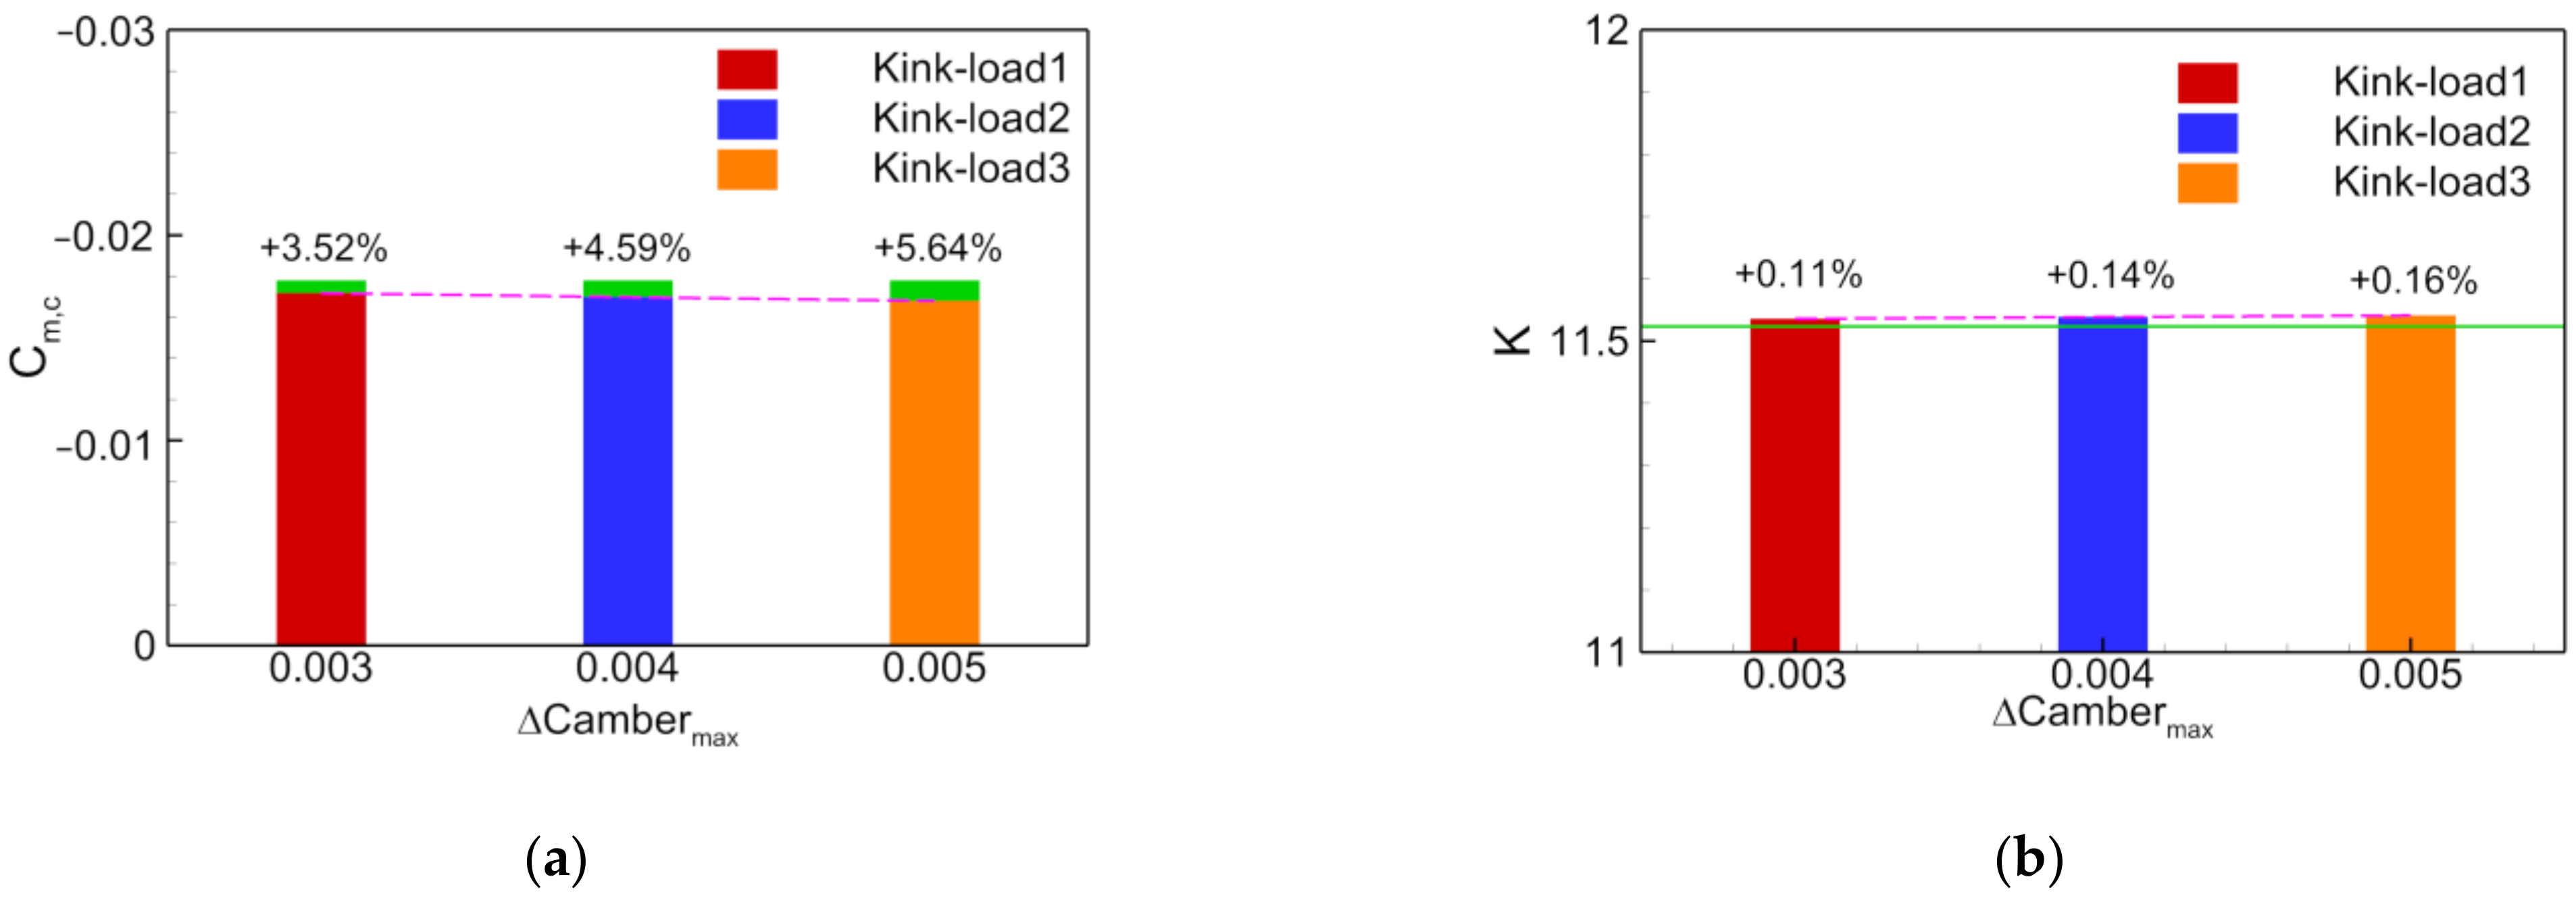
Figure 17 depicts the comparison of the aerodynamic characteristics of the fore-loaded and initial configurations. Figure 18 describes the variation of pitching moment and the lift-to-drag ratio. As shown, the fore-loading of the kink airfoil has a negligible influence on the lift-to-drag ratio and pitching moment characteristics of the aircraft. This is because of two primary reasons: (1) the wing has a large sweep angle resulting in a strong spanwise flow, and consequently, the fore-loading effect of a single profile airfoil is limited; and (2) the location of the modified region is close to the center of gravity, and the nose-up pitching moment generated by fore-loading is too small to alter the pitching moment of the aircraft. Therefore, owing to the limitations of the initial planform shape, a larger fore-loading airfoil cannot provide a satisfactory zero-lift moment and favourable pitching moment characteristic of the aircraft during cruise.
Figure 19 depicts the comparison of the chordwise pressure distribution along the Y/B = 0.5, 0.75, and 0.92 sections of the wing, at various fore-loaded and initial configurations. As shown, in the part near the wing root, the fore-loading effect is quite substantial. However, as the wingtip airfoil is unchanged, the fore-loading effect becomes progressively weaker along the spanwise direction, which further explains why the fore-loading kink airfoil design cannot alter the pitching moment of the aircraft.

4.3.2. Kink Airfoil Aft-Reflexing Design

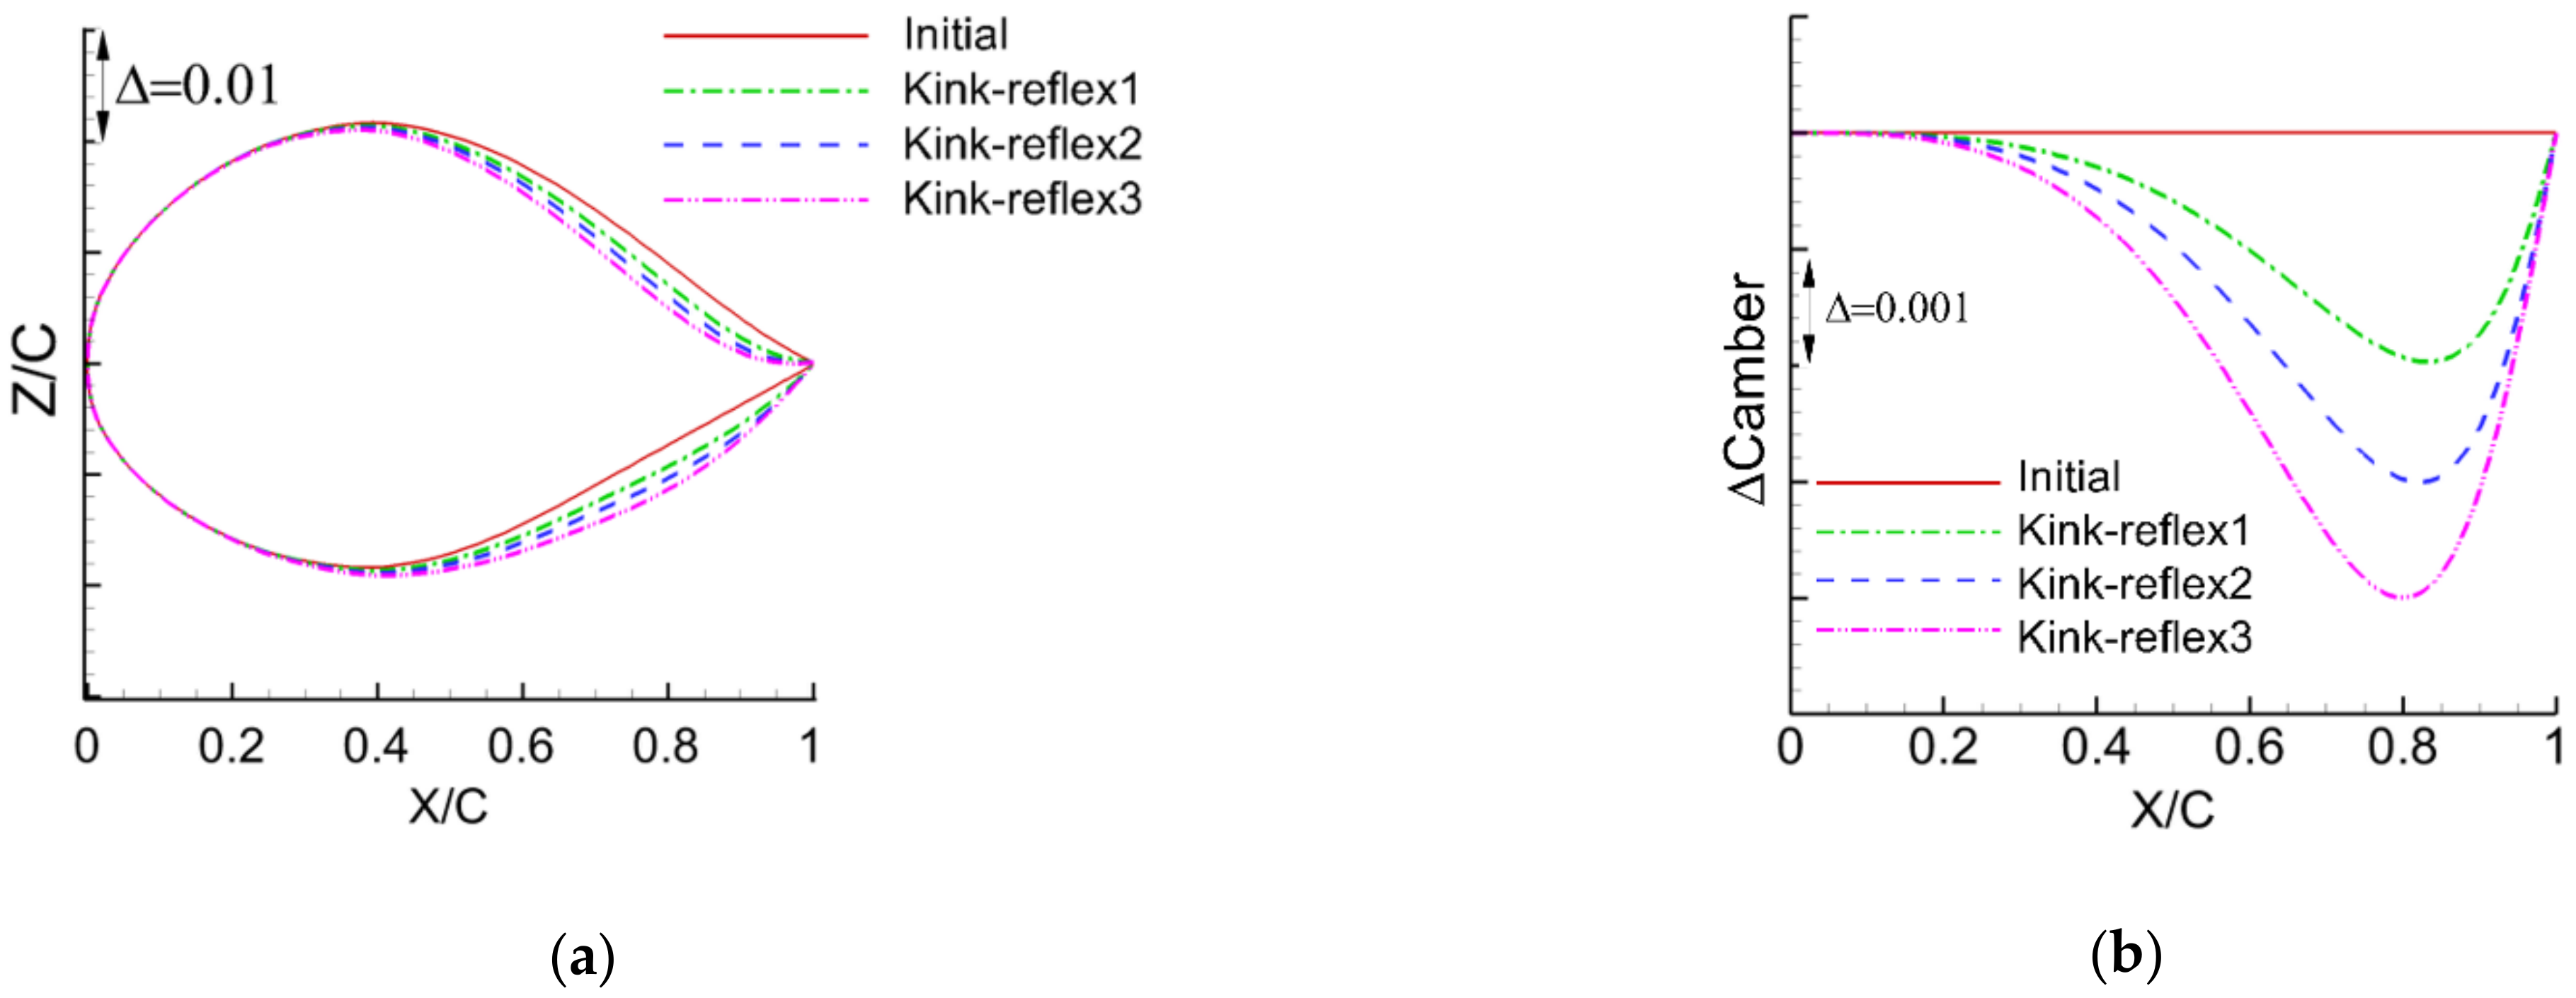
Considering the constraint of a fixed airfoil area, three configurations—Kink-reflex1, Kink-reflex2, and Kink-reflex3—are designed. Figure 20 depicts the comparison of the shape of the three aft-reflexing airfoils and the initial airfoil at the kink profile, as well as the incremental camber of each airfoil.
Figure 21 depicts the comparison of the aerodynamic characteristics of the aft-reflexed and initial configurations. As shown, the aft-reflexing kink airfoil reduces the lift and drag of the aircraft. The larger the aft-reflexing, the higher the reduction in lift and drag. The aft-reflexing design of the airfoil has a significant influence on the longitudinal moment of the aircraft. The larger the aft-reflexing, the higher the increment in the nose-up moment. Owing to the aft-reflexing of the airfoil, the lift-to-drag ratio of the aircraft decreases when α < 4°. However, the reduction in the lift-to-drag ratio of the aft-reflexed configurations are not as large as those of Twist2 or Twist3. Therefore, in comparison with the wing-twist design method, the aft-reflex kink airfoil design has lesser influence on the lift-to-drag ratio of the aircraft, while providing an almost identical increment in the nose-up moment.
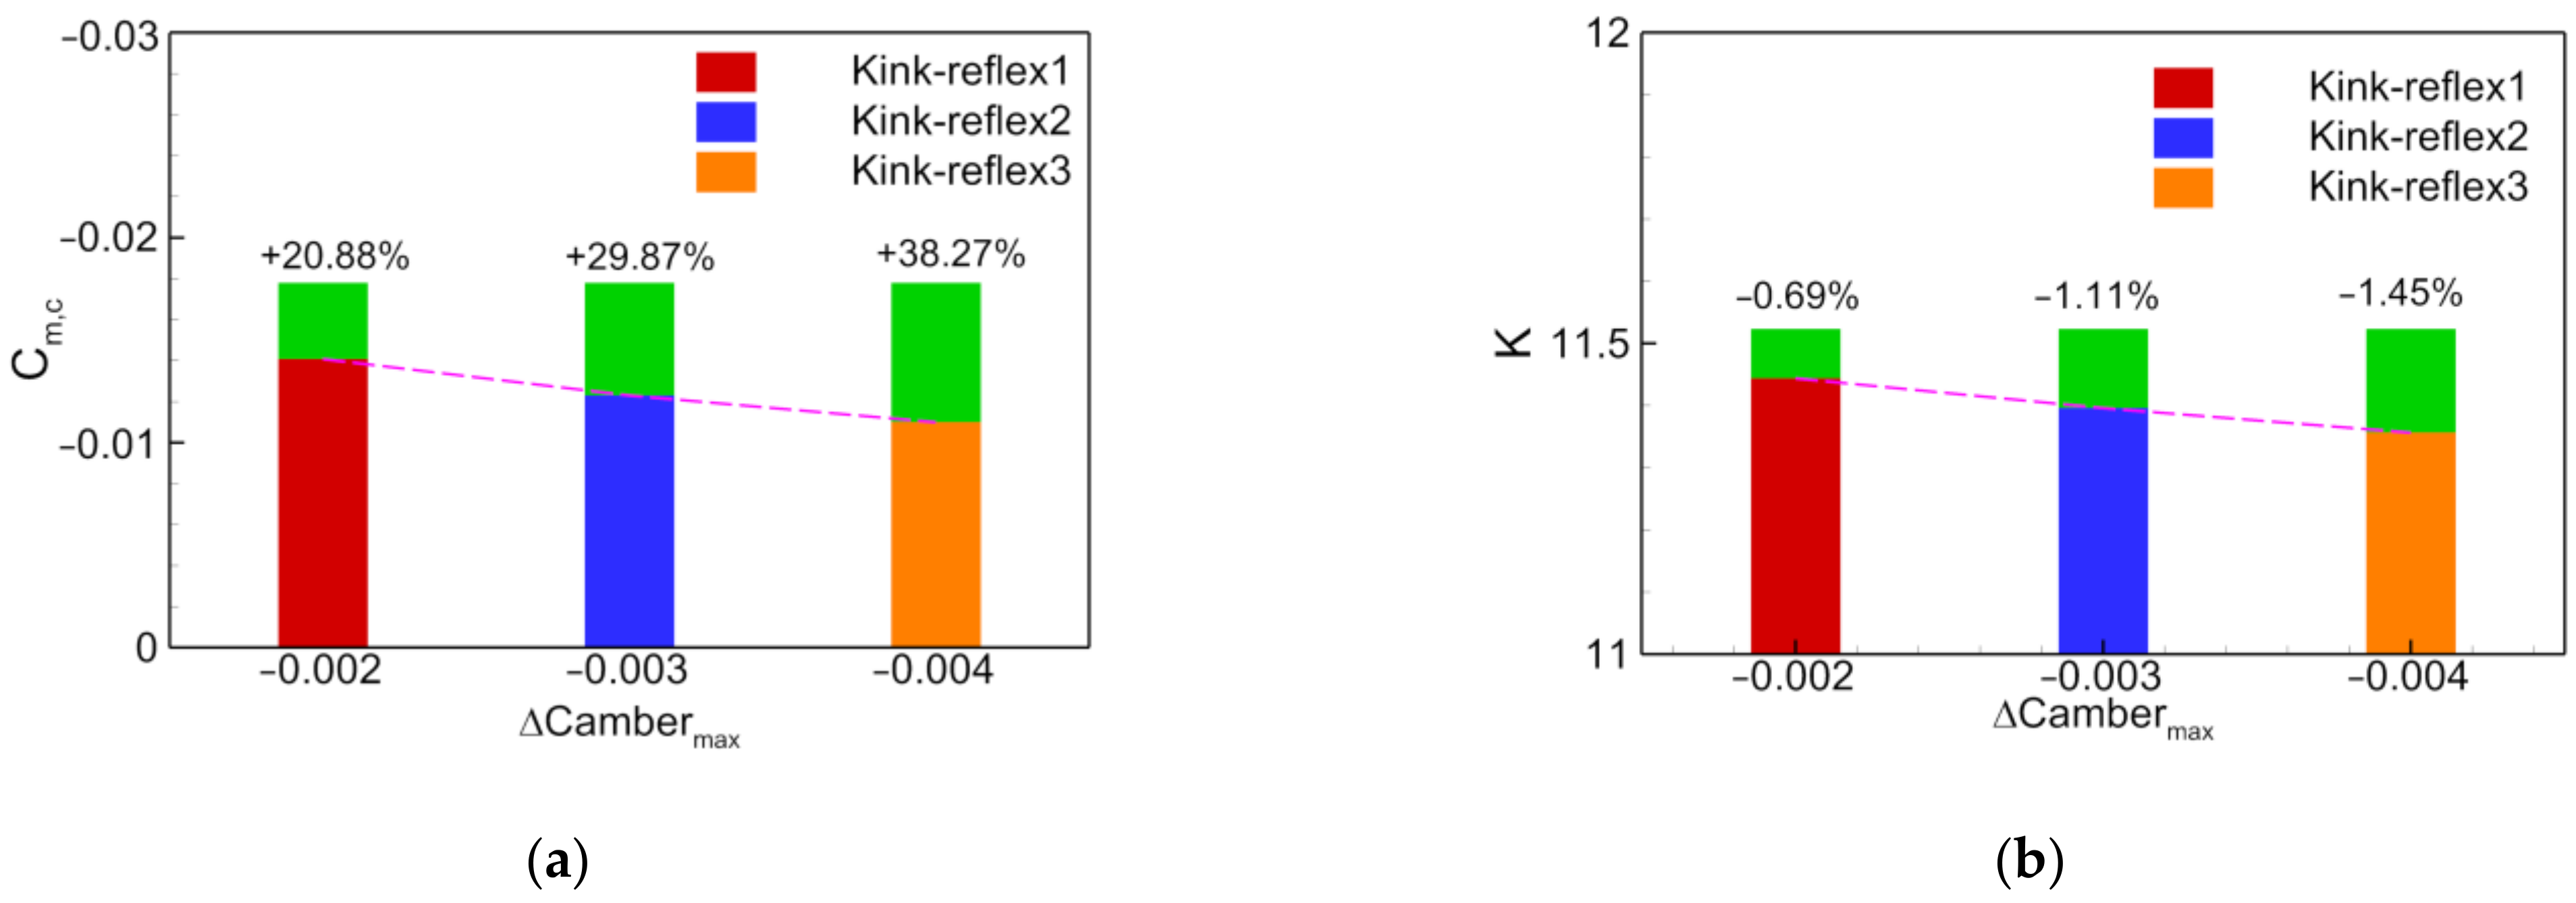
The cruising angle of attack of the aircraft is increased by adopting the aft-reflexing airfoil. However, the increment is small and increases with the increase in the extent of aft-reflexing. According to Figure 14 and Figure 22, during cruise, the maximum increment in pitching moment with Kink-reflex3 is about 38%, which is greater than that of Twist3 (34%). The reduction in the lift-to-drag ratio is only about half that of Twist3. The aft-reflexing design is a more effective method that not only provides an optimal nose-up moment, but also has a negligible influence on the lift-to-drag ratio of the aircraft.
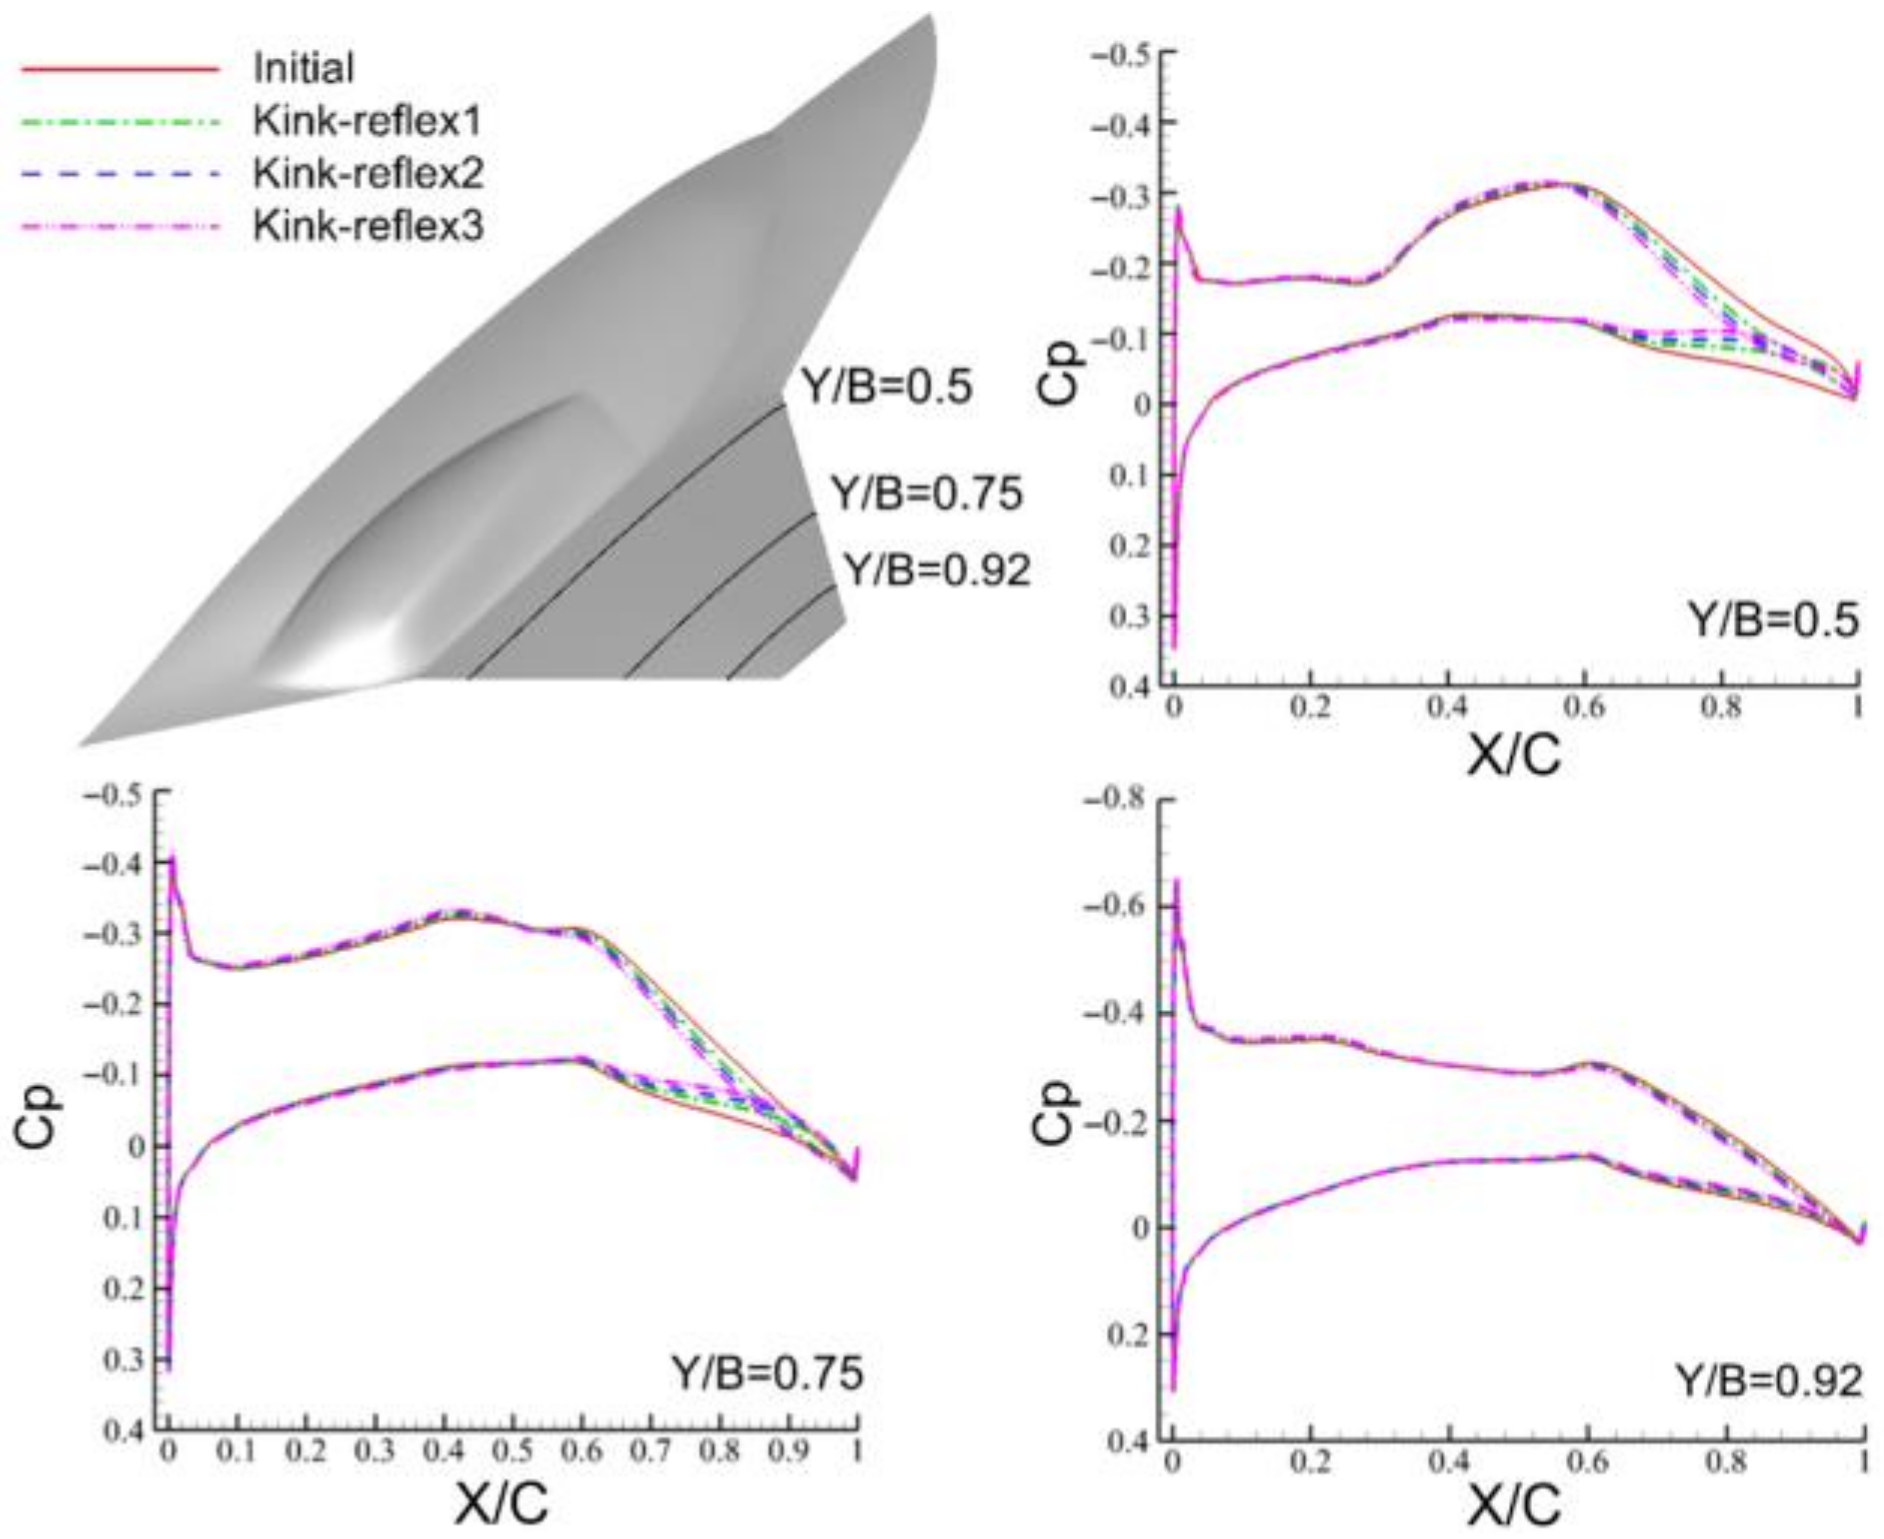
Figure 23 depicts the comparison of the chordwise pressure distribution along the Y/B = 0.5, 0.75, and 0.92 sections of the wing of the initial and aft-reflexing configurations at α = 2°. As shown, aft-reflexing has a negligible effect on the pressure distribution near the front of the wing, and only has a significant impact on the pressure distribution near the rear of the wing. Consequently, it does not generate lift or a weak negative lift, thereby reducing the nose-down moment.
From the above analysis, it is observed that the fore-loading and aft-reflexing airfoils at the kink section can increase the nose-up moment and improve the longitudinal performance. According to Figure 18 and Figure 22, the increment in the nose-up moment is almost proportional to the increment in camber at the same superposition location of the camber. The efficiency factor κ of camber trimming describes the longitudinal trimming efficiency of fore-loading or aft-reflexing, and is defined as follows:
κ = Δ C m C a m V a l   ,
where, ΔCm is the increment in the nose-up moment, and CamVal is the maximum value of the superimposed camber. Table 6 presents the mean κ values of fore-loading and aft-reflexing of kink airfoil in the linear lift region, which forms the basis for the work that follows. For the kink airfoil, the κ value of aft-reflexing is much higher than that of fore-loading.

4.3.3. Kink and Tip Airfoils Fore-Loading Design

From the design of kink airfoil, it is found that the kink airfoil with highest aft-reflexing (Kink-reflex3) cannot satisfy the trimming requirements. This section considers the simultaneous design of the kink profile airfoil (Section 4) and tip profile airfoil (Section 5).
Adopting the fore-loading design method described previously, three kinds of fore-loading airfoils are obtained. Combined with the corresponding fore-loaded kink airfoils, three configurations are obtained—K&T-load1, K&T-load2, and K&T-load3.
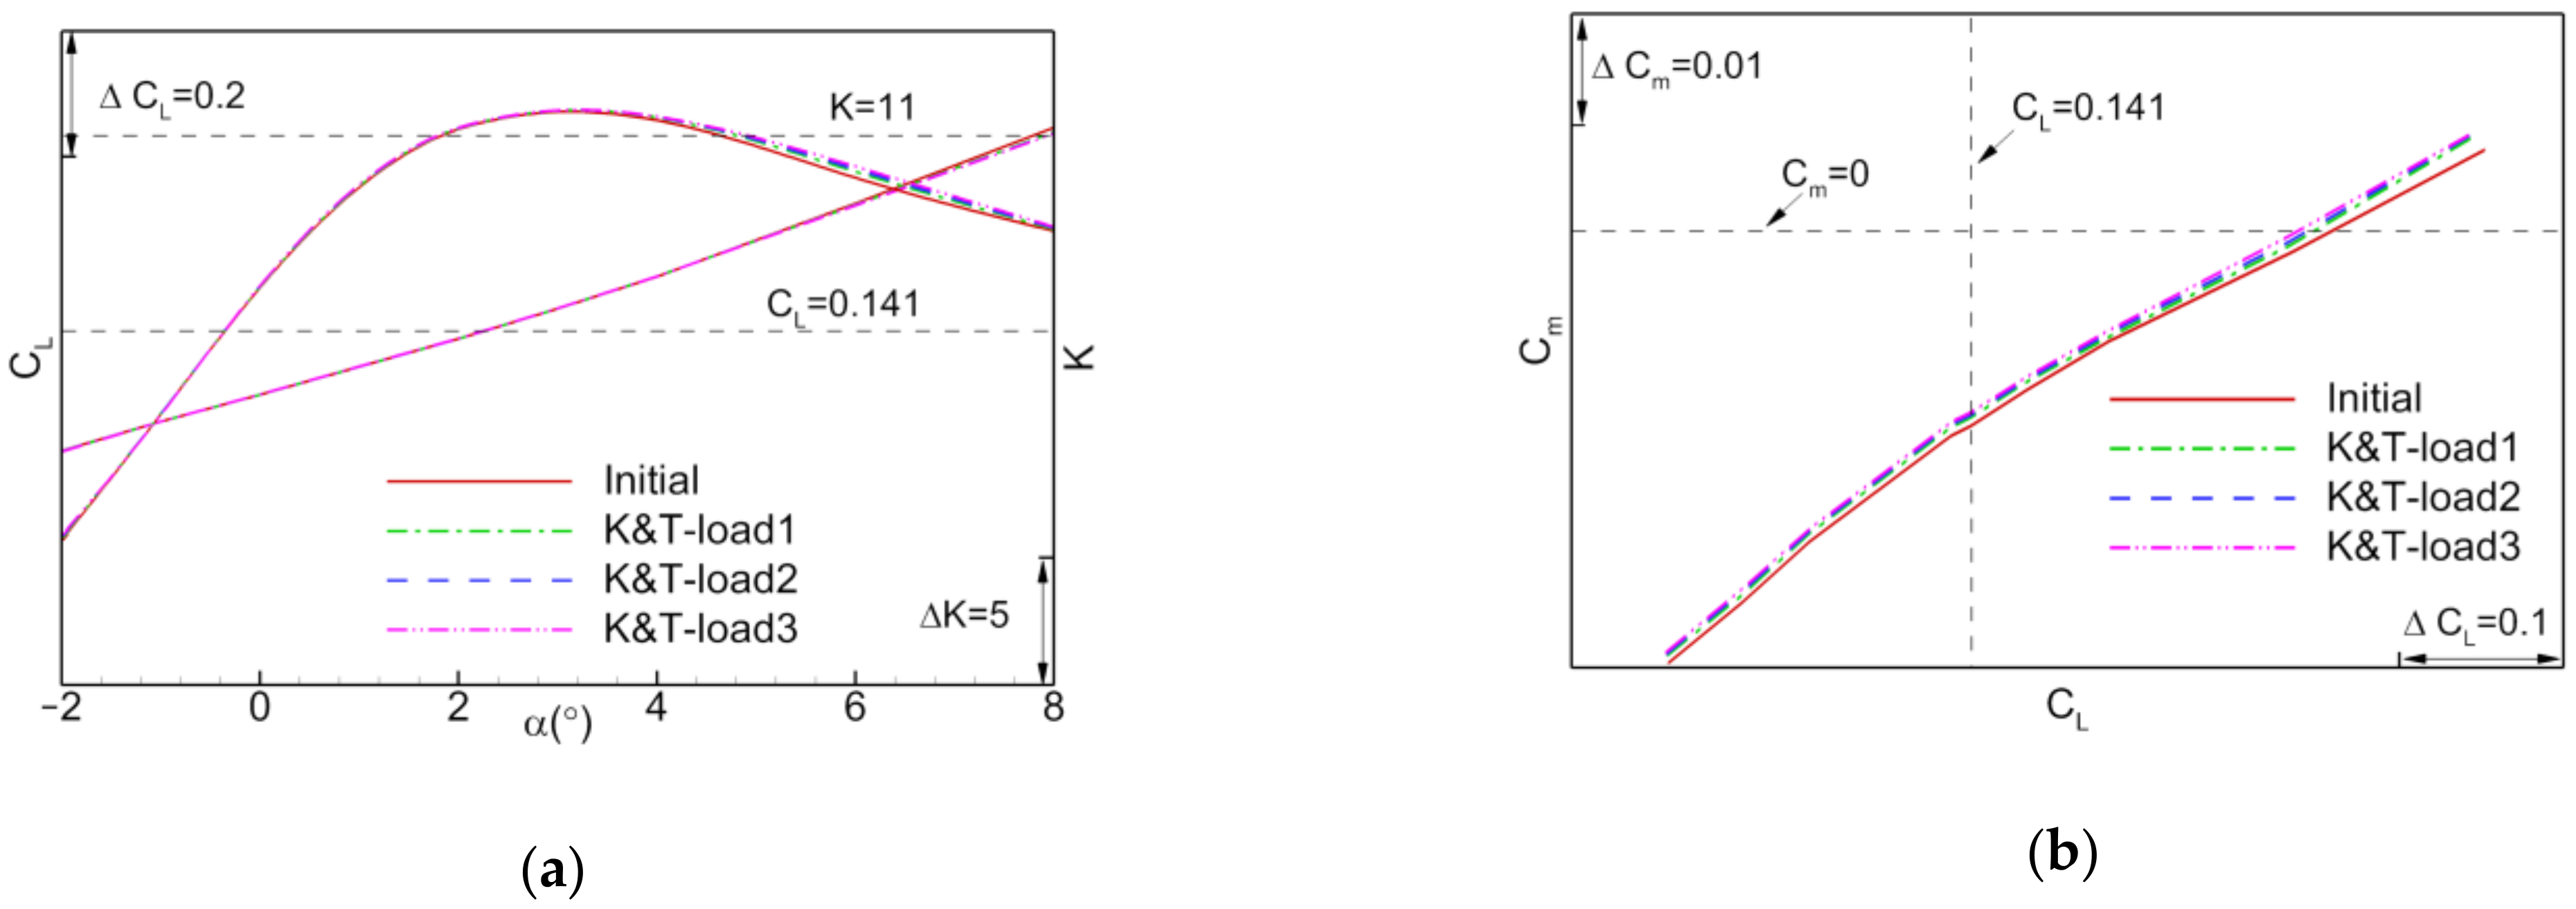
Figure 24 depicts the comparison of the aerodynamic characteristics of the three kink/tip fore-loaded configurations and the initial configuration. As shown, the fore-loading design of the kink and tip airfoils has a negligible effect on the lift-to-drag ratio and the pitching moment characteristics of the aircraft. As shown in Figure 25, fore-loading increases the lift-to-drag ratio and nose-up pitching moment, but the increments are small.

4.3.4. Kink and Tip Airfoils Aft-Reflexing Design

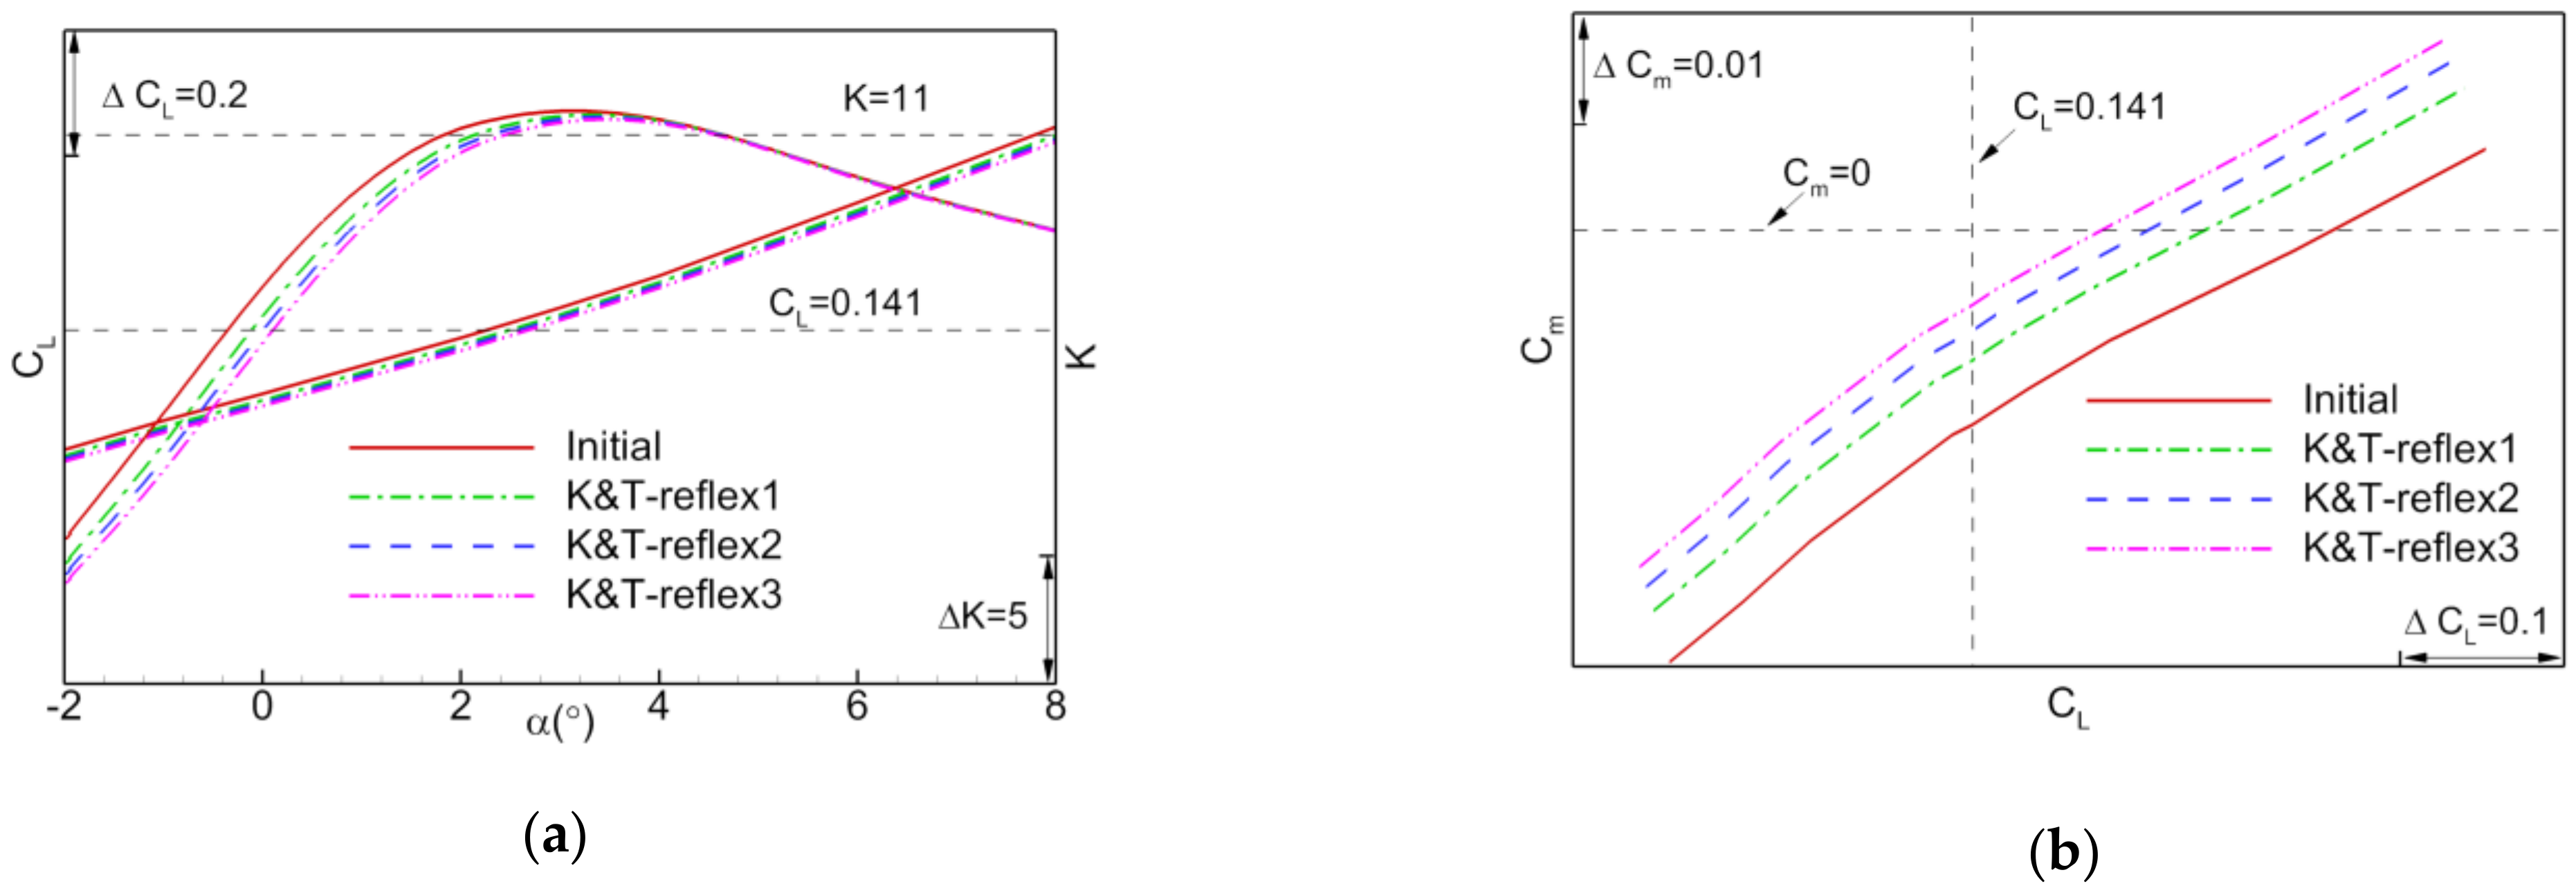
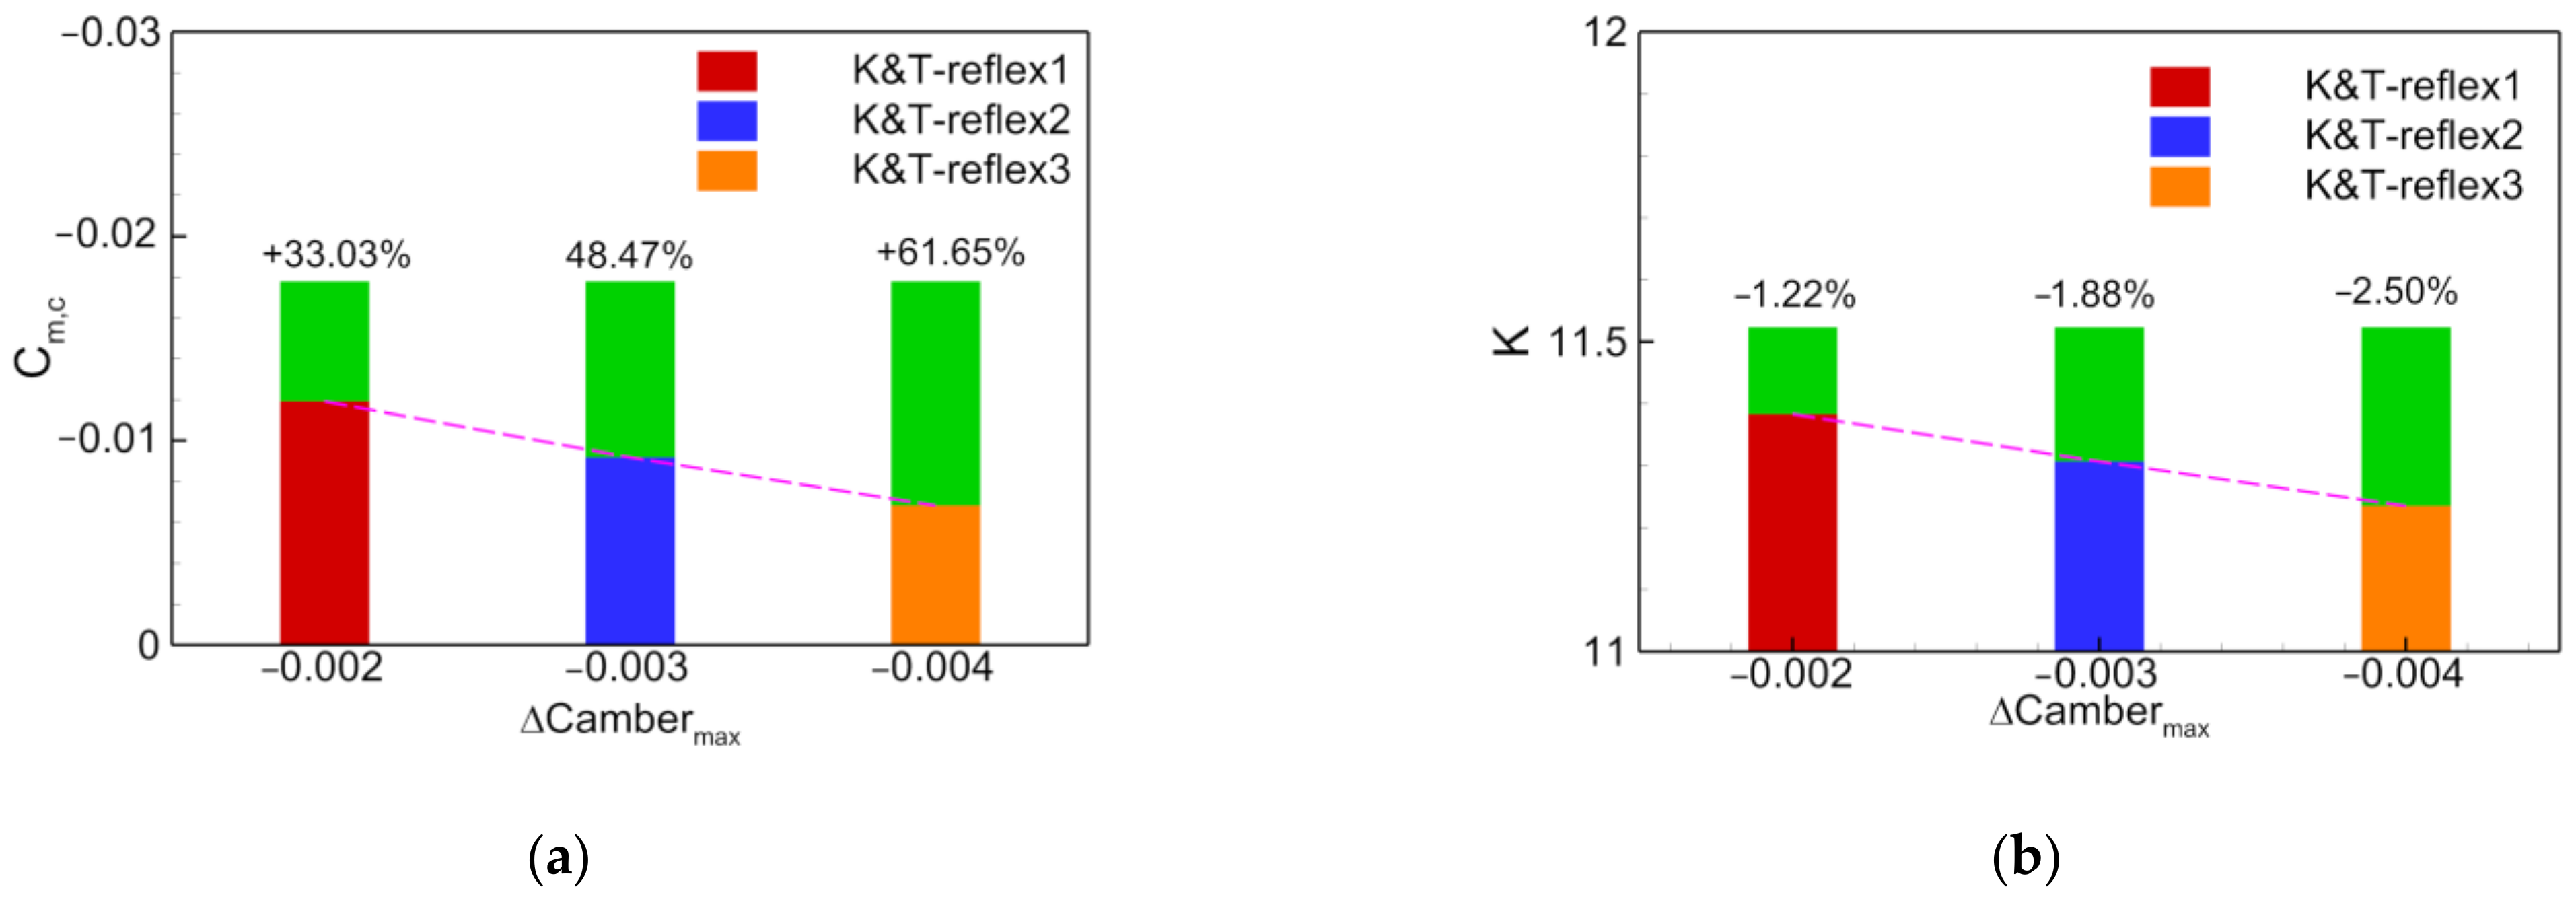
The kink and tip airfoils were designed using the aft-reflexing design method from the previous section to obtain three configurations: K&T-Reflex1, K&T-Reflex2, and K&T-Reflex3. Figure 26 depicts the comparison of the aerodynamic characteristics of the initial and kink/tip aft-reflexed configurations during cruise. As shown, the aft-reflexing design of airfoils increases the cruise angle of attack and decreases the lift-to-drag ratio. The increment in the nose-up moment increases with the increasing of aft-reflexing.
As shown in Figure 25 and Figure 27, the increase of camber at different positions is essentially linearly related to the longitudinal moment of the aircraft. Therefore, the longitudinal trim efficiency factor κ of the tip airfoil can be estimated from the results of the kink airfoil and the influence of the extent of fore-loading/aft-reflexing, as shown in Table 7.

4.3.5. Symmetrical-Plane Airfoil Design

While the wing design can increase the nose-up moment of the aircraft, it also influences the lift-to-drag ratio. Owing to the long chord length of the fuselage, the pressure distribution across the airfoil of the symmetrical-plane section has a significant impact on the pitching moment. However, modifications to the upper surface of the fuselage are geometrically limited because of the engine bumps and the modified inlet. Consequently, only the inner side of the engine bumps and the lower surface of the fuselage, which is relatively flat, can be modified.
From the previous investigation on the fore-loading/aft-reflexing design of the kink and tip airfoils, it can be inferred that the aft-reflexing design is an effective method to increase the longitudinal moment of the aircraft. Therefore, the aft-reflexing design is adopted at the symmetrical-plane airfoil of the fuselage. Some additional considerations are also necessary: (1) the airfoil area must remain constant when modifying the fuselage to satisfy the loading requirements; and (2) as the thickness of the airfoil section of the fuselage is considerable, the symmetrical-plane airfoil should be appropriately aft-reflexed to prevent the appearance of strong shock waves, which can deteriorate the aerodynamic efficiency of the aircraft. This is a contradictory problem, which must be considered in the airfoil design.
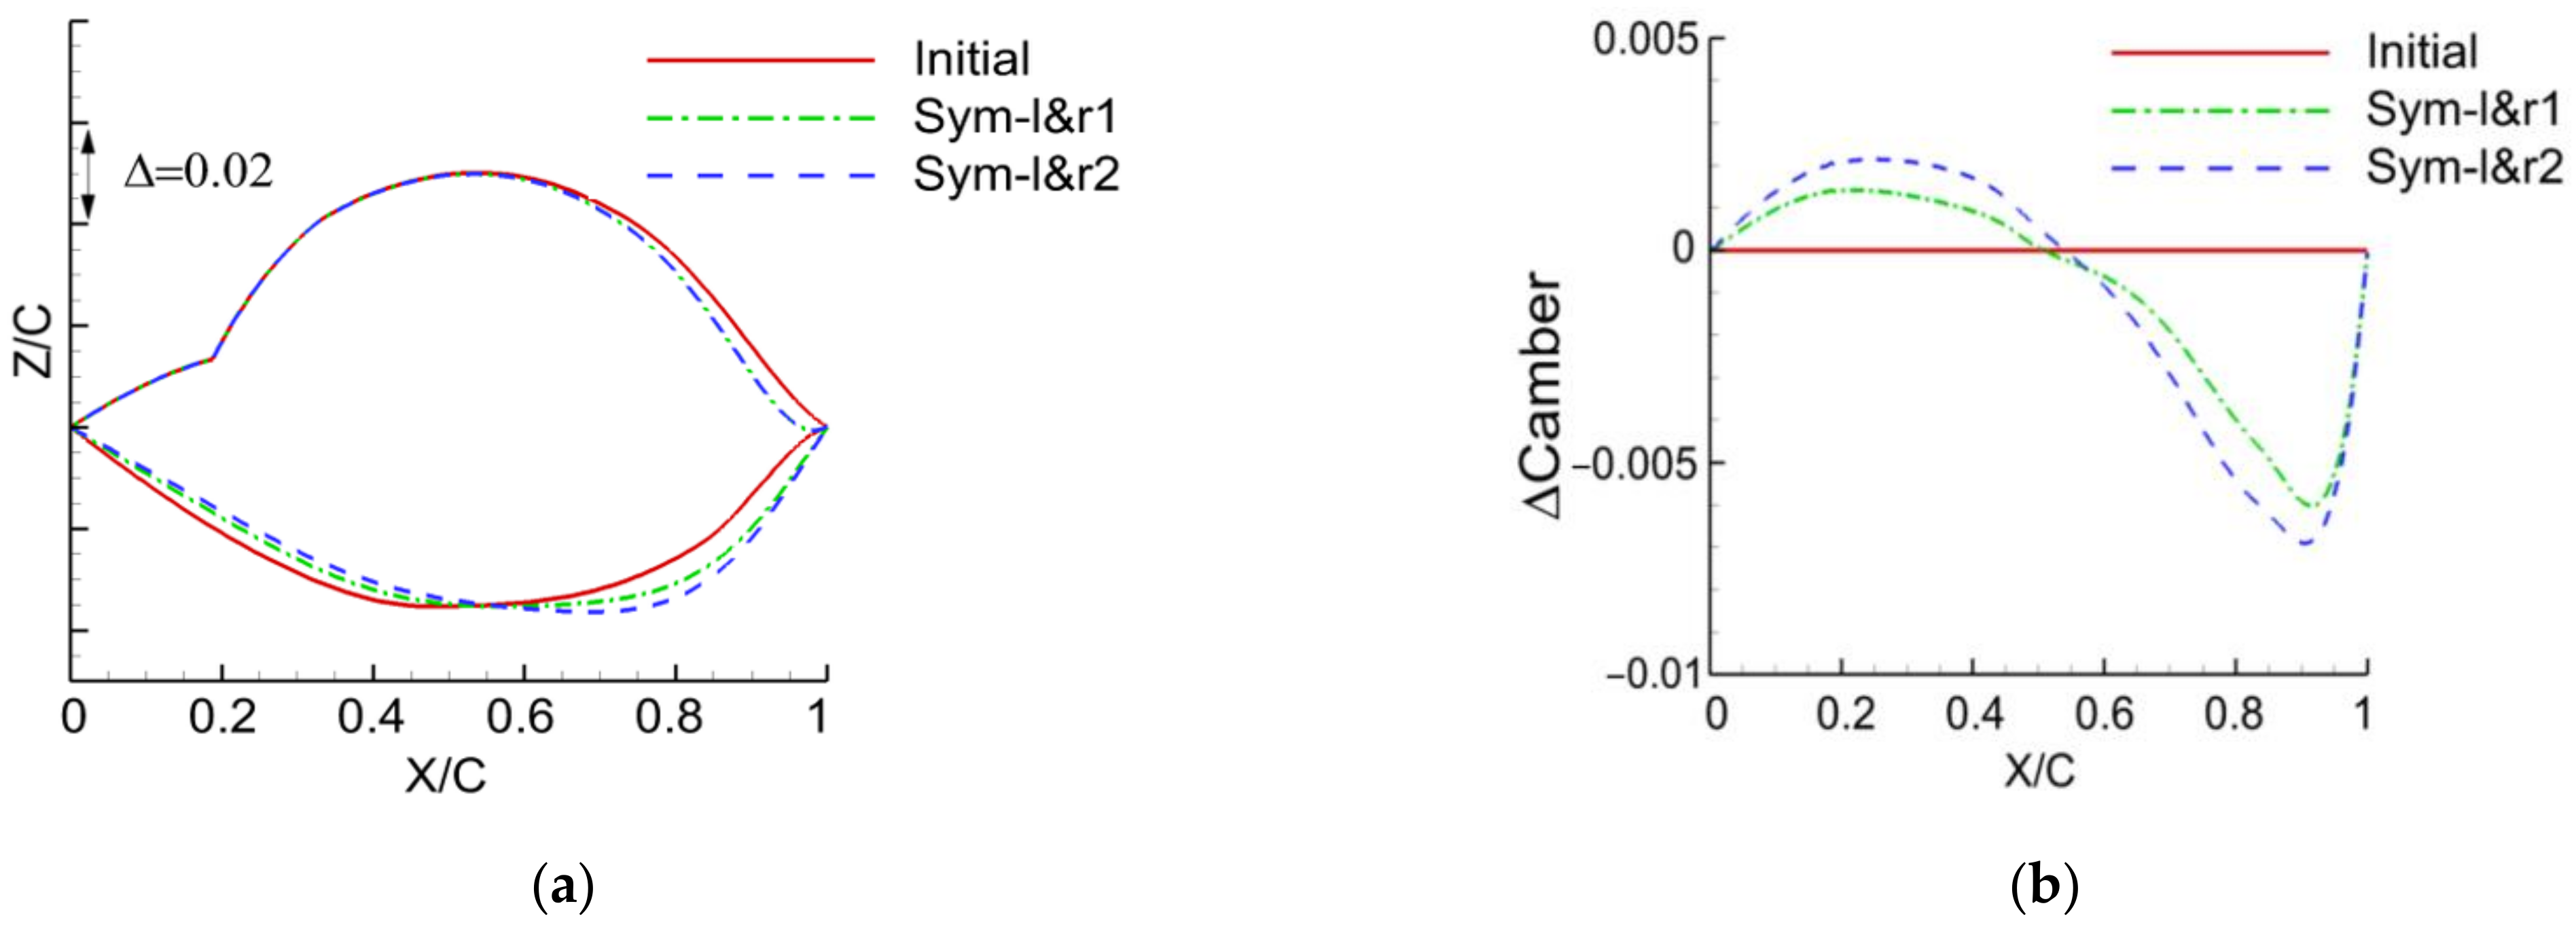
As the upper surface has a considerable influence on aerodynamic performance, the upper surface of the symmetrical-plane airfoil is only changed slightly, and the increment in camber is primarily distributed along the lower surface. Figure 28a shows two designed airfoils—Sym-L&R1 and Sym-L&R2—with the same area as the initial airfoil. Figure 28b shows the camber increments of each configuration.
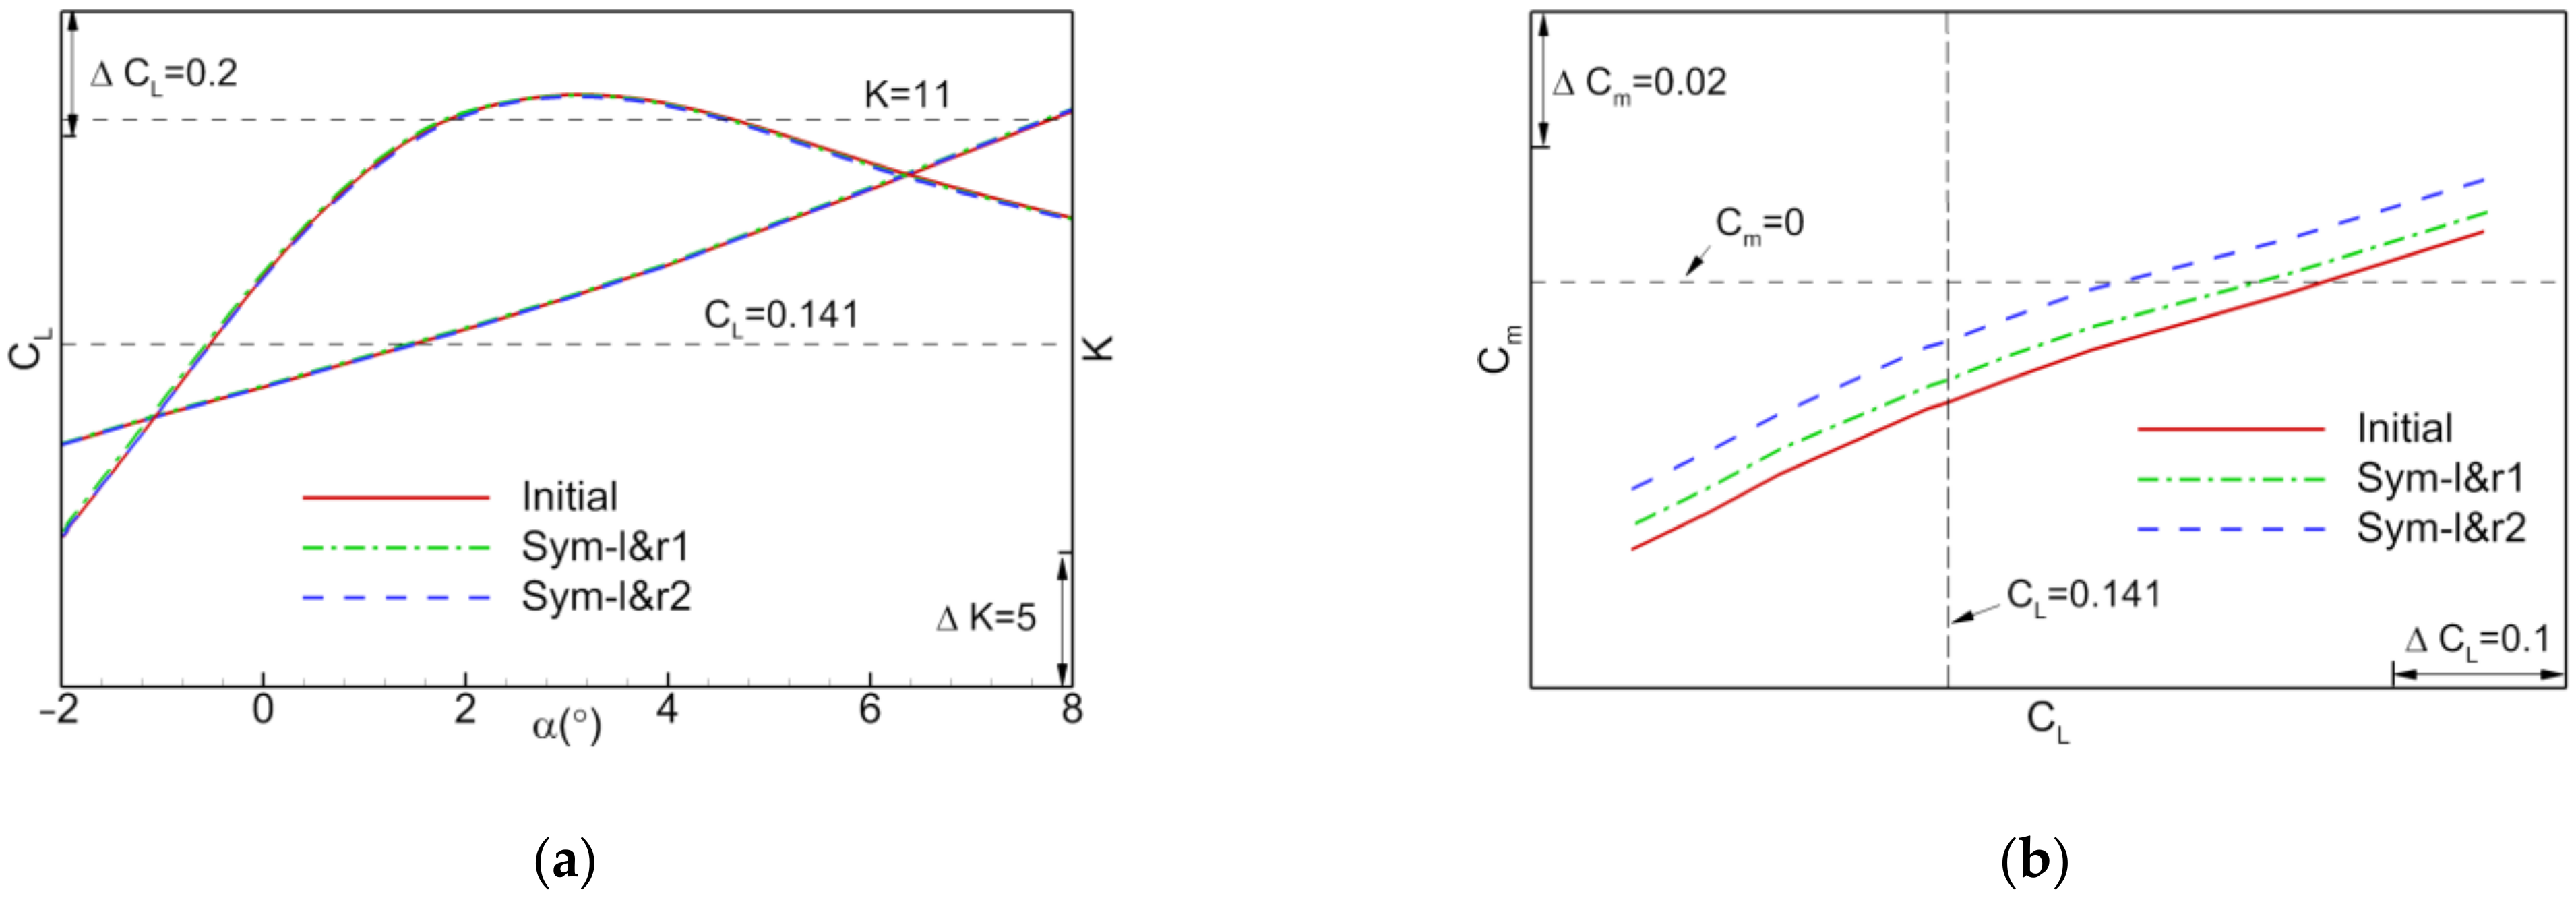
Figure 29 illustrates the aerodynamic characteristics of the initial configuration and the configurations with the modified symmetrical-plane airfoils. Table 8 depicts the comparison of the aerodynamic characteristics of the initial and modified configurations. In the modified configurations, the cruise angles vary slightly. The maximum moment increment of Sym-L&R2 during cruise is 51.12%, while the lift-to-drag ratio is reduced slightly. Thus, symmetrical-plane airfoil design is an effective method to not only generate a favorable nose-up moment, but also scarcely influence the lift-to-drag ratio of the aircraft.

4.4. Aerodynamic Design of the Configuration

Having analyzed the influence of the parameters of the spanwise control sections on the longitudinal moment characteristics of the aircraft, the approximate linear combination of the airfoil design methods of different control sections are proceeded, to realize the longitudinal trimming design of the initial configuration. The parameters are determined by the formula:
C m _ t r i m m e d = Δ C m _ S y m + i = 1 4 κ i C a m V a l i   +   γ T i p T w i s t V a l ,
where Cm_trimmed is the desired value of the pitching moment to trim the initial configuration, ∆Cm_Sym is the moment increment achieved by modifying the symmetrical-plane, κ and CamVal are the trim efficiency factor and maximum camber increment of the kink and tip airfoils, respectively. While γTip and TwistVal are the trim efficiency factor of wing twist and twist angle, respectively.
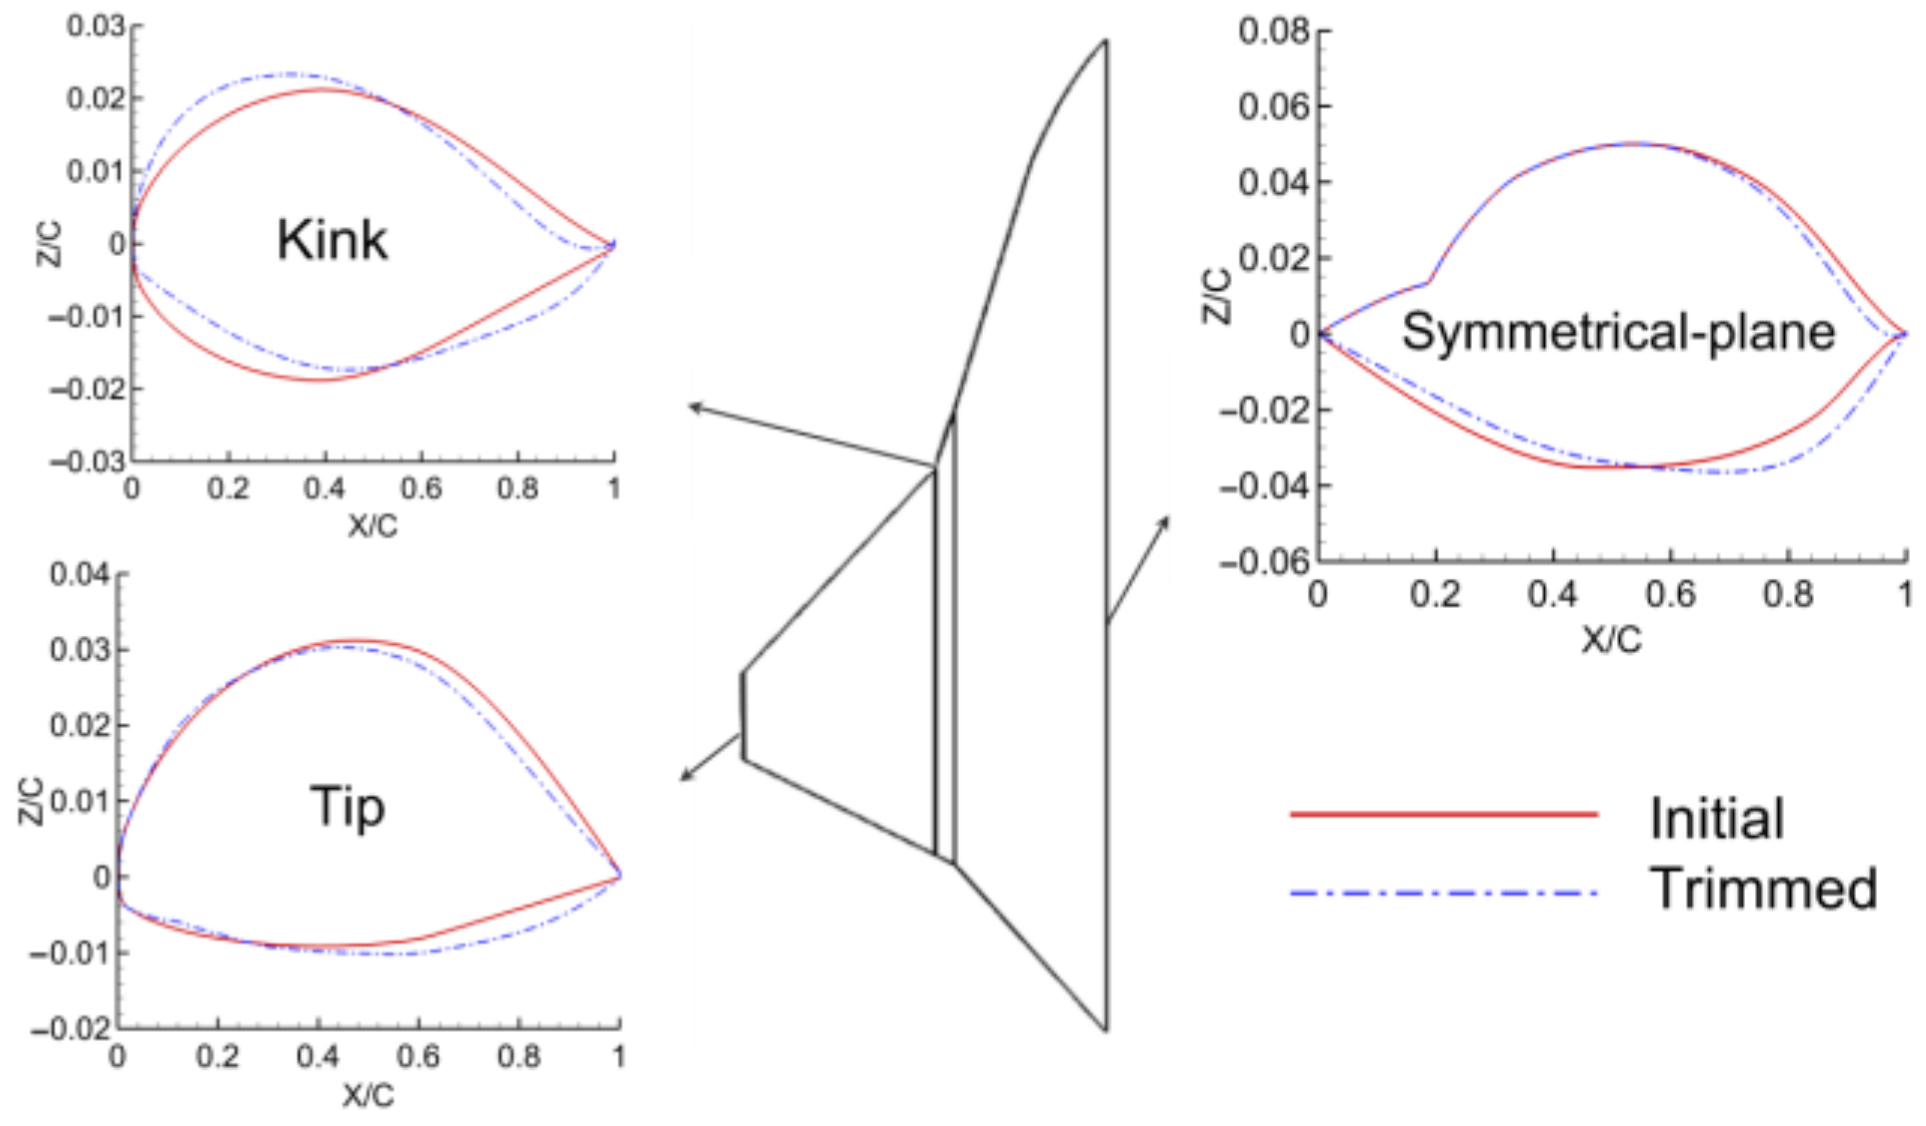
The aerodynamic design of the configuration during cruise is performed using the methods mentioned above. The trimmed configuration has no geometric twist at the wingtip. It uses the fore-loading and aft-reflexing design at fuselage symmetrical plane, kink section and tip airfoils herein. Figure 30 depicts the comparison of these airfoils of the trimmed configuration with those of the initial configuration.

4.5. Trimmed Configuration Assessment

4.5.1. High-Speed State

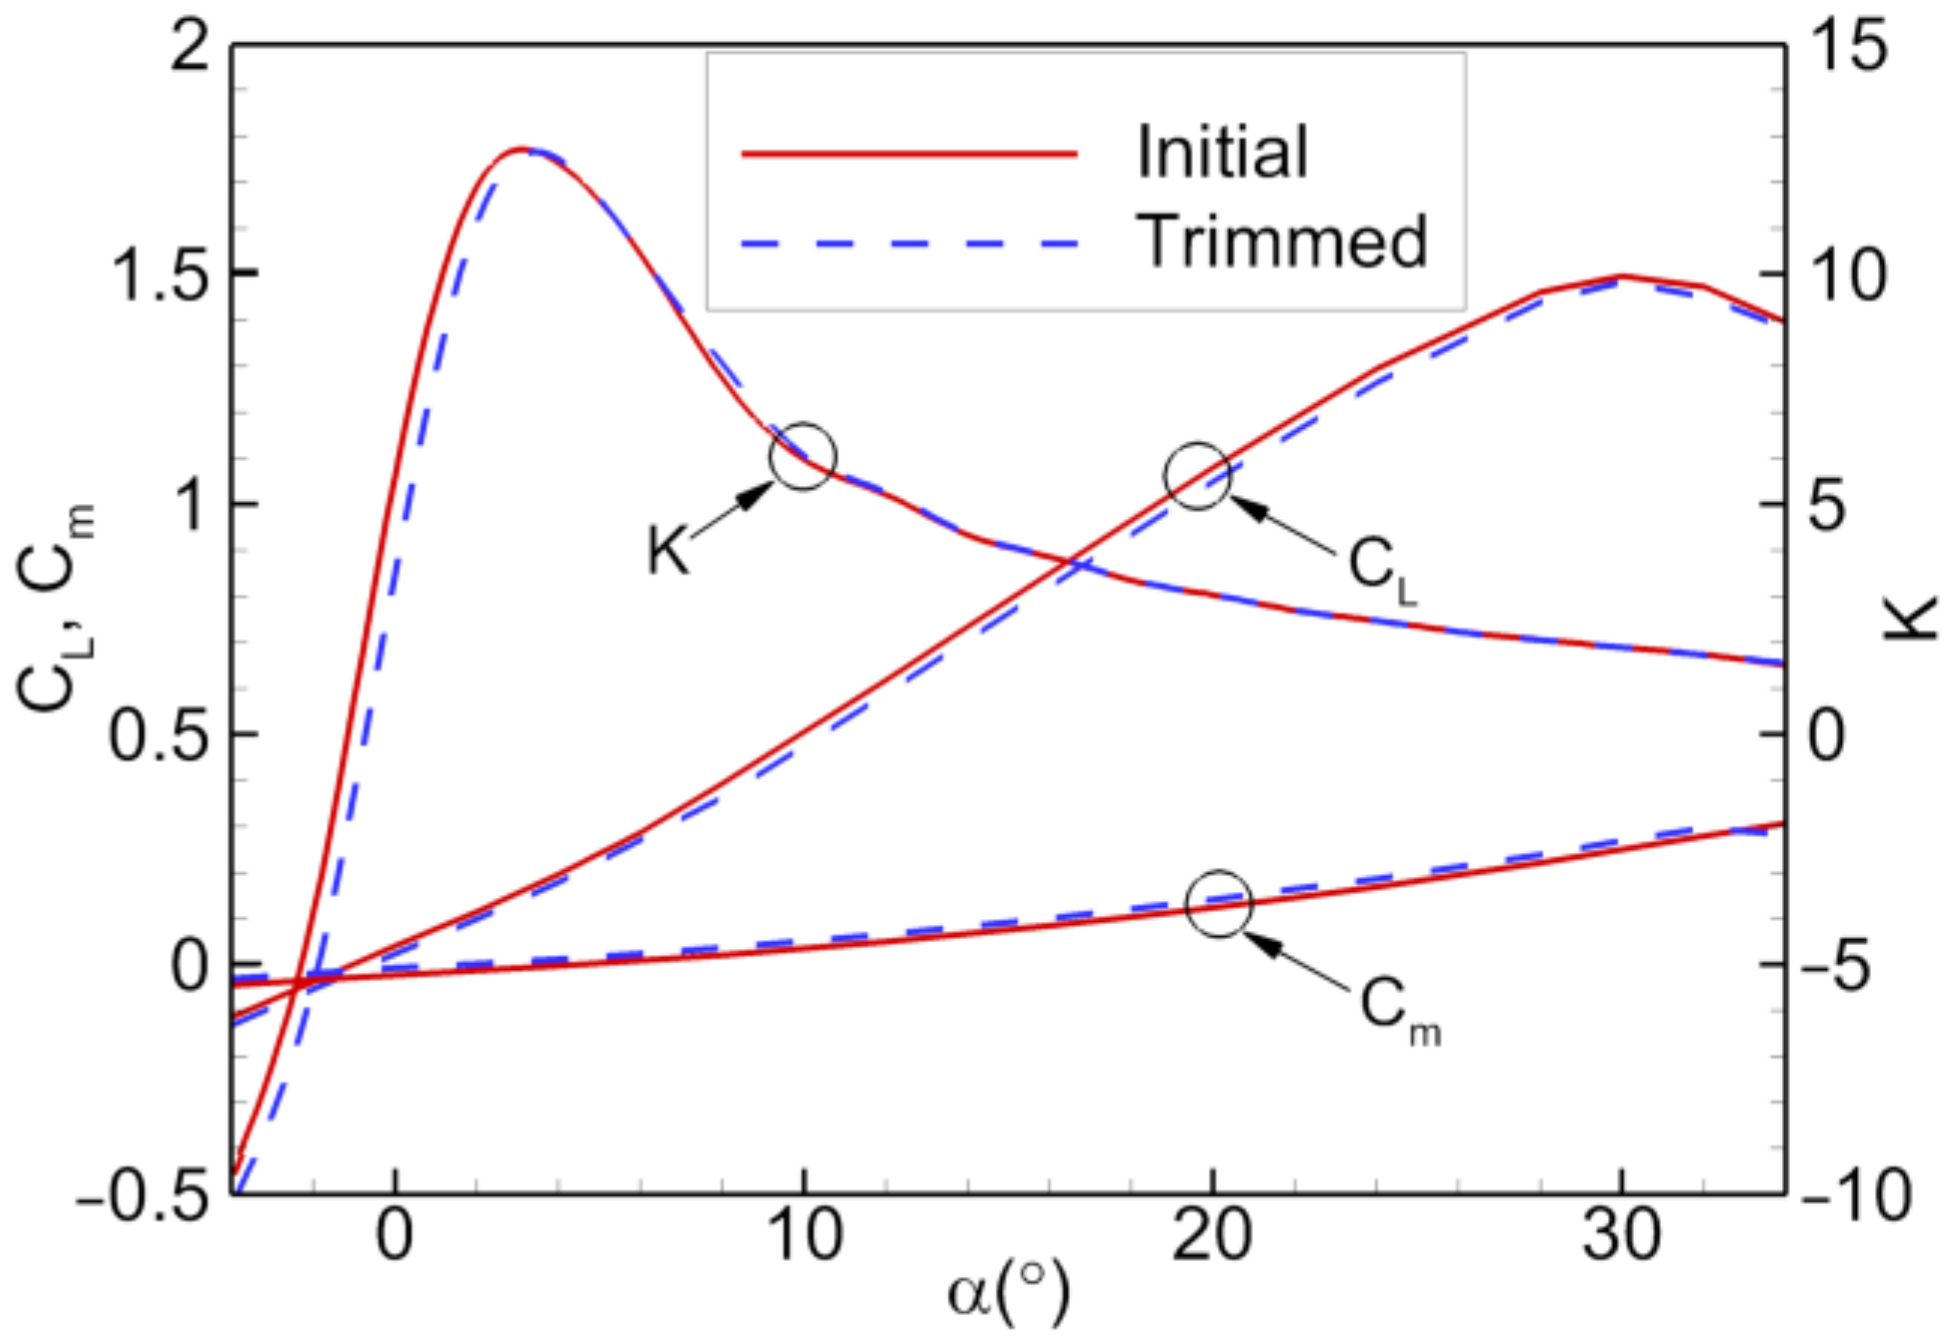
Figure 31 shows the aerodynamic characteristics of the initial and trimmed configuration at the cruising altitude and speed (H = 11 km, Ma = 0.85). As shown, the lift of the trimmed design configurations is reduced. Besides, the lift-to-drag ratio decreases at low angles of attack, while the maximum lift-to-drag ratio of the trimmed configuration is above 11, which satisfies the design requirement for cruising. When the cruise design lift coefficient is 0.141, the pitching moment coefficients of the trimmed design configuration are approximately zero, while the lift-to-drag ratio is close to the maximum lift-to-drag ratio of the initial configuration. Essentially, the coincidence of zero pitching moment, cruising design lift coefficient, and maximum lift-to-drag ratio are realized, which means that the obtained configuration is trimmed at cruise. Because the initial configuration is not trimmed at cruise, the lift-to-drag ratio of the initial configuration at cruise will reduce due to the extra trimmed drag. Therefore, the trimmed configuration owns higher available lift-to-drag ratio at curise.
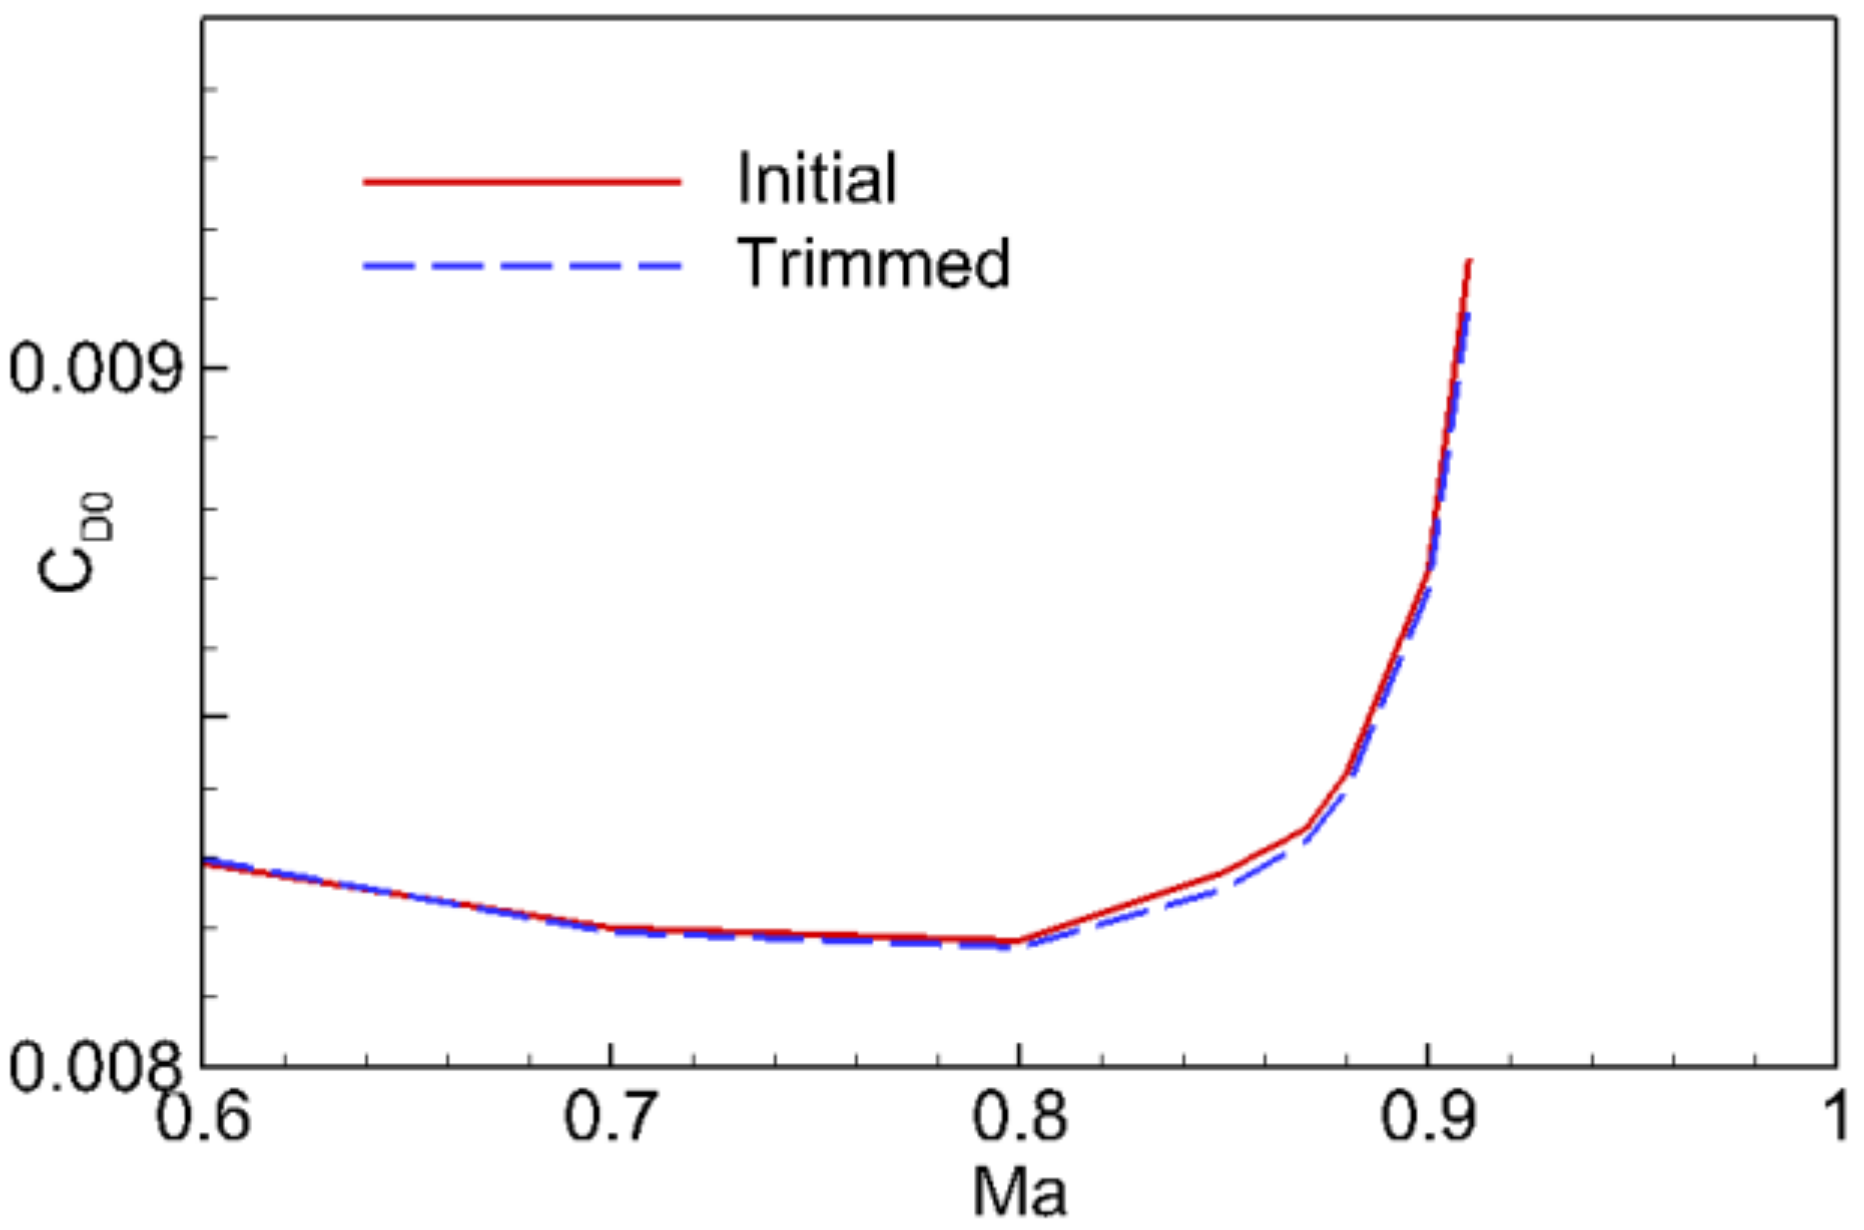
Figure 32 illustrates the drag divergence characteristics of the initial and trimmed configurations at the cruising altitude. The diverging Mach number of the Trimmed, and initial configuration are around 0.9. In addition, the divergence characteristics of Trimmed is better than that of the initial configuration.
Figure 33 illustrates the relationship between the zero-lift moment and Mach number. The zero-lift moment of the trimmed configurations is much less than that of the initial one, and the zero-lift moments of the configurations increase nonlinearly after the Mach number increasing to the critical state.

4.5.2. Low-Speed State and Maneuvering State

A low-speed aerodynamic performance analysis is conducted for the initial and trimmed configurations, at H = 0 km and Ma = 0.2, as shown in Figure 34. The lift of the trimmed configuration is less than that of the initial configuration, while the pitching moment of the trimmed configuration is bigger. The differences of CL and Cm between two configurations are small values. It is found that the stall angle of attack is around 30°, where the lift changes slowly. Therefore, the stall characteristic of the configurations at low speed is favourable. Besides, the linear segment of pitching moment curve keeps a wide range, which indicates the configurations obtains good pitching moment performance at low speed.
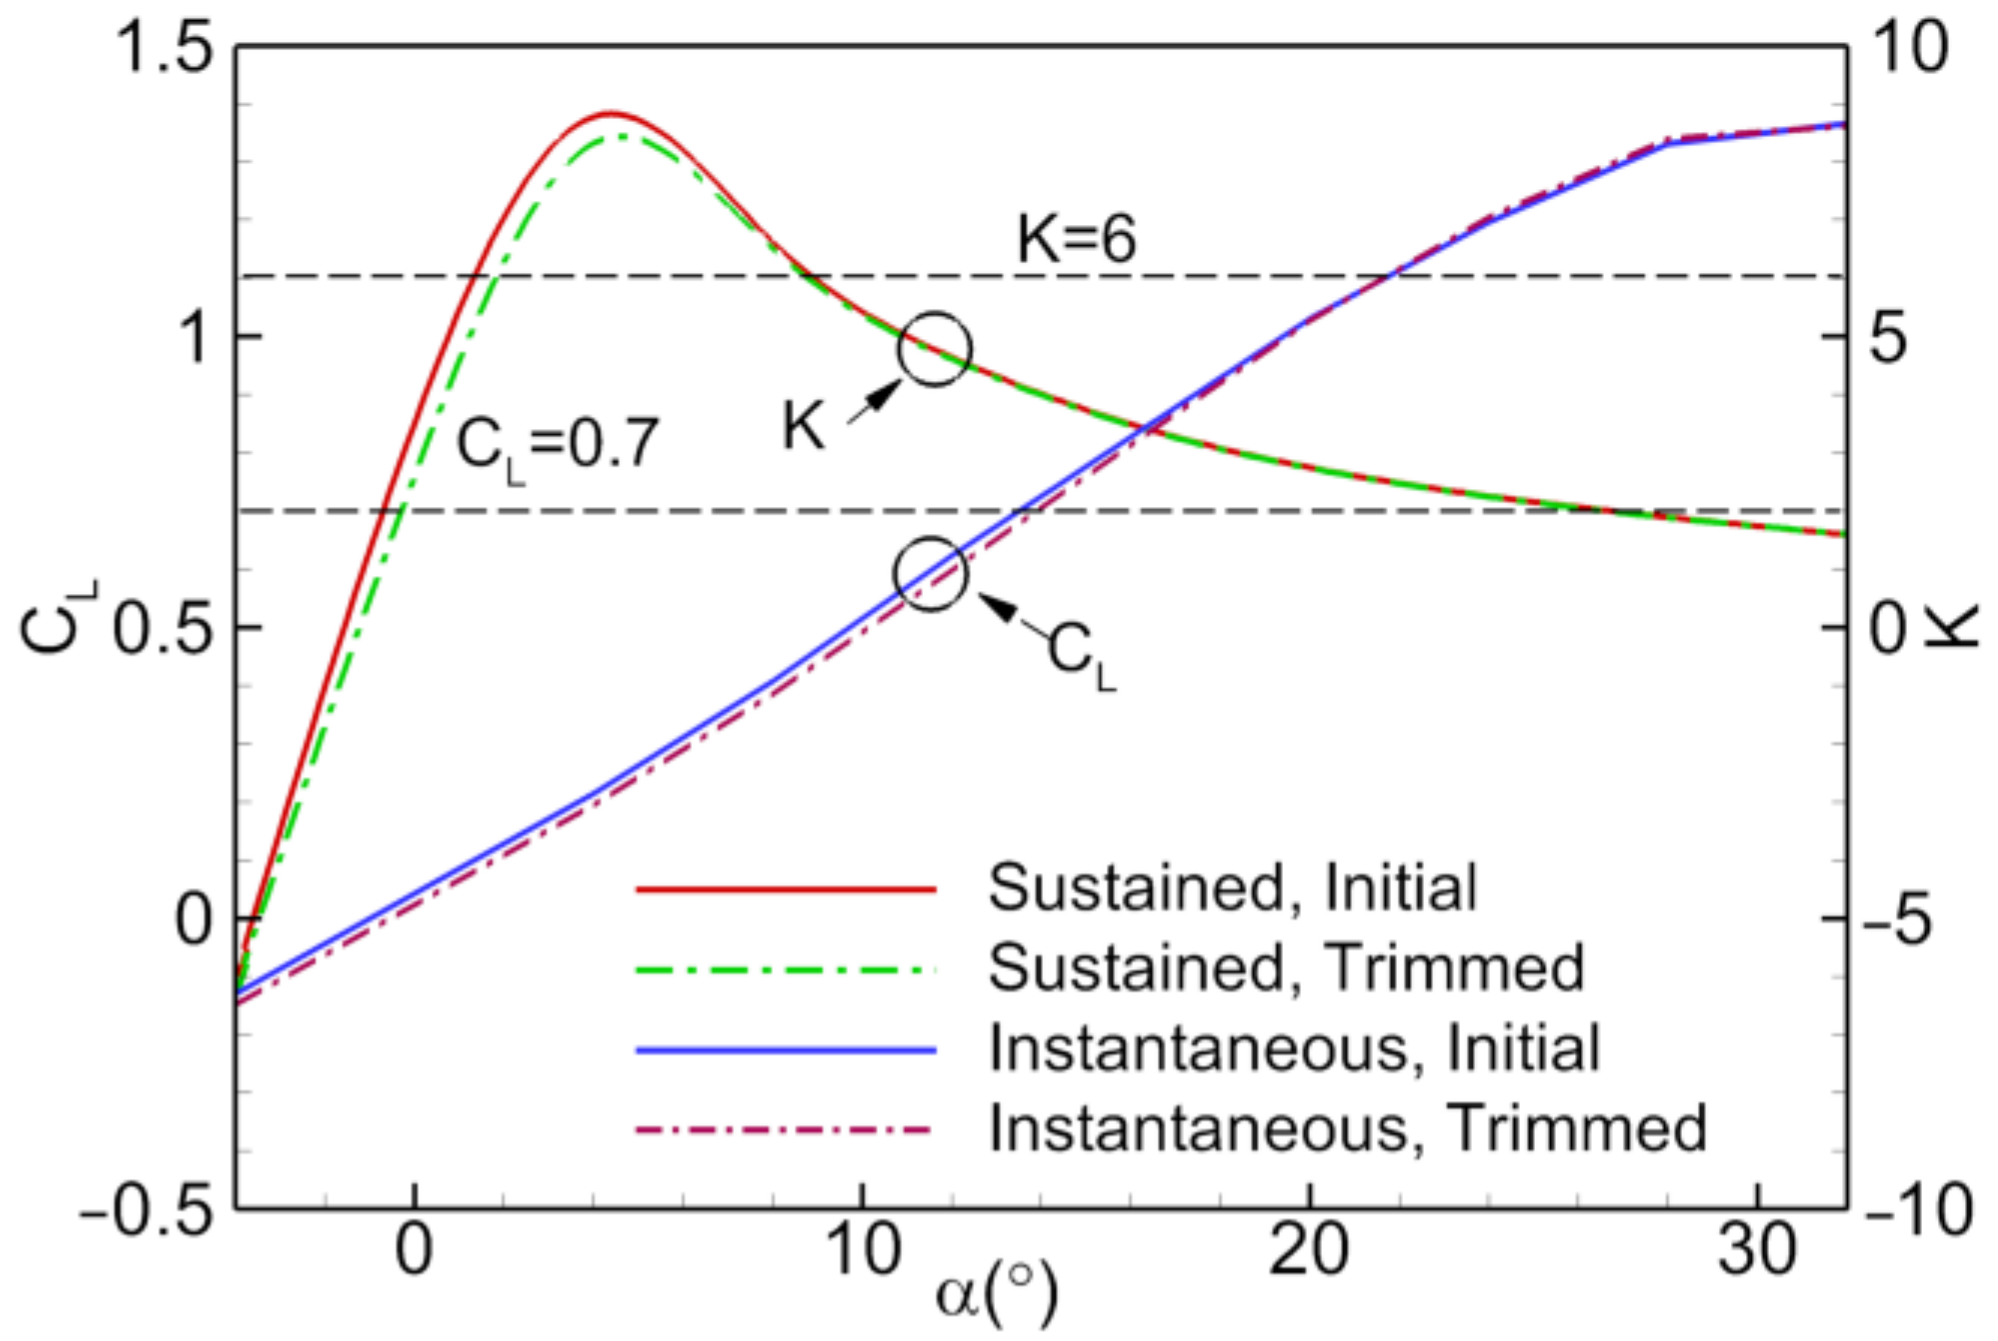
Moreover, aerodynamic performance requirement of the aircraft for maneuvering state were carried out according to mission requirements: the lift-to-drag ratio should be above 6 for the sustained turn state (H = 5 km, Ma = 0.9), while the lift coefficient should be no less than 0.7 for instantaneous turn state (H = 5 km, Ma = 0.6). As shown in Figure 35, the CFD results prove that the initial and trimmed configurations could afford the requirement for maneuvering state.

4.5.3. Wind Tunnel Experiment of Trimmed Configuration

To verify the trimmed configurations, the trimmed configuration is subjected to a wind tunnel experiment. The experiment is carried out in a direct blowdown transonic wind tunnel with a test section of 0.6 m × 0.6 m and a test length of 2.5 m. The accuracies of wind tunnel test in transonic condition are Ma 0.003 , α     0.02 . The experimental conditions are Re = 7.1 × 10⁶ and Ma = 0.85. Numerical simulations are also carried out at these conditions. Besides, the wind tunnel test model is made of all steel, the scale of the model is 1:95, and the test model is installed on the wind tunnel by means of rear sting support. Geometric modification is arranged at the rear of the test model because of the rear sting support. Six-component strain balance is used in the force measuring system. The comparison of the results of the wind tunnel experiment and the numerical simulation are depicted in Figure 36.
As shown in Figure 36, the lift and drag at small and medium angles of attack are in good agreement with the wind tunnel test results. However, at high angles of attack, the lift and drag of the wind tunnel and the numerical simulation results differ. This can be attributed to the model differences. The difference between the calculated and experimental values of the pitching moment could be due to the rear sting support of the wind tunnel experiment. In comparison with the experimental results, the CFD results obtained from the numerical simulation are sufficiently accurate.

5. Conclusions

The high-speed aerodynamic design of a low-aspect-ratio tailless configuration should be focused on improving not only lift-to-drag ratio, but also the longitudinal moment characteristics. Therefore, the aerodynamic design method aim to this issue is developed herein, the obtained conclusions are as follow:
  • By defining trimming efficiency factors, the effects of twisting wing and designing the key section airfoils on the aerodynamic performance of the low-aspect-ratio tailless configuration are analyzed and quantified. It is found that twisting the wing clockwise, fore-loading or aft-reflexing the key section airfoils will improve the longitudinal moment characteristic. Aft-reflexing is more efficient than fore-loading at tip and kink airfoils. However, twisting the wing clockwise will have obvious adverse influence on the lift-to-drag ratio.
  • Based on the study, the design and collocation methods of key section airfoils for the low-aspect-ratio tailless configuration can be obtained. With the constraints of geometry, the airfoil at symmetrical plane should adopt aft-reflexing design on the upper surface, fore-loading and aft-reflexing design on the lower surface with the front of the upper surface unchanged. While the airfoils at wing sections should use fore-loading and aft-reflexing design. The magnitudes of fore-loading and aft-reflexing at each section airfoil can be achieved based on the method herein.
  • According to the CFD and wind tunnel results, the configuration designed by the method is trimmed and nearly achieves the maximum lift-to-drag ratio at cruise, which is in accordance with the principle for tailless configuration. In comparison with the initial one, the trimmed configuration obtains lower zero-lift pitching moment, higher available lift-to-drag ratio, and better drag divergence characteristics with the constraints of fixed planform parameters and loading space. In addition, the trimmed configuration shows good performance at medium-altitude maneuvering condition, low speed state.
The study of this paper can provide a method to longitudinal trimming a low-aspect-ratio tailless configuration. However, yaw control is another difficult key issue for the low-aspect-ratio tailless configuration. Our future research will focus on combination mode of traditional control surfaces, such as elevon, spoiler-slat-deflector, and all-moving/bendable wing tip, to settle the yaw control and reduce coupling roll moment. Besides, the jet circulation control on the low-aspect-ratio tailless configuration will also be studied in the future.

Author Contributions

Conceptualization, B.Z., Z.L., and L.L.; methodology, Z.L.; software, Z.L.; validation, L.L.; investigation, L.L., and Z.L.; writing—original draft preparation, Z.L.; writing—review and editing, Z.L.; visualization, L.L., and Z.L.; supervision, B.Z.; funding acquisition, B.Z. All authors have read and agreed to the published version of the manuscript.

Funding

This research was supported by the Fundamental Research Funds for the Central Universities (Nos. 3102019JC009).

Institutional Review Board Statement

Not applicable.

Informed Consent Statement

Not applicable.

Data Availability Statement

The data presented in this study are available on request from the corresponding author.

Conflicts of Interest

The authors declare no conflict of interest.

References

  1. Küchemann, D. The Aerodynamic Design of Aircraft; AIAA: Reston, VA, USA, 2012; pp. 23–55. [Google Scholar]
  2. Chen, Z.L.; Zhang, M.H.; Chen, Y.C.; Sang, W.M.; Tan, Z.G.; Li, D.; Zhang, B.Q. Assessment on critical technologies for conceptual design of blended-wing-body civil aircraft. Chin. J. Aeronaut. 2019, 32, 1797–1827. [Google Scholar] [CrossRef]
  3. Liebeck, R.H. Design of the Blended Wing Body Subsonic Transport. J. Aircr. 2004, 41, 10–25. [Google Scholar] [CrossRef] [Green Version]
  4. Raymer, D.P. Aircraft Design: A Conceptual Approach; AIAA: Reston, VA, USA, 2006; pp. 661–666. [Google Scholar]
  5. Zhang, M.; Rizzi, A.; Meng, P.; Nangia, R.; Amiree, R.; Amoignon, O. Aerodynamic Design Considerations and Shape Optimization of Flying Wing in transonic Flight. In Proceedings of the 12th AIAA Aviation Technology, Integration and Operations (ATIO) Conference and 14th AIAA/ISSM, Indianapolis, IN, USA, 17–19 September 2012. [Google Scholar] [CrossRef] [Green Version]
  6. Roman, D.; Alien, J.B.; Liebeck, R.H. Aerodynamic Design Challenges of the Blended-Wing-Body Subsonic Transport. In Proceedings of the 18th Applied Aerodynamics Conference, Reston, VA, USA, 14–17 August 2000; pp. 618–627. [Google Scholar] [CrossRef]
  7. Sargeant, M.A.; Hynes, T.P.; Graham, W.R. Stability of hybrid-wing-body-type aircraft with centerbody leading-edge carving. J. Aircr. 2010, 47, 970–974. [Google Scholar] [CrossRef] [Green Version]
  8. Li, P.F.; Zhang, B.Q.; Chen, Y.C.; Yuan, C.S.; Lin, Y. Aerodynamic design methodology for blended wing body transport. Chin. J. Aeronaut. 2012, 25, 508–516. [Google Scholar] [CrossRef] [Green Version]
  9. Zhang, M.H.; Chen, Z.L.; Zhang, B.Q. A Conceptual Design Platform for Blended Wing-Body Transports. In Proceedings of the 30th Congress of the International Council of the Aeronautical Science (ICAS), Daejon, Korea, 25–30 September 2016. [Google Scholar]
  10. Sang, J.H. Low-Observable Technologies of Aircraft; Aviation Industry Press: Beijing, China, 2013. (In Chinese) [Google Scholar]
  11. Anwar-ul-Haque; Khawar, J.; Raza, S.H. Influence of Turbulence Modeling in Capturing Separated Flow Over Delta Wing at Subsonic Speed. Eng. Appl. Comp. Fluid. 2008, 2, 252–263. [Google Scholar] [CrossRef]
  12. Luckring, J.M.; Hummel, D. What Was Learned from The New VFE-2 Experiments? In Proceedings of the 46th AIAA Aerospace Sciences Meeting and Exhibit, Reno, NV, USA, 7–10 January 2008. [Google Scholar] [CrossRef] [Green Version]
  13. Verhaagen, N.G.; Jenkins, L.N.; Kern, S.B.; Washburn, A.E. A Study of the Vortex Flow over 76/40-deg Double-Delta Wing. In Proceedings of the 33rd AIAA Aerospace Sciences Meeting and Exhibit, Hampton, VA, USA, 9–12 January 1995. [Google Scholar]
  14. Hummel, D.J. The international vortex flow experiment 2 (VFE-2): Background, objectives and organization. Aerosp. Sci. Technol. 2013, 24, 1–9. [Google Scholar] [CrossRef]
  15. Konrath, R.; Klein, C.; Schroder, A. PSP and PIV investigation on the VFE-2 configuration in sub- and transonic flow. Aerosp. Sci. Technol. 2013, 24, 22–31. [Google Scholar] [CrossRef]
  16. Schiavetta, L.A.; Boelens, O.J.; Fritz, W. Shock effect on delta wing vortex break down. J. Aircr. 2009, 46, 903–914. [Google Scholar] [CrossRef] [Green Version]
  17. Shan, J.X.; Huang, Y.; Zhang, X. Effect of nose thickness distribution on the stall characteristics of low aspect ratio flying wing configuration at transonic flow. Sci. Sin. Tech. 2016, 47, 985–991. (In Chinese) [Google Scholar] [CrossRef]
  18. Joshua, K.; David, M. Computational study of a complex three-dimensional shock boundary-layer interaction. Eng. Appl. Comp. Fluid. 2015, 9, 259–279. [Google Scholar] [CrossRef] [Green Version]
  19. Jamson, A.; Schmidt, W.; Turkel, E. Numerical solutions of the Euler equations by finite volume methods using Runge-Kutta time-stepping schemes. In Proceedings of the 14th Fluid and Plasma Dynamics Conference, Palo Alto, CA, USA, 23–25 June 1981. [Google Scholar] [CrossRef] [Green Version]
  20. ANSYS. ANSYS User Manual CFX-Solver Theory Guide; ANSYS: Canonsburg, PA, USA, 2012. [Google Scholar]
  21. Menter, F.R. Two-Equation Eddy-Viscosity Turbulence Models for Engineering Applications. AIAA J. 1994, 32, 1598–1605. [Google Scholar] [CrossRef] [Green Version]
  22. Niu, J.Q.; Wang, Y.M.; Wu, D.; Liu, F. Comparison of different configurations of aerodynamic braking plate on the flow around a high-speed train. Eng. Appl. Comp. Fluid. 2020, 14, 655–668. [Google Scholar] [CrossRef]
  23. Salih, S.Q.; Aldlemy, M.S.; Rasani, M.R.; Ariffin, A.K.; Yusoff Shah Tuan Ya, T.M.; Nadhir, A.A.; Yaseen, Z.M.; Chau, K.W. Thin and sharp edges bodies-fluid interaction simulation using cut-cell immersed boundary method. Eng. Appl. Comp. Fluid. 2019, 13, 860–877. [Google Scholar] [CrossRef] [Green Version]
  24. Evert, G.M. Low Speed Straked Delta Wing; RTO-TR-026-18E; NATO: Washington, DC, USA, 2000; pp. 437–452. [Google Scholar]
  25. Chu, J.; Luckring, J.M. Experimental Surface Pressure Data Obtained on a 65° Delta Wing across Reynolds Number and Mach Number Ranges: Volume 1-Sharp Leading Edge; NASA-TM- 4645; NASA Langley Research Center: Hampton, VA, USA, 1996. [Google Scholar]
  26. Schiavetta, L.A.; Boelens, O.J.; Fritz, W. Analysis of transonic flow on a slender delta wing using CFD. In Proceedings of the 24th Applied Aerodynamics Conference, San Francisco, CA, USA, 5–8 June 2006. [Google Scholar]
  27. Sha, Z.P. Aircraft Design Manual Volume 4: Conceptual Design of Military Aircraft; Aviation Industry Press: Beijing, China, 2005; pp. 15–31. (In Chinese) [Google Scholar]
  28. Eduardo, S.; Howard, S. Conceptual design of a fifth generation unmanned strike fighter. In Proceedings of the AIAA Scitech 2019 Forum, San Diego, CA, USA, 7–11 January 2019. [Google Scholar] [CrossRef] [Green Version]
  29. Yi, P.H.; Wang, Y.; Sun, X.J.; Huang, D.J.; Zheng, Z.Q. The effect of variations in first- and second-order derivatives on airfoil aerodynamic performance. Eng. Appl. Comp. Fluid. 2017, 11, 54–68. [Google Scholar] [CrossRef] [Green Version]
Figure 1. LSSDW model.
Applsci 11 01555 g001
Figure 2. The grid topology of LSSDW: (a) Volume grid; (b) Surface grid of LSSDW.
Applsci 11 01555 g002
Figure 3. Pressure coefficients comparisons of the experiment [24] and numerical calculation on the upper surface of LSSDW at typical sections for Ma = 0.225, Re = 3.7 × 10⁶: (a) Section 1; (b) Section 2; (c) Section 3; (d) Section 4.
Applsci 11 01555 g003
Figure 4. Delta wing model.
Applsci 11 01555 g004
Figure 5. The grid of delta wing. (a) Volume grid; (b) Surface grid.
Applsci 11 01555 g005
Figure 6. Pressure comparisons of the experiment [25] and CFD calculation on the upper surface of the delta wing at typical sections for Ma = 0.85, Re = 6 × 10⁶. (a) α   =   18.5 ° ; (b) α   =   23 ° .
Applsci 11 01555 g006
Figure 7. Pressure coefficients distribution contours by CFD herein on the upper surface of delta wing, Ma = 0.85, Re = 6 × 10⁶.
Applsci 11 01555 g007
Figure 9. The grid of the model. (a) Grid topology. (b) Mesh around the model.
Applsci 11 01555 g009
Figure 10. (a) Planform and typical sections locations; (b) Geometrical shapes of typical section airfoils.
Applsci 11 01555 g010
Figure 11. Aerodynamic characteristic of each component and the initial configuration, Ma = 0.85, H = 11 km, α   =   2 ° ~ 8 ° , α   =   2 ° . (a) Lift coefficient; (b) Drag coefficient; (c) Pitching moment coefficient; (d) Aerodynamic characteristic of the initial configuration.
Applsci 11 01555 g011
Figure 12. Wing twist: (a) Wing twist method; (b) Twist distribution in spanwise direction.
Applsci 11 01555 g012
Figure 13. Aerodynamic characteristic of the configurations with different twist angles. Ma = 0.85, H = 11 km, α   =   2 ° ~ 8 ° , α   =   2 ° . (a) Lift coefficient, lift to drag ratio; (b) Pitching moment.
Applsci 11 01555 g013
Figure 14. The increments of Cm,c and K obtained by twisting the wing at cruise state.(a) Pitching moment coefficient; (b) Lift-to-drag ratio.
Applsci 11 01555 g014
Figure 15. The positions and pressure coefficient distributions at typical sections of the different twisted configurations. Ma = 0.85, α = 2°.
Applsci 11 01555 g015
Figure 16. The fore-loading modification of kink airfoil. (a) Airfoils comparison; (b) Different camber increments.
Applsci 11 01555 g016
Figure 17. Aerodynamic characteristic of the configurations with different fore-loading kink airfoils. Ma = 0.85, H = 11 km, α   =   2 ° ~ 8 ° , α   =   2 ° . (a) Lift coefficient, lift to drag ratio; (b) Pitching moment.
Applsci 11 01555 g017
Figure 18. The increments of Cm,c and K obtained by fore-loading the kink airfoil at cruise state. (a) Pitching moment coefficient; (b) Lift-to-drag ratio.
Applsci 11 01555 g018
Figure 19. The positions and pressure coefficient distributions at typical sections of the different fore-loaded configurations. Ma = 0.85, α = 2°.
Applsci 11 01555 g019
Figure 20. The aft-reflexing modification of kink airfoil. (a) Airfoils comparison; (b) Different camber increments.
Applsci 11 01555 g020
Figure 21. Aerodynamic characteristic of the configurations with different aft-reflexing kink airfoils. Ma = 0.85, H = 11 km, α   =   2 ° ~ 8 ° ,   α   =   2 ° . (a) Lift coefficient, lift to drag ratio; (b) Pitching moment.
Applsci 11 01555 g021
Figure 22. The increments of Cm,c and K obtained by aft-reflexing the kink airfoil at cruise state. (a) Pitching moment coefficient; (b) Lift-to-drag ratio.
Applsci 11 01555 g022
Figure 23. Pressure coefficient distributions at typical sections of the different aft-reflexed configurations. Ma = 0.85, α = 2°.
Applsci 11 01555 g023
Figure 24. Aerodynamic characteristic of the configurations with different fore-loading kink and tip airfoils. Ma = 0.85, H = 11 km, α   =   2 ° ~ 8 ° ,   α   =   2 ° . (a) Lift coefficient, lift to drag ratio; (b) Pitching moment.
Applsci 11 01555 g024
Figure 25. The increments of Cm,c and K obtained by fore-loading the kink and tip airfoils at cruise state. (a) Pitching moment coefficient; (b) Lift-to-drag ratio.
Applsci 11 01555 g025
Figure 26. Aerodynamic characteristic of the configurations with different aft-reflexing kink and tip airfoils. Ma = 0.85, H = 11 km, α   =   2 ° ~ 8 ° ,   α   =   2 ° . (a) Lift coefficient, lift to drag ratio; (b) pitching moment.
Applsci 11 01555 g026
Figure 27. The increments of Cm,c and K obtained by aft-reflexing the kink and tip airfoils at cruise state. (a) Pitching moment coefficient; (b) Lift-to-drag ratio.
Applsci 11 01555 g027
Figure 28. The fore-loading and aft-reflexing modification of symmetrical plane airfoil. (a) Airfoils comparison. (b) Camber increments distributions.
Applsci 11 01555 g028
Figure 29. Aerodynamic characteristic of the configurations with different symmetrical plane airfoils. Ma = 0.85, H = 11 km, α   =   2 ° ~ 8 ° , α   =   2 ° . (a) Lift coefficient, lift to drag ratio; (b) pitching moment.
Applsci 11 01555 g029
Figure 30. The difference between the initial and the trimmed configuration.
Applsci 11 01555 g030
Figure 31. Aerodynamic characteristic of the initial and trimmed configurations. Ma = 0.85, H = 11 km, α   =   2 ° ~ 32 ° ,   α   =   2 ° .
Applsci 11 01555 g031
Figure 32. The drag divergence characteristics of the initial and the trimmed configuration.
Applsci 11 01555 g032
Figure 33. The zero-lift pitching moment comparison of the initial and the trimmed configuration.
Applsci 11 01555 g033
Figure 34. Aerodynamic characteristic of the trimmed configurations at low-speed state. Ma = 0.2, H = 0 km, α   =   4 ° ~ 34 ° ,   α   =   2 ° .
Applsci 11 01555 g034
Figure 35. Aerodynamic characteristic of the trimmed configurations at maneuvering state. Sustained turn state: H = 5 km, Ma = 0.9; Instantaneous turn state: H = 5 km, Ma = 0.6.   α   = 4 ° ~ 32 ° ,   α   =   4 ° .
Applsci 11 01555 g035
Figure 36. Comparison of the wind tunnel and numerical results on the trimmed configuration. Ma = 0.85, Re = 7.1 × 10⁶, α   =   2 ° ~ 14 ° , α   =   2 ° . (a) Lift coefficient; (b) Drag coefficient; (c) Lift to drag ratio; (d) Pitching moment.
Applsci 11 01555 g036
Table 1. Computing states of LSSDW.
MaReαDescription
0.2253.7 × 10610.033°strake/wing vortexes develop independently
0.2253.7 × 10622.495°vortexes interact; trailing edge vortex breakdown
Table 2. Forces results of Exp and CFD.
StatesMethodCN CN% CT CT% Cm Cm%
10.033°Calculation0.5027−0.06%−0.0045−12.50%0.0315−4.26%
EXP0.50300−0.004000.03290
22.495°Calculation1.16040.70%−0.01895.50%0.0880−5.22%
EXP1.15230−0.020000.09230
Table 3. Computing states of delta wing.
MaReαDescription
0.856 × 10618.5°Pre-breakdown case
0.856 × 10623°Post-breakdown case
Table 4. Results of different grids.
Grid NameCell NumberCLCDCmSimulation Time (Hour)
Grid 11,064,9600.033200.00583−0.019991.08
Grid 22,075,0080.032960.00579−0.019922.08
Grid 34,013,0560.032590.00571−0.019724.07
Grid 48,160,8960.032560.00569−0.019688.90
Grid 515,883,6770.032550.00567−0.0196218.63
Table 5. The pitching moment of each component.
MomentWingFuselageTotal
Cm0−0.0075−0.0284−0.0359
Cm,c−0.0112−0.0066−0.0178
Table 6. The efficiency factor κ of fore-loading and aft-reflexing the kink airfoil.
Methodκ
fore-loading0.0067
aft-reflexing1.8
Table 7. The efficiency factor κ of fore-loading and aft-reflexing the tip airfoil.
Methodκ
fore-loading0.02
aft-reflexing1.00
Table 8. The pitching moment and lift-to-drag ratio of each configuration at cruise.
Case Cruise Angle Cm,cΔCm,c% K ΔK%
Initial2.26°−0.0178-11.52-
Sym-L&R12.21°−0.014419.1011.49−0.23
Sym-R&L22.28°−0.008851.1211.47−0.40
Publisher’s Note: MDPI stays neutral with regard to jurisdictional claims in published maps and institutional affiliations.