Article

Post-Annealing Effects on the Structure and Semiconductor Performance of Nanocrystalline ZnTe Thin Films Electrodeposited from an Aqueous Solution Containing Citric Acid

1
Graduate School of Engineering, Nagasaki University, 1-14 Bunkyo-machi, Nagasaki 852-8521, Japan
2
Faculty of Engineering, Nagasaki University, 1-14 Bunkyo-machi, Nagasaki 852-8521, Japan
*
Author to whom correspondence should be addressed.
Appl. Sci. 2021, 11(22), 10632; https://doi.org/10.3390/app112210632
Submission received: 29 September 2021 / Revised: 23 October 2021 / Accepted: 6 November 2021 / Published: 11 November 2021
(This article belongs to the Special Issue Nanoscale Assembly and Integration for Applications)

Abstract

:
Using the potentiostatic electrodeposition technique, zinc telluride nanocrystalline thin films and an array of nanowires were synthesized in a citric acid bath. Electrodeposited zinc telluride thin films with stoichiometric compositions were obtained at a cathode potential of approximately −0.8 V versus Ag/AgCl, which was in a more noble region compared with the equilibrium potential of zinc. The average thickness of the zinc telluride thin films was approximately 3 μm, and the average growth rate was approximately 3 nm s−1. The as-deposited zinc telluride thin films had an amorphous phase with a black tint. By contrast, the zinc telluride thin films annealed at 683 K had a crystalline phase with a reddish-brown tint. The electrodeposited single-phase zinc telluride exhibited an optical absorption performance in a wavelength region that was shorter than 559 nm. At the annealing temperature of 683 K, the zinc telluride films exhibited an energy band gap of 2.3 eV, which was almost identical to that of single-crystal zinc telluride. The resistivity of the as-deposited amorphous-like zinc telluride thin films was approximately 2 × 10⁵ Ω·m, whereas that of the samples annealed at 683 K was around 2 × 10³ Ω·m, which was smaller than that of single-crystal zinc telluride. A three-dimensional nanostructure constructed with the zinc telluride nanowire array was also demonstrated using a template synthesis technique.

1. Introduction

Zinc-based semiconductor crystals (zinc oxide, zinc sulfide, zinc selenide, etc.) have received considerable attention because the energy band gap level is suitable for developing a novel optical material. The energy band gap of zinc telluride is ca. 2.26 eV that equals to the spectrum range of around 550 nm in wavelength. Hence, zinc telluride crystals have a potential application in light emitting diodes and photovoltaic cells. It has been reported that the crystalline zinc telluride thin films were able to be synthesized using some crystal growing processes, such as vacuum evaporation [1,2], sputter deposition [3], CVD [4], and electrochemical growth from a non-aqueous solvent [5,6,7,8,9] and from an aqueous solution [10,11,12,13,14,15,16,17,18,19,20,21,22,23]. The electrochemical growing technique from an aqueous solvent has an excellent cost-performance in comparison to the other processes and it enables us to coat a conventional wide panel with a practically applicable surface appearance. Zinc and tellurium are known to be not so harmful in comparison to some elements, such as arsenic, cadmium, lead, and selenium. Kashyout et al. reported the electrodeposition of zinc telluride (ZnTe) thin films on FTO substrates from an acid chloride bath [12]. They revealed that the band gap and sheet resistance of the post-annealed samples increased by up to 2.31 eV and 815 kΩ/sq., respectively, by increasing the annealing temperature from 623 K to 672 K. Mahalingam et al. reported that ZnTe thin films can be prepared by using a potentiostatic electrodeposition technique from a simple sulfuric acid bath [15]. They found that the band gap of as-deposited ZnTe thin films was approximately 1.9 eV, while samples annealed at 623 K for 1 h exhibited 2.25 eV, which was in good agreement with the optical bandgap values of single-crystal ZnTe. Rakhshani et al. also reported the electrodeposition of ZnTe thin films on stainless steel sheets from a simple sulfuric acid bath [16]. They discovered that the band gap of as-deposited ZnTe thin films was 2.1–2.3 eV, and the resistivity was greater than 107 Ω·m, while samples annealed at 623 K for 15 min showed p-type conductivity. Skhouni et al. reported that ZnTe thin films could be electrodeposited on FTO substrates from an acid chloride bath [20]. They revealed that the band gap of as-deposited ZnTe thin films was approximately 2.19 eV, whereas samples annealed at 623 K for 20 min exhibited a smaller band gap value.
Thus, the post-annealing process improves the semiconductor performance of electrodeposited ZnTe films. However, the morphology of ZnTe films that are electrodeposited from simple acidic aqueous solutions, such as sulfuric acid or hydrochloric acid, exhibits a coarse nodule-like structure that is undesirable for opto-electronic devices. The coarse nodule-like structure seems to be induced by the preferential electrodeposition of tellurium, which is electrochemically more noble (positive direction) than zinc. To inhibit the preferential electrodeposition of tellurium, the addition of complexing agents, such as organic acids, may be effective. Bouroushian et al. reported that the morphology of ZnTe films electrodeposited from an aqueous solution containing citric acid exhibited a smooth and uniform surface appearance with fine crystals [23]. Hence, in this work, we studied the effect of the post-annealing process on the crystallization of ZnTe films and elucidated the semiconductive properties of films electrodeposited from a citric acid bath. Furthermore, a zinc telluride nanowire structure was also demonstrated using a template synthesis technique to confirm the uniform electrodeposition from the citric acid bath.

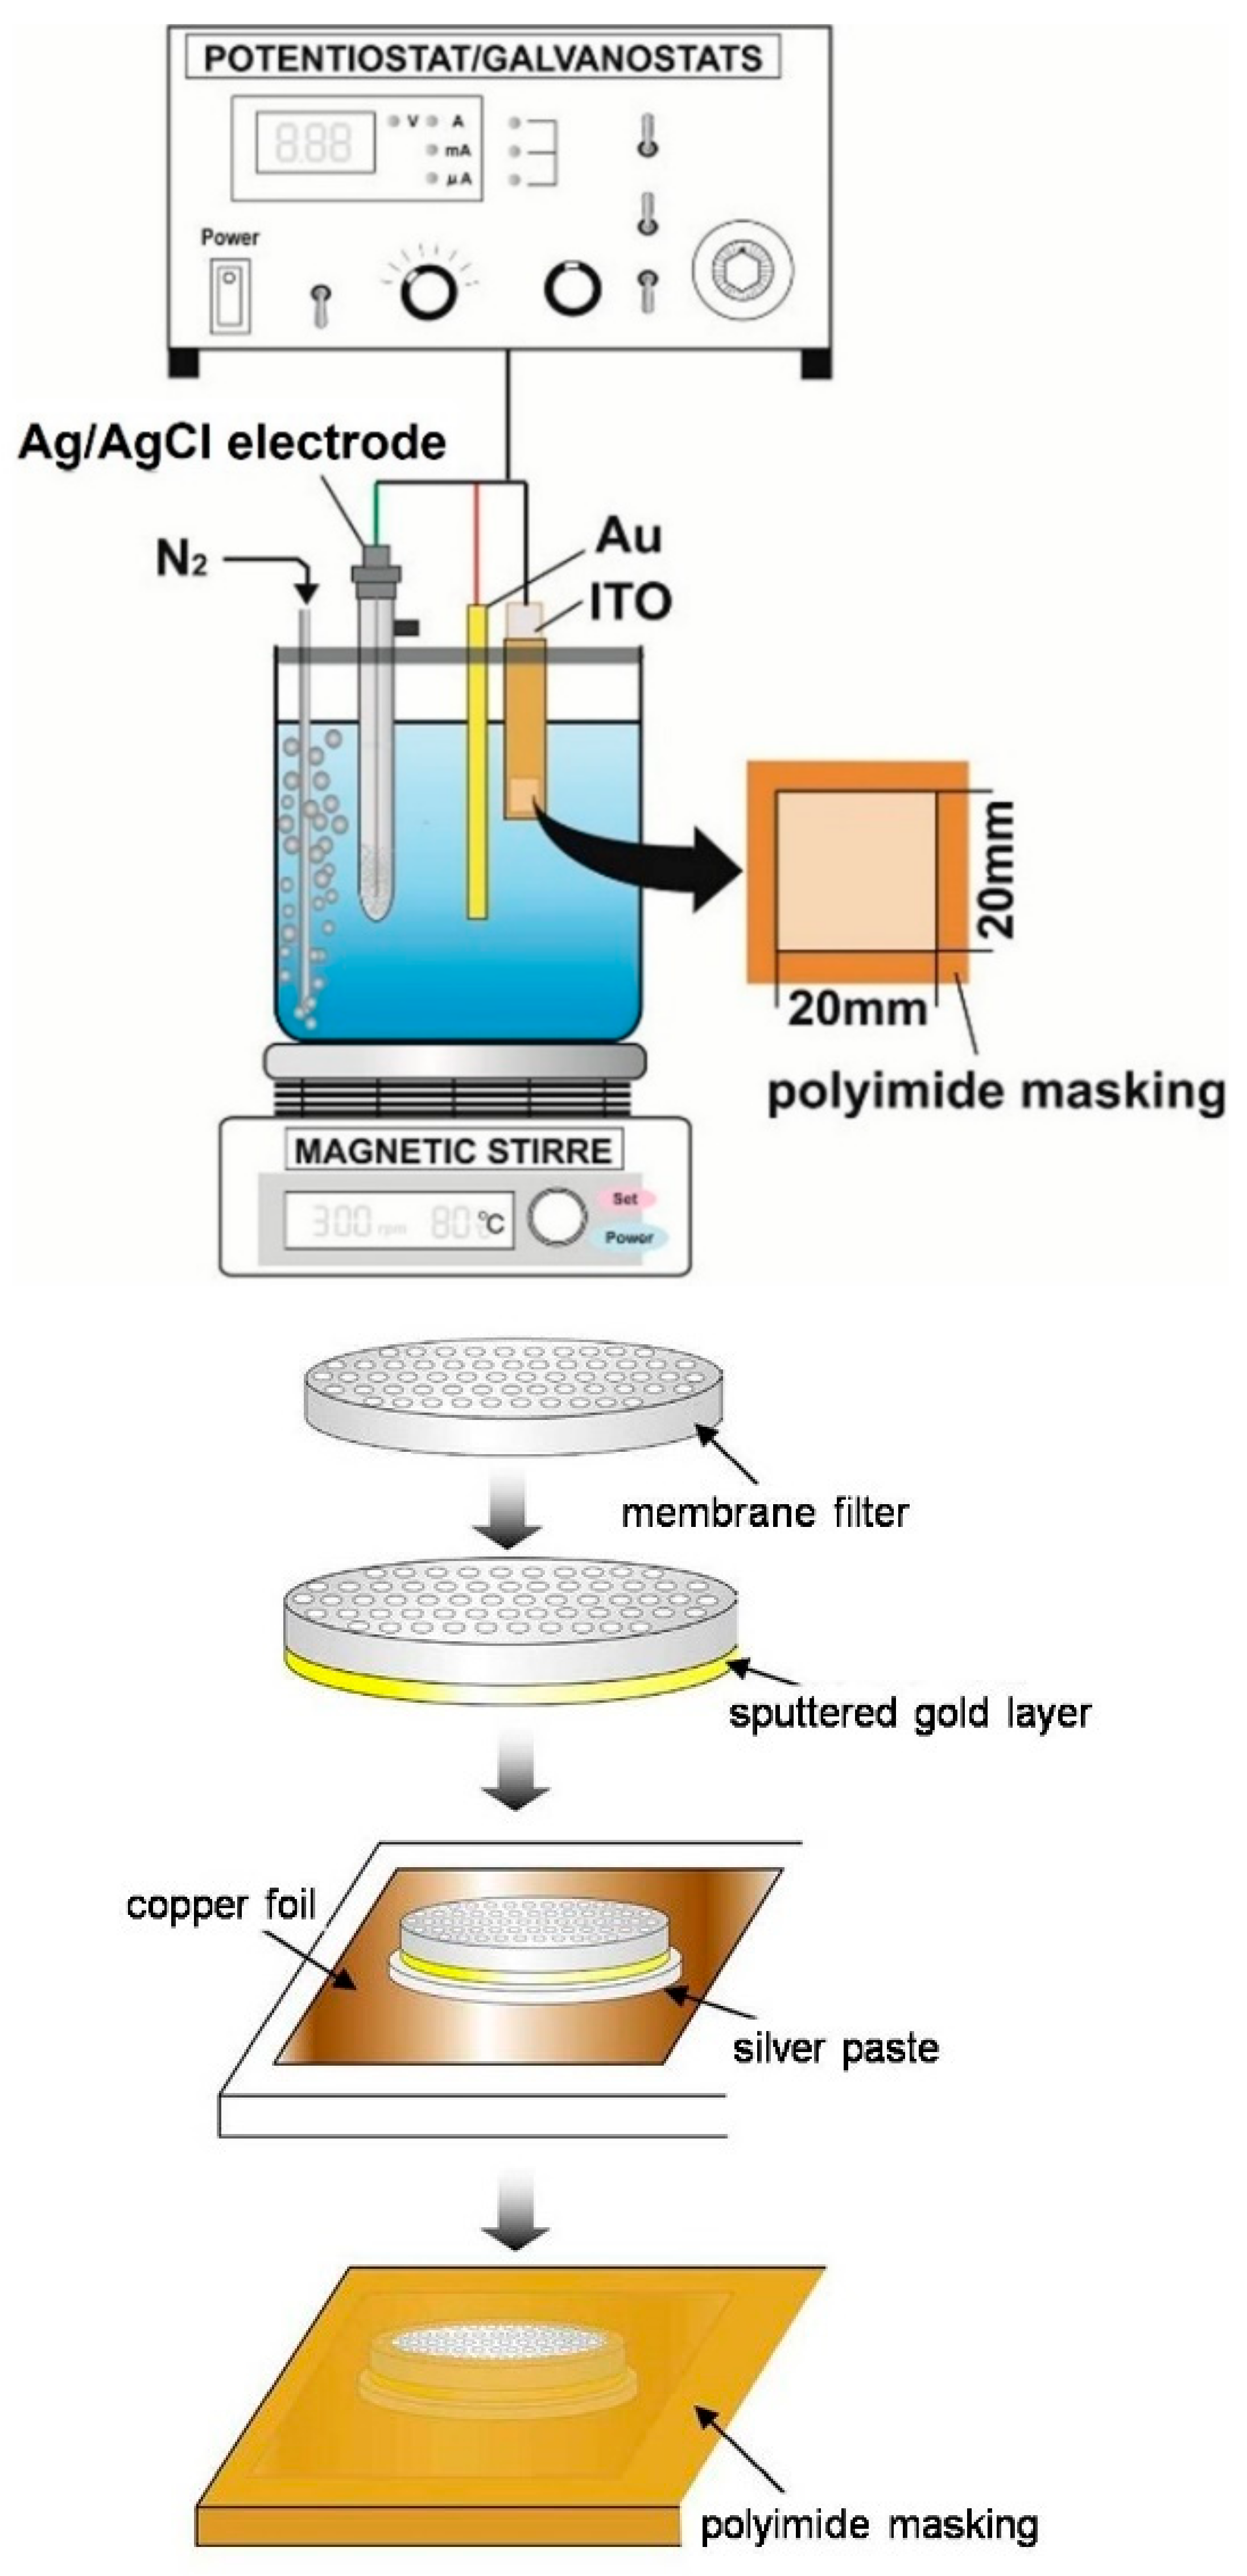
2. Materials and Methods

The electrolytic baths were prepared with ZnSO4·7H2O (0.1 M), TeO2 (0.002 M), Na2SO4 (0.5 M), citric acid (H3C6H5O7: 0.05 M), and sodium citrate (Na3C6H5O7·2H2O: 0.05 M). The pH of the baths was set to approximately 4.0 using H2SO4 and NaOH. The temperature of the baths was kept to 313 K, and a pure Au wire was applied as an anode electrode. A commercially available Ag/AgCl electrode was used as a reference electrode. Cathodic polarization curves were investigated using an automatic polarization system (HZ-5000, Hokuto Denko Corp., Tokyo, Japan) over a wide range (−0.4–−2.5 V) to determine the optimum cathode potential for electrodepositing zinc telluride thin films and nanowires. A glass plate coated with an ITO layer was utilized as a cathode electrode to grow the zinc telluride thin films (20 × 20 mm square, 3 μm in thickness). Ion-track etched polycarbonate nanochannel films (6 μm in pore-length, 100 nm in pore diameter, and 4 × 10⁸ pores/cm2 in pore density) and anodized aluminum oxide nanochannel films (60 μm in pore length, 200 nm in pore diameter, and 1010 pores/cm2 in pore density) with a sputter-deposited gold film were also used as cathodes for growing zinc telluride nanowires. To cover the nanochannels, a thick gold layer (250 nm) was formed on the surface of a nanochannel film using a DC magnetron sputter-deposition system (Auto Fine Coater, JFC-1600, JEOL Ltd., Tokyo, Japan). The atomic composition of the electrodeposited alloys was examined using an energy dispersive X-ray spectrometer (EDX, EDX-800HS, Shimadzu Corp., Kyoto, Japan). Under an argon gas atmosphere, the electrodeposited zinc telluride samples were annealed at 653–683 K. The constituent phase of the electrodeposited zinc telluride samples (20 × 20 mm square, 3 μm in thickness) on ITO was investigated by using an X-ray diffractometer (XRD, Rint-2200, Rigaku Corp., Tokyo, Japan). The surface morphology of the electrodeposited zinc telluride samples on ITO was examined using field-emission scanning electron microscopy (FE-SEM-EDS, JSM-7500FA, JEOL Ltd., Tokyo, Japan). The energy band gap of the electrodeposited zinc telluride samples (20 × 20 mm square, 3 μm in thickness) on ITO was determined using an ultraviolet and visible spectrophotometer (UV-VIS, V-630iRM, JASCO Corp., Tokyo, Japan). The resistivity of the zinc telluride samples (20 × 20 mm square, 3 μm in thickness) on ITO was investigated using a source meter (DC voltage current source monitor, ADCMT6240A, ADC Corp., Saitama, Japan).

3. Results and Discussion

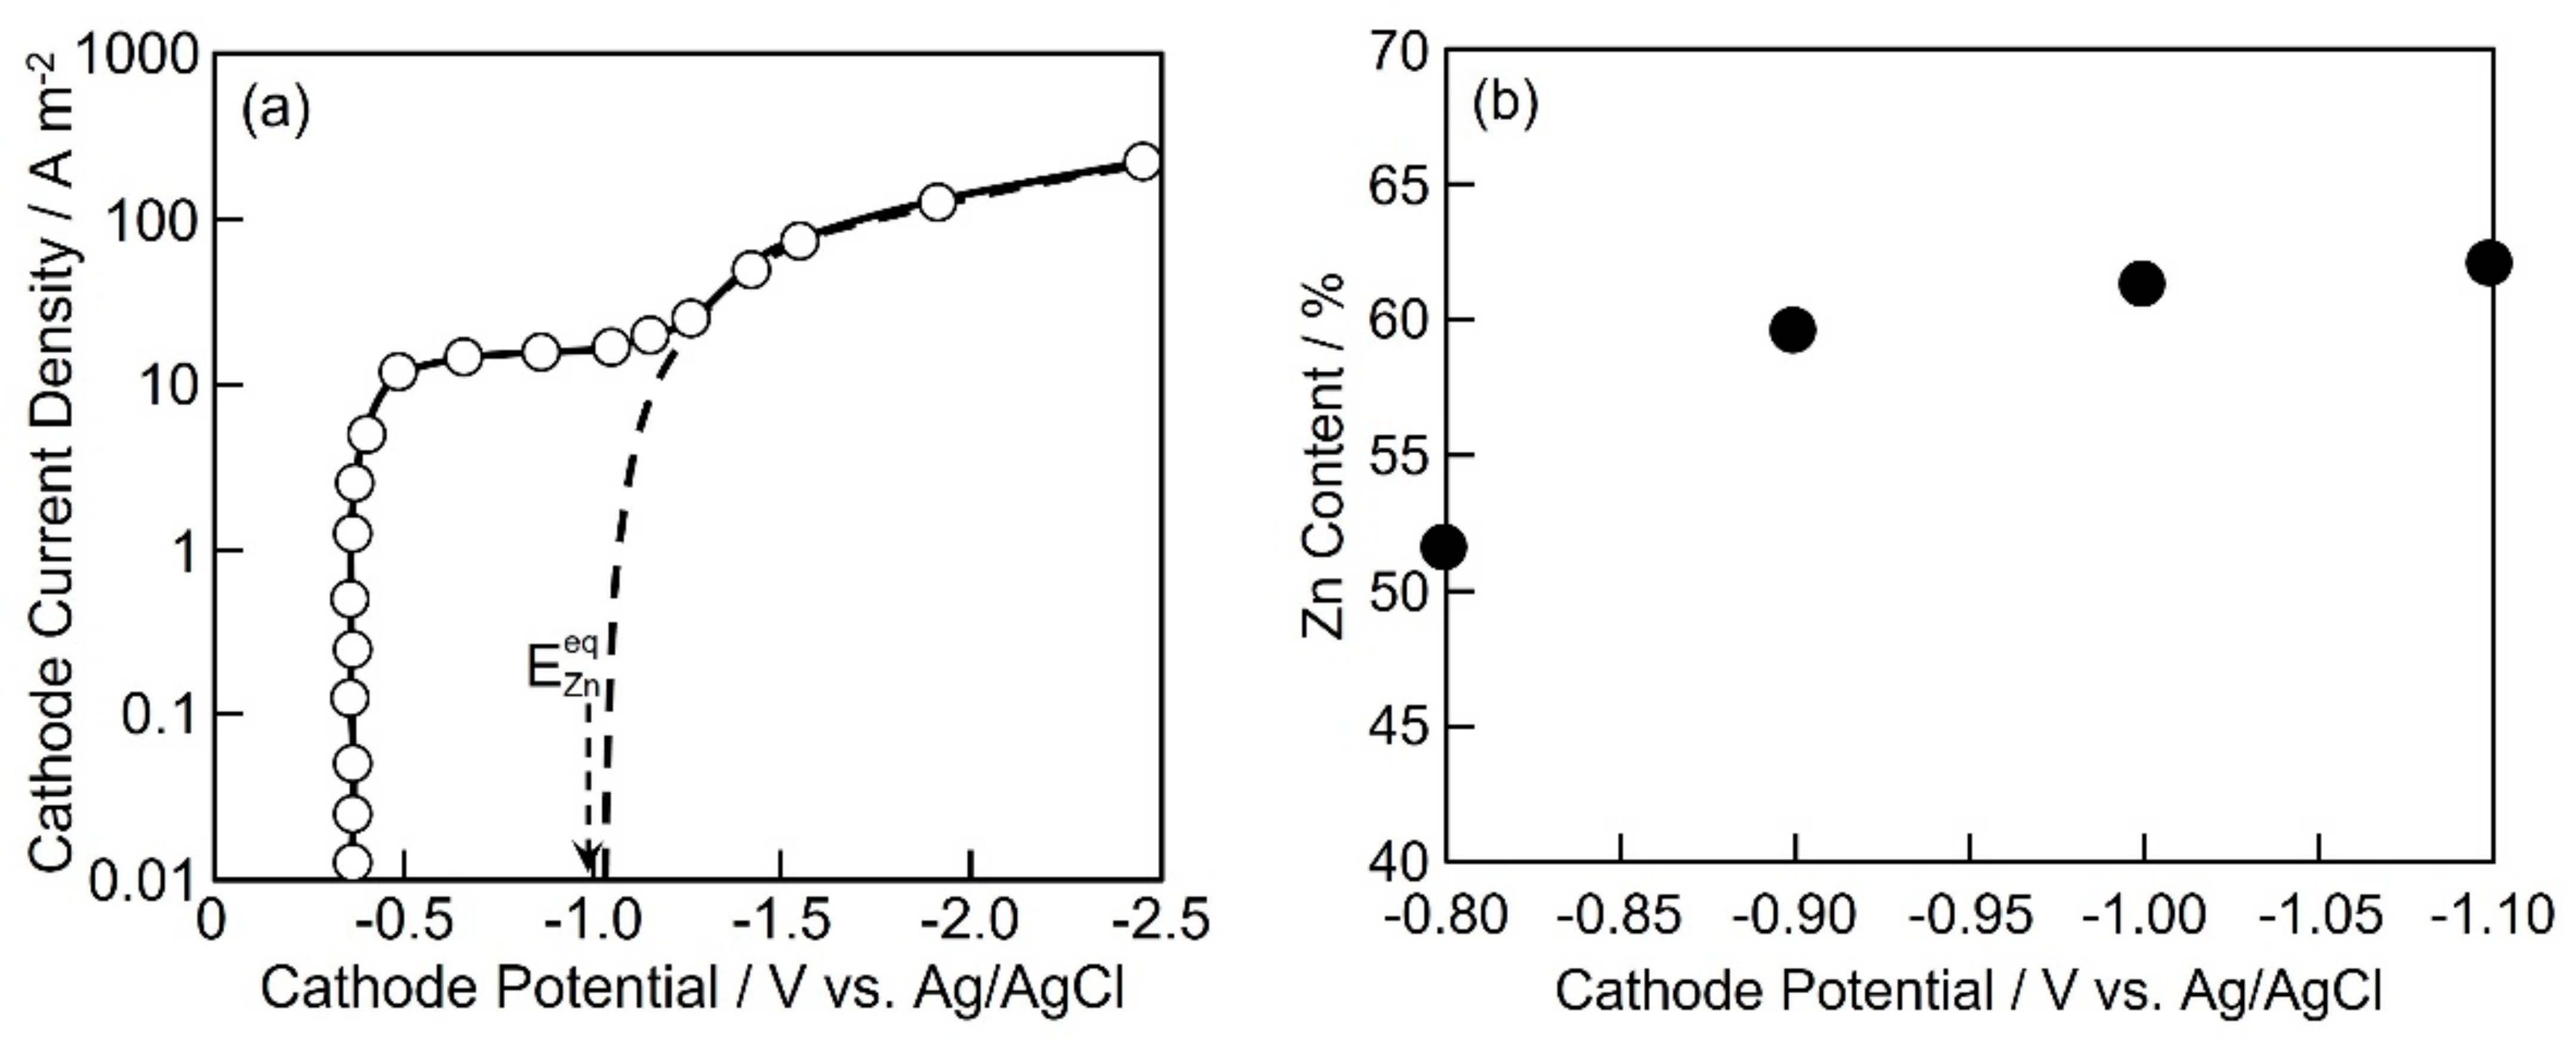
3.1. Electrochemical Reduction Behavior of ZnTe from an Aqueous Solution

Figure 1a shows a cathodic polarization curve during the electrochemical growth of zinc telluride from an aqueous solvent containing Zn2+ and HTeO2+ ions. The polarization curve was obtained by plotting the cathode potentials, which were determined during the galvanostatic electrodeposition of 30 s each (total of 19 points). Based on the Nernst equation, the equilibrium potential of ETeeq (HTeO2+ + 3H+ + 4e → Te + 2H2O) and EHeq (2H+ + 2e → H2) was calculated to be approximately +0.33 V and −0.44 V versus Ag/AgCl, respectively, while that of EZneq (Zn2+ + 2e → Zn) was estimated to be approximately –0.99 V. As shown in Figure 1a, the cathodic current began to rise at the potential of approximately −0.4 V. Neumann-Spallart et al. revealed that the electrochemical reduction current of Te from an aqueous solvent containing HTeO2+ ions emerged at approximately −0.2 V vs. Ag/AgCl [24]. In the present study, H2Cit (or HCit2−) ions were included in the bath to act as a ligand for HTeO2+ ions. Hence, HTeO2+ ions existed as complex ions with H2Cit (or HCit2−) ions. In our previous report, we revealed that Cit3− ions worked as a complexing agent for MoO42− ions and WO42− ions in the synthesis of Ni-Mo alloys [25] and Ni-W alloys [26], using an induced co-deposition technique. Recently, we also found that H2Cit (or HCit2−) ions can act as a polarizer for the electrodeposition of metals [27]. Therefore, the electrochemical deposition potential of Te from the Te complex ions seemed to appear in a less noble (electrochemically negative direction) region than that of Te from HTeO2+. Hence, the cathodic current, which emerged at around −0.40 V, seemed to be induced by the deposition current of Te from the Te complex ions.
As shown in Figure 1a, with an increase in the cathodic current density up to approximately 20 A/m2, the cathode potential shifted down to approximately −0.8 V because the Te complex ions and H+ ions can reach the diffusion limitation. In the cathode potential region, the pH near the cathode surface will increase up to approximately 6 and Zn2+ ions will form Zn(Cit)24− ions on the cathode surface, as shown in Equation (1) [28]. Consequently, the electrochemical growth of zinc telluride starts via the formation of Zn(Cit)24− ions, according to Equation (2):
Zn2+ + 2Cit3− ⇄ Zn(Cit)24−
Zn(Cit)24− + Te + 2e → ZnTe + 2Cit3−
With the shifting of the cathode potential down to less than −0.9 V, the cathodic current density increased, again, more than 20 A/m2 because the metallic zinc deposition proceeded, according to Equation (3):
Zn(Cit)24− + 2e → Zn + 2Cit3
Moreover, with an increase in the cathodic current density of more than 100 A/m2, the cathode potential shifted down to less than −1.5 V because Zn(OH)2 formed on the electrode. Zn(OH)2 are formed by OH ions generated as a result of water decomposition on the electrode [29]. In the cathode potential region, zinc will be electrodeposited via Zn(OH)2, according to Equations (4) and (5):
Zn2+ + 2OH → Zn(OH)2
Zn(OH)2 + 2e → Zn + 2OH
Figure 1b shows the cathode potential dependence on the zinc content in the electrodeposited alloys. In the potential region, which is less noble (electrochemically negative direction) than −0.9 V, the zinc content in the electrodeposits reached up to 60%, and a saturation effect can be observed at the potentials less noble than approximately −1.0 V. This phenomenon seemed to be caused by the diffusion limitation of Zn(Cit)24− ions as well as the Te complex ions. On the contrary, the zinc content was close to 50% (stoichiometric composition for zinc telluride) in the potential region that was more noble (electrochemically positive direction) than −0.8 V. Hence, the most promising potential to make a stoichiometric zinc telluride phase can be estimated at −0.8 V. Neumann-Spallart et al. revealed that the cathode potential has an influence on the crystallinity of the electrodeposited zinc telluride phase [24]. They revealed an improvement in the crystallinity of electrodeposited zinc telluride at the cathode potential of around −0.8 V versus Ag/AgCl in a pH range of 4.0 to 4.5.

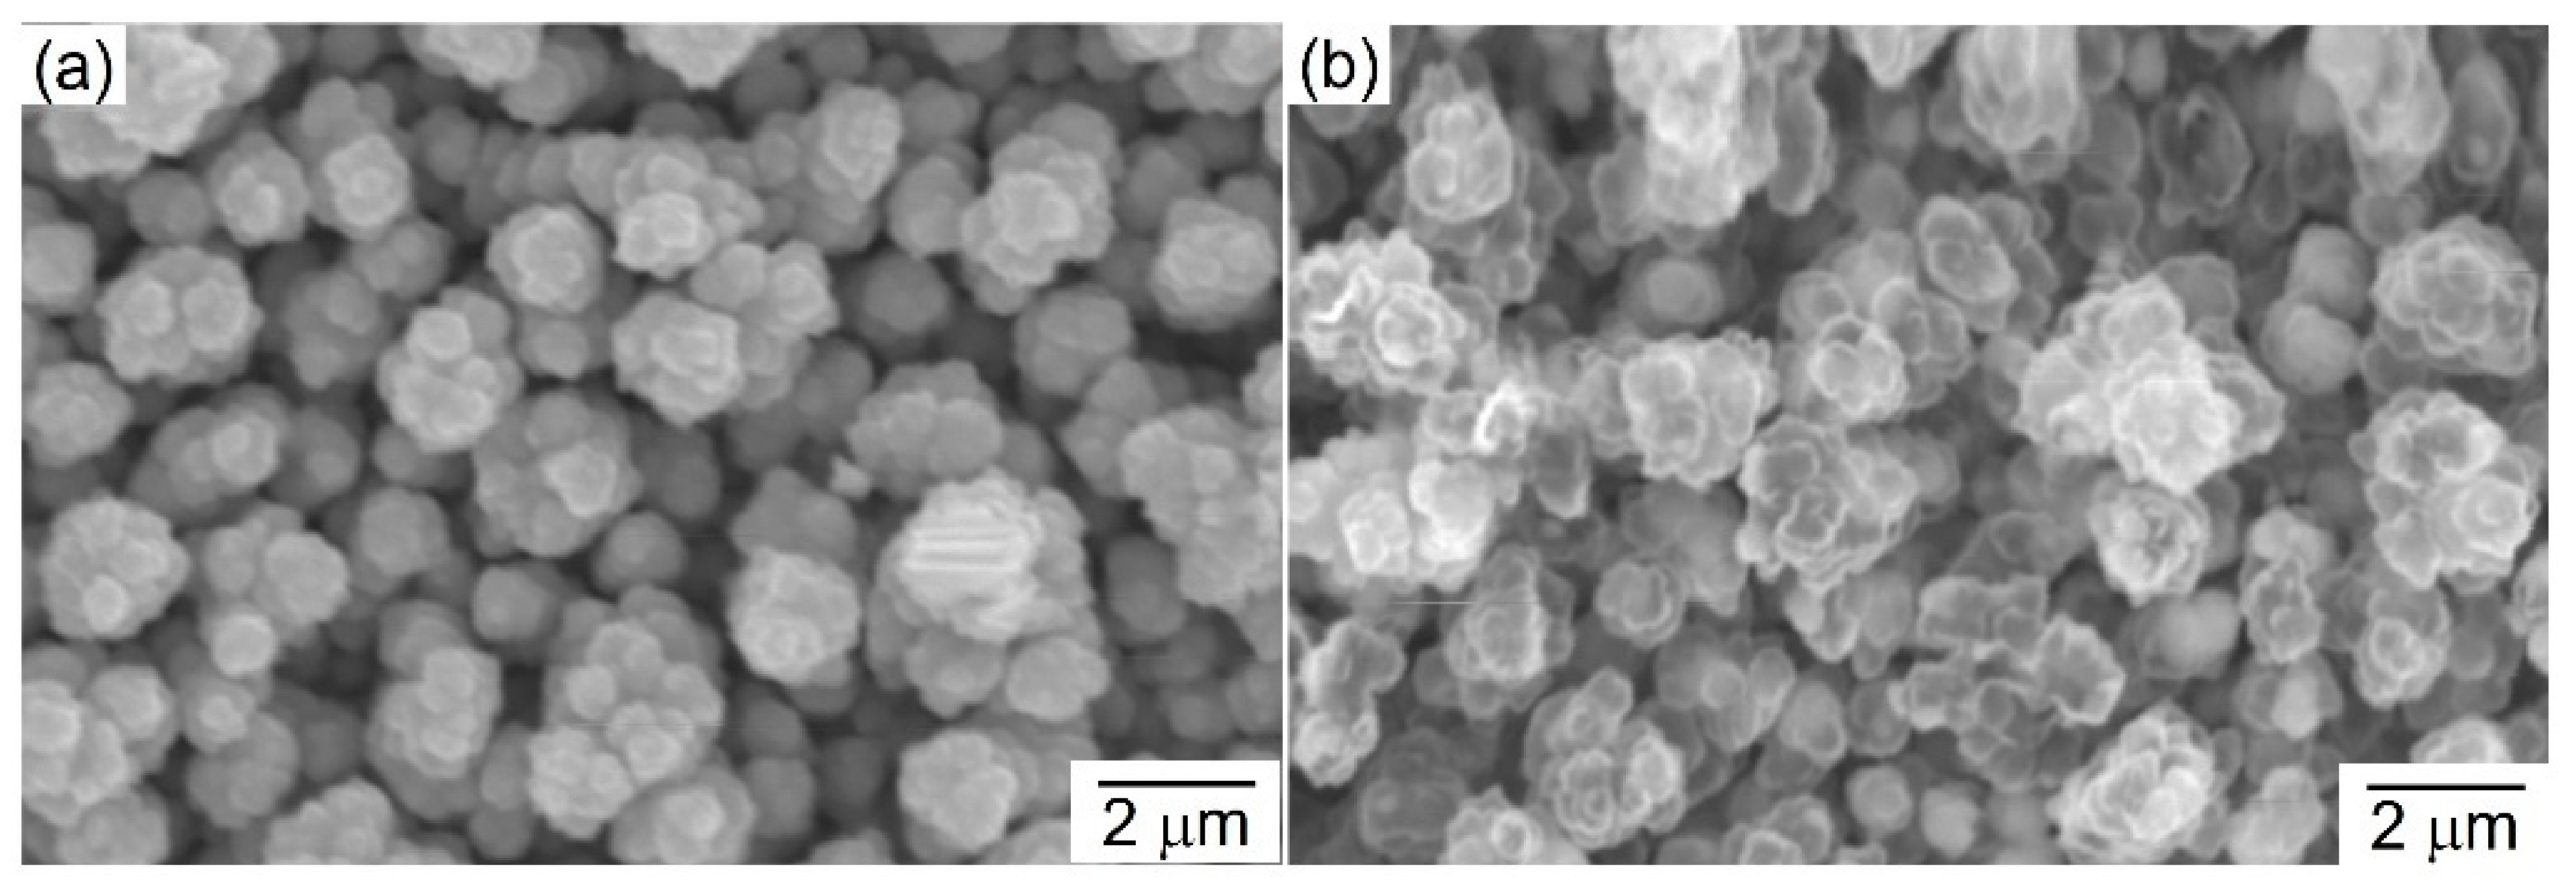
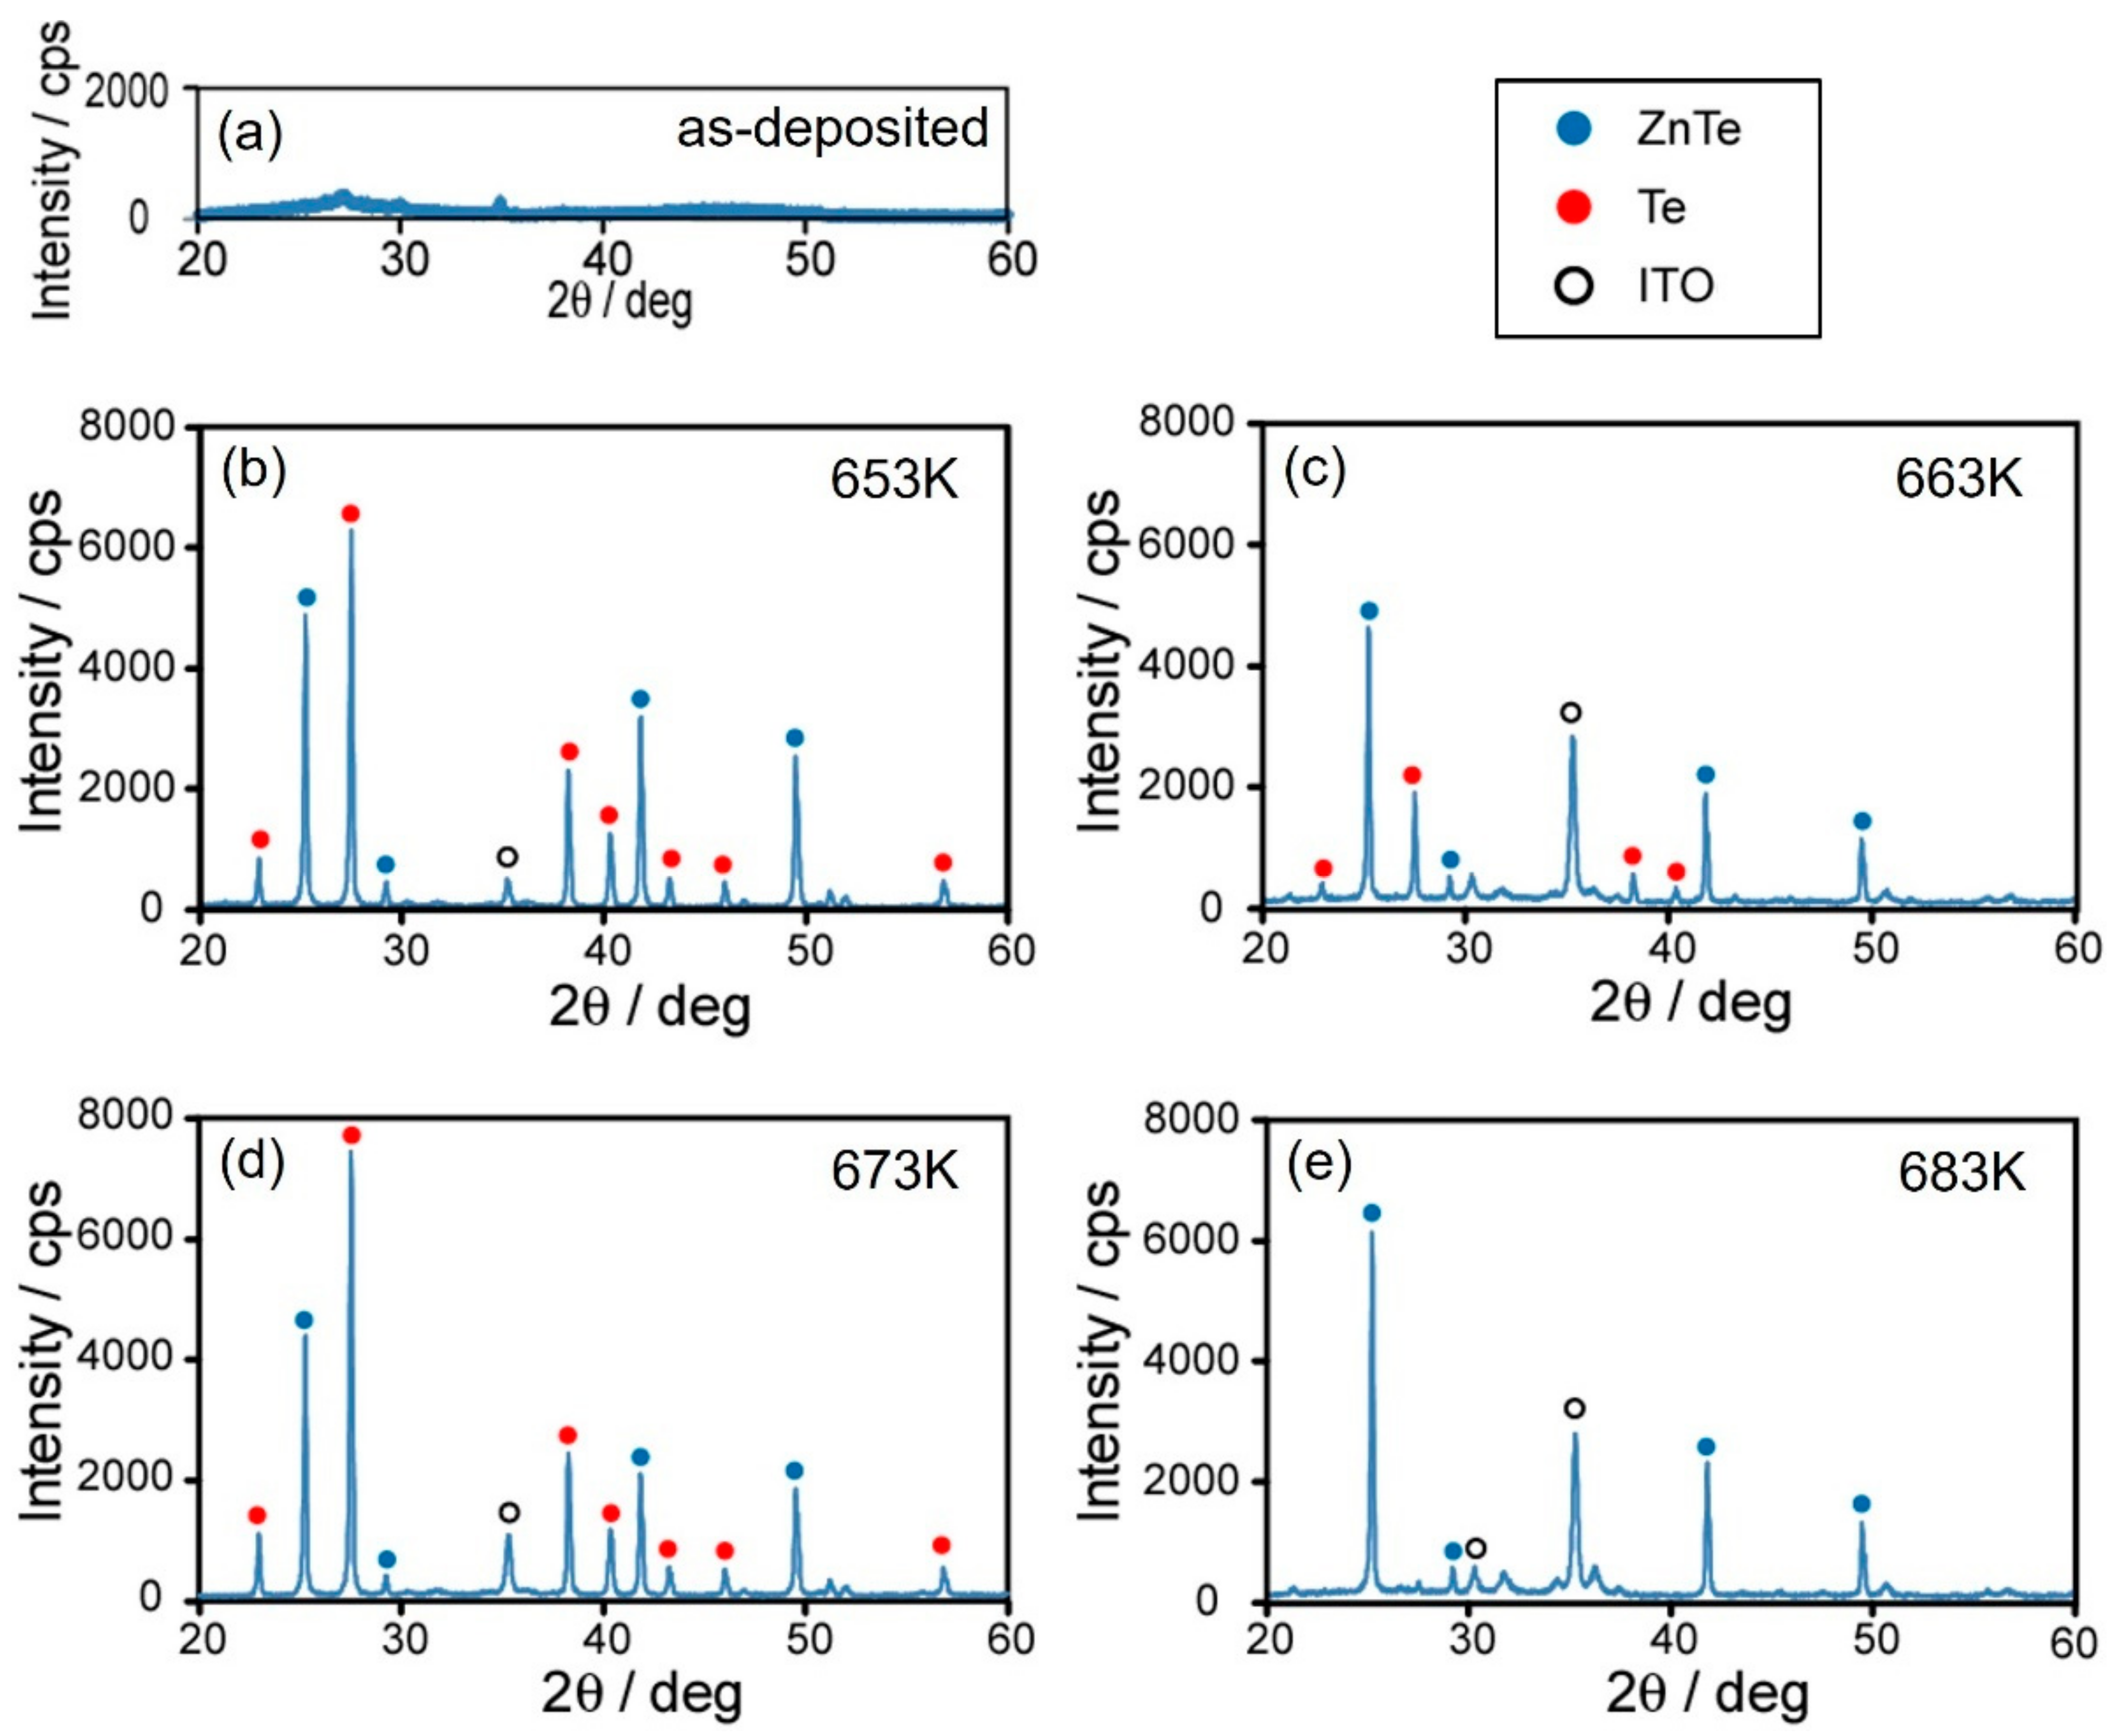
3.2. Structure of ZnTe Electrodeposited on ITO

Figure 2 shows the effect of the post-annealing process on the surface appearance of electrodeposited zinc telluride thin films. The as-electrodeposited samples (a) were post-annealed at 653 K (b), 663 K (c), 673 K (d), and 683 K (e) for 5 h. As shown in Figure 2a, the as-deposited zinc telluride thin film exhibited a black tint, whereas the samples with the annealing treatment (Figure 2b–e) exhibited a reddish-brown tint, a typical surface appearance of a single-phase zinc telluride.
Figure 3 shows the SEM images of the as-deposited zinc telluride thin films (a) as well as samples annealed at 683 K for 5 h (b). The samples were electrochemically synthesized at a potential of −0.8 V. Based on the SEM images, the samples consisted of small nodules with a diameter of approximately 1 μm. We could not improve the micro-scale morphology of the electrodeposits, even though the citric acid bath was employed. The effect of annealing on the morphology of the electrodeposited zinc telluride thin films was not so obvious according to the SEM images. Ishizaki et al. also revealed that electrochemically synthesized zinc telluride thin films consisted of small nodules with a diameter ranging from 300 nm to 600 nm [30]. Their results gave good agreement with the present study. Considering Equation (2), the surface morphological appearance of electrochemically synthesized zinc telluride thin films will be affected by the morphology of electrodeposited Te. The solubility of Te complex ions is quite small in comparison with that of Zn(Cit)24− ions because the saturated concentration of Te complex ions is approximately 10−3 mol L−1. Hence, the electrochemical deposition current of the Te complex ions at −0.8 V seemed to reach the diffusion limitation, as described in Figure 1a. The crystal nucleation density of electrodeposited metals increases with an increase in the overpotential. Therefore, the surface morphology of crystals that are electrochemically synthesized at a high current density over the diffusion limit should be transformed to that of fine particles with powder-like nodules. Consequently, the small nodules of deposited zinc telluride obtained in our study seemed to be formed by the characteristic electrodeposition behavior of Te complex ions with a significant overpotential.
Figure 4 shows the effect of the post-annealing temperature on the XRD profiles of the zinc telluride thin films. The as-deposited sample (a) was annealed at 653 K (b), 663 K (c), 673 K (d), and 683 K (e) for 5 h. As shown in Figure 4a, the as-deposited sample was composed of an amorphous-like phase, whereas the samples annealed at 653–673 K consisted of crystalline binary phases with ZnTe and Te, as shown in Figure 4b–d. By contrast, the sample annealed at 683 K was composed of crystalline single-phase ZnTe (Figure 4e). The melting points of pure Zn and pure Te are 693 K and 723 K, respectively, while that of the ZnTe compound is 1563 K. Usually, the recrystallization temperature TR of metallic materials with the melting point TM ranges from TM/3 to TM/2. Hence, the TR of pure Zn, pure Te, and ZnTe compounds are assumed to be approximately 231–347 K, 241–362 K, and 521–782 K. Considering the annealing temperature range (653–683 K) in the present work, the pure Zn phase and pure Te phase would have been recrystallized preferentially rather than forming the compound phase ZnTe. Therefore, the pure Te phase seemed to be observed in the samples annealed at 653–673 K. Lin et al. reported that the as-deposited thin film, which was electrodeposited from a non-aqueous solvent (EMIC: 1-ethyl-3-methylimidazolium chloride), was composed of the crystalline Te phase and the other non-crystalline phase [31]. Based on their research, the sample annealed at 623 K exhibited a crystalline ZnTe phase without the pure Te phase. They found that a long post-annealing time of more than 2 h was necessary to synthesize a crystalline cubic zinc telluride at a low annealing temperature of less than 623 K. They also suggested that the elementary tellurium phase could volatilize rapidly from the samples during post-annealing temperatures greater than 673 K, considering the vapor pressure of tellurium. Hence, in the present study, tellurium seemed to be more volatile at an annealing temperature greater than 683 K.

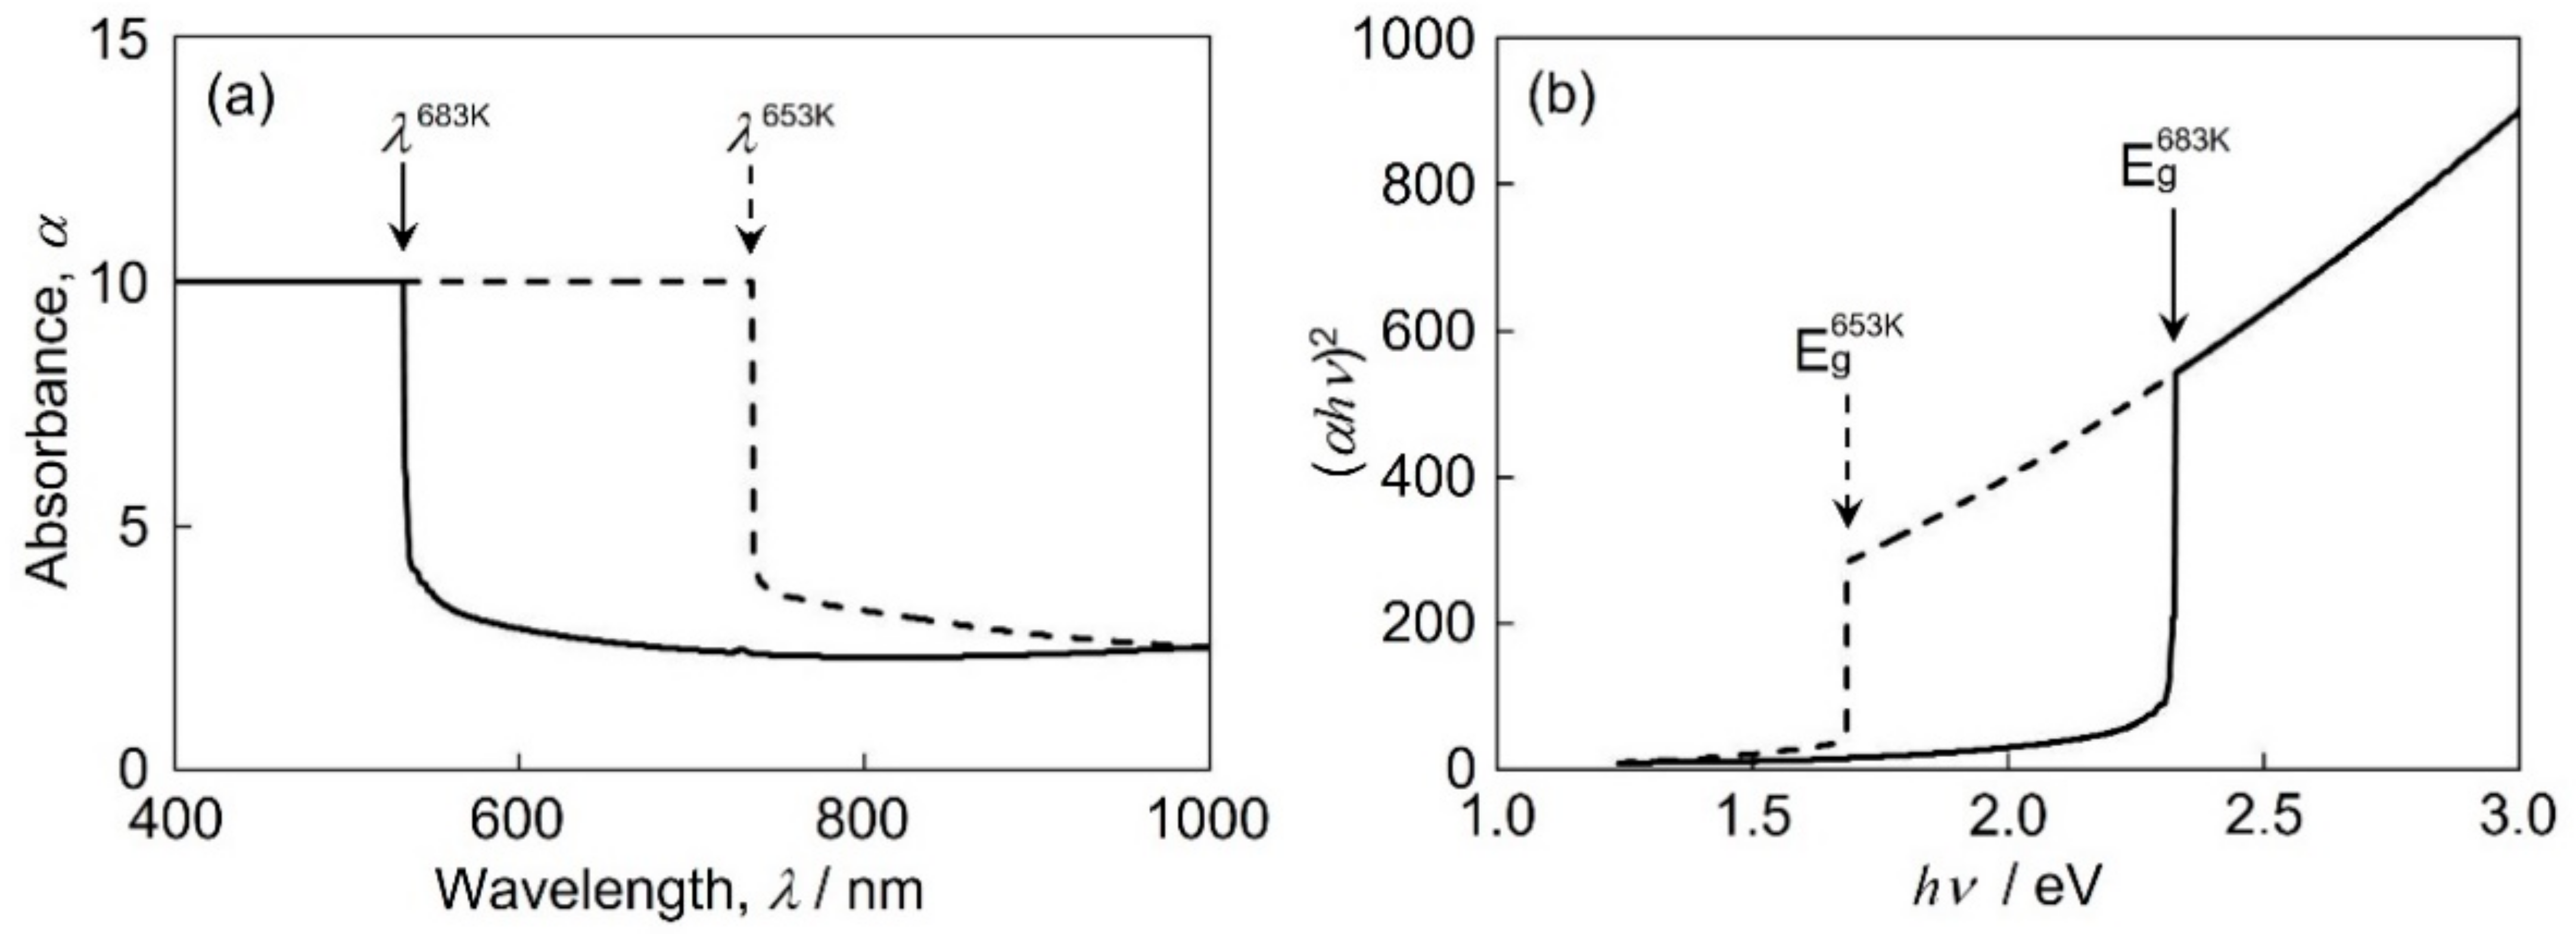
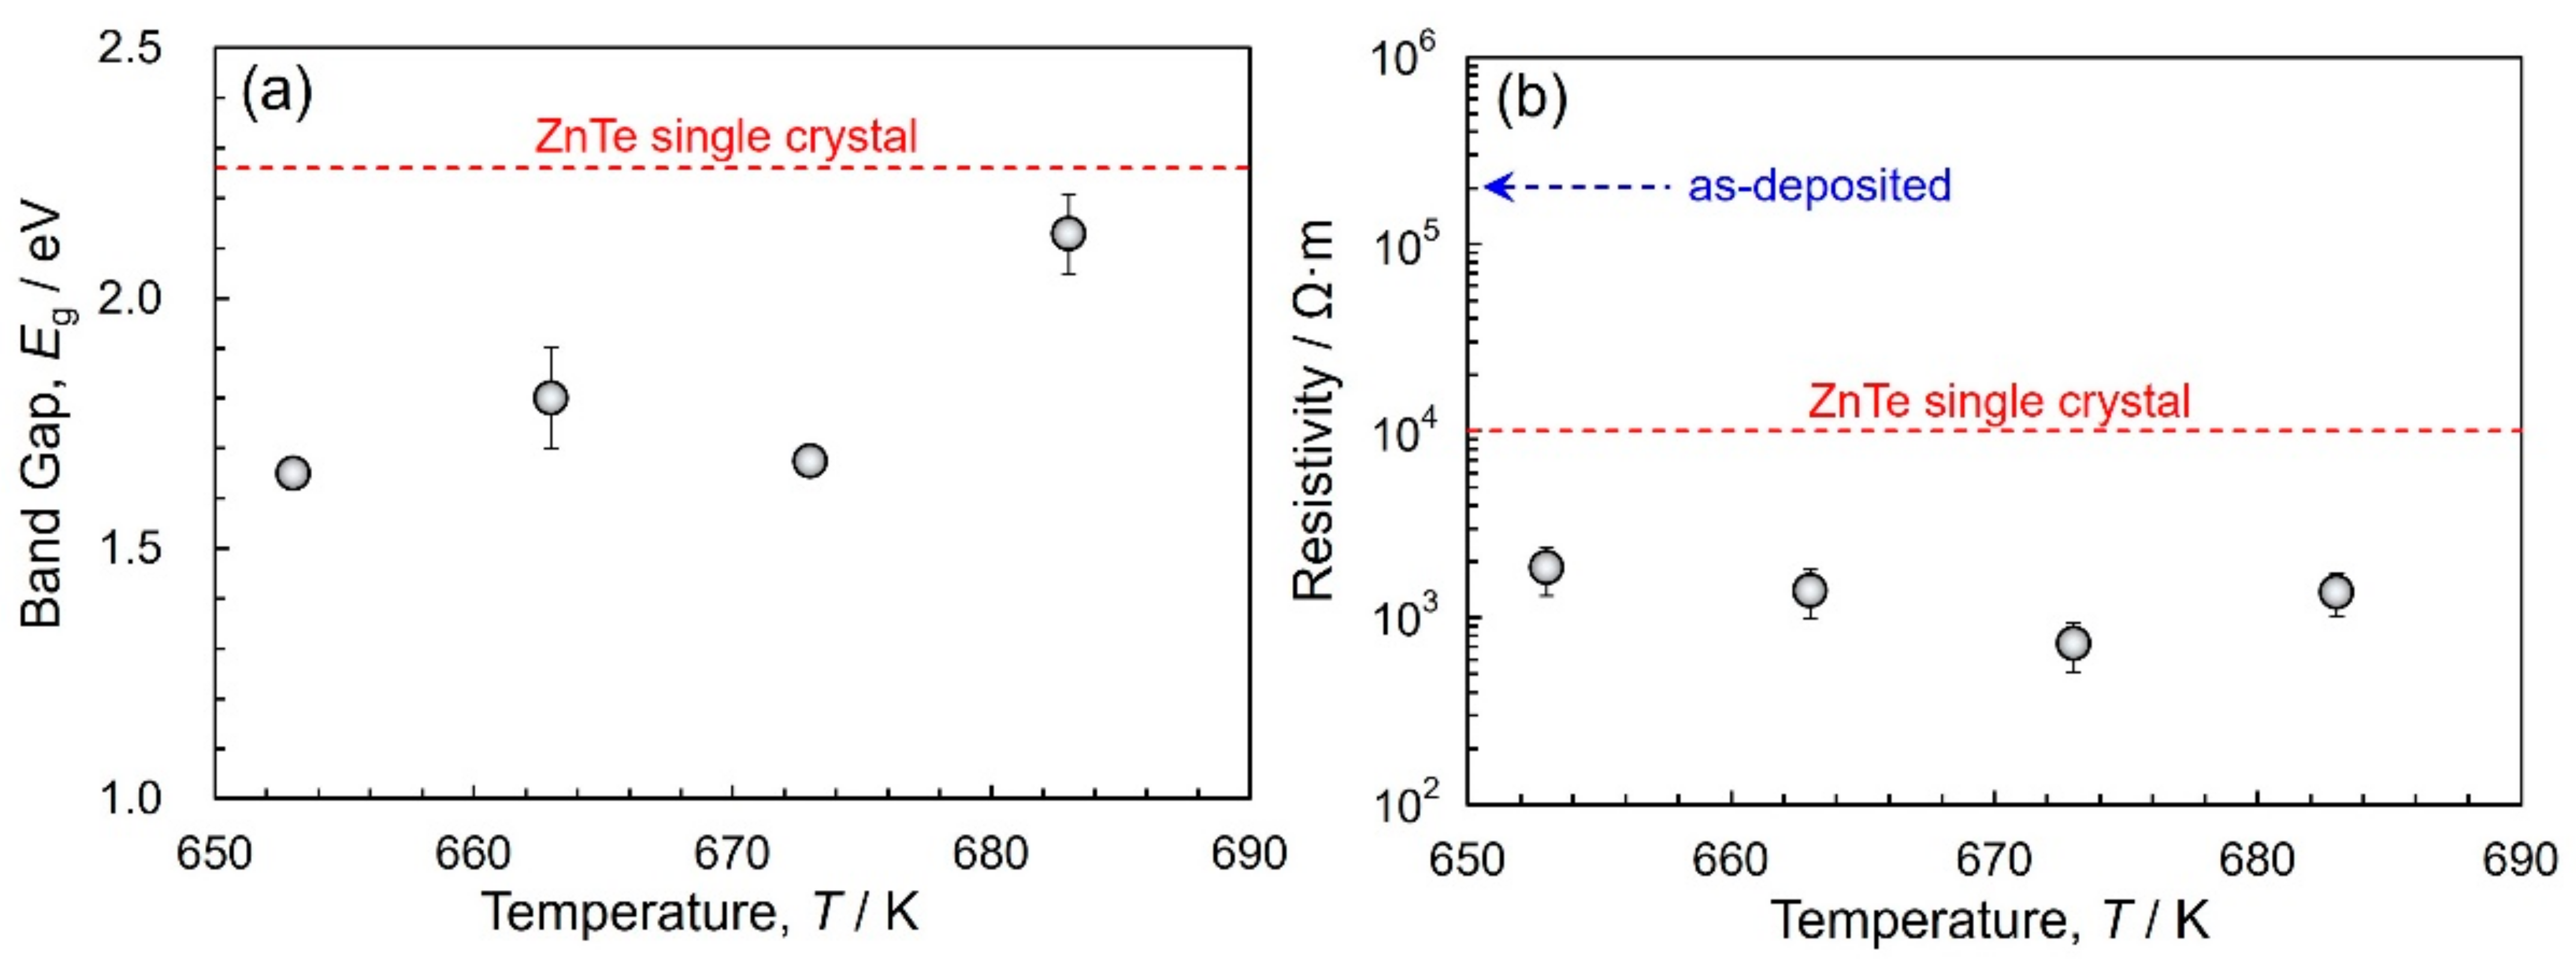
3.3. Band Gap Energy and Resistance of Electrodeposited Zinc Telluride

Figure 5a shows the post-annealing effect on the UV-VIS absorption spectra of zinc telluride thin films. In the zinc telluride thin film annealed at 653 K, light absorption was confirmed in the spectrum region less than 735 nm. By contrast, the zinc telluride thin film with annealing at 683 K exhibited light absorption in the spectrum region less than 535 nm. Gandhi et al. investigated the UV-VIS absorption performance of zinc telluride nanowire samples that were electrochemically synthesized into TiO2 nanochannels [32]. They reported observing light absorption in the spectrum region less than 688 nm using as-electrodeposited zinc telluride nanowires, whereas zinc telluride nanowires annealed at 623 K exhibited a light absorption performance in the spectrum region less than 559 nm. The authors concluded that the post-annealing treatment resulted in the elimination of crystal defects, such as zinc vacancies, which existed in the as-electrodeposited zinc telluride nanowires. Hence, in the present study, the wavelength shift in the optical absorption seemed to have been induced by the crystallization of the as-deposited zinc telluride amorphous-like phase during the thermal annealing process.
Figure 5b shows the post-annealing effect on the (αhν)2 versus the hν plot that determines the band gap energy Eg of zinc telluride films. The electrodeposited zinc telluride samples were annealed at 653 K and 683 K. The Eg of zinc telluride films with annealing at 653 K and 683 K were determined to be approximately 1.7 eV and 2.3 eV, respectively. Lin et al. also reported that the Eg of single-phase zinc telluride, which was electrodeposited from an EMIC (1-ethyl-3-methylimidazolium chloride) solvent, was approximately 2.3 eV [30]. Hence, the Eg observed in our study agrees well with their results.
Figure 6a shows the post-annealing effect on the Eg of zinc telluride films. The Eg of zinc telluride films annealed at 653–673 K was estimated to be approximately 1.7 eV, while that of the zinc telluride film annealed at 683 K was determined to be approximately 2.3 eV, which was almost identical to that of the single-crystal zinc telluride. The electrodeposited thin films annealed at 653–673 K were composed of binary phases (ZnTe and Te), whereas the thin film with annealing at 683 K consisted of single-phase zinc telluride, as shown in Figure 4. Therefore, the band gap energy of electrodeposited zinc telluride thin films seemed to depend on the constituent phase. The tellurium phase in the electrodeposited thin films should decrease the energy band gap.
Figure 6b shows the post-annealing effect on the resistivity of zinc telluride thin films. The resistivity of the as-prepared zinc telluride thin film was approximately 2 × 10⁵ Ω·m, whereas that of the zinc telluride thin films annealed at 653–683 K was approximately 2 × 10³ Ω·m, which was smaller than that of single-crystal zinc telluride. Kashyout et al. revealed that the resistivity of electrochemically synthesized zinc telluride thin films was strongly affected by the post-annealing process [23]. Based on their report, the sheet resistance of the zinc telluride thin film annealed at 623 K was approximately 0.3 × 10⁵ Ω/sq., while that of the films annealed at 648 K and 673 K were approximately 1.1 × 10⁵ Ω/sq. and 8.2 × 10⁵ Ω/sq., respectively. They also revealed that the Eg and the resistance of the zinc telluride films were enhanced with an increase in the post-annealing temperature. On the contrary, the resistivity of the zinc telluride thin film, which was obtained in the present study, was almost stable even when the post-annealing temperature was raised to 683 K. This result supports the notion that the synergistic effect of crystal defect elimination and crystal growth in the deposited zinc telluride seemed to emerge at the post-annealing process of 683 K or higher.

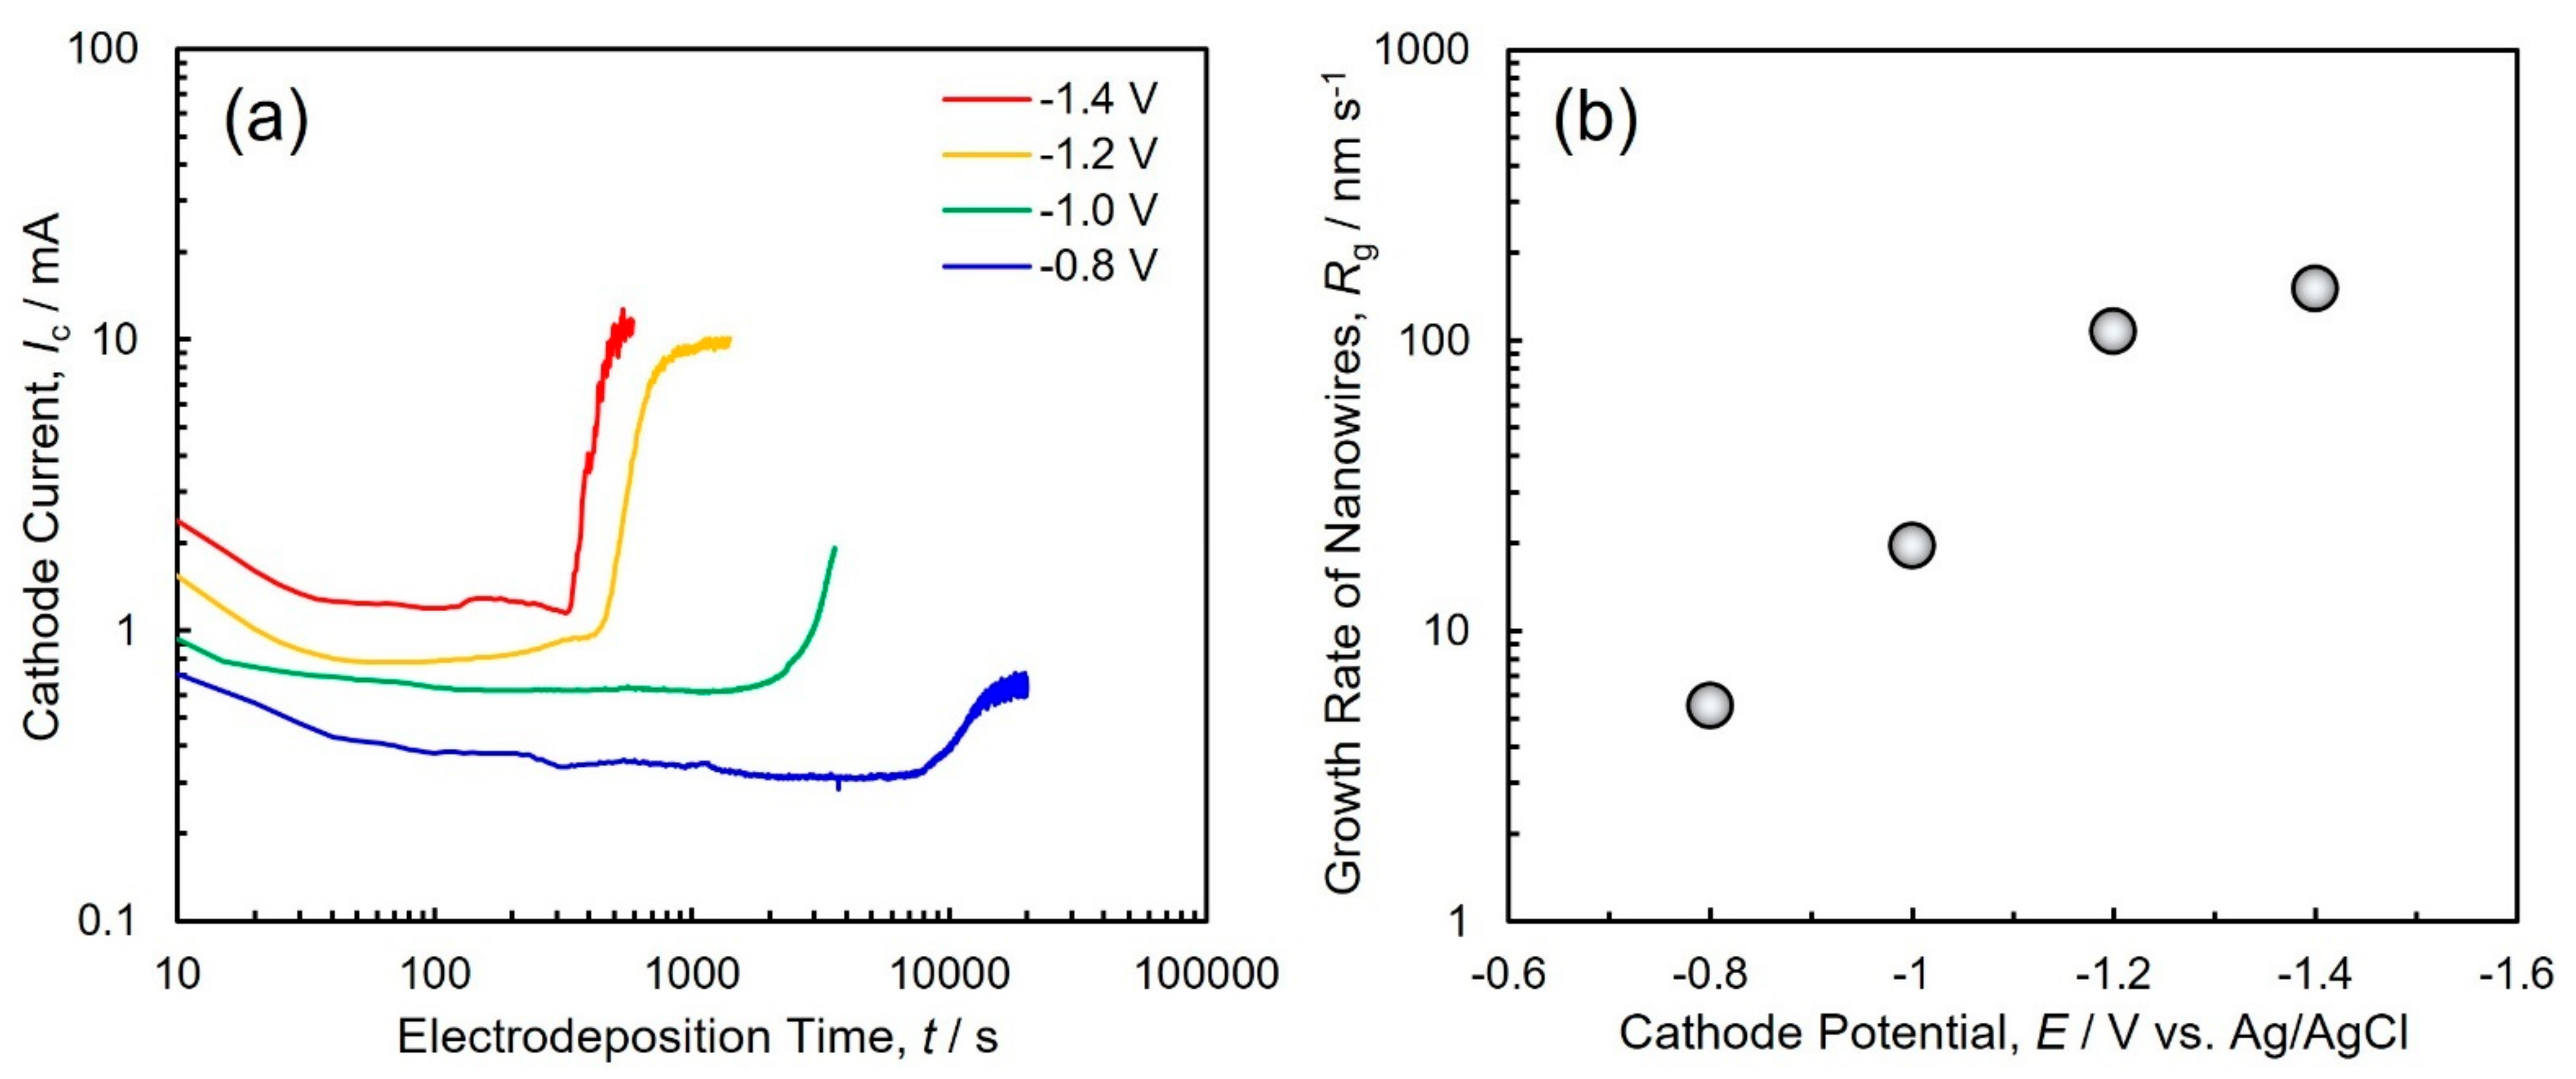
3.4. Electrodeposition of ZnTe Nanowires Array into Nanochannel Templates

Figure 7 shows the fabrication process of a zinc telluride nanowire array using a template electrodeposition technique [33,34,35,36]. Ion-track etched polycarbonate nanochannel films (pore length of 6 μm and pore diameter of 100 nm) and anodized aluminum oxide nanochannel films (pore length of 60 μm and pore diameter of 200 nm) were used as nanochannel templates. One side of the filter was coated with sputter-deposited gold film to cover the nanochannels. This conductive gold layer acted as a cathode for the electrochemical growth of the zinc telluride nanowires. The zinc telluride nanowires were electrodeposited at the cathode potential range from −0.8 V to −1.4 V versus Ag/AgCl. After electrodepositing the zinc telluride nanowire array, the polycarbonate nanochannel films were dissolved in an organic solvent containing chloroform and dichloromethane, whereas the anodized aluminum oxide nanochannel films were dissolved in an aqueous solution containing 5N NaOH [37]. The remnant (zinc telluride nanowires) served as a sample to observe the nanostructure using SEM.
Figure 8a shows the time dependence of the cathode current during the electrodeposition of the ZnTe nanowires in the anodized aluminum oxide (AAO) membranes. The effect of the cathode potential on the growth rate of ZnTe nanowires in AAO membranes was also shown in Figure 8b. As shown in Figure 8a, at the beginning of the electrodeposition within approximately 50 s, the cathode current decreased gradually with increasing the time. This phenomenon seems to be caused by the nucleation of ZnTe nanocrystals on the Au cathode and decreasing the concentration of the metal ions inside the AAO nanochannels. Following the initial nucleation stage, an almost constant cathode current was observed for a long time. For instance, the stable duration was approximately 1000 s at the cathode potential of −0.8 V while that was approximately 300 s at −1.4 V. During this second stage, ZnTe nanowires seemed to grow inside the AAO nanochannels at a constant growth rate. Finally, the cathode current increased rapidly due to the two-dimensional growth outside the AAO nanochannels on the template surface. The growth rate of ZnTe nanowires, Rg (nm/s), can be estimated from dividing the AAO nanochannel length, L (nm), by the nanochannel filling time, t (s). For example, Rg can be calculated to 5.54 nm/s (L = 60,000 nm and t = 10,830 s) at the cathode potential of −0.8 V. As shown in Figure 8b, Rg increased with shifting the cathode potential to a less noble direction. This tendency corresponds well to the cathodic polarization curve (Tafel plot) as shown in Figure 1a. The stoichiometric composition was obtained at −0.8 V while the zinc content in the deposit increased with an increase in the cathodic overpotential, as shown in Figure 1b.
Figure 9 shows the SEM images of the electrodeposited zinc telluride nanowire array. The nanochannel structures of the ion-track etched polycarbonate films (a) and anodized aluminum oxide films (b) were transferred precisely to the three-dimensional nanostructure of the zinc telluride nanowire array. The aspect ratio of the nanowires achieved up to approximately 300 which was obtained from the anodized aluminum oxide templates. These characteristic nanostructures of compound semiconductors can be applied in a novel opto-electronic device due to their enhanced specific surface area and unique quantum effects.

4. Conclusions

Electrochemically synthesized zinc telluride thin films with a stoichiometric composition were achieved by tuning the cathode potential to −0.8 V. Due to the diffusion limitation of Te complex ions, the micro-scale morphology of the electrodeposits was not improved even though the citric acid bath was employed. The as-deposited zinc telluride thin films consisted of an amorphous-like phase, whereas the electrodeposited zinc telluride thin films were crystallized at an annealing temperature greater than 653 K. The electrodeposited zinc telluride thin films post-annealed at 653–673 K were composed of binary phases (ZnTe and Te). On the contrary, the electrodeposited thin film post-annealed at 683 K was composed of single-phase zinc telluride. The Eg of the electrodeposited films annealed at 653–673 K was estimated to be approximately 1.7 eV, while that of the electrodeposited films annealed at 683 K was determined to be approximately 2.3 eV, which is almost identical to that of single-crystal zinc telluride. We also revealed that the Eg of the zinc telluride films depended on the constituent phases. In particular, the tellurium phase in the electrodeposits induced a reduction in the band gap energy. The resistivity of the as-electrodeposited zinc telluride thin films was approximately 2 × 10⁵ Ω·m, whereas that of the thin films annealed at 653–683 K was approximately 2 × 10³ Ω·m, which was smaller than that of single-crystal zinc telluride. Therefore, the synergistic effect of the crystal defect elimination and the crystal nucleation of the as-deposited amorphous-like nanocrystalline zinc telluride emerged at the post-annealing temperature of 683 K. The zinc telluride nanowire array with a three-dimensional structure was also achieved using a template-assisted electrodeposition technique.

Author Contributions

J.O. carried out experiments, analyzed data, and wrote the manuscript; T.O. designed the study, supervised the project, and analyzed data. All authors have read and agreed to the published version of the manuscript.

Funding

This research was funded by the Japan Society for the Promotion of Science (grant number 21560748) and JFE 21st Century Foundation.

Institutional Review Board Statement

Not applicable.

Informed Consent Statement

Not applicable.

Data Availability Statement

The data presented in this study are available on request from the corresponding author.

Acknowledgments

This work was supported in part by the Japan Society for the Promotion of Science (Grant-in-aid for Scientific Research C: No. 21560748) and JFE 21st Century Foundation.

Conflicts of Interest

The authors declare no conflict of interest.

References

  1. Pal, U.; Saha, S.; Chaudhuri, A.K.; Rao, V.V.; Banerjee, H.D. Some optical properties of evaporated zinc telluride films. J. Phys. D Appl. Phys. 1989, 22, 965–970. [Google Scholar] [CrossRef]
  2. Zarei, R.; Ehsani, M.H.; Rezaghiolipour Dizaji, H. An investigation on structural and optical properties of nanocolumnar ZnTe thin films grown by glancing angle technique. Mater. Res. Express 2020, 7, 026419. [Google Scholar] [CrossRef]
  3. Bellakhder, H.; Outzourhit, A.; Ameziane, E.L. Study of ZnTe thin films deposited by r.f. sputtering. Thin Solid Films 2001, 382, 30–33. [Google Scholar] [CrossRef]
  4. Wolf, K.; Stanzl, H.; Naumov, A.; Wagner, H.P.; Kuhn, W.; Kahn, B.; Gebhardt, W. Growth and doping of ZnTe and ZnSe epilayers with metalorganic vapour phase epitaxy. J. Cryst. Growth 1994, 138, 412–417. [Google Scholar] [CrossRef]
  5. Chaure, N.B.; Nair, J.P.; Jayakrishnan, R.; Ganesan, V.; Pandey, R.K. Effect of Cu-doping on the morphology of ZnTe films electrodeposited from nonaqueous bath. Thin Solid Films 1998, 324, 78–84. [Google Scholar] [CrossRef]
  6. Heo, P.; Ichino, R.; Okido, M. ZnTe electrodeposition from organic solvents. Electrochim. Acta 2006, 51, 6325–6330. [Google Scholar] [CrossRef]
  7. Islam, A.B.M.O.; Chaure, N.B.; Wellings, J.; Tolan, G.; Dharmadasa, I.M. Development of electrodeposited ZnTe layers as window materials in ZnTe/CdTe/CdHgTe multi-layer solar cells. Mater. Character. 2009, 60, 160–163. [Google Scholar] [CrossRef]
  8. Hossain, M.I.; Kamruzzaman, M.; Islam, A.B.M.O. Effects of temperature in electrodeposition of ZnTe thin films. J. Mater. Sci. Mater. Electron. 2015, 26, 1756–1762. [Google Scholar] [CrossRef]
  9. Chaure, N.B.; Chaure, S.; Pandey, R.K. Investigation on the effect of Cu-doping to ZnTe layers by low-cost electrochemical approach. J. Mater. Sci. Mater. Electron. 2017, 28, 11823–11831. [Google Scholar] [CrossRef]
  10. Basol, B.M.; Kapur, V.K. Preparation of ZnTe thin films using a simple two-stage process. Thin Solid Films 1988, 165, 237–241. [Google Scholar] [CrossRef]
  11. Mishra, K.K.; Rajeshwar, K. A re-examination of the mechanisms of electrodeposition of CdX and ZnX (X = Se, Te) semiconductors by the cyclic photovoltammetric technique. J. Electroanal. Chem. 1989, 273, 169–182. [Google Scholar] [CrossRef]
  12. Kashyout, A.B.; Arico, A.S.; Antonucci, P.L.; Mohamed, F.A.; Antonucci, V. Influence of annealing temperature on the opto-electronic characteristics of ZnTe electrodeposited semiconductors. Mater. Chem. Phys. 1997, 51, 130–134. [Google Scholar] [CrossRef]
  13. Bozzini, B.; Baker, M.A.; Cavallotti, P.L.; Cerri, E.; Lenardi, C. Electrodeposition of ZnTe for photovoltaic cells. Thin Solid Films 2000, 361–362, 388–395. [Google Scholar] [CrossRef]
  14. Bozzini, B.; Lenardi, C.; Lovergine, N. Electrodeposition of stoichiometric polycrystalline ZnTe on n+-GaAs and Ni-P. Mater. Chem. Phys. 2000, 66, 219–228. [Google Scholar] [CrossRef]
  15. Mahalingam, T.; John, V.S.; Rajendran, S.; Ravi, G.; Sebastian, P.J. Annealing studies of electrodeposited zinc telluride thin films. Surf. Coat. Technol. 2002, 155, 245–249. [Google Scholar] [CrossRef]
  16. Rakhshani, A.E.; Pradeep, B. Thin films of ZnTe electrodeposited on stainless steel. Appl. Phys. A 2004, 79, 2021–2025. [Google Scholar] [CrossRef]
  17. Murali, K.R.; Rajkumar, P.R. Characteristics of pulse plated ZnTe films. J. Mater. Sci. Mater. Electron. 2006, 17, 393–396. [Google Scholar] [CrossRef]
  18. Liu, Y.; Zhang, X.; Liu, R.; Yang, R.; Liu, C.; Cai, Q. Fabrication and photocatalytic activity of high-efficiency visible-light-responsive photocatalyst ZnTe/TiO2 nanotube arrays. J. Solid State Chem. 2011, 184, 684–689. [Google Scholar] [CrossRef]
  19. Mahalingam, T.; Dhanasekaran, V.; Sundaram, K.; Kathalingam, A.; Rhee, J.K. Characterization of electroplated ZnTe coatings. Ionics 2012, 18, 299–306. [Google Scholar] [CrossRef]
  20. Skhouni, O.; ElManouni, A.; Mollar, M.; Schrebler, R.; Marí, B. ZnTe thin films grown by electrodeposition technique on Fluorine Tin Oxide substrates. Thin Solid Films 2014, 564, 195–200. [Google Scholar] [CrossRef]
  21. Kim, D.; Park, K.; Lee, S.; Yoo, B. Electrochemical synthesis of ZnTe thin films from citrate bath and their electrical properties with incorporation of Cu. Mater. Chem. Phys. 2016, 179, 10–16. [Google Scholar] [CrossRef]
  22. Hossain, M.I.; Siddiquee, K.A.M.H.; Islam, O.; Gafur, M.A.; Qadir, M.R.; Ahmed, N.A. Characterization of electrodeposited ZnTe thin films. J. Opt. 2019, 48, 295–301. [Google Scholar] [CrossRef]
  23. Bouroushian, M.; Kosanovic, T.; Karoussos, D.; Spyrellis, N. Electrodeposition of polycrystalline ZnTe from simple and citrate-complexed acidic aqueous solutions. Electrochim. Acta 2009, 54, 2522–2528. [Google Scholar] [CrossRef]
  24. Neumann-Spallart, M.; Königstein, C. Electrodeposition of zinc telluride. Thin Solid Films 1995, 265, 33–39. [Google Scholar] [CrossRef]
  25. Ohgai, T.; Washio, R.; Tanaka, Y. Anisotropic Magnetization Behavior of Electrodeposited Nanocrystalline Ni-Mo Alloy Thin Films and Nanowires Array. J. Electrochem. Soc. 2012, 159, H800–H804. [Google Scholar] [CrossRef] [Green Version]
  26. Ohgai, T.; Fujimaru, T.; Tanaka, Y. Isotropic magnetization response of electrodeposited nanocrystalline Ni–W alloy nanowire arrays. J. Appl. Electrochem. 2014, 44, 301–307. [Google Scholar] [CrossRef] [Green Version]
  27. Saeki, R.; Ohgai, T. Perpendicular magnetization performance of hcp-cobalt nanocylinder array films electrodeposited from an aqueous solution containing cobalt (II)–citrate complexes. J. Mater. Res. Technol. 2020, 9, 8029–8040. [Google Scholar] [CrossRef]
  28. Ishizaki, T.; Ohtomo, T.; Sakamoto, Y.; Fuwa, A. Effect of pH on the Electrodeposition of ZnTe Film from a Citric Acid Solution. Mater. Trans. 2004, 45, 277–280. [Google Scholar] [CrossRef] [Green Version]
  29. Nakano, H.; Ohgai, T.; Fukushima, H.; Akiyama, T.; Kammel, R. Factors Determining the Critical Current Density for Zinc Deposition in Sulfate Solutions. Metall 2001, 55, 676–681. [Google Scholar]
  30. Ishizaki, T.; Saito, N.; Takai, O.; Asakura, S.; Goto, K.; Fuwa, A. An investigation into the effect of ionic species on the formation of ZnTe from a citric acid electrolyte. Electrochim. Acta 2005, 50, 3509–3516. [Google Scholar] [CrossRef]
  31. Lin, M.C.; Chen, P.Y.; Sun, I.W. Electrodeposition of Zinc Telluride from a Zinc Chloride-1-Ethyl-3-methylimidazolium Chloride Molten Salt. J. Electrochem. Soc. 2001, 148, C653–C658. [Google Scholar] [CrossRef]
  32. Gandhi, T.; Raja, K.S.; Misra, M. Synthesis of ZnTe nanowires onto TiO2 nanotubular arrays by pulse-reverse electrodeposition. Thin Solid Films 2009, 517, 4527–4533. [Google Scholar] [CrossRef]
  33. Martin, C.R. Template synthesis of polymeric and metal microtubules. Adv. Mater. 1991, 3, 457–459. [Google Scholar] [CrossRef]
  34. Ohgai, T.; Mizumoto, M.; Nomura, S.; Kagawa, A. Electrochemical Fabrication of Metallic Nanowires and Metal Oxide na-Nopores. Mater. Manuf. Process. 2007, 22, 440–443. [Google Scholar] [CrossRef] [Green Version]
  35. Ohgai, T.; Hjort, K.; Spohr, R.; Neumann, R. Electrodeposition of cobalt based ferro-magnetic metal nanowires in polycarbonate films with cylindrical nanochannels fabricated by heavy-ion-track etching. J. Appl. Electrochem. 2008, 38, 713–719. [Google Scholar] [CrossRef] [Green Version]
  36. Piraux, L. Magnetic Nanowires. Appl. Sci. 2020, 10, 1832. [Google Scholar] [CrossRef] [Green Version]
  37. Neetzel, C.; Ohgai, T.; Yanai, T.; Nakano, M.; Fukunaga, H. Uniaxial magnetization performance of textured Fe nanowire arrays electrodeposited by a pulsed potential deposition technique. Nanoscale Res. Lett. 2017, 12, 598. [Google Scholar] [CrossRef]
Figure 1. Cathodic polarization curve for the electrodeposition of ZnTe from an aqueous solution containing ZnSO4·7H2O (0.1 M), TeO2 (0.002 M), sodium sulfate (0.5 M), citric acid (0.05 M), and sodium citrate (0.05 M) (a). The solution pH and temperature were set to ca. 4.0 and 313 K, respectively. The effect of the cathode potential on Zn content in the electrodeposits was also shown in Figure 1 (b).
Applsci 11 10632 g001
Figure 2. Effect of annealing temperature on the surface appearance of electrodeposited ZnTe thin films onto ITO glass substrates. As-deposited samples (a) were annealed at 653 K (b), 663 K (c), 673 K (d), and 683 K (e) for 5 h.
Applsci 11 10632 g002
Figure 3. SEM images of ZnTe thin films with as-deposition (a) and annealing at 683 K for 5 h (b). The sample was electrodeposited at the cathode potential of −0.8 V.
Applsci 11 10632 g003
Figure 4. Effect of the annealing temperature on the X-ray diffraction profiles of electrodeposited ZnTe thin films onto ITO glass substrates. The as-deposited sample (a) was annealed for 5 h at 653 K (b), 663 K (c), 673 K (d), and 683 K (e). Cu-Kα radiation was used as the X-ray source (40 kV; 30 mA) and the scan rate of the goniometer was set to 5 degrees per minute.
Applsci 11 10632 g004
Figure 5. Effect of the annealing temperature on the UV-VIS absorption spectra (a) and the (αhν)2 vs. hν plot for determining the energy band gap (b) of electrodeposited ZnTe thin films onto ITO glass substrates. The ZnTe thin films were annealed at 653 K and 683 K.
Applsci 11 10632 g005
Figure 6. Effect of annealing temperature on the energy band gap (a) and resistivity (b) of electrodeposited ZnTe thin films onto ITO glass substrates.
Applsci 11 10632 g006
Figure 7. Fabrication process of ZnTe nanowires array using a template electrodeposition technique. Commercially available ion-track etched polycarbonate membrane filters were used as a nanochannel template. The aqueous electrolytic solution was synthesized from ZnSO4·7H2O (0.1 M), TeO2 (0.002 M), sodium sulfate (0.5 M), citric acid (0.05 M), and sodium citrate (0.05 M). The solution pH and temperature were set to ca. 4.0 and 313 K, respectively.
Applsci 11 10632 g007
Figure 8. Time dependence of the cathode current during the electrodeposition of ZnTe nanowires in anodized aluminum oxide membranes (a). The effect of the cathode potential on the growth rate of ZnTe nanowires in anodized aluminum oxide membranes (b).
Applsci 11 10632 g008
Figure 9. SEM images of the ZnTe nanowires array that were electrodeposited into the nanochannels of the ion-track etched polycarbonate membrane (a) and anodized aluminum oxide membrane (b).
Applsci 11 10632 g009
Publisher’s Note: MDPI stays neutral with regard to jurisdictional claims in published maps and institutional affiliations.

