Article

Anodic Alumina Membranes: From Electrochemical Growth to Use as Template for Fabrication of Nanostructured Electrodes

Dipartimento di Ingegneria, Università degli Studi di Palermo, 90128 Palermo, Italy
*
Author to whom correspondence should be addressed.
Appl. Sci. 2022, 12(2), 869; https://doi.org/10.3390/app12020869
Submission received: 19 December 2021 / Revised: 8 January 2022 / Accepted: 11 January 2022 / Published: 15 January 2022
(This article belongs to the Special Issue Nanoscale Assembly and Integration for Applications)

Abstract

:

Featured Application

The high order degree of the porous structure of anodic alumina membrane (consisting of a close-packed array of columnar hexagonal cells, each containing a central cylindrical pore normal to the surface), makes it an ideal template for fabrication of nanostructured materials, suitable for applications in optoelectronics, sensors, magnetic memories and electronic circuits. A variety of nanostructures (metals, alloys, semiconductors, oxides and polymers) with different morphologies (tubules, wires, rods) were fabricated by utilizing an anodic alumina membrane as a template using a sol-gel process, microwave plasma chemical vapor deposition, electrodeposition and electroless deposition.

Abstract

The great success of anodic alumina membranes is due to their morphological features coupled to both thermal and chemical stability. The electrochemical fabrication allows accurate control of the porous structure: in fact, the membrane morphological characteristics (pore length, pore diameter and cell density) can be controlled by adjusting the anodizing parameters (bath, temperature, voltage and time). This article deals with both the fabrication and use of anodic alumina membranes. In particular, we will show the specific role of the addition of aluminum ions to phosphoric acid-based anodizing solution in modifying the morphology of anodic alumina membranes. Anodic alumina membranes were obtained at −1 °C in aqueous solutions of 0.4 M H3PO4 added with different amounts of Al(OH)3. For sake of completeness, the formation of PAA in pure 0.4 M H3PO4 in otherwise identical conditions was also investigated. We found that the presence of Al(OH)3 in solution highly affects the morphology of the porous layer. In particular, at high Al(OH)3 concentration (close to saturation) more compact porous layers were formed with narrow pores separated by thick oxide. The increase in the electric charge from 20 to 160 C cm−2 also contributes to modifying the morphology of porous oxide. The obtained anodic alumina membranes were used as a template to fabricate a regular array of PdCo alloy nanowires that is a valid alternative to Pt for hydrogen evolution reaction. The PdCo alloy was obtained by electrodeposition and we found that the composition of the nanowires depends on the concentration of two metals in the deposition solution.

1. Introduction

Fabrication of porous aluminum oxide (PAA) has been extensively investigated owing to both theoretical [1,2,3] and applicative interest [4]. The key feature distinguishing PAA is the oxide morphology consisting of self-assembled ordered arrays of hexagonal cells with a central cylindrical channel vertically oriented throughout oxide thickness. The porous layer overlays the initial formed compact aluminum oxide (barrier layer) [5]. Under continuing anodizing, pore develops on the barrier film as evidenced by the change in the current vs. time plot [3]. Figure 1 shows a scheme of the ordered porous structure of PAA where the underlying barrier layer is clearly visible. All the structural parameters, such as the thickness of the barrier layer, diameter of the pores and size of the cells correlate with the anodizing voltage, with values of the order 1 nm V−1. The precise values depend upon parameters such as current density and electrolyte composition, while the porous layer thickness depends on the charge passed during anodizing [6].
Over the years, several models have been proposed on the formation mechanism of the porous structure [7,8,9,10]. Structural parameters of the PAA layer are dependent on anodizing conditions (such as voltage, current, bath temperature, surface finishing of aluminum, and so on), different reaction rates between pore bottom and pore walls, the time evolution of the current density, and scalloped shape of the barrier layer were successfully predicted by modeling and simulating self-ordering process in PAA [11,12,13,14,15].
The key issue for PAA fabrication is the easy control of morphological features by adjusting the anodizing conditions of aluminum so that tailored porous layers can be fabricated according to the desired application [16,17,18,19,20,21,22,23]. Some procedures were shown above leading to well-ordered structures such as either multi-step or pre-textured aluminum anodizing [22,24,25,26]. Fabrication of such a highly ordered porous structure was investigated for applications in the field of optoelectronics and sensors [27,28,29,30]. Other anodizing conditions lead to less ordered structures that can be used for the fabrication of templates because the pore size is more relevant than the order degree for many applications in the field of nanotechnology [31,32,33]. For instance, materials for either energy storage or catalysis require high surfaces exposed to the reaction environment rather than highly ordered structures [34,35,36,37,38,39,40,41,42,43]. The aluminum anodization can be conducted in only one step, adjusting the pore size from 18–20 nm by 20 ÷ 25 V anodizing in 1.5 M H2SO4 to 180 ÷ 220 nm by 160 ÷ 200 V anodizing in 0.4 M H3PO4. Intermediate pore diameters (~70 nm) can be achieved by anodizing in 0.45 M oxalic acid. Additionally, the pore aspect ratio (length/width) can be easily controlled by adjusting the passed electrical charge, while the inter-pore distance can be varied in dependence on anodizing voltage, typically, in the interval 2.5 ÷ 2.8 nm V−1 [44,45].
One simple way for controlling the PAA morphological parameters consists in adjusting the composition of the anodizing bath. Therefore, in the following, the attention will be focused on the fabrication of PAA in 0.4 M H3PO4 aqueous solutions added with different amounts of Al(OH)3. In comparison with PAA grown in pure 0.4 M H3PO4 [46], different morphologies were found due to the specific influence of Al(OH)3 concentration and electrical charge of anodization. Therefore, it is possible to modify the PAA morphology by a simple variation of both bath composition and anodizing time, so widening the effective use as a template. To our best knowledge, aluminum anodization in pore-forming acid added with aluminum hydroxide is investigated for the first time. The interest in this type of mixed electrolyte is due to the mechanism of PAA formation. Despite there not being agreement about a detailed model of pore formation and growth, there is general agreement about oxide dissolution accompanying PAA formation. Therefore, it is expected that the presence of aluminum ions in solution can affect the oxide dissolution during anodizing and, consequently, PAA morphology.
PAA has found increasing diffusion as a template for nanostructured materials [20,31,41,45,47,48], for applications in microelectronics [49,50], solar cells [30,51,52,53], filtration [16,54,55], batteries [56,57,58,59], separation of biomolecules [60,61], catalysts [62,63], and other bio-medical sectors [64,65]. The success of PAA as the template is due to its easy dissolution after the filling up of the pores, leading to 1D parallel and perpendicular nanostructures. Moreover, it is possible to tune the nanohole interval by adjusting the anodizing conditions [66]. Tailoring the template morphology is of great advantage because makes otherwise impossible applications. For instance, some materials with high specific energy cannot be used as anodes in Li-ion batteries owing to the risk of a rapid pulverization due to the mechanical stresses induced by the cycling volume changes accompanying intercalation/de-intercalation of Li. It was found that such a limitation can be overcome by employing the same materials at nano-scale [67,68] because 1D nanostructures can accommodate the mechanical stress owing to the void space allowing free expansion of the single nanostructure during the intercalation (charging cycles).
Among the several fabrication methods employed for template synthesis [18,69,70,71], electrochemical methods using alumina are very attractive, because simple and versatile. These techniques were used for the fabrication of different materials with nanotubes (NTs) or nanowires (NWs) morphology [38,72,73,74].
In this work, the PAA membranes obtained in 0.4 M H3PO4 were used as a template to obtain, by electrodeposition, nanostructured arrays of Pd, Co and PdCo alloys. Depending on deposition conditions either NTs and NWs were obtained. These materials were selected because having good magnetic properties [75], high electrocatalytic activity [76], they are also excellent sensors for hydrogen gas [77,78].

2. Materials and Methods

PAA were grown by aluminum foil (99.99%) anodization in mixed phosphoric acid/aluminum hydroxide bath whose composition was 0.4 M H3PO4 added with Al(OH)3 at different concentration, from 0.04 M to 0.095 M, and 0.13 M. For comparison, the PAA morphology obtained by aluminum anodization in pure 0.4 M H3PO4 aqueous solution was also investigated. Prior to the anodizing, aluminum foils were degreased with acetone and electropolished in a stirred 4:1 mixture of ethanol and 60% perchloric acid for 5 min at 20 V and temperature below 10 °C, followed by ultrasonic rinsing in a cold ethanol bath for 5 min, and then in cold distilled water for 5 min. Anodization was carried out in a thermally insulated bath at 0 ± 1 °C vigorously stirred by a magnetic needle to maintain uniform temperature on the electrode surface. The low electrolyte temperature was selected in order to form hard and abrasion-resistant anodic layers [4] that are highly desirable in PAA membranes because they are largely handled for any final use. The two-electrode cell for aluminum anodizing was powered at the constant voltage of 160 V for different times, in order to let pass electrical charges from 20 to 160 C cm−2.
Before anodizing, aluminum mass to be anodized was carefully determined by weighing, while the oxidized mass was evaluated by difference between the initial mass, expressed as Al2O3, and PAA mass formed. Since the two values were found to be different, the total consumed aluminum was evaluated and also anodizing efficiency was determined as the ratio of PAA molar mass to oxidized aluminum molar mass (expressed as Al2O3). The PAA layer detached from the un-oxidized aluminum was weighed after having been again and again washed with distilled water and then dried overnight at 60 °C. The weight values of both aluminum and PAA were accepted when weighing was stable within ±5%. The remnant metal was dissolved chemically in 0.1 M CuCl +20% w/w HCl mixture, while the opening of the pore bottom (alumina barrier film) was achieved by chemical etching in aqueous 1 M NaOH solution. The weight measurements were performed employing a SARTORIUS microbalance (mod. Premium Microbalance ME36S).
At acidic pH, more or less hydrated Al3+ ions are present in solution by dissociation of Al(OH)3 that is sparingly soluble in aqueous solutions. The true concentration of aluminum ions in solution was evaluated by back-titration with 0.0101 M ZnNO3•6H2O [79]. A large excess of a standard solution of 0.0101 M EDTA was added to the solution containing Al(OH)3 whose pH was buffered at 5 by CH3COONa/CH3COOH. Xylenol orange was used as indicator. The saturation value of Al(OH)3 in 0.4 M H3PO4 solution was evaluated by the same procedure and it was found to be 0.138 M, slightly higher than the maximum concentration employed in aluminum anodizing (0.13 M).
Characterization of the porous layers was basically conducted by a Field Emission Gun Scanning Electron Microscopy (FEG-SEM). In particular, an FEI QUANTA 200 FEG-ESEM electron microscope was used and both section and plan views were examined. Prior to inserting samples into the microscope chamber, they were gold-sputtered, even if in some cases the environmental option of the microscope was preferred in order to avoid morphological tricks due to the gold film.
For the fabrication of nanostructures, in order to make the template electrically conductive, a thin film of Au was sputtered on one side of the membrane. Then membrane was mounted onto copper support by means of a conductive paste and the active surface (about 1 cm2) was delimited by means of an insulating lacquer. Electrochemical experiments were performed using a P.A.R. Potentiostat/Galvanostat (mod. PARSTAT 2273) using a standard three-electrode cell, with a platinum mesh and a saturated calomel electrode (SCE) as counter and reference electrode, respectively. Nanostructures were obtained by galvanostatic deposition at –1 mA cm−2.
Analytical grade reagents and distilled water were used to prepare all solutions. As Pd precursor Pd(NH3)4(NO3)2 was used while CoSO4 was employed for Co. Different concentrations of these salts were dissolved to prepare the electrodeposition baths. A fresh solution was used for each experiment, and it was stirred during the electrodeposition process. In order to vary nanostructures length, depositions were performed at different electrodeposition times. Chemical composition and morphology of nanostructures were investigated by FESEM, energy dispersive spectroscopy (EDS), and X-ray diffraction (XRD). For XRD a RIGAKU X-ray diffractometer (model: D-MAX 25600 HK) was used. The patterns were obtained in the 2θ range from 10° to 100° with a sampling width of 0.004° and a scan speed of 3 deg./min, using Ni-filtered Cu Kα radiation (λ = 1.54 Å).

3. Results and Discussion

3.1. Fabrication and Characterization of AAM

The effect of the addition of Al(OH)3 is clearly evidenced in Figure 2 where aluminum mass oxidized and PAA moles formed are plotted vs. bath composition. The two curves shown in Figure 2a clearly evidence that the oxidized aluminum is partially converted into PAA, therefore a dissolution process must occur for accounting of the aluminum mass unconverted into PAA. Consequently, the aluminum anodizing occurs with an efficiency less than 1, whose values depend on Al(OH)3 concentration in the electrolyte, as shown in Figure 2b evidencing that the maximum efficiency of 80 ± 5% is attained for 0.13 M Al(OH)3. The findings of Figure 2 can be attributed to a variation in the dissolution extent of the anodic oxide as the concentration of Al(OH)3 increases. The most likely cause of such a variation is the common ion effect that controls the solubility of any sparing substance in a solution that contains an ion in common [80].
The influence of Al(OH)3 concentration on PAA morphology is evidenced in Figure 3 where FESEM images are reported for the lowest and highest anodizing electrical charges. In detail, Figure 3b,d show the top (outer surface) views of PAA grown at 160 V in 0.4 M H3PO4 and 0.04 M Al(OH)3 for 20 (b) and 160 C cm−2 (d), while Figure 3a,c show the typical morphology of the pore base formed at the interface metal/oxide (inner surface). Each geometrical unit discloses the shape and size of the cell featuring the structure of PAA [3]. Ideally, such units should be hexagonal with size depending on the anodizing voltage at a value of about 433.2 nm [6], whereas, in the present case, they are not uniform in either shape or size. The cells present a pentagonal shape, prevalently, while the few hexagonal cells are not regular in the shape with variable inter-pore distances. The most relevant issue is the cell population independence of the passed charge since values of 6.5 × 10¹² cells m−2 were always found. On the contrary, the surfaces exposed to the solution show more relevant differences (Figure 3b,d). After 20 C cm−2, different pores for shape and size, and randomly distributed over the surface are clearly distinguishable. Typically, a mean diameter of about 60 ± 5% nm was measured. Differently, after 160 C cm−2, the surface shows a more regular structure with pores of a rather uniform size, prevalently circular in shape with a mean diameter of about 167 ± 5% nm. Some ellipsoidal pores are also evident whose formation can be attributed to the coalescence of neighboring circular pores due to the chemical dissolution of the inter-pore oxide owing to the long exposure time to the solution. Hence, pores with a higher diameter and more regular shape were formed at 160 than 20 C cm−2.
As the Al(OH)3 concentration was increased from 0.04 M to 0.095 M in otherwise identical conditions, the PAA morphology for 20 C cm−2 is shown in the images of Figure 4. The inner surface, in contact with the metal (Figure 4a), is identical to that of Figure 3a with a cell population value of 6.5 × 10¹² m−2. The outer surface, in contact with the electrolyte (Figure 4b), discloses, in comparison with Figure 3b, a reduction of about 10 nm in the pore mean size, from 62.5 ± 5% to 51.68 ± 5%, together with a thickening of the inter-pore oxide. It means that the increase in Al(OH)3 concentration from 0.04 M to 0.095 M promotes the formation of more compact porous layers with narrower pores, in accordance with the solubility decrease whose trend is shown in Figure 2. As the passed charge was increased from 20 to 160 C cm−2 in 0.4 M H3PO4 and 0.095 M Al(OH)3, the inner surface shows identical morphology with the same cell density of 6.52 x 10¹² m−2, while the outer surface discloses a non-uniform distribution of circular pores a few of which ellipsoidal.
Table 1 gives an overview of the influence on PAA morphological features of bath composition and electrical charge passed during aluminum anodizing at 160 V and 0 °C. The pore mean diameter of PAA formed in 0.4 M H3PO4 and 0.095 M Al(OH)3 after passing 160 C cm−2 is 104 ± 5% nm, a value far higher than the 51.68 ± 5% nm evaluated at 20 C cm−2 in the same anodizing conditions. Hence, Table 1 evidences that the increase in both charge passed and Al(OH)3 concentration have the opposite effect because the first one promotes pore enlargement, while the second one favors pore narrowing. Figure 5 more clearly shows such behavior since it is possible to draw valuable information by the slopes of the curves. Figure 5a shows that the curve at 160 C cm−2 is more sloping than those at lower charge density. This means that the longer time in solution greatly affects the decrease in pore size. It is also interesting to observe that the pore size of the PAA layers formed at 160 V in 0.4 M H3PO4 and 0.13 M Al(OH)3 are practically identical, independently of the charge passed. Such an effect is confirmed by Figure 5b, showing that pore population increases with Al(OH)3 concentration up to about 0.095 M, then it sharply decreases to 0.13 M Al(OH)3 where the pore population values are practically identical for all passed charges.
The slopes of the curves of Figure 5a evidence that the progressive decrease in the pore size with Al(OH)3 concentration is much greater at 160 C cm−2 (about 69.2%), while it is slight at 20 C cm−2 (about 38.5%). On the contrary, the pore population decreases by 49% from 0.0 M to 0.13 M Al(OH)3 at 20 C cm−2, while an increase of about 15% was found in the same concentration interval for sample anodized at 160 C cm−2. Moreover, Figure 5b shows that the pore population decreases as the passed charge increases from 20 to 160 C cm−2 at constant Al(OH)3 concentration with the exception of 0.13 M, where the pore population values are similar, practically.
A strict coherence with the curves of Figure 5 can be found in Figure 6, which shows the FESEM images of sample anodized at 0.13 M Al(OH)3, corresponding to the most external point of the curves of Figure 5. In detail, Figure 6 shows the outer surface of PAA formed at 160 V and 0 °C in 0.4 M H3PO4 and 0.13 M Al(OH)3 after passing 20 (a), 40 (b), 80 (c), and 160 C cm−2 (d). It can be observed that more compact layers were formed with passed charge as the concentration of Al(OH)3 was increased. Besides, at 20 C cm−2 (Figure 6a), the surface shows irregular shape pore distributed on the surface, while, at 160 C cm−2 (Figure 6d), the surface morphology appears more structured with an enlarged pore entrance with a more regular shape. Figure 6d shows also the presence of micro-cavity likely due to local oxide dissolution promoting the onset of new pores.
Since the increase in charge densities are obtained through longer anodizing times, i.e., longer times in solution, the obtained PAA morphologies can be explained in light of this parameter by considering anodic oxide dissolution during anodizing. Without any attention to argue about the various mechanisms proposed for PAA formation, and above cited, the findings appear consistent with the occurrence of oxide dissolution during anodizing. Otherwise, it should be impossible to explain the curves of Figure 2a whose difference gives just the oxide dissolution extent. The major obstacle in invoking oxide dissolution under anodizing is the flow model of formation of PAA that excludes dissolution [7,81]. However, the successive in-depth investigation showed the possible coexistence of oxide dissolution under a high electrical field with the flow model, because oxide dissolution has been attributed to field-induced instability, while mechanical instability has been invoked for the oxide flow [8]. On this basis, it is possible to elucidate tentatively the influence on PAA morphology of Al(OH)3 at constant charge density, and of charge density at constant Al(OH)3 concentration. In the first case, the addition of Al(OH)3 to phosphoric acid determines the growth of a more compact oxide because the oxide dissolution during anodizing is progressively inhibited, owing to the ion common effect. Therefore, pore size decreases because the growth of a more compact oxide determines the shrinkage of the channels due to the wall thickening. Such a decrease is more significant at 160 C cm−2 owing to the longer anodizing time, as shown in Figure 5a. In addition, the practical pore mean size independence of charge passed at 0.13 M Al(OH)3 is likely due to the close of this concentration value to the saturation one (0.138), where the oxide dissolution is hardly inhibited, independently of anodizing time. According to oxide dissolution over anodizing, it is possible to explain also the variations of pore size and population with the passed charge at constant Al(OH)3. As the anodizing time increases, pore mean size increases because oxide dissolution can occur at a higher extent with consequent enlargement of pore mouth (Figure 5a), while pore population decreases because the narrowest pores generated at the initial stages of anodizing are subject to closure by the formation of the more compact film. Therefore, anodizing time (i.e, passed charge) has two opposite effects because determines on the one hand enlargement of the pore with consequent size enhancement, but on the other hand it causes the closure of the narrowest pores.
About the generation of new pores over anodizing, Figure 5b shows an increase in pore population with Al(OH)3 up to 0.095 M, where a sharp decrease to 0.13 M starts towards values that are independent of the passed charge. Likely, such a behavior can be explained by inferring that the pore onset occurs prevalently in the first stages of anodizing. The pore population variation with Al(OH)3 concentration is rather limited, with the exception of 160 C cm−2 where the greatest variation was found (from 0.69 to 1.67 m−2). The increase in population up to 0.095 M could be likely attributed to the opening of some new but shallow pores. Such a new pore generation will occur at a higher extent as the longer is the electrode immersion time in solution (just 160 C cm−2). This interpretation is supported by the difference between the pore population at the outer PAA surface and the cell population at the bottom one. One pore should be located inside one cell, therefore the two values of the population should be identical, but this is not, as shown in Table 1. In practice, only the pore generated in the first instants of anodizing leaves its imprint on the aluminum, whose surface consequently becomes scalloped. Over anodizing, additional pores are generated at the oxide/electrolyte interface, but their height is lower than the initially formed ones, which are separated from the oxidizing aluminum by the barrier layer. In practice, two types of channels are formed, which can be distinguished on the basis of their length. Initially formed pores that extend throughout the PAA thickness, and successively formed pores that stop their growth at different depths of penetration into the oxide layer. Such a difference can be attributed to the electric field strength that, according to the most recent literature [82,83], contributes to the growth of the initially formed pores, because the oxide barrier layer is thin, and, consequently, the electric field reaches high strength values. On the contrary, as the PAA layer is thickening, the electric field strength is diminishing, and with it, the contribution to the channel’s growth. Figure 7 shows a schematic diagram of PAA with pores that stop its growth at some depth inside the oxide layer. Such a scheme justifies the difference between the pore population evaluated at the PAA surface in contact with the electrolyte and cell density evaluated at the PAA surface in contact with aluminum. As a consequence, a few ordered nanostructure is formed with channels of different lengths.
The scheme of Figure 7 is confirmed by the FESEM images of Figure 8 where sectional views of PAA formed at 160 V and 0 °C in different electrolytes are shown. Channels of different heights are evident. It can be also observed that the thickness of the pore wall increases with the concentration of Al(OH)3 in solution, so that, for instance, the channel-free cross-section is heavily reduced as PAA is formed in 0.4 M H3PO4 and 0.13 M Al(OH)3. Moreover, Figure 8 shows that also the morphological disorder of the PAA layer increases with Al(OH)3 concentration likely owing to a non-uniform thickening of the pore wall, determining the loss of parallelism between the channels. A more in-depth analysis of the images of Figure 8 indicates that the most ordered PAA layers can be obtained by anodization in 0.4 M H3PO4 and 0.04 M Al(OH)3 (Figure 8b), even if the order degree of Figure 8a appears satisfying. Its drawback is the very low thickness of the PAA layer which is about 6.4 ± 5% µm as shown in Table 2 where the PAA layer thickness is shown for the different anodizing conditions.
In order to better evidence the effect of Al(OH)3 addition to 0.4 M H3PO4 aqueous solutions, the morphology of PAA formed in pure 0.4 M H3PO4 was also investigated, in otherwise identical conditions. Really, a similar study was already conducted, but the attention was focused on tailoring the PAA as a template for fabrication of Ni nanostructured array [46], while in the present case, the investigation has been aimed to compare the morphology of PAA formed at different anodizing times in bath containing different Al(OH)3 amounts. Figure 9, to be compared with Figure 3, shows the morphological features of the inner and outer surface after passing 20 and 160 C cm−2. It can be observed that narrow pores are distributed on the outer surface formed at 20 C cm−2. They are not uniformly distributed on the surface, and their shape and diameter are rather variable. After 160 C cm−2, a relevant modification occurred due to the large dissolution of the inter-pore oxide leading to a strong increase in the pore size also enhanced by the probable coalescence of neighboring pores. As a consequence, a highly porous surface is formed.
The micrographs of the inner surface (Figure 9a,c) show the formation of well-defined cells, even if they are rather irregular in shape and size. The comparison of the two images clearly discloses that the electric charge passed did not affect cell shape and population that is fixed at 6.5 × 10¹² m−2, i.e., the same value found for PAA formed in mixed 0.4 M H3PO4 and Al(OH)3. It is noteworthy that, also in pure H3PO4, the cell population is less than the pore population independently of the passed electric charge. This means that, also in pure 0.4 M H3PO4, the channels do not have the same height, but only some of them extend through the total thickness of PAA, while other ones stop their growth, such as those shown in Figure 7 and Figure 8.
The pore diameter distribution on the outer PAA surface is shown in Figure 10 for different anodizing conditions. It can be observed that at the lowest concentration of Al(OH)3, pore diameters change from about 40 nm at 20 C cm−2 to 160 nm at 160 C cm−2. In addition, a bimodal distribution is distinguishable at the lowest charge with a second peak at about 70 nm. Additionally, at higher Al(OH)3 concentration (Figure 10b), a bimodal distribution appears at 20 C cm−2, but, in this case, the most intense peak is the second one at about 50 nm, while the weaker one is at about 40 nm. In any case, Figure 10 confirms that PAA morphology formed at higher Al(OH)3 concentration changed slightly with the electric charge. In fact, the distribution curves are partially overlapped, with the exception of the curve relative to 160 C cm−2 that is centered around 100 nm and is distinct from the other ones. It is also interesting to emphasize the decrease in the pore population as the electric charge was increased. In pure 0.4 M H3PO4 solutions, a bimodal distribution has been found at 20 C cm−2, with two peaks of the same intensity centered at 65 and 100 nm, respectively. At 160 C cm−2, the distribution curve is centered around 200 nm, which is the highest pore diameter obtainable in all the investigated solutions [46]. Finally, it has to be observed that all the distribution curves are rather narrow, independently of both solution composition and charge passed.
For better detailing the influence of passed charge on PAA porosity, the pore mean size has been plotted as a function of charge density for different Al(OH)3 concentrations, Figure 11. The useful information by such a plot is the slope of the curves because it is clear evidence of how strong the effect is of the passed charge on the pore size. For instance, it can be observed that the mean pore diameter changes very little with electrical charge density at 0.13 M, while it is very significant at 0.04 M. Since the passed electrical charge is linked to the anodizing time, the slopes of Figure 11 curves provide the rate of variation of pore size during anodizing, in practice. Therefore, such a plot is another valuable tool for tailoring PAA layers according to the desired application.
Table 1 and Table 2 summarize the morphological features of PAA formed at 160 V and 0 °C in mixed Al(OH)3 and 0.4 M H3PO4 electrolytes, therefore can be considered as useful guidelines for PAA designing, while plots and SEM pictures provide more in-depth details. At this aim, it must be taken into account that the increase in Al(OH)3 concentration leads to the growth of compact PAA featured by small, and not uniformly distributed pores, each other separated by a more or less thick oxide. In particular, at the highest concentration of Al(OH)3, extended areas of the surface are covered by a compact oxide that may be considered as a further evident confirmation that pore generation and development strongly depend on the extent of oxide dissolution on anodizing. Additionally, the morphological modification of PAA with the electric charge can be attributed to the oxide dissolution. In fact, the passage of higher electric charge implies a longer time of exposure of the oxide surface to the solution with consequent enhancement of chemical dissolution of alumina leading to an enlargement of the pore mouth. Of course, this effect should be more relevant when Al(OH)3 concentration is lower. This assumption is just confirmed by the distribution curves of Figure 10, showing that the range of variation is more extended at a low concentration of Al(OH)3. In particular, the most significant modification occurred for anodizing in pure 0.4 M H3PO4, even if it must be emphasized that after 160 C cm−2, a high population of the coalesced pore was found, due to the complete dissolution of the inter-pore oxide. Additionally, the difference between outer and inner pore populations can be explained in terms of Al(OH)3 concentration in solution. A schematic view of the channel length accounting for such differences is reported in Figure 7, disclosing the presence of channels with different lengths.

3.2. Fabrication and Characterization of Nanostructures

For the fabrication of PdCo nanostructures, the membranes obtained in 0.4 M H3PO4 and 160 C cm−2 were used. Nanostructures were obtained in galvanostatic conditions, at −1 mA cm−2 and for a deposition time of 1 h. In addition to PdCo alloys, for comparison, also nanostructures of Pd and Co were prepared using the same conditions. Before the electrodeposition, a surface of PAA membrane was sputtered with a thin gold layer in order to make it conductive. To obtain the PdCo alloy with different compositions, different electrodeposition baths were used simply changing the Pd2+/Co2+ ratio. Dilute solutions were also used in order to study the influence on nanostructure morphology and composition. All samples were characterized by FESEM, EDS and XRD and the results were summarized in Table 3.
As concern the morphology, in concentrated solutions, the deposits consist of highly ordered and parallel NWs, perfectly replicating the structure of AAM, and thus with an average diameter of about 200 nm and a density of about 1013 m−2, coincident with that of the cylindrical channels. NWs length can be controlled by tuning the electrodeposition time. Indeed, we have verified that, after two hours of deposition, keeping all the other conditions the same, nanostructures have a mean height of about 100% higher than those obtained after 1h of deposition. In the case of diluted solution, arrays of NTs were formed. The NTs have an extremely thin wall, and in fact, appear almost transparent. We observed that the wall thickness can be controlled by increasing the concentration of Pd2+ and Co2+ in the deposition bath. This aspect is important because it allows for increasing the mechanical stability of the NTs, which, when they have a too-thin wall, tend to crumble during the dissolution of the alumina template. The elemental composition of the alloy was determined by EDS. In all spectra, apart from Pd and Co peaks, peaks of Al and O, coming from alumina template, and Au, due to the gold-sputtered layer, can be observed. The composition of the alloy clearly depends on the composition of the bath with a dependence that is roughly linear. Therefore, by simply controlling the Pd2+/Co2+ ratio in solution, it is possible to obtain alloys rich in Pd in Co or with approximately similar content of the two metals. Using dilute solutions, but maintaining the same Pd/Co ratio, the composition of the nanostructures does not change.
Interesting results were obtained from the XRD study. The crystallographic structure of nanostructures changes with their composition. In particular, pure Pd NWs are polycrystalline. The XRD pattern, apart from Au diffraction peaks, due to the gold-sputtered layer, shows the presence of all diffraction peaks of the face-centered cubic phase of Pd metal [84]. Co NWs are instead completely amorphous according to the data reported in [67]. Obviously, the tendency of cobalt to deposit amorphously affects the crystallinity of the alloy. In the case of alloys rich in Pd, the NWs are crystalline and practically have the same diffraction pattern as the pure Pd NWs. As the Co content increases, the crystallinity of the NWs decreases, and in fact, the intensity of the diffraction peaks of Pd decreases, which disappear completely in the alloy’s rich in Co. In this case, the diffraction pattern is that typical of amorphous material and therefore completely similar to that of the NWs of pure Co. The dilution of the deposition solution has no effect on the crystallinity of the nanostructures, and in fact, keeping all the other deposition conditions the same, XRD patterns similar to those discussed so far are obtained.

4. Conclusions

The fabrication of PAA to be used as a template for the synthesis of nanostructured materials was studied. Particular attention has been devoted to evidence the morphological features of PAA when aluminum is anodized in 0.4 M H3PO4 added with various amounts of Al(OH)3. For a more complete elucidation of the PAA fabrication process, the kinetic behavior of aluminum anodizing in the pure and mixed electrolyte has been considered. The role of both Al(OH)3 concentration and electrical charge on PAA growth can be explained on the basis of the extent of oxide dissolution into the electrolyte, over anodizing, so that it appears as a key parameter in controlling both the growth kinetics and morphology of PAA. As the Al(OH)3 increased, more structured porous layers were formed that could be further modified by changing the anodizing electric charge. In particular, the increase in the electric charge implies a longer exposure time of the outer oxide surface to the electrolyte with consequent enhancement of chemical dissolution.
The Al(OH)3 concentration also controls the development of secondary pore, i.e., pores generated at the oxide/electrolyte interface after the complete development of the PAA layer. Their growth is due almost exclusively to oxide chemical dissolution with minor contribution by an electric field because its strength is diminishing as the PAA thickness is increasing. As a consequence, the growth of these pores stops after partial penetration into the PAA layer. This can be due to the saturation of the electrolyte contacting the base of the growing channel because the onset and propagation of the secondary pores are controlled by chemical dissolution. The secondary pores greatly contribute to the PAA disorder, which can be eliminated by re-anodizing the scalloped aluminum surface obtained after removing the disordered oxide layer formed by first anodizing.
In conclusion, it can be said that aluminum anodizing in mixed Al(OH)3 and 0.4 M H3PO4 suggests another cheap and easy way for fabricating PAA that can be used as a template when a high level of order is not required. The flexibility of the procedure, in terms of aspect ratio values that can be accomplished, is very high, so that tailoring of PAA for each specific application is possible.
PAA obtained in 0.4 M of H3PO4 was used as a template for fabrication of nanostructured arrays of Pd, Co and PdCo alloys. Pd NWs have a polycrystalline nature while Co NWs present a completely amorphous structure. The composition of the alloy was controlled by adjusting the electrolyte composition. The content of Co influences the crystallinity of the NWs. In fact, polycrystalline NWs following the diffraction peaks of Pd were obtained in the case of a low Co content, while a practically amorphous alloy was obtained in the case of a high Co content. Very dilute solutions lead to the formation of an alloy with crystallinity and composition similar to the concentrated solution which has a completely different morphology formed by an array of nanotubes.

Author Contributions

Conceptualization, B.P. and R.I.; methodology, R.I. and B.P.; validation, R.I. and B.P.; investigation, R.I. and B.P.; data curation, R.I. and B.P.; writing—original draft preparation, C.S. and R.I.; writing—review and editing, R.I., and B.P.; supervision, S.P., C.S. and R.I. All authors have read and agreed to the published version of the manuscript.

Funding

This research received no external funding.

Institutional Review Board Statement

Not applicable.

Informed Consent Statement

Not applicable.

Data Availability Statement

Data is contained within the article.

Conflicts of Interest

The authors declare no conflict of interest.

References

  1. Keller, F.; Hunter, M.S.; Robinson, D.L. Structural Features of Oxide Coatings on Aluminum. J. Electrochem. Soc. 1953, 100, 411. [Google Scholar] [CrossRef]
  2. Dell’Oca, C.J.; Pulfrey, D.L.; Young, L. Anodic Oxide Films. In Physics of Thin Films; Elsevier: Amsterdam, The Netherlands, 1971; Volume 6, pp. 1–79. ISBN 978-0-12-533006-0. [Google Scholar] [CrossRef]
  3. Diggle, J.W.; Downie, T.C.; Goulding, C.W. Anodic oxide films on aluminum. Chem. Rev. 1969, 69, 365–405. [Google Scholar] [CrossRef]
  4. Henley, V.F. Anodic Oxidation of Aluminium and Its Alloys: The Pergamon Materials Engineering Practice Series; Elsevier Science: Kent, UK, 2014; ISBN 978-1-4831-4733-8. Available online: http://qut.eblib.com.au/patron/FullRecord.aspx?p=1838701 (accessed on 15 September 2021).
  5. Thompson, G.E.; Wood, G.C. Porous anodic film formation on aluminium. Nature 1981, 290, 230–232. [Google Scholar] [CrossRef]
  6. Wood, G.C.; O’Sullivan, J.P. The anodizing of aluminium in sulphate solutions. Electrochim. Acta 1970, 15, 1865–1876. [Google Scholar] [CrossRef]
  7. Garcia-Vergara, S.J.; Skeldon, P.; Thompson, G.E.; Habazaki, H. A flow model of porous anodic film growth on aluminium. Electrochim. Acta 2006, 52, 681–687. [Google Scholar] [CrossRef]
  8. Oh, J.; Thompson, C.V. The role of electric field in pore formation during aluminum anodization. Electrochim. Acta 2011, 56, 4044–4051. [Google Scholar] [CrossRef]
  9. Poinern, G.E.J.; Ali, N.; Fawcett, D. Progress in Nano-Engineered Anodic Aluminum Oxide Membrane Development. Materials 2011, 4, 487–526. [Google Scholar] [CrossRef] [Green Version]
  10. Patermarakis, G.; Plytas, J. A novel theory interpreting the extremes of current during potentiostatic anodising of Al and the mechanisms of normal and abnormal growth of porous anodic alumina films. J. Electroanal. Chem. 2016, 769, 97–117. [Google Scholar] [CrossRef]
  11. Poznyak, A.; Knörnschild, G.; Karoza, A.; Norek, M.; Pligovka, A. Peculiar Porous Aluminum Oxide Films Produced via Electrochemical Anodizing in Malonic Acid Solution with Arsenazo-I Additive. Materials 2021, 14, 5118. [Google Scholar] [CrossRef]
  12. Cheng, C.; Ngan, A.H.W. Modelling and simulation of self-ordering in anodic porous alumina. Electrochim. Acta 2011, 56, 9998–10008. [Google Scholar] [CrossRef] [Green Version]
  13. Ono, S.; Saito, M.; Asoh, H. Self-ordering of anodic porous alumina formed in organic acid electrolytes. Electrochim. Acta 2005, 51, 827–833. [Google Scholar] [CrossRef]
  14. Lee, W.; Schwirn, K.; Steinhart, M.; Pippel, E.; Scholz, R.; Gösele, U. Structural engineering of nanoporous anodic aluminium oxide by pulse anodization of aluminium. Nat. Nanotechnol. 2008, 3, 234–239. [Google Scholar] [CrossRef]
  15. Lee, W.; Park, S.-J. Porous Anodic Aluminum Oxide: Anodization and Templated Synthesis of Functional Nanostructures. Chem. Rev. 2014, 114, 7487–7556. [Google Scholar] [CrossRef]
  16. Cai, Y.; Chen, D.; Li, N.; Xu, Q.; Li, H.; He, J.; Lu, J. A smart membrane with antifouling capability and switchable oil wettability for high-efficiency oil/water emulsions separation. J. Membr. Sci. 2018, 555, 69–77. [Google Scholar] [CrossRef]
  17. Dai, J.; Singh, J.; Yamamoto, N. Nonbrittle nanopore deformation of anodic aluminum oxide membranes. J. Am. Ceram. Soc. 2018, 101, 2170–2180. [Google Scholar] [CrossRef]
  18. Pakizeh, E.; Moradi, M. Kramers-Kronig method for determination of optical properties of PZT nanotubes fabricated by sol-gel method and porous anodic alumina with high aspect ratio. Int. J. Mod. Phys. B 2018, 32, 1850096. [Google Scholar] [CrossRef]
  19. Aw, M.S.; Bariana, M.; Losic, D. Nanoporous Alumina: Fabrication, Structure, Properties and Applications, 1st ed.; Losic, D., Santos, A., Eds.; Springer Series in Materials Science; Springer International Publishing: Cham, Switzerland, 2015; ISBN 978-3-319-20334-8. [Google Scholar]
  20. Ruiz-Clavijo, A.; Caballero-Calero, O.; Martín-González, M. Revisiting anodic alumina templates: From fabrication to applications. Nanoscale 2021, 13, 2227–2265. [Google Scholar] [CrossRef] [PubMed]
  21. Dobosz, I. Influence of the anodization conditions and chemical treatment on the formation of alumina membranes with defined pore diameters. J. Porous Mater. 2021, 28, 1011–1022. [Google Scholar] [CrossRef]
  22. Zaraska, L.; Jaskuła, M.; Sulka, G.D. Porous anodic alumina layers with modulated pore diameters formed by sequential anodizing in different electrolytes. Mater. Lett. 2016, 171, 315–318. [Google Scholar] [CrossRef]
  23. Roslyakov, I.V.; Chumakov, A.P.; Eliseev, A.A.; Leontiev, A.P.; Konovalov, O.V.; Napolskii, K.S. Evolution of Pore Ordering during Anodizing of Aluminum Single Crystals: In Situ Small-Angle X-ray Scattering Study. J. Phys. Chem. C 2021, 125, 9287–9295. [Google Scholar] [CrossRef]
  24. Masuda, H.; Yamada, H.; Satoh, M.; Asoh, H.; Nakao, M.; Tamamura, T. Highly ordered nanochannel-array architecture in anodic alumina. Appl. Phys. Lett. 1997, 71, 2770–2772. [Google Scholar] [CrossRef]
  25. Masuda, H.; Fukuda, K. Ordered Metal Nanohole Arrays Made by a Two-Step Replication of Honeycomb Structures of Anodic Alumina. Science 1995, 268, 1466–1468. [Google Scholar] [CrossRef] [PubMed]
  26. Sulka, G.D.; Stroobants, S.; Moshchalkov, V.; Borghs, G.; Celis, J.-P. Synthesis of Well-Ordered Nanopores by Anodizing Aluminum Foils in Sulfuric Acid. J. Electrochem. Soc. 2002, 149, D97. [Google Scholar] [CrossRef]
  27. Napolskii, K.S.; Noyan, A.A.; Kushnir, S.E. Control of high-order photonic band gaps in one-dimensional anodic alumina photonic crystals. Opt. Mater. 2020, 109, 110317. [Google Scholar] [CrossRef]
  28. Almasi Kashi, M.; Ramazani, A.; Abbasian, H.; Khayyatian, A. Capacitive humidity sensors based on large diameter porous alumina prepared by high current anodization. Sens. Actuators Phys. 2012, 174, 69–74. [Google Scholar] [CrossRef]
  29. Inguanta, R.; Sunseri, C.; Piazza, S. Photoelectrochemical Characterization of Cu2O-Nanowire Arrays Electrodeposited into Anodic Alumina Membranes. Electrochem. Solid State Lett. 2007, 10, K63. [Google Scholar] [CrossRef]
  30. Inguanta, R.; Livreri, P.; Piazza, S.; Sunseri, C. Fabrication and Photoelectrochemical Behavior of Ordered CIGS Nanowire Arrays for Application in Solar Cells. Electrochem. Solid State Lett. 2010, 13, K22. [Google Scholar] [CrossRef] [Green Version]
  31. Zhou, Z.; Nonnenmann, S.S. Progress in Nanoporous Templates: Beyond Anodic Aluminum Oxide and Towards Functional Complex Materials. Materials 2019, 12, 2535. [Google Scholar] [CrossRef] [Green Version]
  32. Wen, L.; Xu, R.; Mi, Y.; Lei, Y. Multiple nanostructures based on anodized aluminium oxide templates. Nat. Nanotechnol. 2017, 12, 244–250. [Google Scholar] [CrossRef]
  33. Inguanta, R.; Rinaldo, E.; Piazza, S.; Sunseri, C. Lead Nanowires for Microaccumulators Obtained Through Indirect Electrochemical Template Deposition. Electrochem. Solid State Lett. 2010, 13, K1. [Google Scholar] [CrossRef] [Green Version]
  34. Battaglia, M.; Inguanta, R.; Piazza, S.; Sunseri, C. Fabrication and characterization of nanostructured Ni-IrO2 electrodes for water electrolysis. Int. J. Hydrogen Energy 2014, 39, 16797–16805. [Google Scholar] [CrossRef]
  35. Ganci, F.; Cusumano, V.; Livreri, P.; Aiello, G.; Sunseri, C.; Inguanta, R. Nanostructured Ni-Co alloy electrodes for both hydrogen and oxygen evolution reaction in alkaline electrolyzer. Int. J. Hydrogen Energy 2020, 46, 10082–10092. [Google Scholar] [CrossRef]
  36. Patella, B.; Inguanta, R.; Piazza, S.; Sunseri, C. Nanowire ordered arrays for electrochemical sensing of H2O2. Chem. Eng. Trans. 2016, 47, 19–24. [Google Scholar] [CrossRef]
  37. Buccheri, B.; Ganci, F.; Patella, B.; Aiello, G.; Mandin, P.; Inguanta, R. Ni-Fe alloy nanostructured electrodes for water splitting in alkaline electrolyser. Electrochim. Acta 2021, 388, 138588. [Google Scholar] [CrossRef]
  38. Battaglia, M.; Piazza, S.; Sunseri, C.; Inguanta, R. Amorphous silicon nanotubes via galvanic displacement deposition. Electrochem. Commun. 2013, 34, 134–137. [Google Scholar] [CrossRef]
  39. Ganci, F.; Lombardo, S.; Sunseri, C.; Inguanta, R. Nanostructured electrodes for hydrogen production in alkaline electrolyzer. Renew. Energy 2018, 123, 117–124. [Google Scholar] [CrossRef]
  40. Patella, B.; Russo, R.R.; O’Riordan, A.; Aiello, G.; Sunseri, C.; Inguanta, R. Copper nanowire array as highly selective electrochemical sensor of nitrate ions in water. Talanta 2021, 221, 121643. [Google Scholar] [CrossRef]
  41. Inguanta, R.; Ferrara, G.; Piazza, S.; Sunseri, C. Nanostructure fabrication by template deposition into anodic alumina membranes. Chem. Eng. Trans. 2009, 17, 957–962. [Google Scholar] [CrossRef]
  42. Insinga, M.G.; Oliveri, R.L.; Sunseri, C.; Inguanta, R. Template electrodeposition and characterization of nanostructured Pb as a negative electrode for lead-acid battery. J. Power Sources 2019, 413, 107–116. [Google Scholar] [CrossRef]
  43. Inguanta, R.; Amodeo, M.; D’Agostino, F.; Volpe, M.; Piazza, S.; Sunseri, C. Developing a procedure to optimize electroless deposition of thin palladium layer on anodic alumina membranes. Desalination 2006, 199, 352–354. [Google Scholar] [CrossRef]
  44. Ono, S.; Masuko, N. Evaluation of pore diameter of anodic porous films formed on aluminum. Surf. Coat. Technol. 2003, 169, 139–142. [Google Scholar] [CrossRef]
  45. Feng, S.; Ji, W. Advanced Nanoporous Anodic Alumina-Based Optical Sensors for Biomedical Applications. Front. Nanotechnol. 2021, 3, 678275. [Google Scholar] [CrossRef]
  46. Inguanta, R.; Butera, M.; Sunseri, C.; Piazza, S. Fabrication of metal nano-structures using anodic alumina membranes grown in phosphoric acid solution: Tailoring template morphology. Appl. Surf. Sci. 2007, 253, 5447–5456. [Google Scholar] [CrossRef]
  47. Sasikala, N.T.; Boominathasellarajan, S.; Raghupathy, B.P.C. Fabrication of nanostructures using porous anodic alumina template. Int. J. Nanosci. 2011, 10, 783–786. [Google Scholar] [CrossRef]
  48. Zhao, H.; Liu, L.; Lei, Y. A mini review: Functional nanostructuring with perfectly-ordered anodic aluminum oxide template for energy conversion and storage. Front. Chem. Sci. Eng. 2018, 12, 481–493. [Google Scholar] [CrossRef]
  49. Lim, H.R.; Eom, N.S.A.; Cho, J.-H.; Choa, Y.-H. Moisture Gettering by Porous Alumina Films on Textured Silicon Wafer. Korean Chem. Eng. Res. 2015, 53, 401–406. [Google Scholar] [CrossRef]
  50. Wang, G.; Wang, J.; Li, S.-Y.; Zhang, J.-W.; Wang, C.-W. One-dimensional alumina photonic crystals with a narrow band gap and their applications to high-sensitivity concentration sensor and photoluminescence enhancement. Superlattices Microstruct. 2015, 86, 546–551. [Google Scholar] [CrossRef]
  51. Sunseri, C.; Cocchiara, C.; Ganci, F.; Moncada, A.; Oliveri, R.L.; Patella, B.; Piazza, S.; Inguanta, R. Nanostructured electrochemical devices for sensing, energy conversion and storage. Chem. Eng. Trans. 2016, 47, 43–48. [Google Scholar] [CrossRef]
  52. Inguanta, R.; Piazza, S.; Sunseri, C.; Cino, A.; Di Dio, V.; Cascia, D.L.; Miceli, R.; Rando, C.; Zizzo, G. An Electrochemical Route towards the Fabrication of Nanostructured Semiconductor Solar Cells. In Proceedings of the SPEEDAM, Pisa, Italy, 14–16 June 2010; IEEE: Pisa, Italy, 2010; pp. 1166–1171. [Google Scholar]
  53. Genduso, G.; Inguanta, R.; Sunseri, C.; Piazza, S.; Kelch, C.; Sáez-Araoz, R.; Zykov, A.; Fischer, C.-H. Deposition of very thin uniform indium sulfide layers over metallic nano-rods by the Spray-Ion Layer Gas Reaction method. Thin Solid Films 2013, 548, 91–97. [Google Scholar] [CrossRef]
  54. Volpe, M.; Inguanta, R.; Piazza, S.; Sunseri, C. Optimized bath for electroless deposition of palladium on amorphous alumina membranes. Surf. Coat. Technol. 2006, 200, 5800–5806. [Google Scholar] [CrossRef]
  55. Zimer, A.M.; Machado, M.M.P.; Júnior, L.J.D.C.; Ike, P.T.L.; Iemma, M.R.C.; Yamamoto, C.F.; Ferreira, C.F.; Souza, D.H.F.; de Oliveira, C.R.; Pereira, E.C. Optimized Porous Anodic Alumina Membranes for Water Ultrafiltration of Pathogenic Bacteria (E. coli). J. Nanosci. Nanotechnol. 2016, 16, 6526–6534. [Google Scholar] [CrossRef]
  56. Inguanta, R.; Rinaldo, E.; Piazza, S.; Sunseri, C. Formation of lead by reduction of electrodeposited PbO2: Comparison between bulk films and nanowires fabrication. J. Solid State Electrochem. 2012, 16, 3939–3946. [Google Scholar] [CrossRef]
  57. Ferrara, G.; Inguanta, R.; Piazza, S.; Sunseri, C. Electro-Synthesis of Sn-Co Nanowires in Alumina Membranes. J. Nanosci. Nanotechnol. 2010, 10, 8328–8335. [Google Scholar] [CrossRef] [PubMed]
  58. Cocchiara, C.; Sunseri, C.; Piazza, S.; Inguanta, R. Pb-PbOHCl Composite Nanowires Synthesized by Galvanic Deposition in Template. J. Nanosci. Nanotechnol. 2019, 19, 4677–4685. [Google Scholar] [CrossRef] [PubMed]
  59. Inguanta, R.; Vergottini, F.; Ferrara, G.; Piazza, S.; Sunseri, C. Effect of temperature on the growth of α-PbO2 nanostructures. Electrochim. Acta 2010, 55, 8556–8562. [Google Scholar] [CrossRef]
  60. Fu, J.; Mao, P.; Han, J. Artificial molecular sieves and filters: A new paradigm for biomolecule separation. Trends Biotechnol. 2008, 26, 311–320. [Google Scholar] [CrossRef]
  61. Shi, W.; Shen, Y.; Ge, D.; Xue, M.; Cao, H.; Huang, S.; Wang, J.; Zhang, G.; Zhang, F. Functionalized anodic aluminum oxide (AAO) membranes for affinity protein separation. J. Membr. Sci. 2008, 325, 801–808. [Google Scholar] [CrossRef]
  62. Inguanta, R.; Piazza, S.; Sunseri, C. A Route to Grow Oxide Nanostructures Based on Metal Displacement Deposition: Lanthanides Oxy/Hydroxides Characterization. J. Electrochem. Soc. 2012, 159, D493–D500. [Google Scholar] [CrossRef]
  63. Inguanta, R.; Ferrara, G.; Piazza, S.; Sunseri, C. A new route to grow oxide nanostructures based on metal displacement deposition. Lanthanides oxy/hydroxides growth. Electrochim. Acta 2012, 76, 77–87. [Google Scholar] [CrossRef]
  64. Zhang, W.; Huang, G.; Ng, K.; Ji, Y.; Gao, B.; Huang, L.; Zhou, J.; Lu, T.J.; Xu, F. Engineering ellipsoidal cap-like hydrogel particles as building blocks or sacrificial templates for three-dimensional cell culture. Biomater. Sci. 2018, 6, 885–892. [Google Scholar] [CrossRef]
  65. Davoodi, E.; Zhianmanesh, M.; Montazerian, H.; Milani, A.S.; Hoorfar, M. Nano-porous anodic alumina: Fundamentals and applications in tissue engineering. J. Mater. Sci. Mater. Med. 2020, 31, 60. [Google Scholar] [CrossRef]
  66. Kondo, T.; Nagao, S.; Miyazaki, H.; Yanagishita, T.; Masuda, H. Tuning of the interval in a nanohole array of anodic porous alumina through deformation of polymer templates. RSC Adv. 2017, 7, 44799–44803. [Google Scholar] [CrossRef] [Green Version]
  67. Ferrara, G.; Inguanta, R.; Piazza, S.; Sunseri, C. Characterization of Sn-Co Nanowires Grown into Alumina Template. Electrochem. Solid State Lett. 2009, 12, K17. [Google Scholar] [CrossRef]
  68. Ferrara, G.; Arbizzani, C.; Damen, L.; Guidotti, M.; Lazzari, M.; Vergottini, F.G.; Inguanta, R.; Piazza, S.; Sunseri, C.; Mastragostino, M. Toward Tin-Based High-Capacity Anode for Lithium-Ion Battery. ECS Trans. 2014, 48, 153–162. [Google Scholar] [CrossRef]
  69. Inguanta, R.; Ferrara, G.; Livreri, P.; Piazza, S.; Sunseri, C. Ruthenium Oxide Nanotubes via Template Electrosynthesis. Curr. Nanosci. 2011, 7, 210–218. [Google Scholar] [CrossRef]
  70. Kohli, P.; Wharton, J.E.; Braide, O.; Martin, C.R. Template Synthesis of Gold Nanotubes in an Anodic Alumina Membrane. J. Nanosci. Nanotechnol. 2004, 4, 605–610. [Google Scholar] [CrossRef]
  71. Inguanta, R.; Ferrara, G.; Piazza, S.; Sunseri, C. Fabrication and characterization of metal and metal oxide nanostructures grown by metal displacement deposition into anodic alumina membranes. Chem. Eng. Trans. 2011, 24, 199–204. [Google Scholar] [CrossRef]
  72. Battaglia, M.; Sunseri, C.; Piazza, S.; Inguanta, R. CuZnSnSe Nanotubes and Nanowires by Template Electrosynthesis. Adv. Sci. Technol. 2014, 93, 241–246. [Google Scholar] [CrossRef]
  73. Şişman, İ. Template-Assisted Electrochemical Synthesis of Semiconductor Nanowires. In Nanowires—Implementations and Applications; Hashim, A., Ed.; InTech: London, UK, 2011; ISBN 978-953-307-318-7. [Google Scholar] [CrossRef]
  74. Wang, J.; Li, Z.; Gu, Z. A comprehensive review of template-synthesized multi-component nanowires: From interfacial design to sensing and actuation applications. Sens. Actuators Rep. 2021, 3, 100029. [Google Scholar] [CrossRef]
  75. Viqueira, M.S.; Pozo-López, G.; Urreta, S.E.; Condó, A.M.; Cornejo, D.R.; Fabietti, L.M. Magnetic hysteresis in small-grained Co Pd1-nanowire arrays. J. Magn. Magn. Mater. 2015, 394, 185–194. [Google Scholar] [CrossRef]
  76. Ferrara, G.; Inguanta, R.; Vergottini, F.; Piazza, S.; Sunseri, C. Nanostructured Material Fabrication for Energy Conversion; ECS Transactions: Brno, Czech Republic, 2011; pp. 55–63. [Google Scholar]
  77. Du, L.; Feng, D.; Xing, X.; Fu, Y.; Fonseca, L.F.; Yang, D. Palladium/cobalt nanowires with improved hydrogen sensing stability at ultra-low temperatures. Nanoscale 2019, 11, 21074–21080. [Google Scholar] [CrossRef] [PubMed]
  78. Taşaltın, N.; Öztürk, S.; Kılınç, N.; Yüzer, H.; Öztürk, Z.Z. Fabrication of vertically aligned Pd nanowire array in AAO template by electrodeposition using neutral electrolyte. Nanoscale Res. Lett. 2010, 5, 1137–1143. [Google Scholar] [CrossRef] [Green Version]
  79. Flaschka, H.A. EDTA Titrations: An Introduction to Theory and Practice; Elsevier Science: Kent, UK, 2013; ISBN 978-1-4832-2175-5. Available online: http://qut.eblib.com.au/patron/FullRecord.aspx?p=1839240 (accessed on 18 September 2021).
  80. Vogel, A.I.; Jeffery, G.H. Vogel’s Textbook of Quantitative Chemical Analysis, 6th ed.; Prentice Hall: Harlow, UK, 2000; ISBN 978-0-582-22628-9. [Google Scholar]
  81. Skeldon, P.; Thompson, G.E.; Garcia-Vergara, S.J.; Iglesias-Rubianes, L.; Blanco-Pinzon, C.E. A Tracer Study of Porous Anodic Alumina. Electrochem. Solid-State Lett. 2006, 9, B47. [Google Scholar] [CrossRef]
  82. Yu, M.; Cui, H.; Li, H.; Zhang, S.; Kong, J.; Zhao, S.; Ai, F.; Song, Y.; Zhu, X. Anodizations of Al and Ti in NH4F or H3PO4 Solutions and Formation of Porous Anodic Alumina with Special Morphology. J. Phys. Chem. C 2018, 122, 549–556. [Google Scholar] [CrossRef]
  83. Yu, M.; Zhang, W.; Zhang, S.; Zhao, S.; Ai, F.; Zhu, X. Morphology evolution of porous anodic alumina in mixed H3PO4/NH4F electrolytes. Surf. Coat. Technol. 2018, 334, 500–508. [Google Scholar] [CrossRef]
  84. Inguanta, R.; Piazza, S.; Sunseri, C. Synthesis of self-standing Pd nanowires via galvanic displacement deposition. Electrochem. Commun. 2009, 11, 1385–1388. [Google Scholar] [CrossRef]
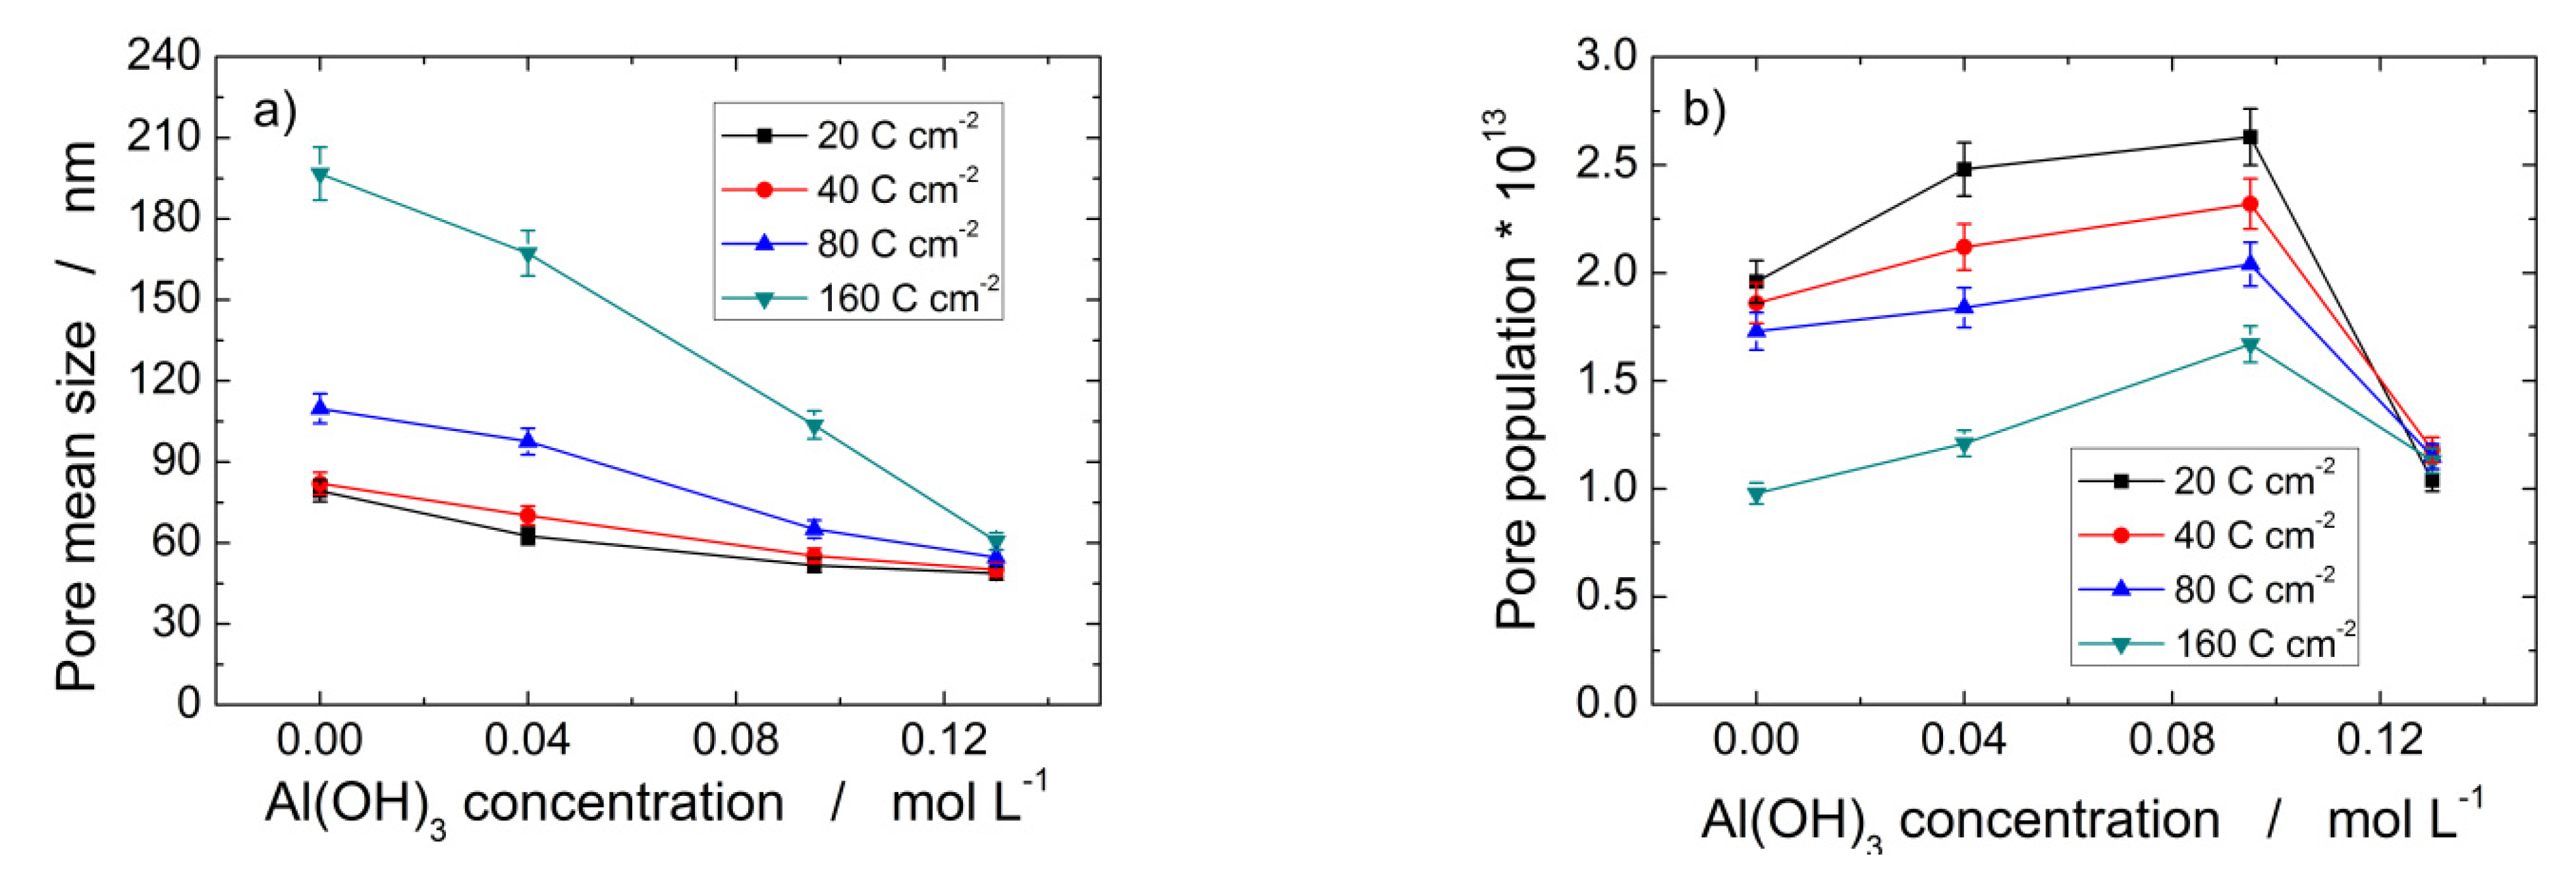
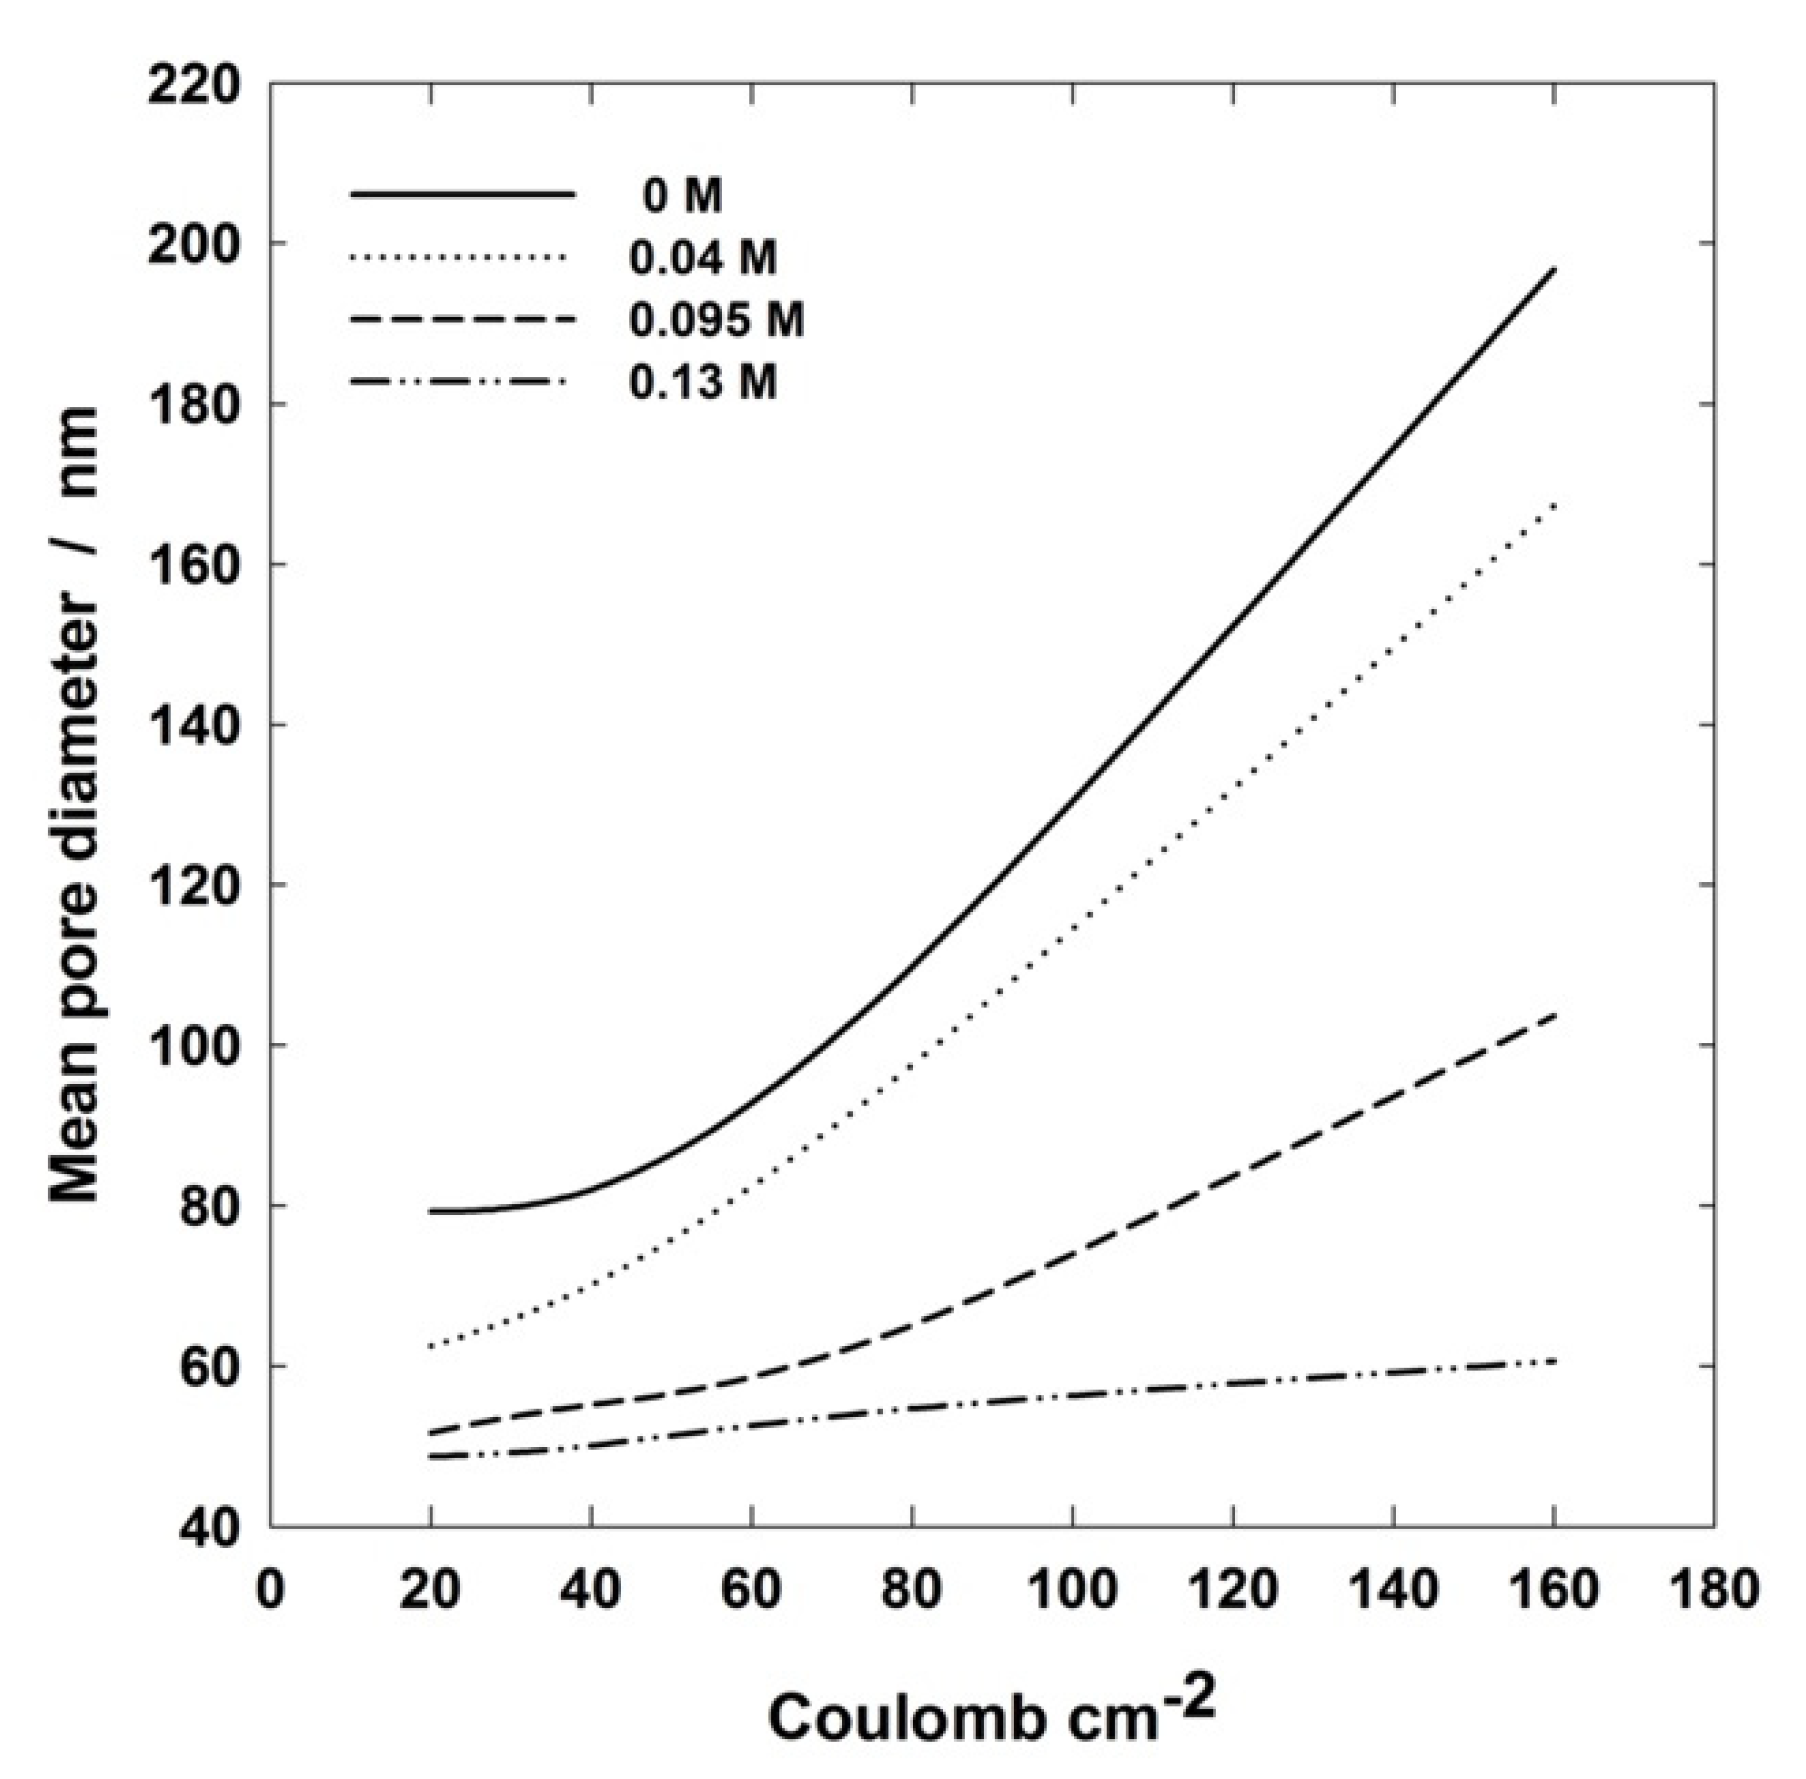
Figure 1. Schematic representation of the alumina porous structure formed by aluminum anodizing.
Applsci 12 00869 g001
Figure 2. Aluminum anodization in mixed 0.4 M H3PO4/Al(OH)3 electrolytes at 160 V and 0 °C after 160 C cm−2 vs. Al(OH)3 concentration: (a) mol cm−2 of Al oxidized as Al2O3 and PAA moles cm−2 formed; (b) anodizing % efficiency.
Applsci 12 00869 g002
Figure 3. Top views of PAA formed in 0.4 M H3PO4 and 0.04 M Al(OH)3 at 160 V and 0 °C: (a) and (b) inner, and outer surface at 20 C cm−2, respectively; (c,d) inner, and outer surface at 160 C cm−2, respectively.
Applsci 12 00869 g003
Figure 4. FESEM images of PAA formed at 160 V and 0 °C in 0.4 M H3PO4 and 0.095 M Al(OH)3 after passing 20 C cm−2: (a) inner and (b) outer surface.
Applsci 12 00869 g004
Figure 5. Pore mean size (a), and surface pore population (b) of PAA layers obtained by Al anodization at 160 V and 0 °C in 0.4 M H3PO4 added with different amounts of Al(OH)3.
Applsci 12 00869 g005
Figure 6. Top-views of PAA layers formed in 0.4 M H3PO4 and 0.13 M Al(OH)3 at 160 V and 0 °C: (a) 20 C cm−2; (b) 40 C cm−2; (c) 80 C cm−2; (d) 160 C cm−2.
Applsci 12 00869 g006
Figure 7. Schematic view of PAA with channel of different heights some of which stop after onset at the outer oxide surface in contact with the electrolyte. Additionally, the scalloped surface imprinting oxidizing aluminum is shown.
Applsci 12 00869 g007
Figure 8. Section views of PAA formed at 160 V and 0 °C after 160 C cm−2 in (a) 0.4 M H3PO4; (b) 0.4 M H3PO4 and 0.04 M Al(OH)3; (c) 0.4 M H3PO4 and 0.095 M Al(OH)3; (d) 0.4 M H3PO4 and 0.13 M Al(OH)3.
Applsci 12 00869 g008
Figure 9. Top views of PAA formed in 0.4 M H3PO4 at 160 V and 0 °C: (a,b) inner, and outer surface at 20 C cm−2, respectively; (c,d) inner, and outer surface at 160 C cm−2, respectively.
Applsci 12 00869 g009
Figure 10. Diameter distribution of PAA formed at 160 V and 272.15 °K in (a) 0.4 H3PO4 and 0.04 Al(OH)3; (b) 0.4 M H3PO4 and 0.09 5 M Al(OH)3.
Applsci 12 00869 g010
Figure 11. Pore mean diameter vs. charge density plots of PAA layers formed at 160 V and 0 °C in 0.4 M H3PO4 aqueous solutions containing different amounts of Al(OH)3.
Applsci 12 00869 g011
Table 1. Morphological features of PAA dependent on the electrolyte composition and passed electrical charge for aluminum anodization at 160 V and 0 °C.
Electrolyte 20 C cm−240 C cm−280 C cm−2160 C cm−2
Pore Mean Size. nm ±5%Pores
m−2
×1013
±10%
Cells
m−2
×1012
±1%
Pore Mean Size. nm ±5%Pores
m−2
×1013
±10%
Cells
m−2
×1012
±1%
Pore Mean Size. nm ±5%Pores
m−2
×1013
±10%
Cells
m−2
×1012
±1%
Pore Mean Size. nm ±5%Pores
m−2
×1013
±10%
Cells
m−2
×1012
±1%
0.4 M H3PO479.271.966.5381.981.866.53109.761.736.53196.750.986.53
0.4 M H3PO4
0.04 M
Al(OH)3
62.52.486.5370.122.126.5397.561.846.53167.251.216.53
0.4 M H3PO4
0.095 M Al(OH)3
51.682.636.5355.172.326.5365.12.046.53103.661.676.53
0.4 M H3PO4
0.13 M
Al(OH)3
48.711.046.5350.091.186.5354.681.156.5360.61.136.53
Table 2. PAA layer thickness dependent on the electrolyte composition and passed electrical charge for aluminum anodizing at 160 V and 0 °C.
Electrolyte PAA Layer Thickness, µm ± 5%
20 C cm−240 C cm−280 C cm−2160 C cm−2
0.4 M H3PO412.1524.743.389.3
0.4 M H3PO4
0.04 M
Al(OH)3
11.6321.4040.9782.60
0.4 M H3PO4
0.095 M Al(OH)3
919.339.481.2
0.4 M H3PO4
0.13 M
Al(OH)3
6.415.729.159.8
Table 3. FESEM (cross-sectional view), EDS and XRD results for nanostructured electrodes obtained at −1 mA cm−2 for 1 h. Additionally, the composition of electrodeposition bath and the nanostructure height was reported.
SampleFESEMEDSXRD
Pd NWs
3 μm
(0.035 M Pd2+)
Applsci 12 00869 i001 Applsci 12 00869 i002 Applsci 12 00869 i003
Co NWs
4.5 μm
(0.035 M Co2+)
Applsci 12 00869 i004 Applsci 12 00869 i005 Applsci 12 00869 i006
PdCo
NWs
4.5 μm
(0.035 M Pd2+
0.0069 M Co2+)
Applsci 12 00869 i007 Applsci 12 00869 i008 Applsci 12 00869 i009
PdCo
NWs
(0.035 M Pd2+
0.035 M Co2+)
NWs
4.8 μm
Applsci 12 00869 i010 Applsci 12 00869 i011
PdCo
NWs
(0.035 M Pd2+
0.17 M Co2+)
NWs
4.5 μm
Applsci 12 00869 i012 Applsci 12 00869 i013
PdCo
NTs
3.5 μm
(0.017 M Pd2+
0.017 M Co2+)
Applsci 12 00869 i014Pd/Co 1/1
88 % PD
Pd and Au peaks
Publisher’s Note: MDPI stays neutral with regard to jurisdictional claims in published maps and institutional affiliations.

