Featured Application
The study provides a method of generating key performance indicators for maintenance and management dashboards as well as a basis of introducing adaptive control in drive systems, which would apply an appropriate control algorithm depending on the circumstances of the drive operation. It minimises energy losses in technological processes.
Abstract
The article presents a method of generating key performance indicators related to electric motor energy efficiency on the basis of Big Data gathered and processed in a frequency converter. The authors proved that using the proposed solution, it is possible to specify the relation between the control mode of an electric drive and the control quality-energy consumption ratio in the start-up phase as well as in the steady operation with various mechanical loads. The tests were carried out on a stand equipped with two electric motors (one driving, the other used to apply the load by adjusting the parameters of the built-in brake). The measurements were made in two load cases, for motor control modes available in industrially applied frequency converters (scalar V/f, vector Voltage flux control without encoder, vector voltage flux control with encoder, vector current flux control, and vector current flux control with torque control). During the experiments, values of the current intensities (active and output), the actual frequency value, IxT utilization factor, relative torque, and the current rotational speed were measured and processed. Based on the data, the level of energy efficiency was determined for various control modes.
1. Introduction
The reduction of energy consumption states is a key criterion forcing the optimization of the operating parameters of electric drive systems [1,2,3,4]. Modern drive systems are most often extended by frequency converters, which constitute the superior system for setting operating parameters and monitoring the drive motor. In order to pay attention to energy saving, increasing efficiency, and reducing production costs, many countries around the world have established minimum efficiency performance standards for electric motors used in many applications, especially industrial ones [5,6,7].
For industrial motors, standard IEC 60034-30-1:2014 (Rotating electrical machines—Part 30-1: Efficiency classes of line operated AC motors—IE code) defines four efficiency classes: IE1—Standard Efficiency, IE2—High Efficiency, IE3—Premium Efficiency, and IE4—Super-premium Efficiency. The efficiency parameters of electric motors, which are identified by the IE code for energy efficiency classes, are measured with the new measuring procedures in accordance with IEC 60034-2-1:2014 (Rotating electrical machines—Part 2-1: Standard methods for determining losses and efficiency from tests—excluding machines for traction vehicles). Thanks to the aforementioned measuring procedures, additional drive losses are determined with very high precision and according to a uniform standard for all manufacturers. The energy efficiency guaranteed by the IEC 60034-30-1:2014 standard defines the minimum efficiency value of the drive motor as a hardware component. The energy efficiency during the drive operation is also influenced by [1]:
- Load parameters (depending on the application, including the mechanical load and its variability, ambient temperature, humidity, working conditions, nature and degree of load, degree of overload, connection method, etc.); and
- Settings and operating modes of frequency converters (depending on the user experience and the characteristics of the required operating parameters of the drive, such as starting and braking ramps, operating modes, current limits, brake parameter settings etc.).
The most energy-consuming stages in the operation of electric drives are transients in the phases of start-up, braking, and dynamic changes of the external load [8,9,10]. The build-up of magnetic fields and the reverse electromotive force (or the reverse electromotive force itself) during the drive start-up introduces transients into the electrical system.
The formation of dynamic moments loading the drive shafts of machines causes a rapid increase in power demand.
During the transient phase, high currents are required to be supplied to the motor, which can have a detrimental effect on the electrical supply system and other connected equipment [10]. The current and voltage are the basic parameters that determine the maintenance of the power reserve and torque on the motor shaft. On the other hand, the current intensity affects the values of thermal parameters and is the most common cause of damage to windings, insulation, and other components of electric drives and control devices (frequency converters).
Industry 4.0 is related to gathering and processing Big Data related to operation of machines (a majority of them are driven by frequency-controlled electric motors). Standards of Industrial Internet of Things (IIoT) use edge computing methods to make the information transmission faster and more efficient. The authors’ thesis is that a frequency converter equipped with an ethernet module may be used as an edge computing node. The device—during its operation—constantly collects big amounts of the supply and operational data with a milliseconds interval. It is supposed that the access to the data would allow one to determine the levels of energy consumption and control quality (the convergence of the specified and actual drive parameters). The frequency converter is programmable—the data may be mathematically processed. It could be a basis of generating legible key performance indicators (KPIs) for maintenance and management dashboards. It is proposed to provide this information via the IIoT using the standard process input and output communication words of the frequency converter. The authors investigated the availability of the required data and the mathematical method of processing them. The researchers tried to find a way of computing on the edge (directly in the source) the big data produced in the frequency converter, providing factors useful in the drive management, which can be communicated in the IIoT directly from the drive controller. Thus, the experiment consisted of transforming a classical actuator (electric drive) into the Industry 4.0 component: an edge device analysing and processing the operational Big Data to output KPIs. The frequency converter was considered in an innovative way, as energy analyser and smart sensor, which could process and transfer data via the IIoT as it is commonly equipped with a programmable microcontroller and proper communication interface.
2. Materials and Methods
The main interest of the authors was the start-up phase and the impact of the selected motor control mode on the parameters (in particular current intensities) determining the efficiency, energy consumption, durability of the drive, and the dynamics of the drive system. The method of the research was an experiment verifying if there are noticeable divergences in signals registered natively in the frequency converter in various control modes, and if there might be a system for determining the control quality and energy efficiency, based on the registered data, built-in the controller. The analysis of data available in the drive controller was the basis for trying to define formulas transforming the data to the drive efficiency indicators. The study method was a quantitative comparison of the KPIs computed in the defined way to find out if they correctly show differences in the efficiency of the drive operated with various control algorithms in various conditions (load, dynamics, etc.). Thanks to analysis of the data generated by the frequency converter, differences in energy consumption at various control modes and drive circumstances were observed. It was critical for testing out the hypothesis about the possibility of energetic optimisation of drive by activating a control algorithm, which works best in particular conditions, on the basis of particular indicators.
2.1. Conditions of Measurements
In terms of the available methods of controlling drive parameters, several basic variants can be distinguished including [6,11]:
- Scalar control:
- ○
- V/f (Volts/Hertz) = const.;
- Indirect Field-Oriented Control (IFOC):
- ○
- Voltage Mode Flux Control (VFC);
- Direct Field-Oriented Control (FOC):
- ○
- Current Mode Flux Control (CFC);
- Direct Torque Control (DTC):
- ○
- SERVO.
The extended characteristics of the modes are presented in Table 1.

Table 1.
Comparison of motor control modes [2,6,9,11].
The analysis of the characteristics (Table 1) shows significant differences in the control modes and the quality of the drive operating parameters (in particular, the rotational speed overshoot in the start-up phase, the accuracy of keeping the speed in a steady state, and the start-up time). Due to the described differences in each of the motor test runs, the following control modes were checked: scalar (V/f), vector (VFC without encoder, VFC n-control with encoder, CFC, and CFC with torque control) [2,6,9,11].
2.2. Configuration of Laboratory Test Stand
The test stand was configured with two SEW-EURODRIVE DRS71S4BE05/FI/TF/ES7S motors connected by a single-insert clutch (Figure 1). The operating parameters of the motor were controlled by the MDX61B0005-5A3-4-00 frequency converter.
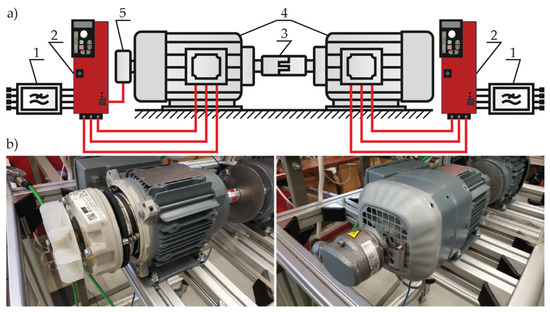
Figure 1.
View of: (a) a configuration diagram of the test stand, (b) the laboratory stand, where: 1—power supply, 2—frequency converter, 3—single-piece clutch, 4—electric motor, 5—encoder.
The motor parameters are listed in Table 2.

Table 2.
Parameters of the tested electric motor (DRS71S4BE05/FI/TF/ES7S).
The frequency converter parameters are presented in Table 3.

Table 3.
Parameters of the tested frequency converter (MDX61B0005-5A3-4-00).
The rotational speed was measured using a sine encoder type OG73SSN1024 connected to the tested drive.
As a result of appropriate brake adjustment, repeatable values of the starting load were obtained. In each of the tests, the set value of the motor shaft rotational speed was set at 500 rpm, at constant load values (according to the procedure of the set load) and the starting ramp.
The start-up parameters were registered, including the setpoint speed, actual speed, active current, and output current. The measurement time was defined as 4 s. Most of the parameters were observed with a 2-ms measurement sampling time. The exception was the actual speed, which was calculated from the angular distance travelled by the motor shaft. The number of encoder pulses counted during the 10-ms period was converted into the value of the rotation angle by the drive controller programmed especially for this purpose, and the average angular speed during this period was determined. Therefore, in the diagrams shown below, the rate of change of the actual speed differs from the frequency of change of the setpoint speed and other quantities.
All measurements were made in the Scope module of the Movitools Motion Studio software. An encoder and an algorithm for determining the speed value in the IPOS software (dedicated for positioning and the sequence control system) were used to measure the current value of the shaft rotational speed.
2.3. Measurements of Drive System
The values of the output current (IO) and active current (IA) were recorded during the measurements. The output current characterises the energy demand of the motor including the value of losses (magnetisation of the rotor, losses in the core, losses due to heating of the motor components, etc.). In order to verify the quality of the control and to establish its relationship with the energy demand (energy efficiency), it was also necessary to study the speed time courses against the set speed.
To determine the quality of control, which in the case under consideration is the level of representation of the setpoint speed, the authors propose the following formula:
where:
SC = 1 − |(nA – nS)/(nS)|
- SC—speed convergence;
- nA—actual speed [rpm]; and
- nS—setpoint speed [rpm].
Speed convergence assumes a value from the range 0÷1.
In the efficiency analysis, an important parameter is also the level of energy used to power the motor in a given moment, which can be referred to as the maximum energy available in the source of powering signals: the frequency converter. The quantity proportional to the energy is, in the case under consideration, the current intensity, so its values were used by the authors to define the energy saving factor in the following way:
ESF = 1 − |IO/IO_MAX|
The energy saving factor takes a value in the range from 0 to 1. The total energy efficiency is the product of the coefficients described by Formulas (1) and (2):
EF = SC ESF
The energy efficiency defined in this way needs to be observed over time in order to assess the dynamics of the drive (variability of its parameters) and the energy resources used to achieve it. Long periods of speed stabilisation or discrepancies, as well as intensive motor current consumption, reduce the average values of the EF components. It is therefore possible to use this statistical measure to analyse individual phases of the motion.
3. Results
The test procedure of the drive parameters was performed in two modes:
- Without an external load—motor start without a braking torque load;
- With the external load—starting the motor with the mechanical load set by the motor brake overregulation, resulting in the start-up and steady-state operation with the value of about 50% of the motor rated current.
3.1. Measurements without External Load
The waveforms for the various control methods in the unloaded condition are shown in Figure 2.
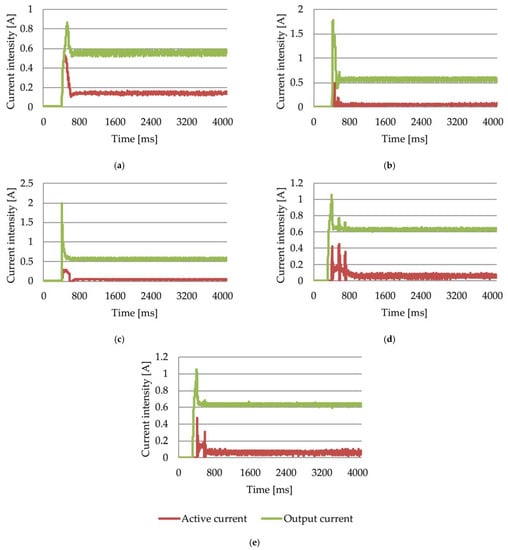
Figure 2.
Characteristics of the output current intensity (IO) and the active current intensity (IA) in various control modes (without an external load): (a) V/f, (b) VFC without encoder, (c) VFC n-control, (d) CFC, (e) CFC with torque control.
Figure 3 shows a comparison of the no-load state currents for various control modes.
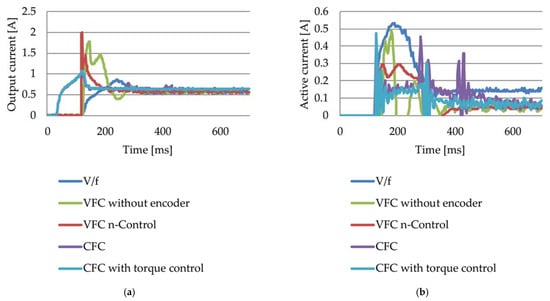
Figure 3.
Comparison of: (a) output current intensity values (IO) for various control modes, (b) active current intensity values (IA) for various control modes.
Table 4 shows the peak values of the output current (IO) and the active current (IA) of the frequency converter in a transient state in the unloaded condition.

Table 4.
Peak values of the output current (IO) and the active current (IA) of the frequency converter in a transient state (without an external load).
Table 5 shows the characteristics of the output current (IO) and the active current (IA) in a steady state in the unloaded condition.

Table 5.
Characteristics of the output current (IO) and the active current (IA) in a steady state (without an external load).
Table 6 shows the time characteristics of the output current (IO) and the active current (IA) in the transient state in the unloaded condition.

Table 6.
Time characteristics of the output current (IO) and the active current (IA) in the transient state (without an external load).
The comparison of the rotational speed (nA) for various control modes is presented in Figure 4.
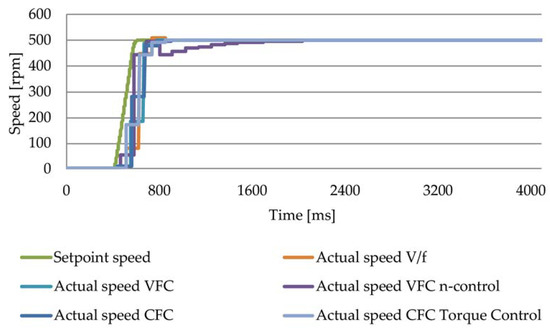
Figure 4.
Comparison of the rotational speed (nA) for various control modes, where VFC is VFC without an encoder.
Table 7 shows the values of the overshoot of the rotational speed in the transient state in the unloaded condition.

Table 7.
Value of the overshoot of the rotational speed in the transient state (without an external load).
Table 8 shows the fluctuations of the rotational speed in the transient state in the unloaded condition.

Table 8.
Characteristics of the rotational speed nA in the steady state (without an external load).
Table 9 shows the duration of the transient state (tn_T) for the rotational speed nA in the unloaded condition.

Table 9.
Duration of the transient state (tn_T) for the rotational speed nA (without an external load).
Figure 5 illustrates the SC values for the investigated drive control modes in the unloaded condition.
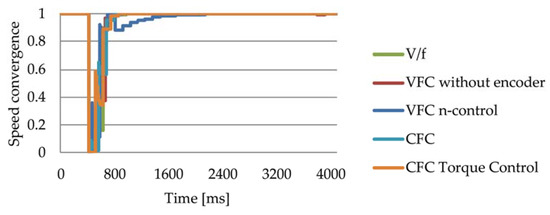
Figure 5.
Comparison of the speed convergence (SC) for various control modes (without an external load).
Figure 6 illustrates the ESF values for the investigated drive control modes in the unloaded condition.
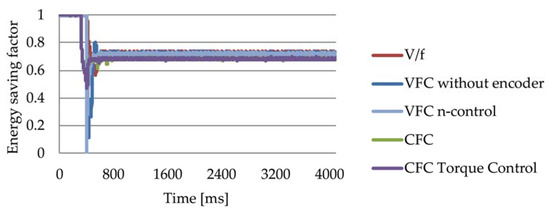
Figure 6.
Comparison of the energy saving factor (ESF) for various control modes (without an external load).
Based on the calculated SC and ESF, the EF was determined and averaged over two drive states: the transient state and steady state in the unloaded condition. The results are presented in Table 10.

Table 10.
Characteristics of the energy efficiency ESF in the steady state (without an external load).
3.2. Measurements with External Load
The same measurements were repeated in the motor brake load condition. The waveforms for the various control methods in the loaded condition are shown in Figure 7.
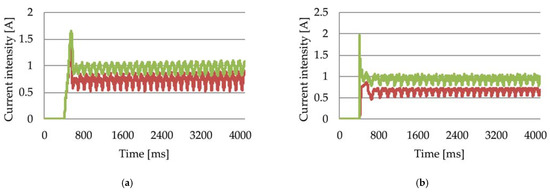
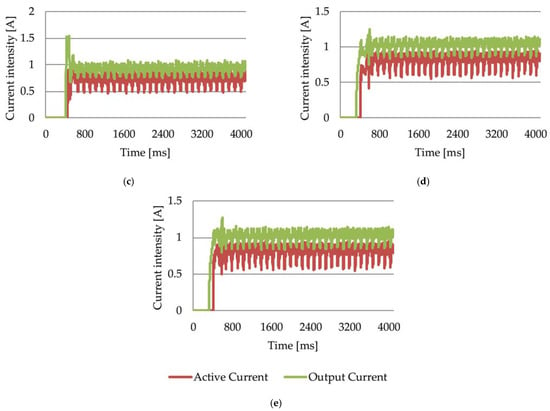
Figure 7.
Characteristics of the output current intensity (IO) and the active current intensity (IA) in various control modes (with the external load): (a) V/f, (b) VFC without an encoder, (c) VFC n-control, (d) CFC, (e) CFC with torque control.
Figure 8 shows a comparison of the load state currents for various control modes. There is a characteristic current peak visible in the scalar mode due to its lack of precision in the control over the motor dynamics.
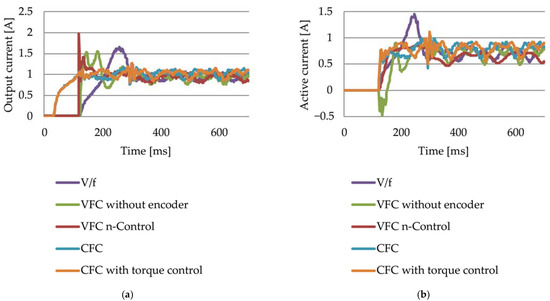
Figure 8.
Comparison of: (a) output current intensity values (IO) for various control modes, (b) active current intensity values (IA) for various control modes.
Table 11 shows the peak values of the output current (IO) and the active current (IA) of the frequency converter in a transient state in the loaded condition.

Table 11.
Peak values of the output current (IO) and the active current (IA) of the frequency converter in a transient state (with the external load).
Table 12 shows the characteristics of the output current (IO) and the active current (IA) in a steady state in the loaded condition.

Table 12.
Characteristics of the output current (IO) and the active current (IA) in a steady state (with the external load).
Table 13 shows the time characteristics of the output current (IO) and the active current (IA) in the transient state in the loaded condition.

Table 13.
Time characteristics of the output current (IO) and the active current (IA) in the transient state (with the external load).
The comparison of the rotational speed (nA) for various control modes is presented in Figure 9.
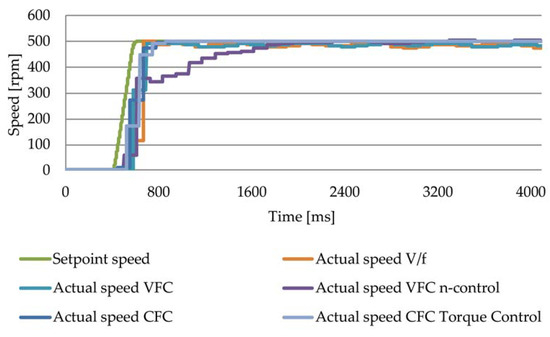
Figure 9.
Comparison of the rotational speed (nA) for various control modes, where VFC is VFC without an encoder.
Table 14 shows the values of the overshoot of the rotational speed in the transient state in the loaded condition.

Table 14.
Value of the overshoot of the rotational speed in the transient state (with the external load).
Table 15 shows the fluctuations of the rotational speed in the transient state in the loaded condition.

Table 15.
Characteristics of the rotational speed nA in the steady state (with the external load).
Table 16 shows the duration of the transient state (tn_T) for the rotational speed nA in the loaded condition.

Table 16.
Duration of the transient state (tn_T) for the rotational speed nA (with the external load).
Figure 10 illustrates the SC values for the investigated drive control modes in the loaded condition.
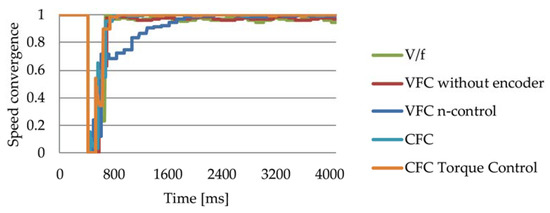
Figure 10.
Comparison of the speed convergence (SC) for various control modes (with the external load).
Figure 11 illustrates the ESF values for the investigated drive control modes in the loaded condition.
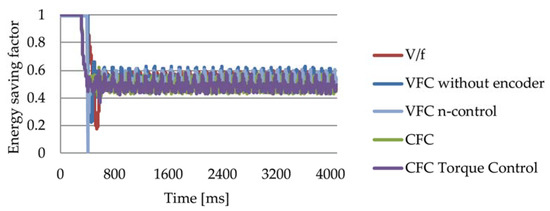
Figure 11.
Comparison of the energy saving factor (ESF) for various control modes (with the external load).
Based on the calculated SC and ESF, the EF was determined and averaged over two drive states: the transient state and steady state in the loaded condition. The results are presented in Table 17.

Table 17.
Characteristics of the energy efficiency ESF in the steady state (with the external load).
4. Discussion
What was presented in the figures and tables is a step-by-step decomposition of the processes of data selection and analysis, which could then be automated as an application of the research results, to produce the developed KPIs: SC and ESF. The data analysed within the research was collected and processed in the offline tool Movitools Motion Studio software. It was appropriate to make conclusions on the utility of the information provided by a frequency converter. On the basis of them, the authors proposed methods of calculating factors related to the efficiency of the electric drive. As motioned in the introduction, the process can be executed online, directly in the drive controller, and the results of it can be transmitted to other devices via the IIoT. Establishing such a connection was not an interest of the authors; it is a standard, well-known industrial solution. The problem investigated was the usability and legibility of the supply and operational parameter samples collected in the frequency converter in determining the drive efficiency KPIs. Using the device as an edge computing node can make the Big Data suitable for maintenance and management dashboard applications. The research led to the development of a concept of a system, where the KPIs computed in the studied way can be applied, which is presented in Figure 12.
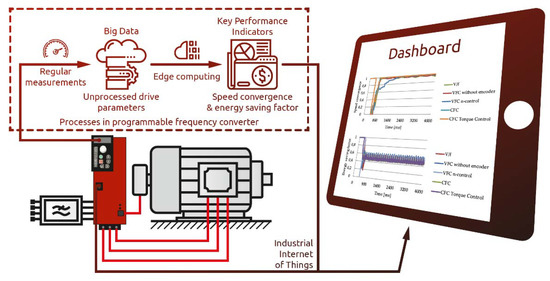
Figure 12.
Concept of the system where the elaborated edge computations are used in drive management with IIoT devices.
The choice of the control mode has a significant influence on the quality of regulation and the power demand of the drive.
In the unloaded state, there is a significant disproportion in the values of active and output currents from the power amplifier of the frequency converter (which is connected with a significant power loss of the drive system). Moreover, significant differences can be observed in the values of the peak current intensities, affecting the life of the drives (especially degradation of the winding insulation, leading to thermal disturbances, efficiency losses, and, as a consequence, to the breakdown and burning of the drive motor).
The graphs in Figure 4 and Figure 9 show the level of representation of the set speed in different control modes. Fluctuations of this drive parameter are clearly visible (in particular, under load and in the case of imprecise control modes), and the phenomenon of its overshoot or the reactions of the automatic control system in an attempt to eliminate the deviation.
In order to achieve the best relationship between control quality and energy consumption, optimisation in terms of two criteria is essential. The product of speed convergence and energy saving factor is the energy efficiency factor proposed by the authors, which combines the indicated parameters with the same weight of significance.
5. Conclusions
The research showed that the most favourable combination in the unloaded state during acceleration is the VFC n-control mode. The drive then responds without overshooting, and according to the characteristics of proportional-integral (PI) control, there are no peaks in energy consumption, which helps to extend the service life of its components. However, this is also associated with a relatively long stabilisation period. For the same phase of motion under load, the conclusions are identical.
When the speed setting stabilises and the motor is running without a load, then the V/f, VFC without encoder, and CFC modes show the highest energy efficiency. When a load is added, these are the VFC without encoder, VFC n-control, and CFC.
The research provides a method of generating KPIs based on processing classical data, natively gathered in frequency converters. It may be useful for maintenance and management dashboards as well as in adaptive control in drive systems, which would apply an appropriate control algorithm depending on the circumstances of the drive operation. It minimises energy losses in technological processes.
The authors introduced self-defined measures by which the quality of drive operation can be assessed in terms of two important criteria. By applying the studied computational formulas in the frequency converter, the operational Big Data is processed directly in the drive controller (on the edge), allowing it to be the IIoT smart sensor as well, producing data useful in Internet-based management systems.
As an application of the research results, we proposed the control and indication system (shown in the Figure 12), in which remote access computed in the tested indicators as well as the remote drive configuration enable reaction to the drive conditions manually or automatically (e.g., using decision making algorithms, including artificial intelligence).
Further research may lead to the determination of the influence of other factors (temperature, vibration, connection quality, etc.) on the KPIs related to control quality and energy efficiency of commonly used frequency-controlled drives. The application of the study results may improve the functionality of a classical frequency controller and make it a higher-level edge device for making the operational Big Data useful in the IIoT network of the Industry 4.0 plant.
Author Contributions
Conceptualization, M.P.H. and J.M.; data curation, M.P.H. and J.M.; formal analysis, J.M.; investigation, M.P.H. and J.M.; methodology, M.P.H. and J.M.; resources, M.P.H.; software, J.M.; supervision, M.P.H.; validation, M.P.H. and J.M.; visualization, M.P.H. and J.M.; writing—original draft, M.P.H.; writing—review and editing, M.P.H. and J.M. All authors have read and agreed to the published version of the manuscript.
Funding
This research was funded by the EUROPEAN UNION through the EUROPEAN SOCIAL FUND as a part of the SILESIAN UNIVERSITY OF TECHNOLOGY AS A CENTRE OF MODERN EDUCATION BASED ON RESEARCH AND INNOVATION project, grant number: POWR.03.05.00-00.z098/17-00.
Conflicts of Interest
The authors declare no conflict of interest.
References
- Kuznetsov, N.K.; Iov, I.A.; Iov, A.A. Investigation of efficiency of electric drive control system of excavator traction mechanism based on feedback on load. J. Phys. Conf. Ser. 2018, 1015, 032176. [Google Scholar] [CrossRef]
- Nikonova, G.V.; Nikonov, A.V.; Makarochkin, V.V.; Garms, P.G. Modelling of soft starters for automated electric drive. J. Phys. Conf. Ser. 2019, 1260, 032030. [Google Scholar] [CrossRef]
- Przytuła, K. Emergency Switching and Analysis of the Transient States of an Interleaved Converter. IT Autom. Meas. Econ. Environ. Prot. 2016, 6, 55–58. [Google Scholar]
- Weidauer, J.; Messer, R. Electrical Drives: Principles; Planning; Applications; Solutions; Wiley: Berlin, Germany, 2014. [Google Scholar]
- Fuchsloch, J.F.; Finley, W.R.; Walter, R.W. The Next Generation Motor. IEEE Ind. Appl. Mag. 2008, 14, 37–46. [Google Scholar] [CrossRef]
- SEW-EURODRIVE. Project Planning of Drives. Drives Engineering—Practical Implementation. Available online: https://download.sew-eurodrive.com/download/pdf/10522913.pdf (accessed on 26 April 2021).
- Yung, C. Tips for Improving Motor Efficiency. IEEE Ind. Appl. Mag. 2007, 13, 12–20. [Google Scholar] [CrossRef]
- Grcar, B.; Hofer, A.; Stumberger, G. Induction Machine Control for a Wide Range of Drive Requirements. Energies 2020, 13, 175. [Google Scholar] [CrossRef] [Green Version]
- Krause, P.C.; Wasynczuk, O.; Sudhoff, S.D.; Pekarek, S.D. Analysis of Electric Machinery and Drive Systems; Wiley-IEEE Press: Piscataway, NJ, USA, 2013. [Google Scholar]
- Wróbel, K.; Serkies, P.; Szabat, K. Model Predictive Base Direct Speed Control of Induction Motor Drive—Continuous and Finite Set Approaches. Energies 2020, 13, 1193. [Google Scholar] [CrossRef] [Green Version]
- Bendjedia, M.; Tehrani, Y.; Azzouz, Y.; Shall, H. Robust RST Controller Design for Induction Motor Drive for Electric Vehicle Application. In Proceedings of the First International Conference on Green Energy ICGE, Sfax, Tunisia, 25–27 March 2014; pp. 251–258. [Google Scholar]
Publisher’s Note: MDPI stays neutral with regard to jurisdictional claims in published maps and institutional affiliations. |
© 2021 by the authors. Licensee MDPI, Basel, Switzerland. This article is an open access article distributed under the terms and conditions of the Creative Commons Attribution (CC BY) license (https://creativecommons.org/licenses/by/4.0/).