1. Introduction
In the Industry 4.0 (I4.0) revolution, smart factories are becoming strongly interconnected and are facing major technological changes. The concept of I4.0 is based on cyber-physical production systems (CPPS) [
1,
2,
3,
4] linking the real and virtual world, in which fully automated production plants automatically manage industrial processes. Smart manufacturing requires certain basic technologies to enable devices or machines to change their behavior in response to different situations and requirements based on past experiences and learning abilities [
5,
6,
7]. These technologies enable direct communication with production systems, thus enabling problem solving and quick adaptation decisions. Some technologies also have artificial intelligence (AI), which allows production systems to learn from experience to ultimately implement a connected, intelligent, and ubiquitous industrial practice. All kinds of failures in industrial systems reduce factory performance, which becomes especially critical in fully automated environments. Therefore, fault finding in automation systems plays a key role in avoiding further losses. Designing a reliable and effective predictive maintenance (PdM) system can help overcome the shortcomings of physical systems. For these reasons, PdM plays a very important role, due to the fact that a minor fault may cause the entire production line to stop. The article proposes a predictive fault detection method useful in Smart Factory automation systems [
1,
8].
Analysis of mechanical signals (i.e., belt drive systems) is one of the most important areas of sustainable production development. Reducing the number of production downtime is one of the necessary research goals for sustainable production in the I4.0 era. Due to growing demand for methods of analyzing mechanical signals, the article attempts to solve the problems related to detection of anomalies, which may occur in belt drive system for future prediction of production system faults, which is an integral part of the development of a modern enterprise [
9,
10]. In a modern facility, data analysis can be performed using NAZCA4.0 created by APA Group [
11]. NAZCA4.0 allows to measure all desire parameters of the production line (i.e., vibration or energy parameters) from which the current state and any anomalies can be analyzed to increase the efficiency of production engineering. The belt transmission system is one of the most critical components and the most sensitive part to degradation. The basic idea is firstly to find the causes, then to develop a smart way to understand when the system was passing from safe situation to safety critical and lastly to critical one. Belt looseness is the main cause of common failures, which may force the system to stop. The proposed PdM method is designed for the specific belt drive but could also be generalized for other kinds of transmission systems [
9,
12,
13,
14].
In the production process of any enterprise, some product defects can be distinguished, which arise due to the lack of training of employees, inadequate selection of process parameters, or the condition of the machine. Appropriate methods and tools help to eliminate or prevent the appearance of defects and flaws in a given product. A malfunctioning machine can deteriorate the quality of production because before the source of product defects is located, a certain amount of a factory with a defect may be produced, which translates into financial losses. In the following paper, the authors focused on the study of one of the most frequently damaged machine components: the belt drive. Belt transmissions are among the most frequently used components, and at the same time they are sensitive links of production machines, where their unexpected failure can cause costly downtime and unplanned maintenance. Therefore, it is extremely important to develop methods to ensure reliable, continuous, and economical operation of these devices.
2. Belt Drive Diagnostics Approach
Vibration diagnostics provide detection of virtually all malfunctions of machinery and equipment operated in industrial conditions; these include imbalance of rotating components, rubbing, mechanical clearances, mechanical gear damage, and bearing damage [
15]. Vibrations caused by damaged equipment also produce acoustic waves that can be picked up with a microphone. Real-time analysis of the audio signal and advanced algorithms are able to identify the onset of failure due to defects, degradation, overloading, or improper maintenance. The use of advanced machine learning algorithms for this purpose allows the extraction of valuable information about the device, which can help prevent failures or schedule maintenance work early. Work by researchers around the world on acoustic and vibration signal analysis and processing has seen approaches such as time domain analysis, which is a classic technique for fault detection. Time domain analysis typically uses statistical parameters to determine the condition of a belt drive [
16] and an example of time-frequency analysis is presented in [
17,
18].
Most existing approaches used to diagnose belt drive failures are based on a supervised learning paradigm, which requires a collection of data from correct operation and during failure, collected a priori. In this paper, an adaptive approach is presented (
Figure 1), with vibrations measured using accelerometers. By this approach, fault data are not required to monitor the current state of the belt drive, among other reasons because fault data in production are usually hard to access.
Description of Test Stand
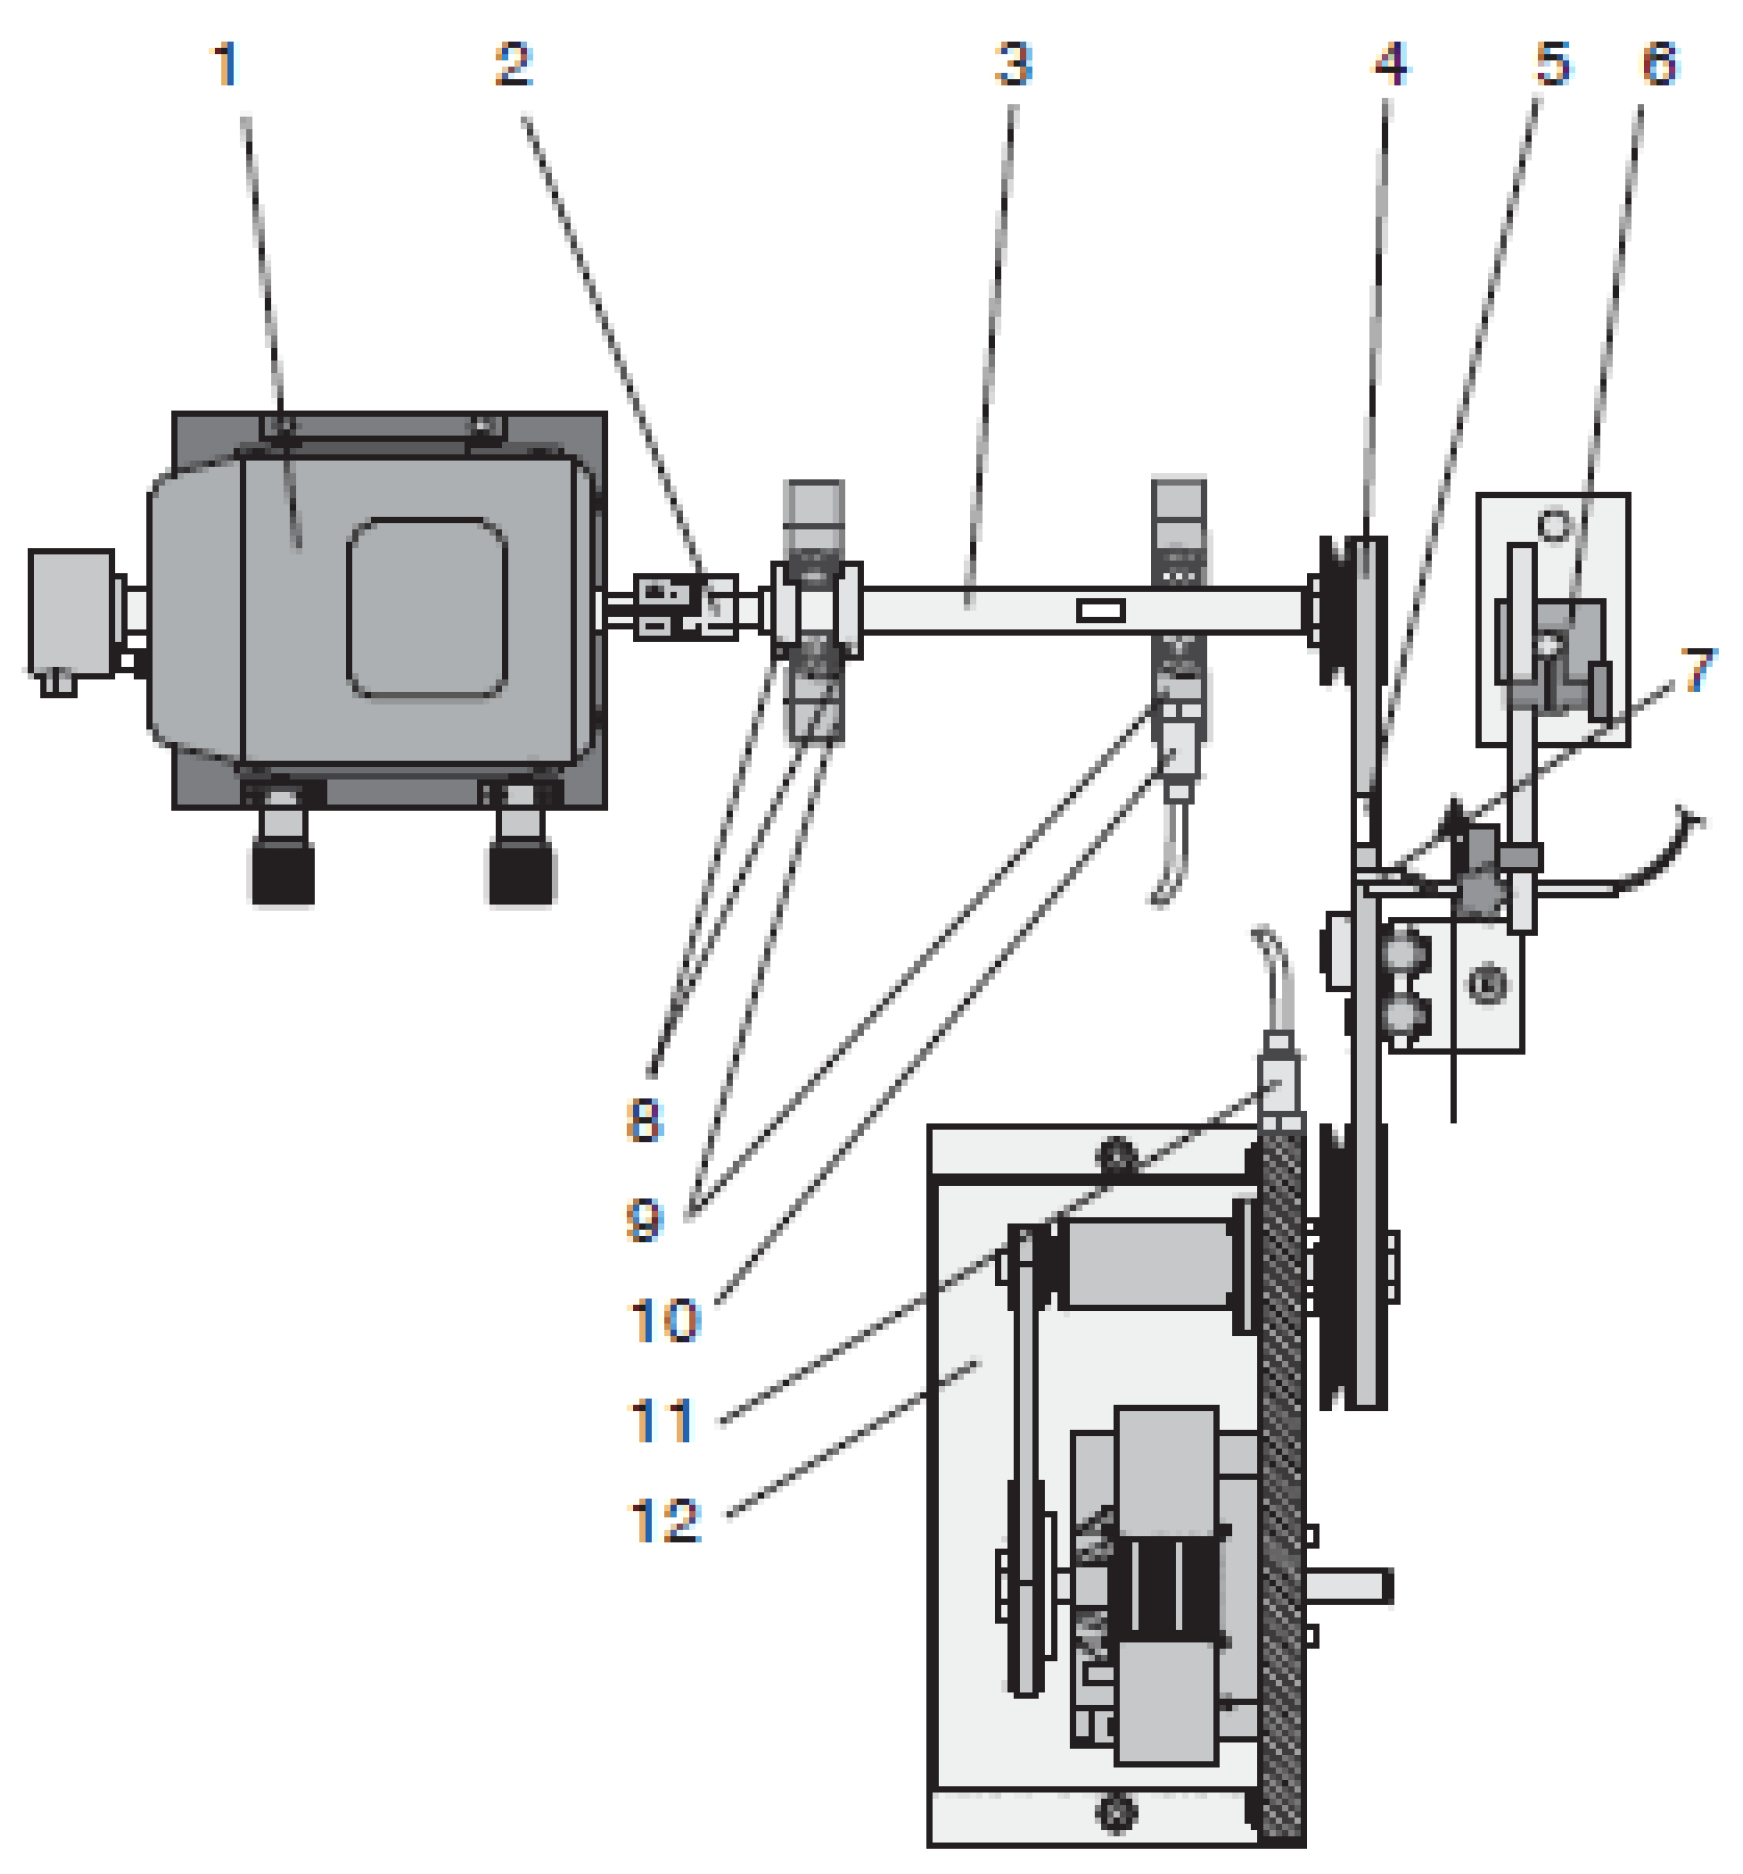
In order to carry out tests allowing to collect appropriate measurement data, the GUNT [
19] test stand was used, which enables the analysis of a belt drive that is working properly as well as a damaged one.
The belt drive that was tested was a double belt drive with a belt tensioner for both V-belts (
Figure 2).
Two types of transmission belt were used for the test: one undamaged and one in which the mounting tooth was damaged (
Figure 2). Each belt was placed on a test stand where the analysis was performed for the undamaged pulley and for the damaged pulley. Accordingly, four situations were identified that can occur during belt drive operation in production equipment. Fault analysis was performed in the frequency domain, where belt frequency(
fR) was calculated as follow:
where
n is drive shaft speed,
LR is V-belt length,
UAR is drive roller circumference, and
t is min to sec conversion factor (60).
For the purpose of conducting the tests, the following characteristic values for a belt drive were assumed: belt tension Ft = 130 N at a constant drive speed n = 1800 rpm, the load was equal to FL = 2.0 Nm. Assuming LR = 912 (mm), UAR = 197.9 mm the unfaulty belt frequency (fR) was equal to 6.5 Hz.
To determine values during the test stage, vertical and horizontal acceleration sensors (piezo-electric sensor, model 603C01 from IMI SENSORS) with a scale of 100 mV/g and resonance frequency equal 25 kHz were used.
3. Research Area
This section is devoted to the analytical portion of the research conducted. First, a preliminary analysis of the obtained results was carried out using the fast Fourier transform and creating a spectrogram from the signals obtained from the acceleration sensors. The application of the mentioned methods allowed to determine whether it is possible to separate selected defective states from a properly working device. Confirmation of this thesis allowed to proceed to the next step, which was the construction of an algorithm to detect anomalies in the system using real data from the working device
3.1. Analysis of the Results
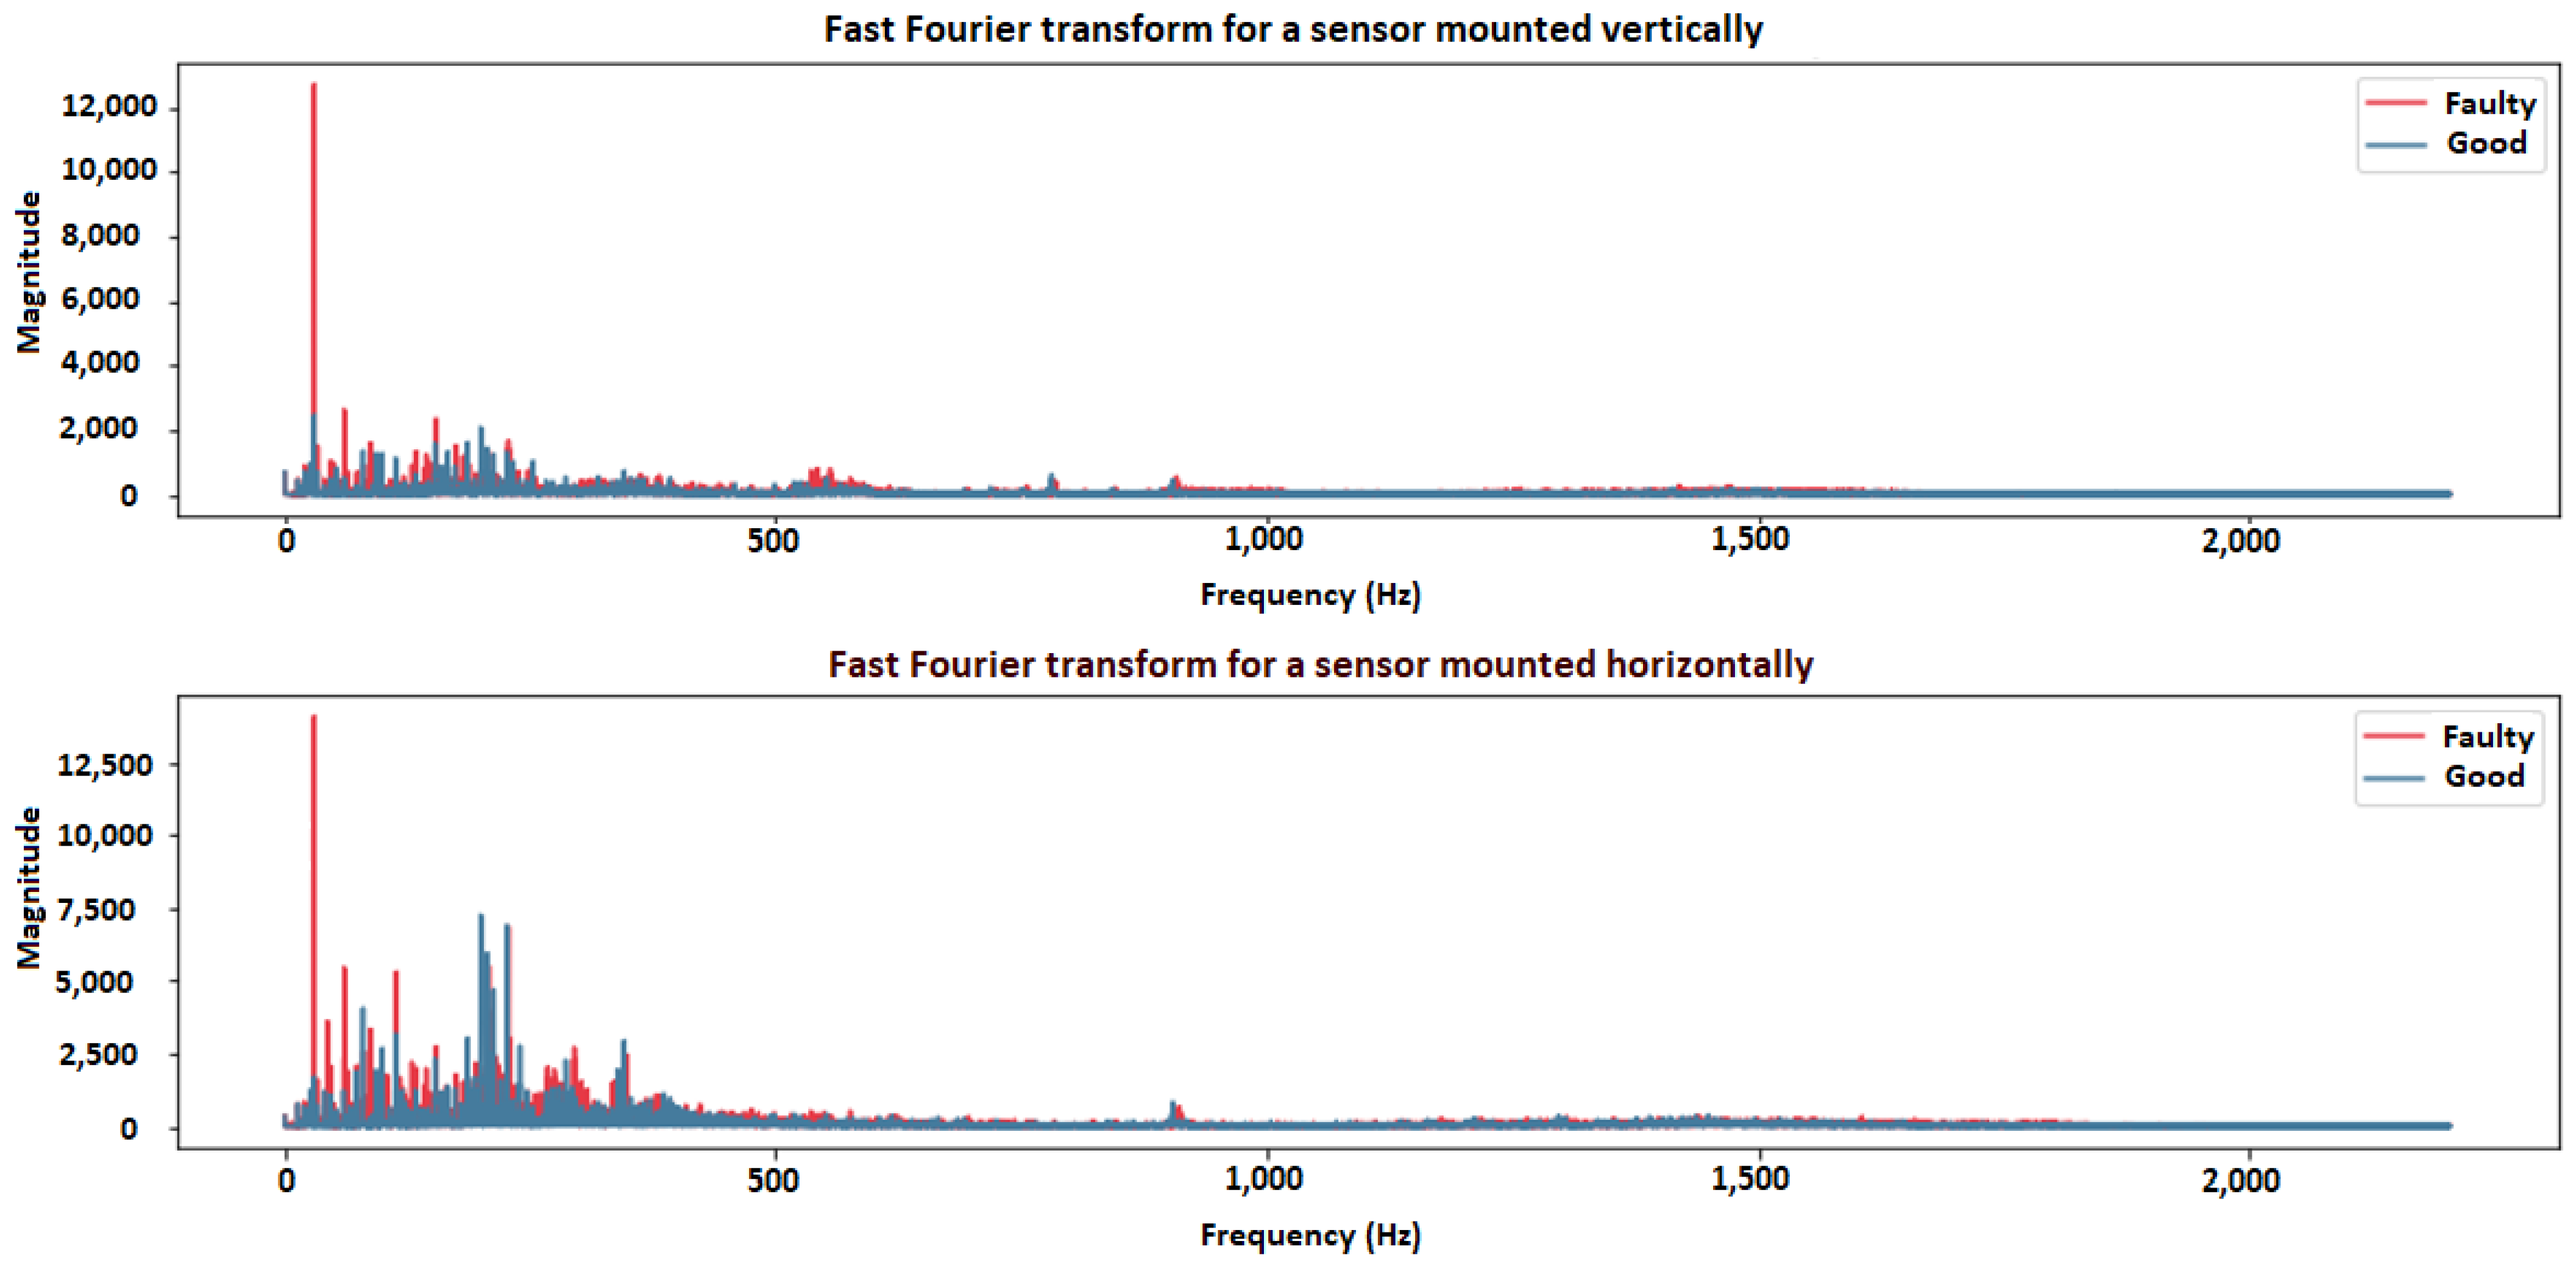
Analysis of the obtained results was carried out after collecting the data from the acceleration sensors. For this purpose, a fast Fourier transform was carried out for both the signal from the system without damage and the system in which the damage occurred in the pulley, drive belt, or both at the same time. First, the analysis was performed for the failed pulley (
Figure 3).
For both the sensor placed horizontally and the one placed vertically, the maximum magnitude of the signal from the failed system occurred for the initial signal frequencies. The analyzed damage affected to a greater extent the sensor placed vertically which suggests that the damaged component vibrates in the horizontal plane. The signal energy from the sensor placed horizontally identified the defective pulley to a lesser extent, which was noticeable as overlapping of signal bars coming from the defective system and the one operating correctly.
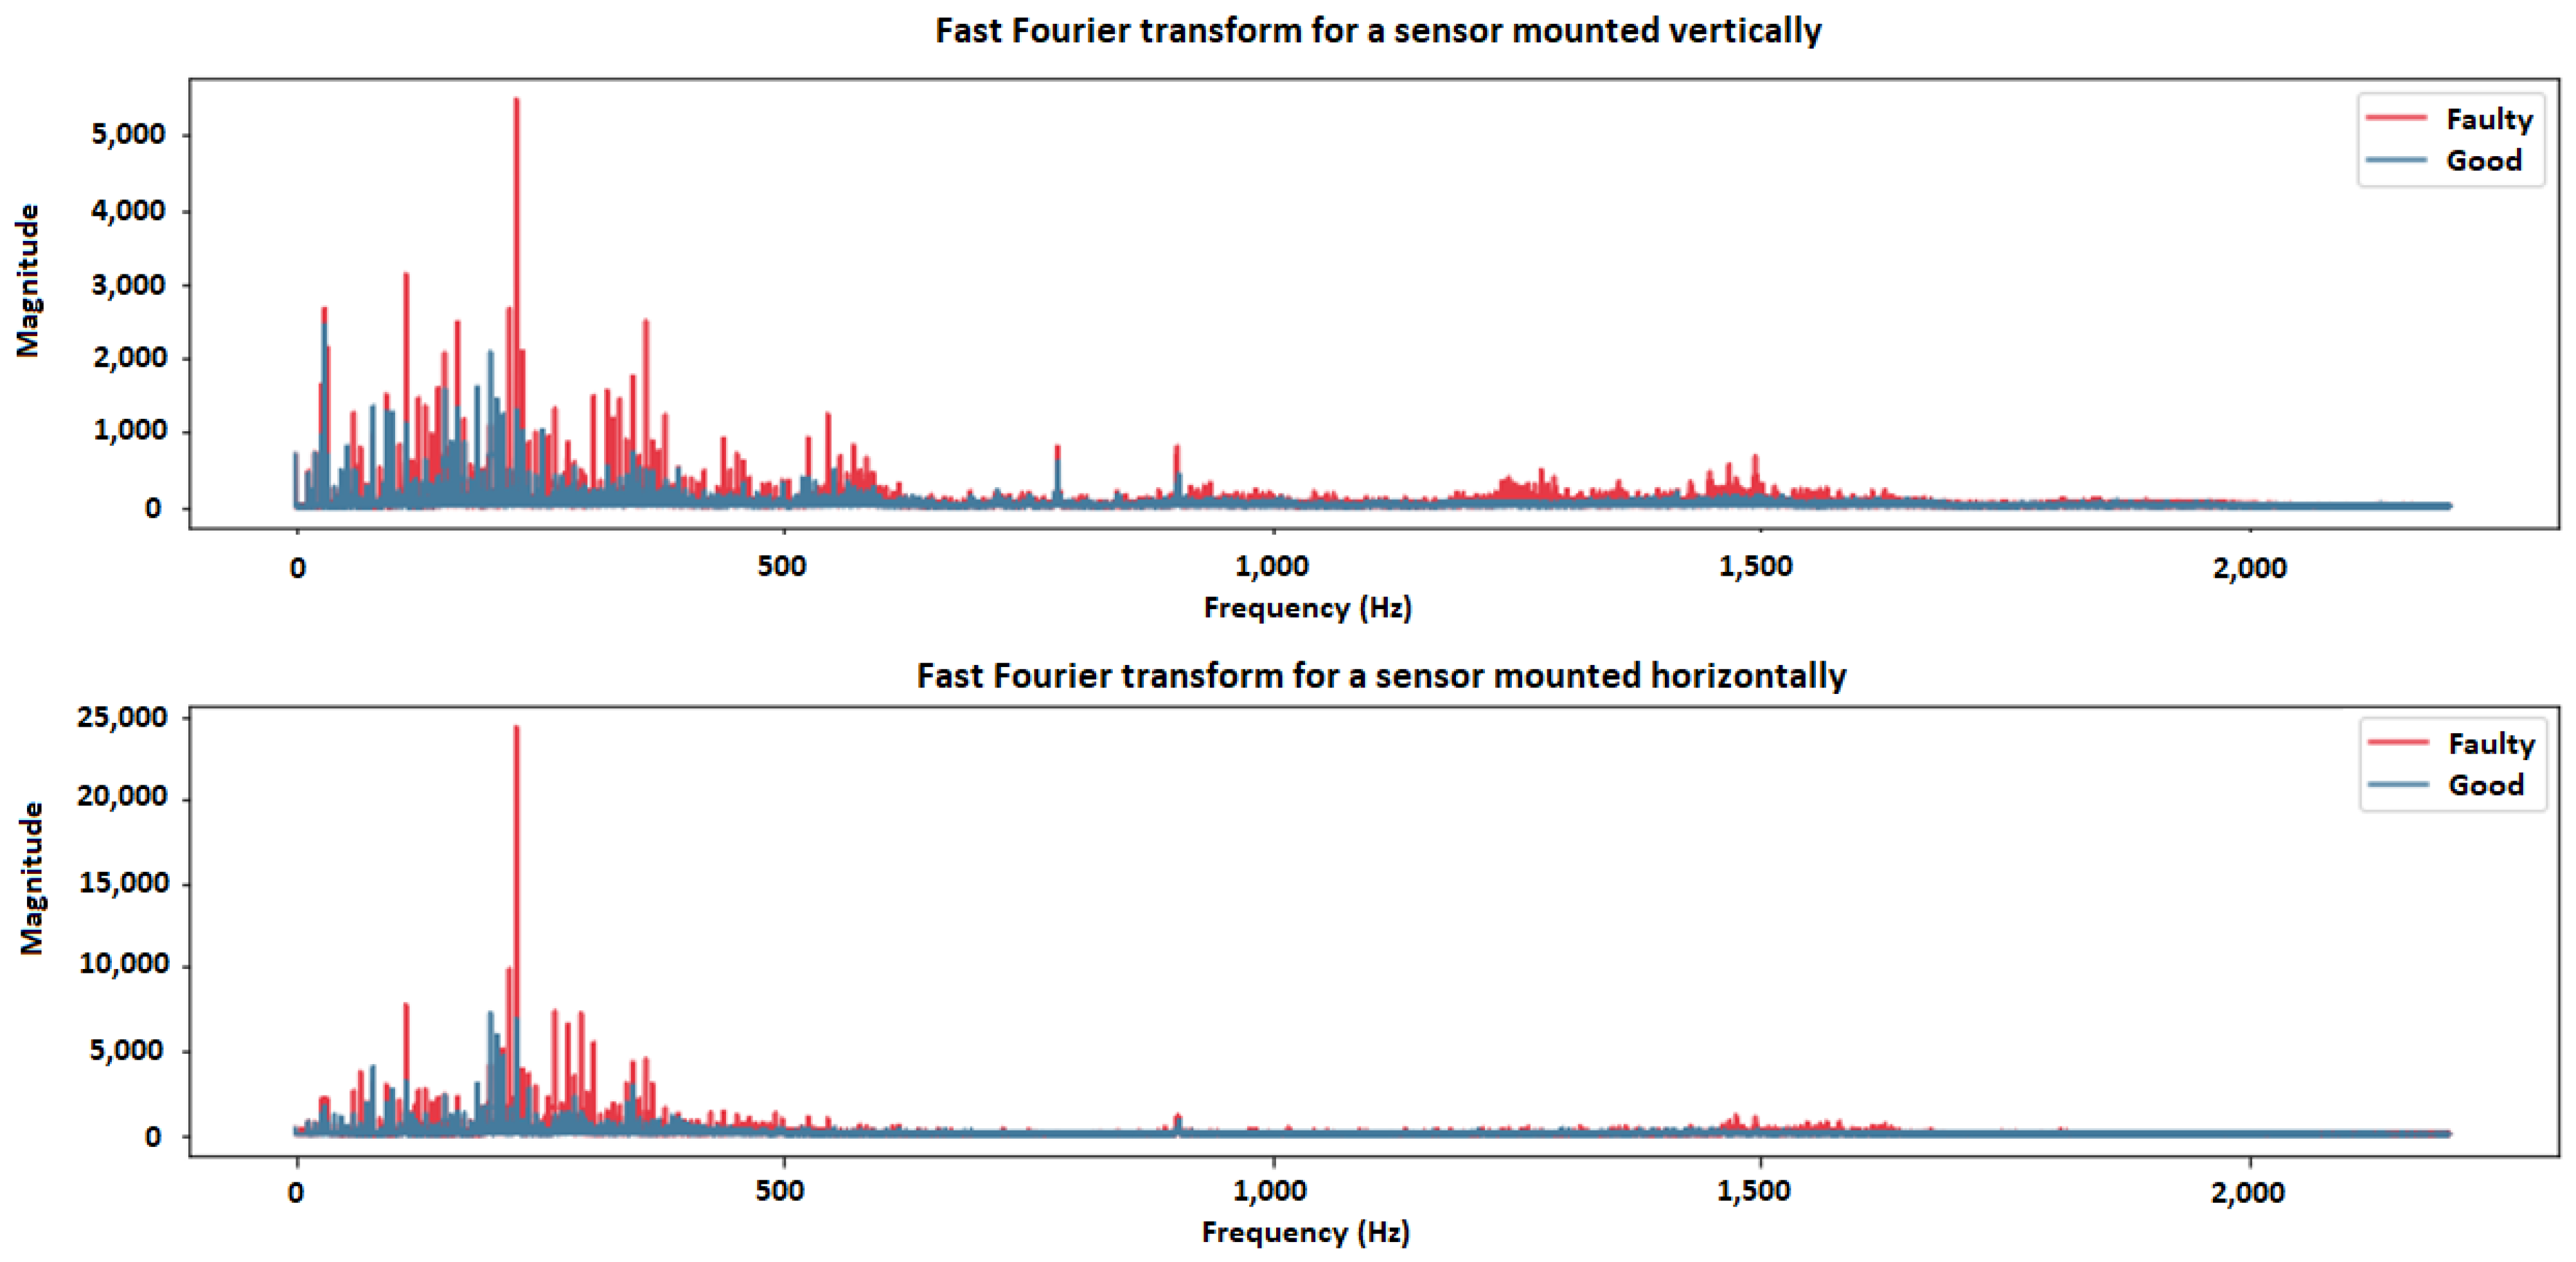
In the next step, the case where a drive belt failure was introduced was analyzed (
Figure 4).
As in the previous case, for the damaged system, the highest energy (magnitude) was characterized by the initial bars of the signal, noting that the maximum value for the horizontally placed sensor was 3× greater than the value obtained for the vertically placed sensor. Limiting the analyzed bandwidth to 2 kHz, the influence of belt drive damage was visible using two ways of sensor placement.
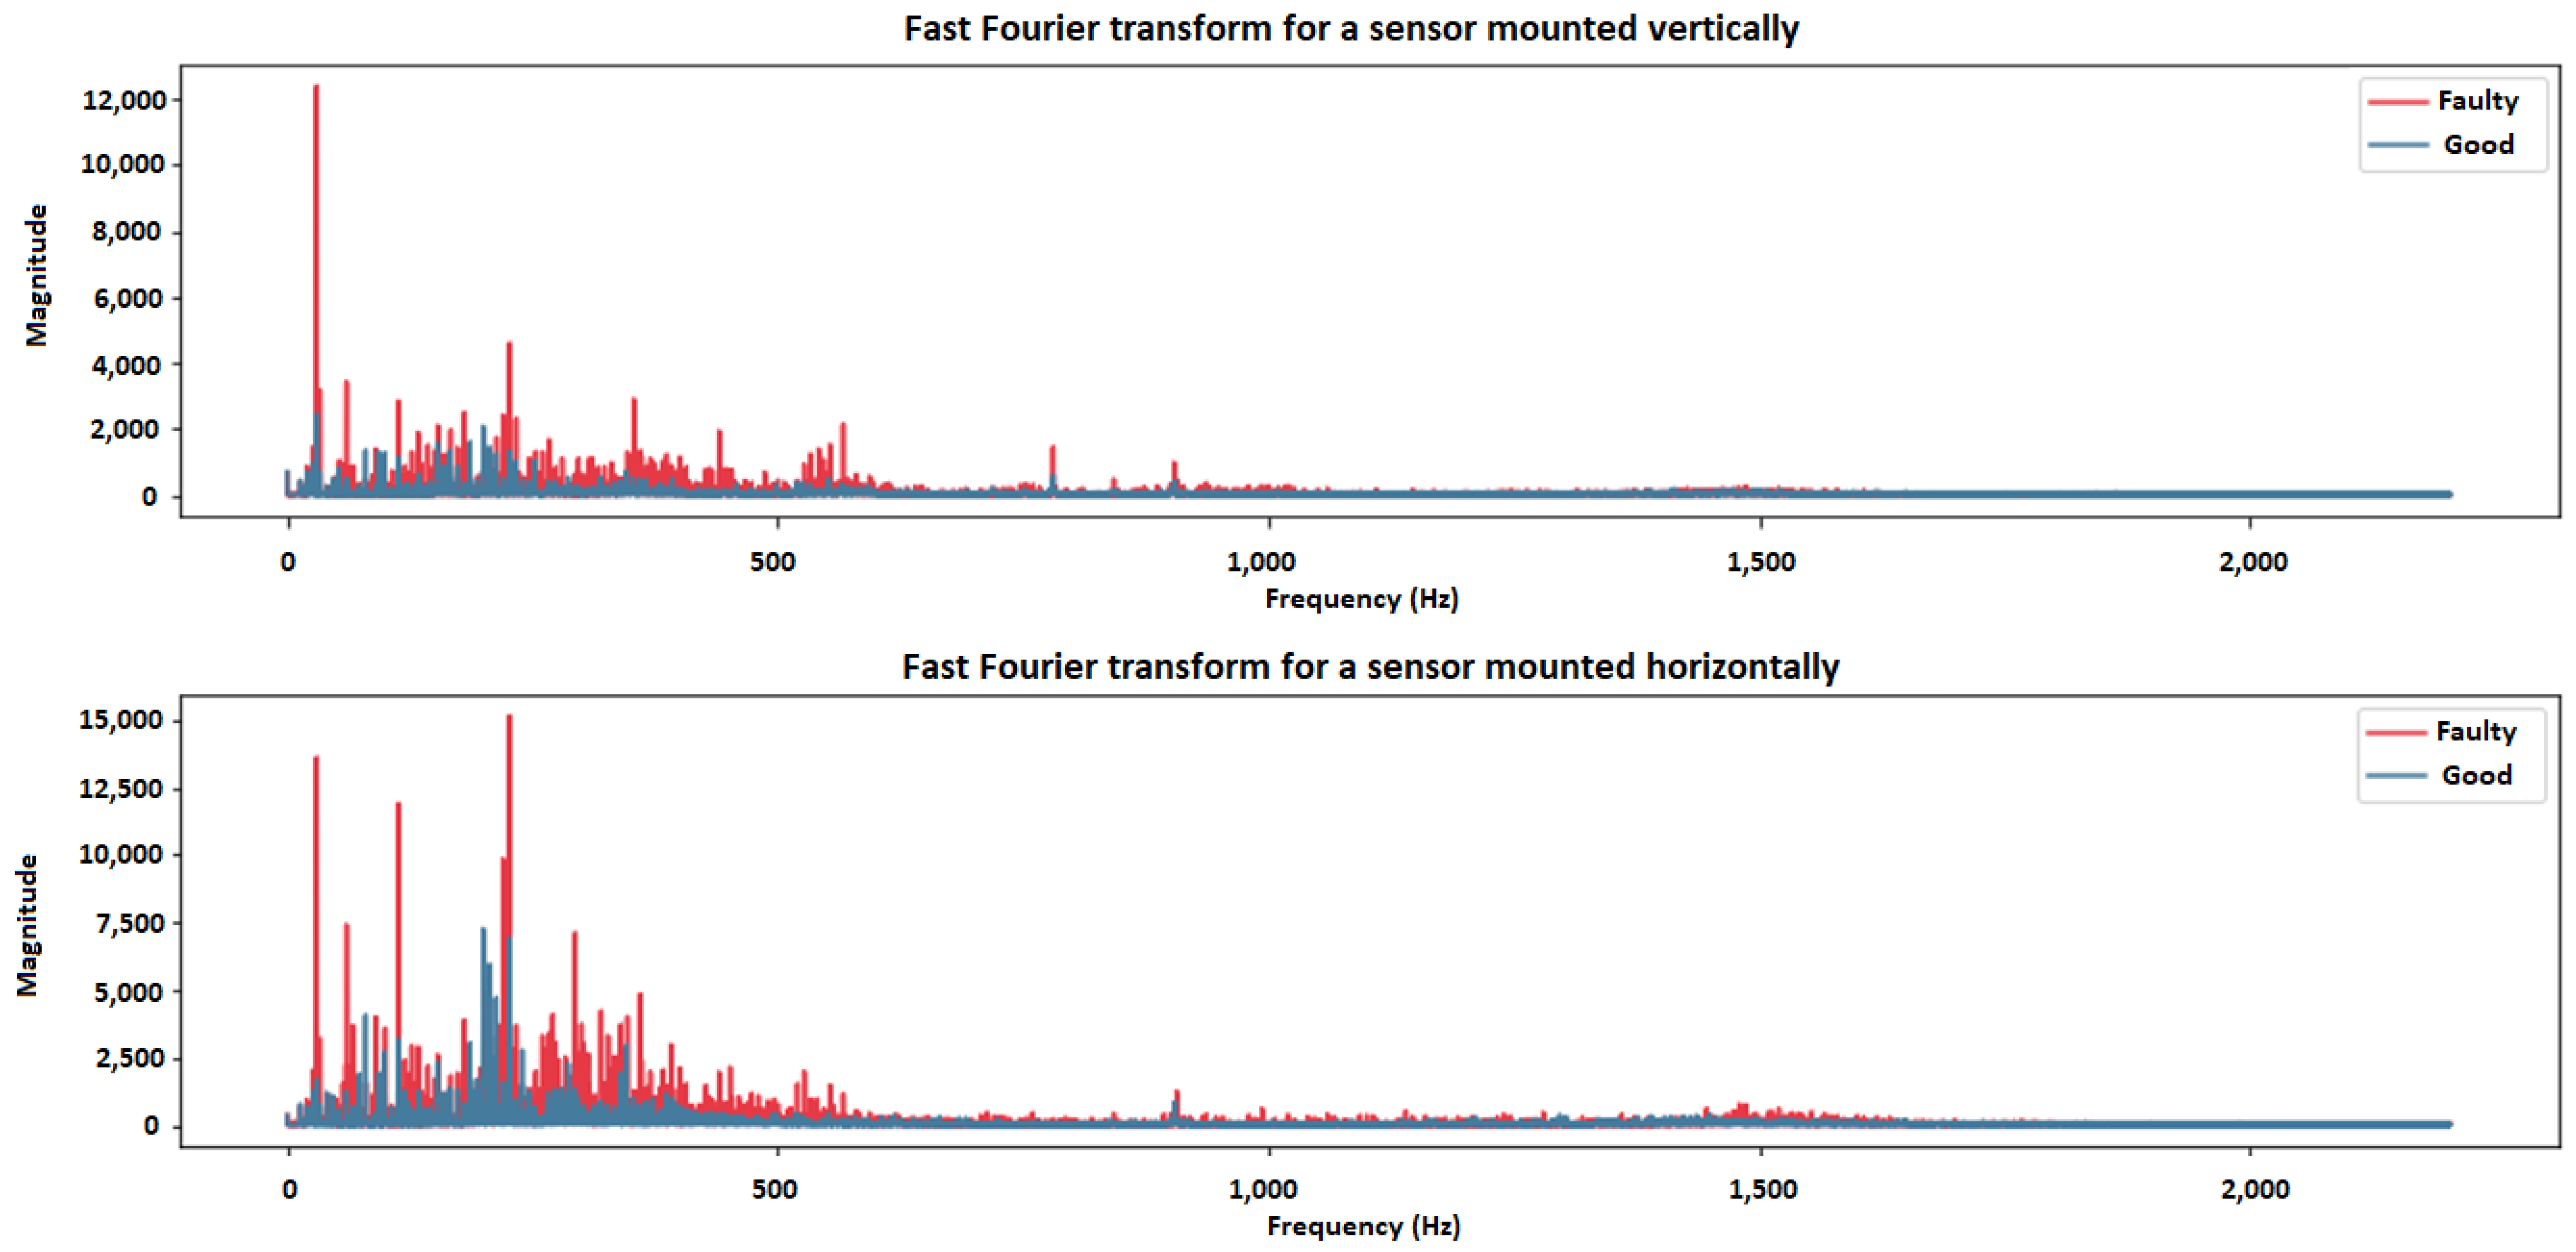
Finally, an identical analysis was performed for a system in which failure was introduced to the pulley and the belt drive simultaneously (
Figure 5).
The fast Fourier transform performed for the case under study confirmed the folding of the two previous signals. The horizontal sensor showed the greater influence of the belt transmission fault, while the vertical sensor showed the influence of both faults through the maximum magnitudes at frequencies below 1 kHz.
Based on the analysis, it should be concluded that the introduction of defects into the system in the form of belt transmission or pulley damage manifested itself in the form of vibrations, which could be measured using acceleration sensors located horizontally or vertically on the device. The influence of the introduced damages on the response of the sensor was visible, which was the basis for proposing an algorithm enabling the detection of system damages by analyzing the signal coming from the mentioned sensors.
3.2. Autoencoder
Autencoder as one of the types of neural networks has a very high ability in remembering and comparing patterns. This feature is effective in time-varying signal problems for which there are problems of deviation from reference signals. Using the comparison with the pattern, encoder networks are a very good tool in problems related to the monitoring of anomalies in sequential signals, so in the research work conducted within the framework of the presented paper, it was decided to analyze the effectiveness of the network in the belt drive example.
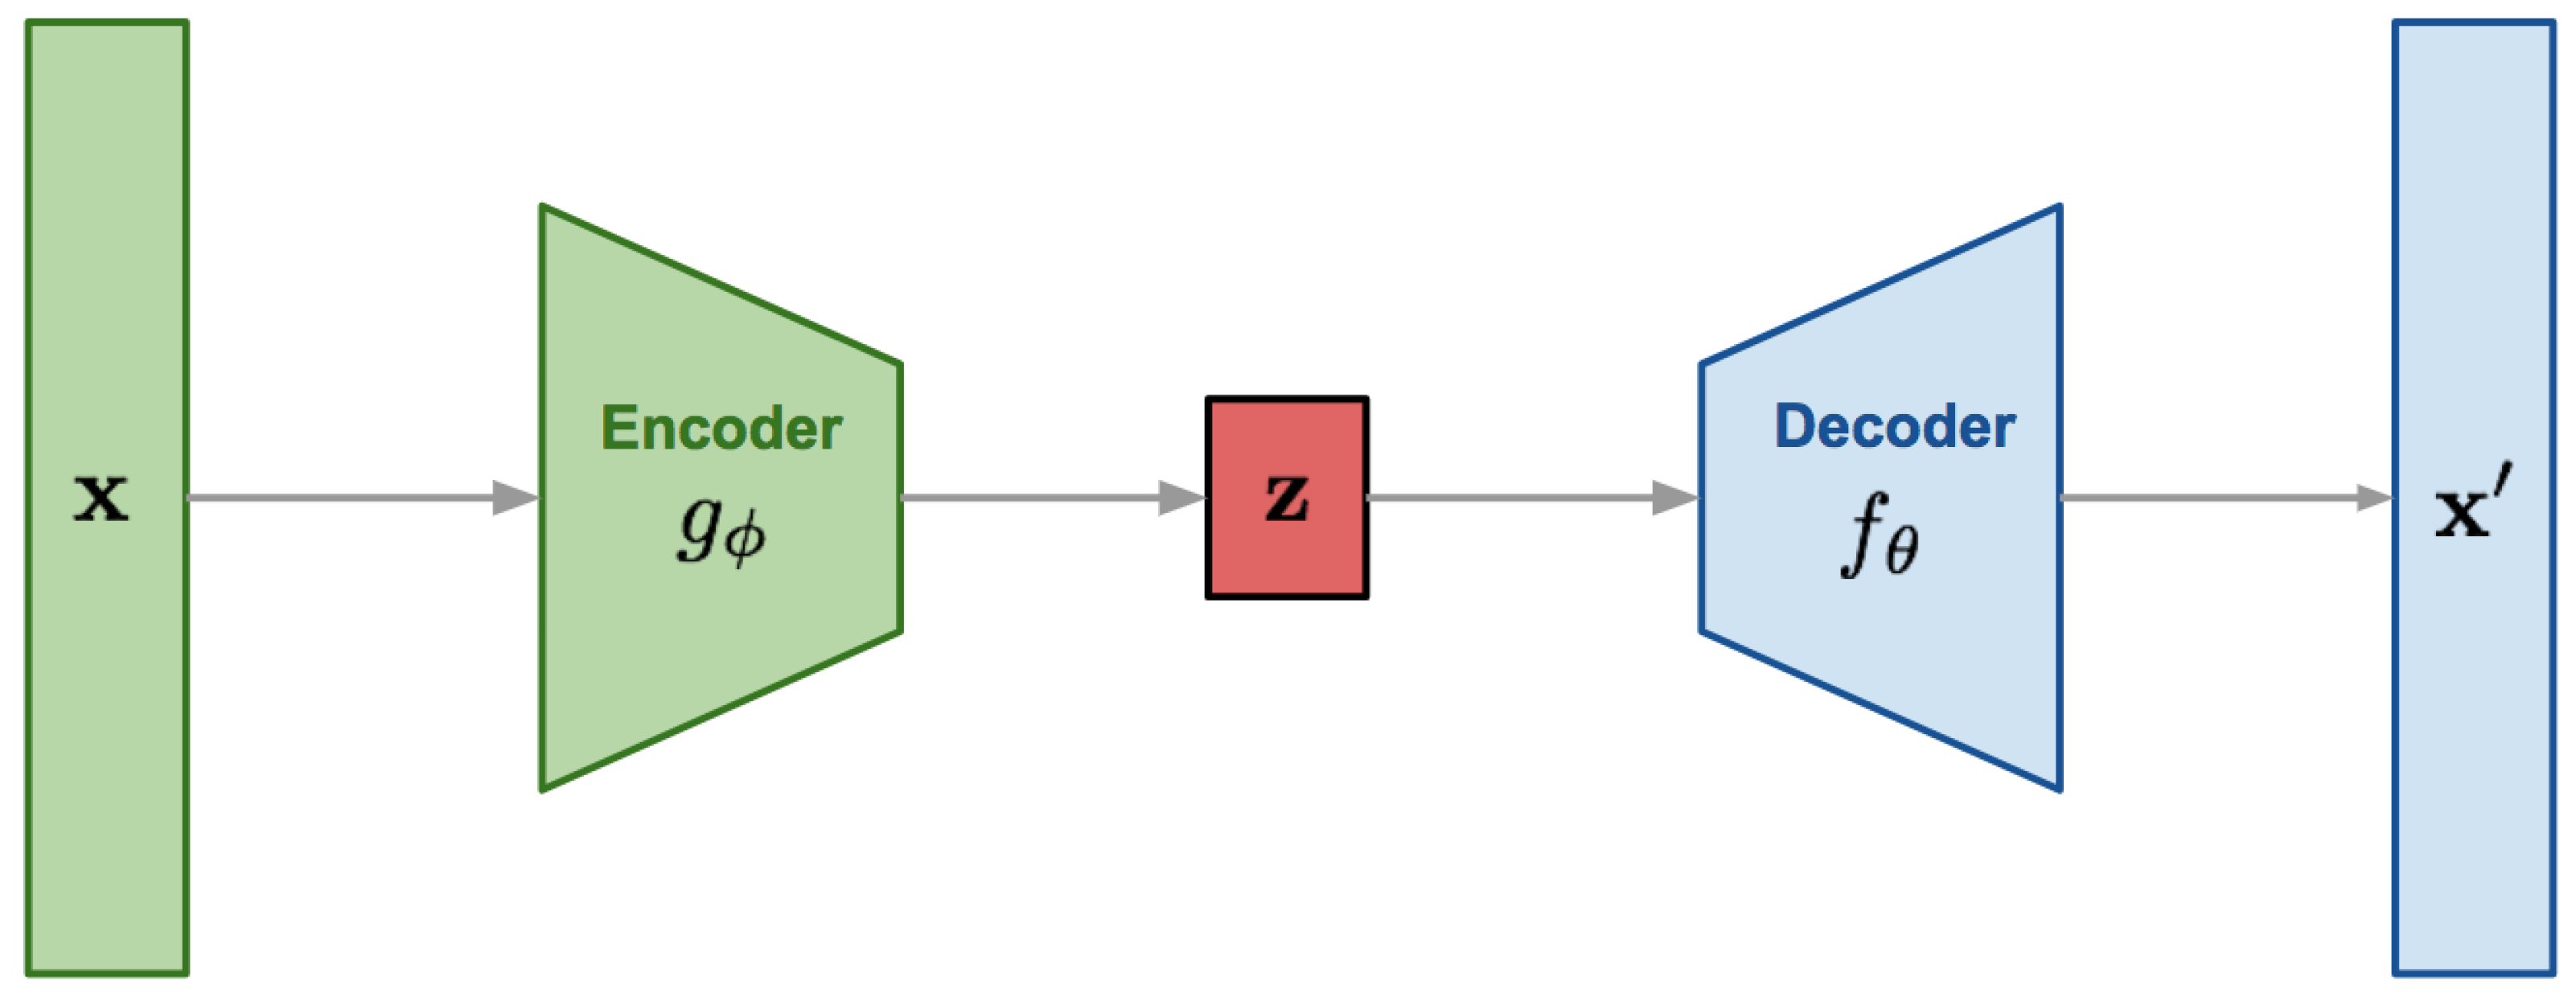
AutoEncoder is a generative unsupervised deep learning algorithm used for reconstructing high-dimensional input data using a neural network with a narrow bottleneck layer in the middle which contains the latent representation of the input data [
20,
21] (
Figure 6). Autoencoder neural network is an unsupervised machine learning algorithm that applies back propagation by setting target values equal to inputs. An autoencoder consists of three components: an encoder, a coder, and a decoder. The encoder’s job is to compress the input data, then the encoder’s job is to generate the code so that the final decoder reconstructs the input data as accurately as possible using only that code. Given a data point
, the loss function is viewed as minimizing the reconstruction error between the training data (
x) and the autoencoder outputs
[
22]:
After the training process, the autoencoder uses the reconstruction error as the anomaly score. Data with high reconstruction error score are considered as anomalies because only normal data are used to train the autoencoder. The autoencoder, by correctly fitting undamaged data, will reconstruct normal data very well, while it will not do so when there is damage that the autoencoder has not encountered.
For the conducted research, it was assumed that the network in its structure consisted of 6 layers (16-8-4-4-8-16). The input size was equal to 36, rectified linear unit activation function for each neuron was used Equation (3).
During the study, 1000 examples were generated, which were divided into a training set consisting of 70% and a verification set consisting of 30%. The number of epochs in the training process was equal to 200. The learning process was carried out using the ADAM optimizer.
3.3. Results
In this study, the performance of the algorithm was verified on data separate from the training set, i.e., data that the algorithm did not process in the learning process. Test data samples were provided for the efficient belt transmission, as well as for the individual failures investigated in this experiment. First, data from a sensor placed horizontally with respect to the belt transmission were input to the proposed algorithm and the learning process of the algorithm was performed to match the data from the undamaged transmission.
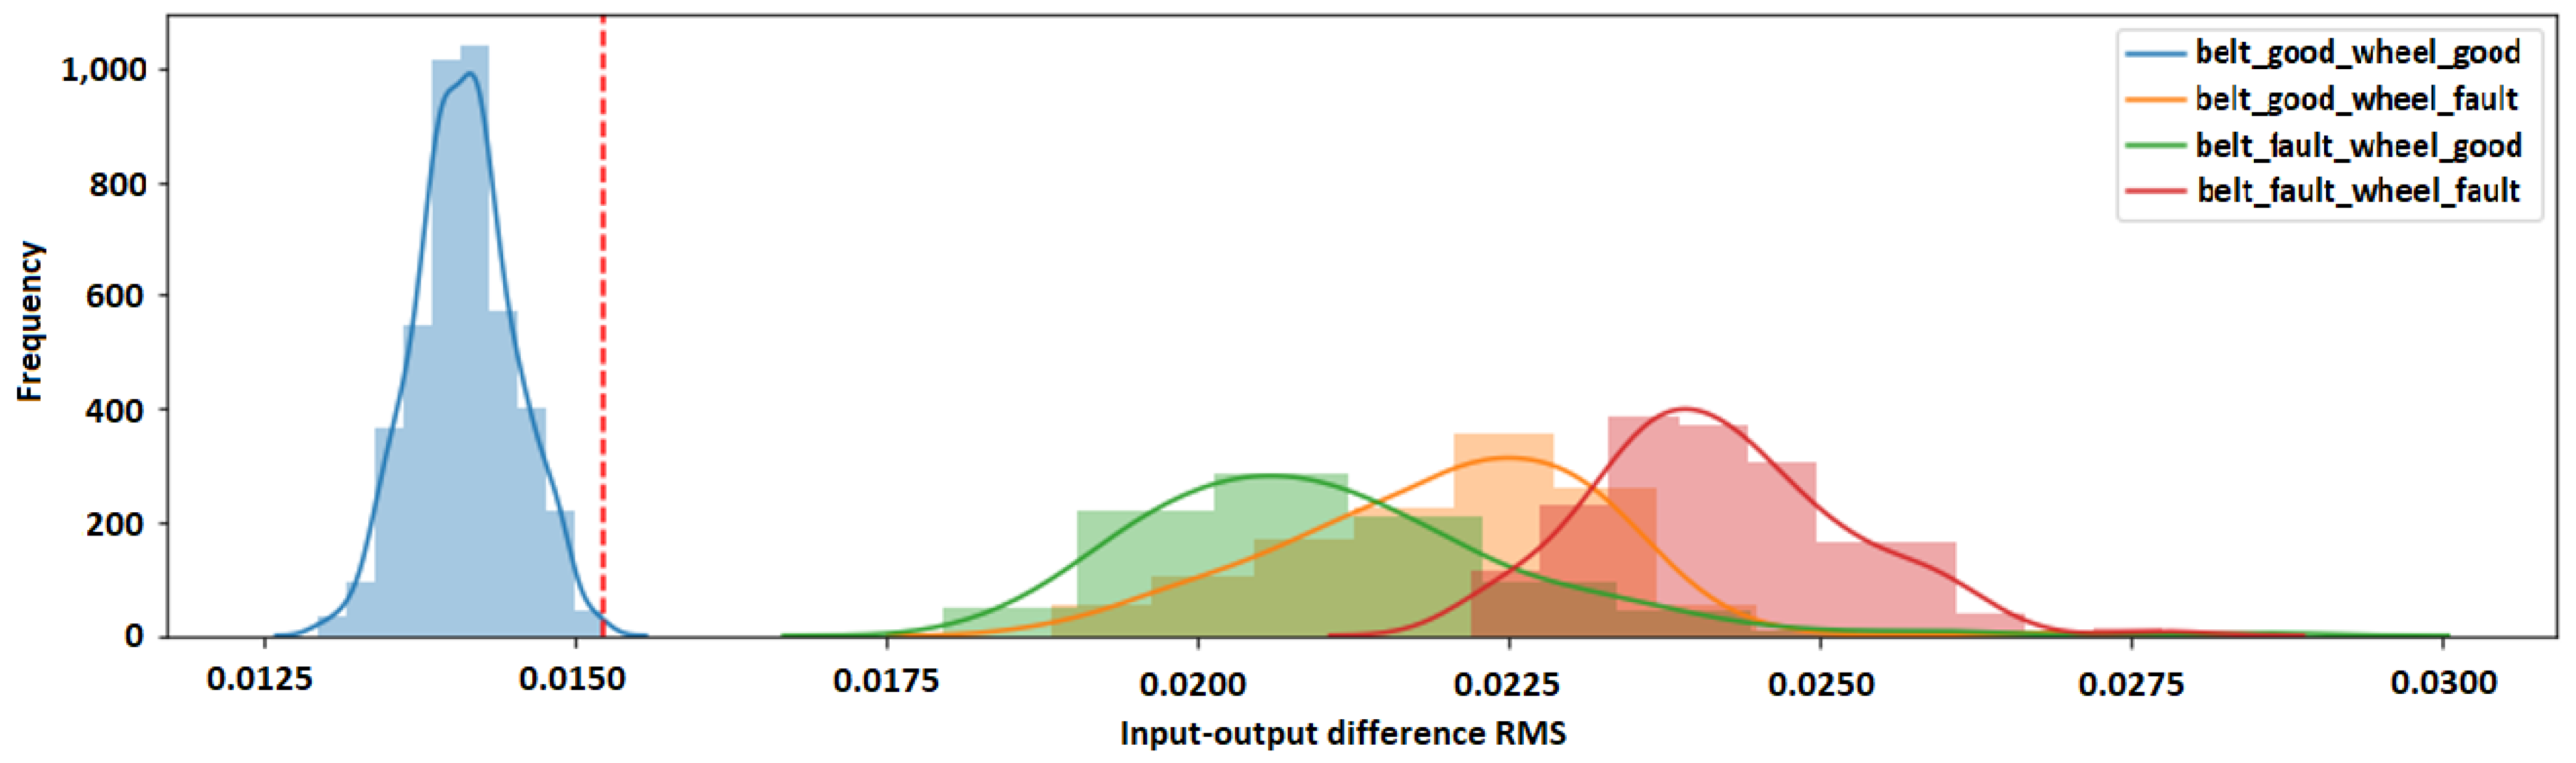
Based on the results obtained, the density distribution of the mapping error of the undamaged values was determined (
Figure 7). The largest error value obtained was 1.51%. In the next step, data from the damaged devices were input to the learned autoencoder. The minimum value of the mapping error was determined, which was 1.75%, and the distribution of the mapping error density for the damaged values (
Figure 7). Determination of the maximum error of the correct values allowed us to draw a cutoff curve of the undamaged class from the damaged class (red line
Figure 7). The mapping error value above which the autoencoder algorithm considered the input signal as anomalous was 1.48%. Finally, the F1 value for the classification test was determined to be 98.89%.
In the second step, the steps were repeated for a sensor placed vertically to the belt transmission. The maximum value of the mapping error in the “undamaged” class was determined, which was 1.8%, and the minimum value of the mapping error, regardless of the type of damage for the damaged object class was 1.85%. The error value separating the damaged and undamaged classes was 1.79% (
Figure 8). The F1 value for the classification test was determined to be 99.33%.
During the design stage, several autoencoder structures were analyzed, modifying the number of neurons at the input and in the hidden layers. Increasing the number of neurons did not increase the accuracy of the proposed solution, reducing the number of neurons by half, i.e., creating a structure of 8-4-2-2-4-8, the classification efficiency decreased by 4 percentage points. Based on the obtained results, it should be concluded that the proposed approach detects introduced anomalies into the tested device with very high efficiency. As it was proven on the basis of conducting tests, the classification accuracy is not less than 98%.
Table 1 provides a summary of the results obtained from the research conducted.
4. Conclusions
Providing service information about the upcoming repair of a given device, determined based on data analytics, improves the planning process and reduces the cost-of-service actions, which are performed periodically to service the device, when it is actually required. In this paper, the application of the system for detecting anomalies was presented on the example of vibration analysis of a belt drive. However, the same algorithm can be used for different types of data, regardless of the sampling rate. Tests conducted on a diagnostic test bench allowed to implement an algorithm that can be used for any type of data. The adaptive nature of the approach allows the model to be trained for both a brand-new device and one that has been in production for a long time and after a service action has been determined to be compliant. The advantage of the proposed solution is the ease of monitoring machine parameters both online and in batch mode. The presented approach makes it possible to indicate deviations from correct operation that have been registered on the ball bearing, which is important information for the service section talking about a potential occurrence of a damage or a progressive degradation process of the element. Early detection of anomalies can prevent unplanned production line stoppages that can occur by ignoring deviations in the operation of a given device.
The approach presented in this article, as well as others that are carried out in the APA Group, allow to implement tools that are designed to support the process of inference, by extracting information from data, which are valuable from the point of view of management and production quality.
Author Contributions
Conceptualization, A.P. and S.T.; methodology, S.T.; software, W.P.; validation, A.P., W.P. and S.T.; formal analysis, J.K.; investigation, A.P.; resources, W.P.; data curation, A.P.; writing—original draft preparation, S.T.; writing—review and editing, J.K., A.P.; visualization, S.T. and W.P.; supervision, J.K.; project administration, D.G.; funding acquisition, D.G. All authors have read and agreed to the published version of the manuscript.
Funding
This research and the APC were funded by the Silesian University of Technology.
Institutional Review Board Statement
Not applicable.
Informed Consent Statement
Not applicable.
Data Availability Statement
The data presented in this study are not available due to the sensitive nature of the data, to protect participant’s privacy.
Acknowledgments
This work was supported by the European Union under the ROP WSL for 2014–2020 “Development of the Nazca 4.0 production optimization platform through R&D”.
Conflicts of Interest
The authors declare no conflict of interest.
References
- Bonci, A.; Longhi, S.; Nabissi, G. Fault Diagnosis in a belt-drive system under non-stationary conditions. An industrial case study. In Proceedings of the 2021 IEEE Workshop on Electrical Machines Design, Control and Diagnosis (WEMDCD), Modena, Italy, 8–9 April 2021; pp. 260–265. [Google Scholar] [CrossRef]
- Bonci, A.; Pirani, M.; Longhi, S. An embedded database technology perspective in cyber-physical production systems. Procedia Manuf. 2017, 11, 830–837. [Google Scholar] [CrossRef]
- Bonci, A.; Pirani, M.; Cucchiarelli, A.; Carbonari, A.; Naticchia, B.; Longhi, S. A review of recursive holarchies for viable systems in CPSs. In Proceedings of the 2018 IEEE 16th International Conference on Industrial Informatics (INDIN), Porto, Portugal, 18–20 July 2018; IEEE: Piscataway, NJ, USA, 2018; pp. 37–42. [Google Scholar]
- Temich, S.; Pollak, A.; Kucharczyk, J.; Ptasiński, W.; Mężyk, A.; Gąsiorek, D. Prediction of energy consumption in the Industry 4.0 platform-solutions overview. J. Theor. Appl. Mech. 2021, 59, 455–468. [Google Scholar] [CrossRef]
- Umeda, S.; Tamaki, K.; Sumiya, M.; Kamaji, Y. Planned Maintenance Schedule Update Method for Predictive Maintenance of Semiconductor Plasma Etcher. In Proceedings of the 2020 International Symposium on Semiconductor Manufacturing (ISSM), Tokyo, Japan, 15–16 December 2020; pp. 1–4. [Google Scholar] [CrossRef]
- Bonilla, S.H.; Silva, H.R.O.; da Silva, M.T.; Gonçalves, R.F.; Sacomano, J.B. Industry 4.0 and sustainability implications: A scenario-based analysis of the impacts and challenges. Sustain. Switz. 2018, 10, 3740. [Google Scholar] [CrossRef]
- Zhong, R.Y.; Xu, X.; Klotz, E.; Newman, S.T. Intelligent Manufacturing in the Context of Industry 4.0: A Review. Engineering 2017, 3, 616–630. [Google Scholar] [CrossRef]
- Ptasiński, W.; Pollak, A.; Temich, S.; Gąsiorek, D. The impact of bearing condition on maintenance of production process. Manag. Qual. 2021, 3, 60–73. [Google Scholar]
- Gruber, F.E. Industry 4.0: A Best Practice Project of the Automotive Industry. In Digital Product and Process Development Systems; Kovács, G.L., Kochan, D., Eds.; Springer: Berlin/Heidelberg, Germany, 2013; pp. 36–40. [Google Scholar] [CrossRef]
- Leme, J.V.; Casaca, W.; Colnago, M.; Dias, M.A. Towards assessing the electricity demand in Brazil: Data-driven analysis and ensemble learning models. Energies 2020, 13, 1407. [Google Scholar] [CrossRef]
- Apagroup Ipoe. Available online: https://www.apagroup.pl/en/seop (accessed on 7 January 2021).
- Gościniak, T.; Wodarski, K. Effectiveness of using the method of artificial intelligence in maintenance of ict systems. Manag. Syst. Prod. Eng. 2019, 27, 40–45. [Google Scholar] [CrossRef]
- Pollak, A.; Hilarowicz, A.; Walczak, M.; Gąsiorek, D. A Framework of Action for Implementation of Industry 4.0. an Empirically Based Research. Sustainability 2020, 12, 5789. [Google Scholar] [CrossRef]
- Wang, B.; Tao, F.; Fang, X.; Liu, C.; Liu, Y.; Freiheit, T. Smart Manufacturing and Intelligent Manufacturing: A Comparative Review. Engineering 2020, 7, 738–757. [Google Scholar] [CrossRef]
- Fidali, M. Metody Diagnostyki Maszyn i Urządzeń w Predykcyjnym Utrzymaniu Ruchu; Elamed Media Group: Katowice, Poland, 2020; ISBN 978-83-65883-09-4. [Google Scholar]
- Pierleoni, P.; Belli, A.; Palma, L.; Sabbatini, L. Diagnosis and Prognosis of a Cartesian Robot’s Drive Belt Looseness. In Proceedings of the 2020 IEEE International Conference on Internet of Things and Intelligence System (IoTaIS), West Java, Indonesia, 23–24 November 2021; pp. 172–176. [Google Scholar] [CrossRef]
- Yordanov, Y.; Gyurov, V. Experimental Study of Methods for Diagnostics of Electrical Equipment with Belt Drive Mechanisms. In Proceedings of the 2020 12th Electrical Engineering Faculty Conference (BulEF), Varna Town, Bulgaria, 9–12 September 2020; pp. 1–5. [Google Scholar] [CrossRef]
- Timofiejczuk, A.; Brodny, J.; Loska, A. Exploitation policy in the aspect of Industry 4.0 concept—overview of selected research. Multidiscip. Asp. Prod. Eng. 2018, 1, 353–359. [Google Scholar] [CrossRef][Green Version]
- GUNT PT 500. Available online: https://www.gunt.de/en/products/machinery-diagnostic-system-base-unit/052.50000/pt500/glct-1:pa-148:pr-1022 (accessed on 17 September 2021).
- Dawidowski, P.; Sipowicz, J.; Balcerek, P.; Burek, A.; Smolana, M. Power System Event Detection using Auto-encoders and the Fourier Transform. In Proceedings of the 2019 Modern Electric Power Systems (MEPS), Wroclaw, Poland, 9–12 September 2019; pp. 1–4. [Google Scholar] [CrossRef]
- Nam, K.H.; Song, Y.J.; Yun, I.D. SSS-AE: Anomaly Detection using Self-Attention based Sequence-to -Sequence Auto-Encoder in SMD Assembly Machine Sound. IEEE Access 2021, 9, 131191–131202. [Google Scholar] [CrossRef]
- Wang, X.; Du, Y.; Lin, S.; Cui, P.; Shen, Y.; Yang, Y. adVAE: A self-adversarial variational autoencoder with Gaussian anomaly prior knowledge for anomaly detection. Knowl.-Based Syst. 2020, 190, 105187. [Google Scholar] [CrossRef]
| Publisher’s Note: MDPI stays neutral with regard to jurisdictional claims in published maps and institutional affiliations. |
© 2021 by the authors. Licensee MDPI, Basel, Switzerland. This article is an open access article distributed under the terms and conditions of the Creative Commons Attribution (CC BY) license (https://creativecommons.org/licenses/by/4.0/).


