
Power-Based Concept for Current Injection by Inverter-Interfaced Distributed Generations during Transmission-Network Faults


Abstract
:1. Introduction
1.1. Motivation and Literature Review
1.2. Contribution and Structure of the Paper
2. IIDG Model for FFC Injection
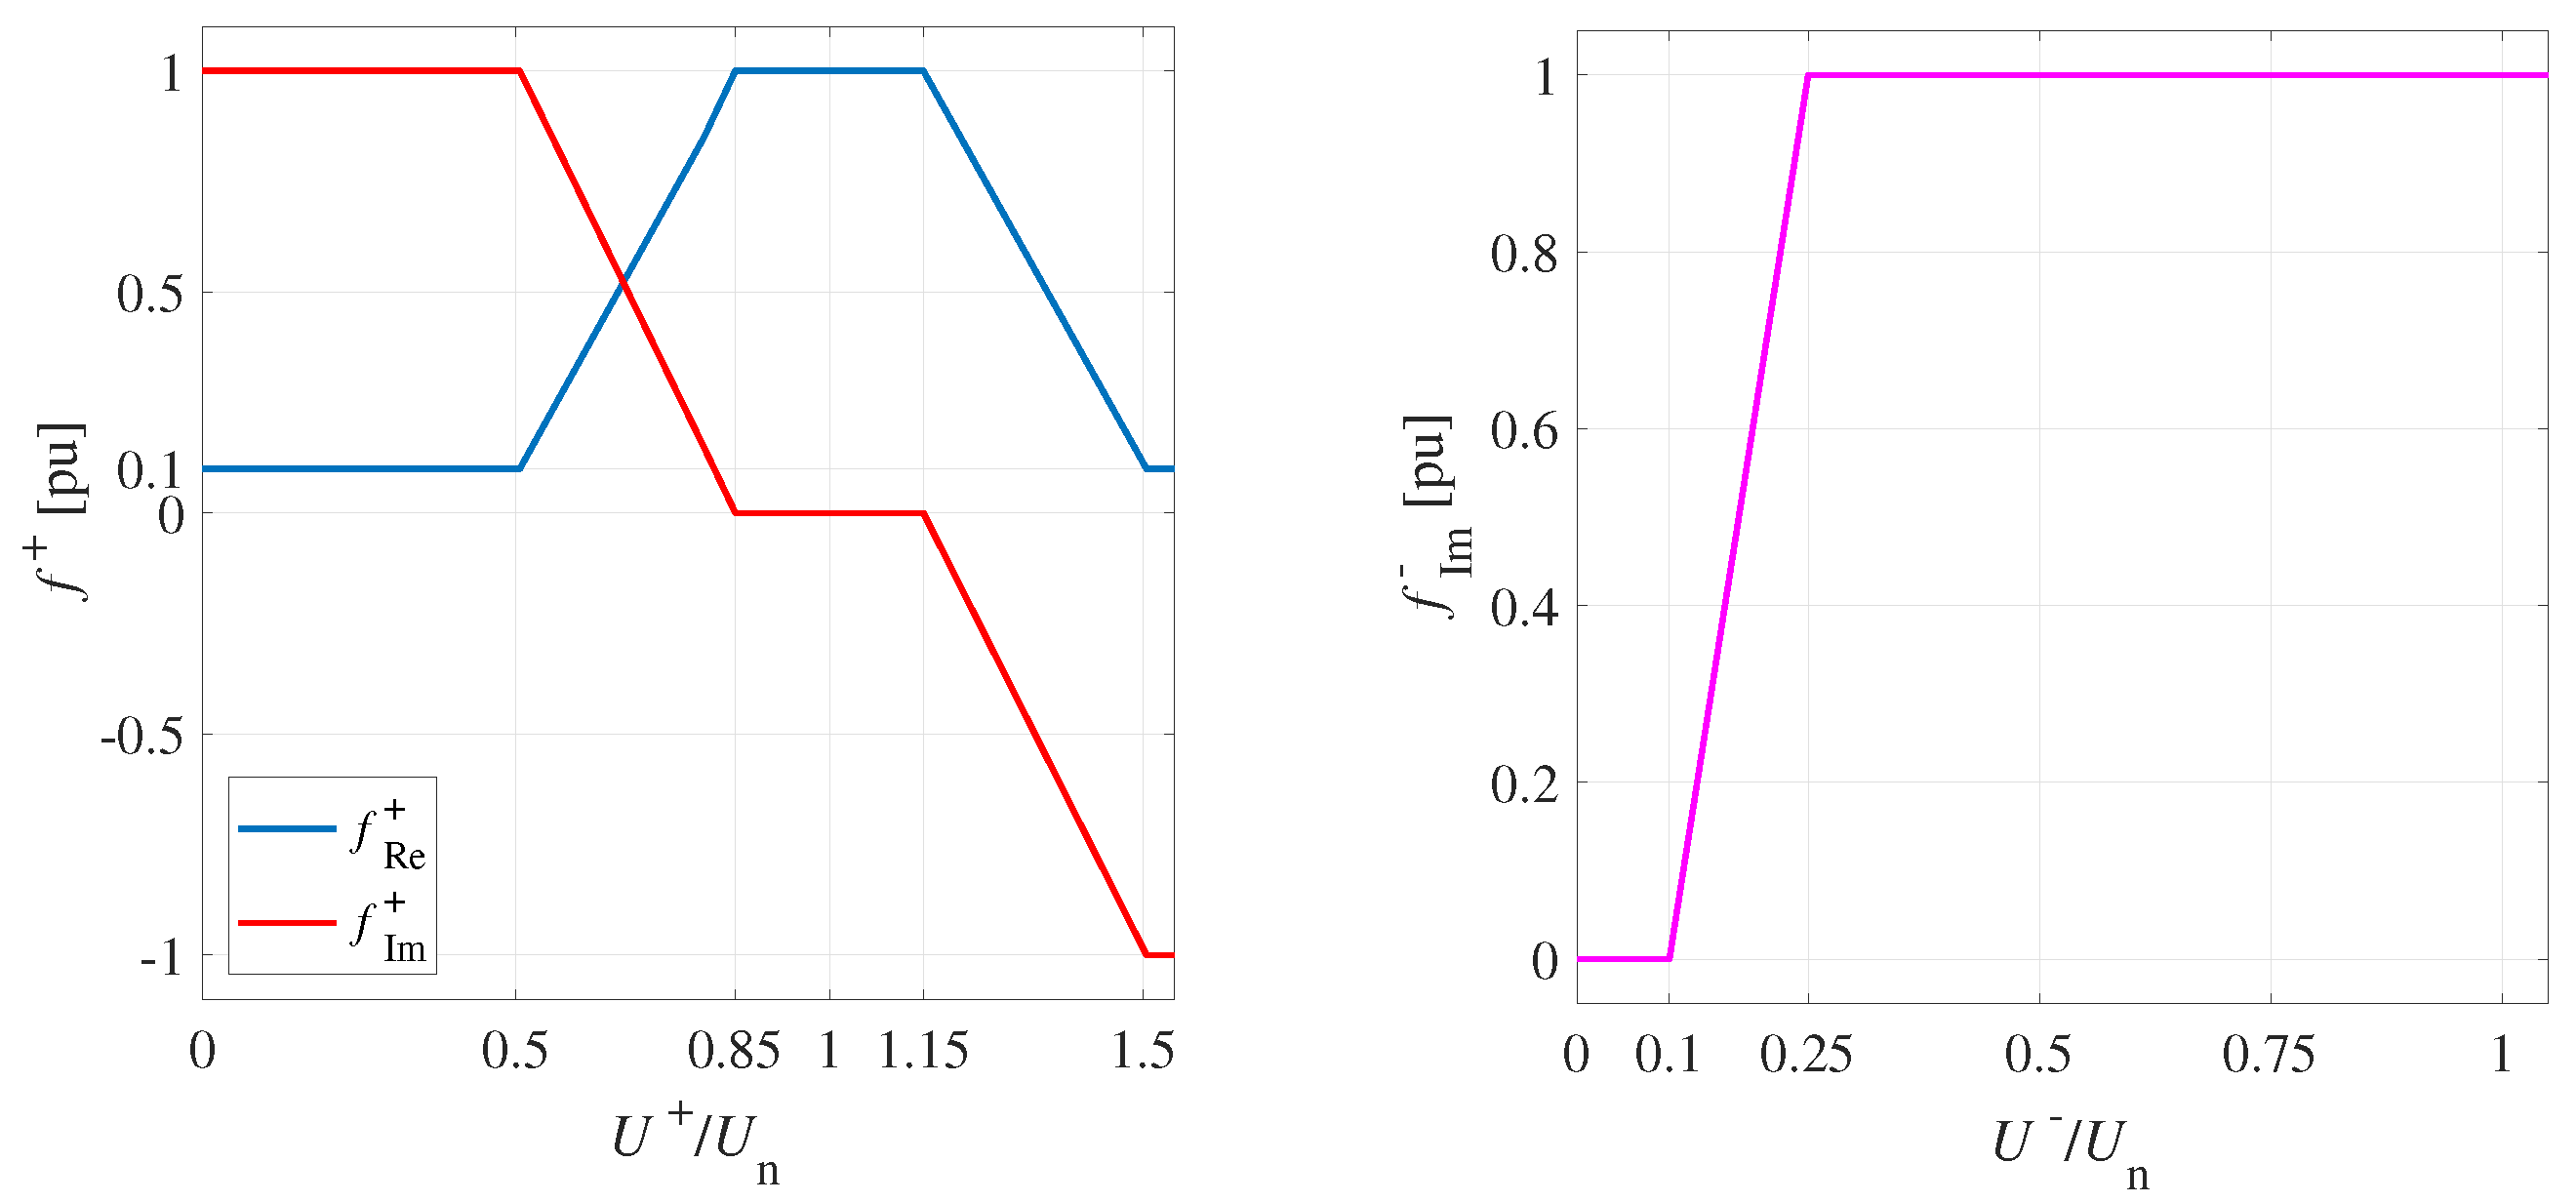
2.1. Voltage Characteristics
2.2. Current- and Power-Based Concept
2.3. BFFC and UFFC
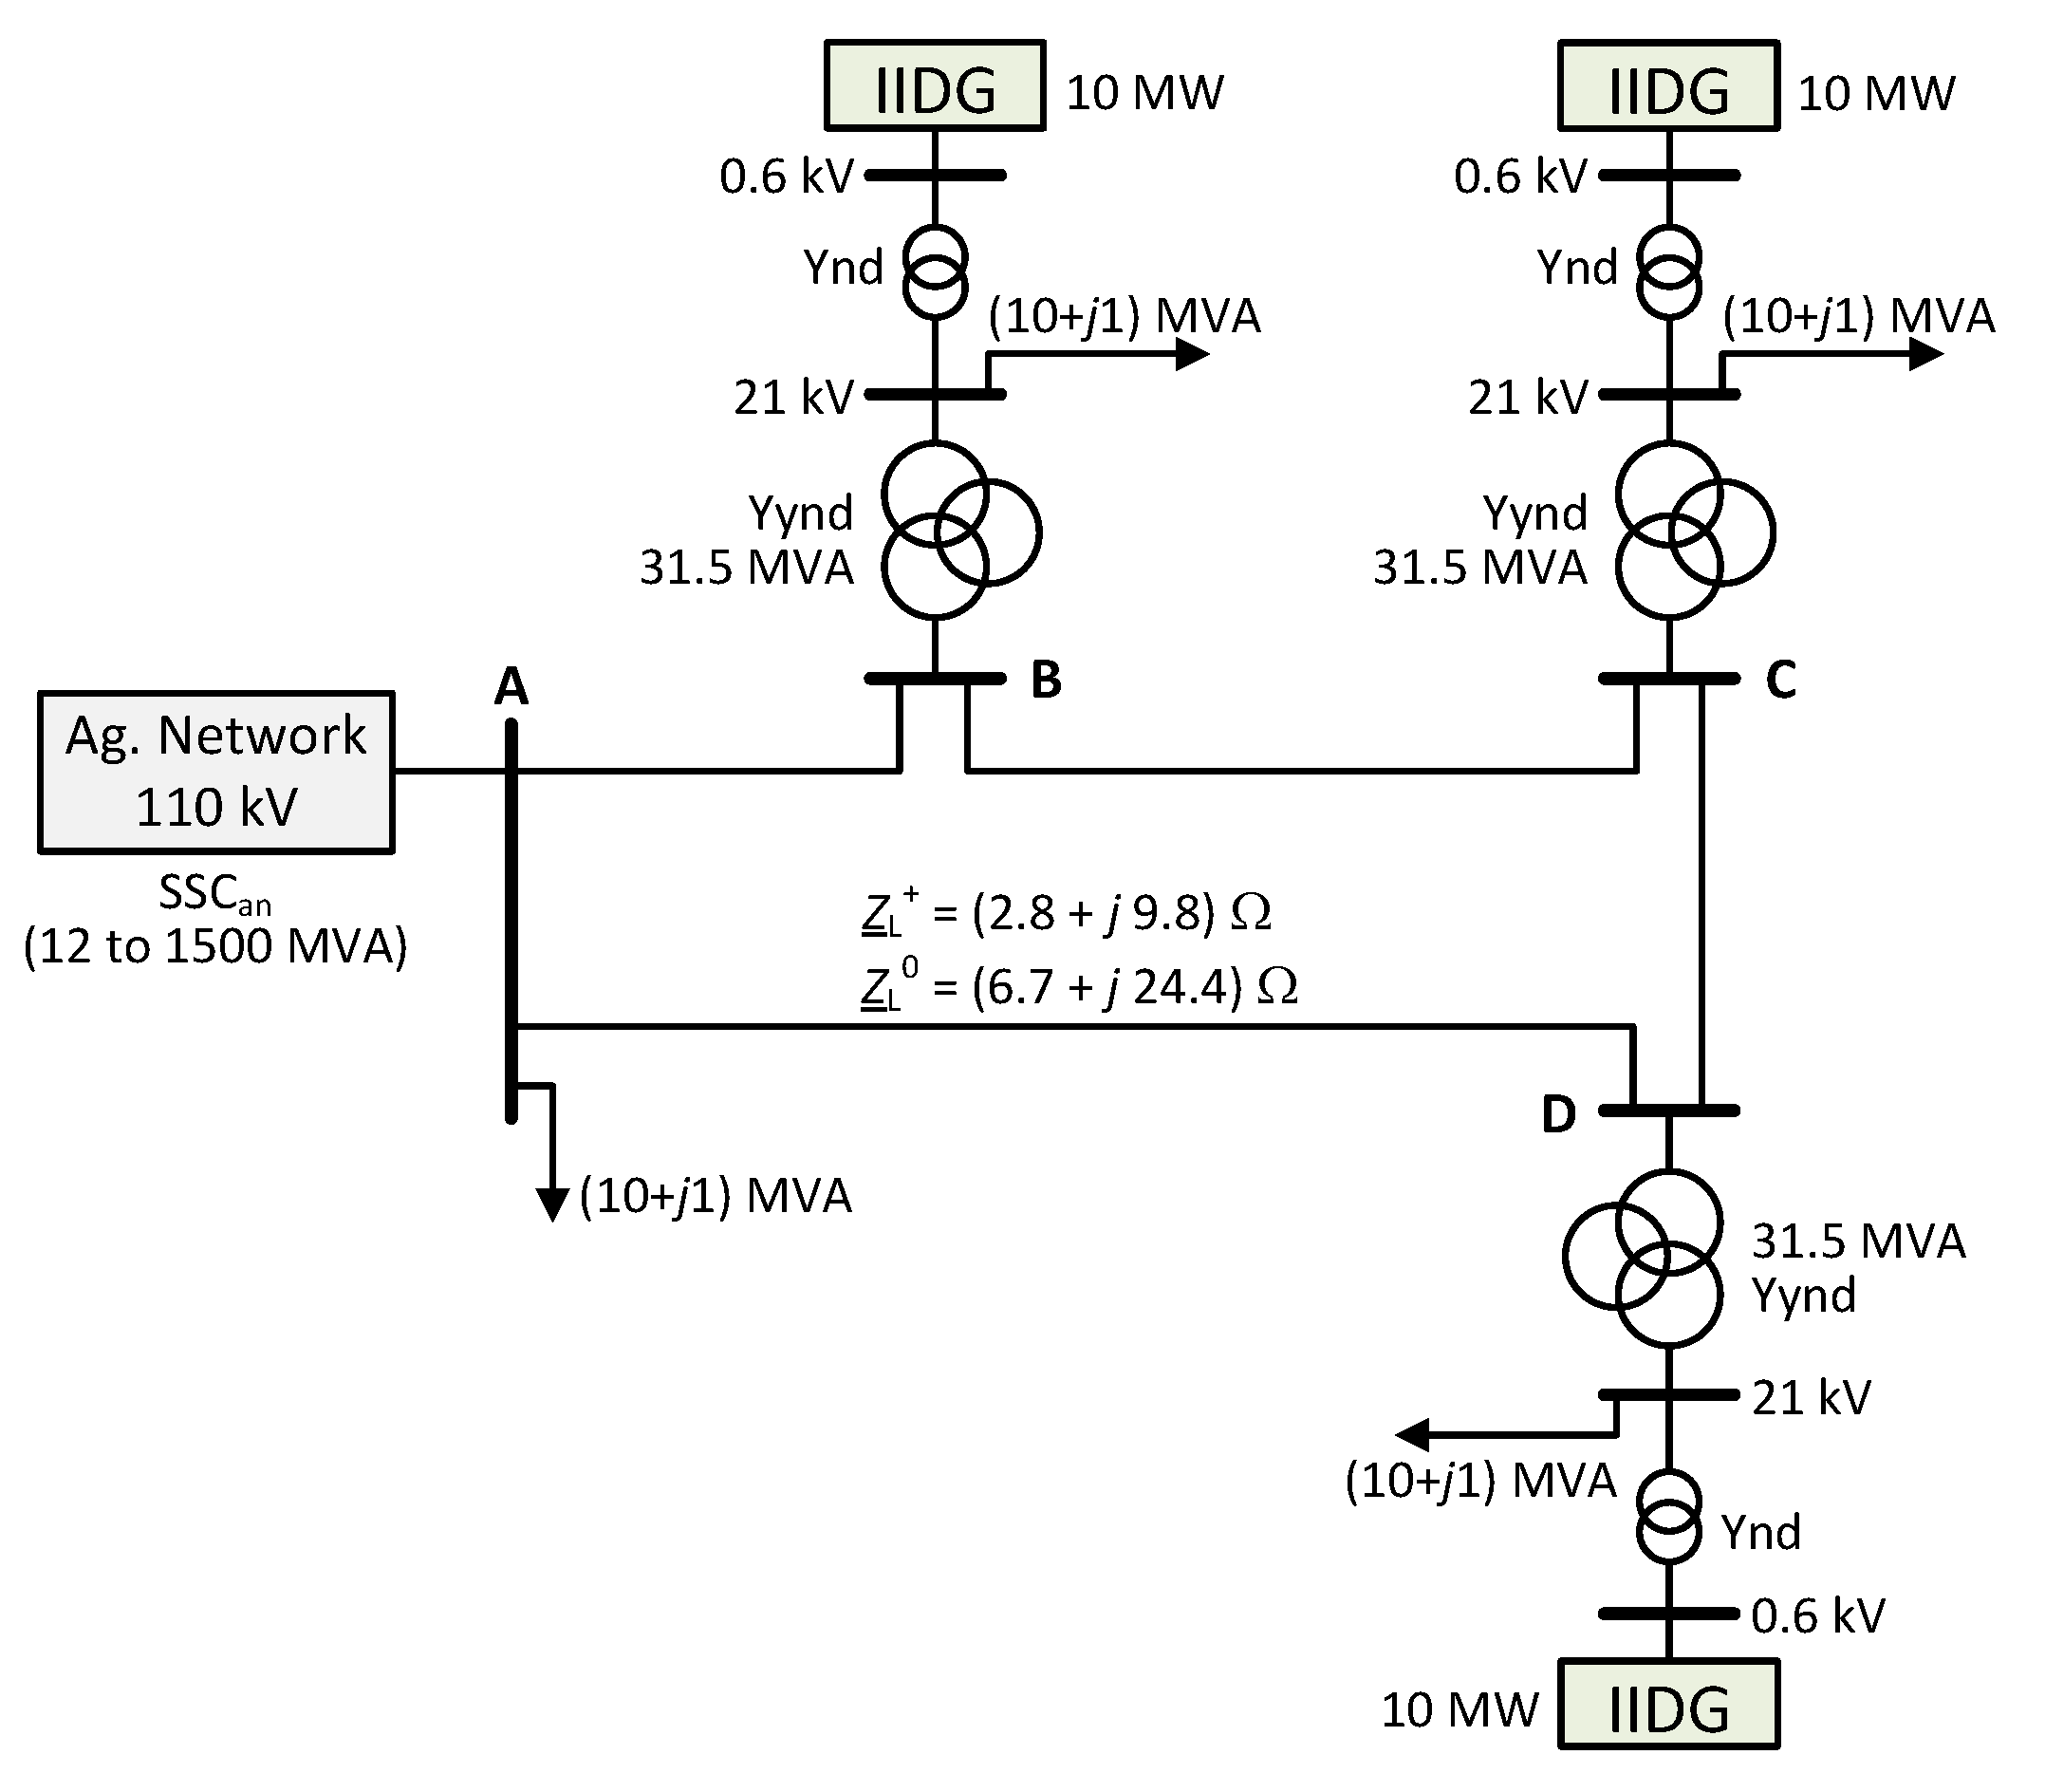
3. Test Network
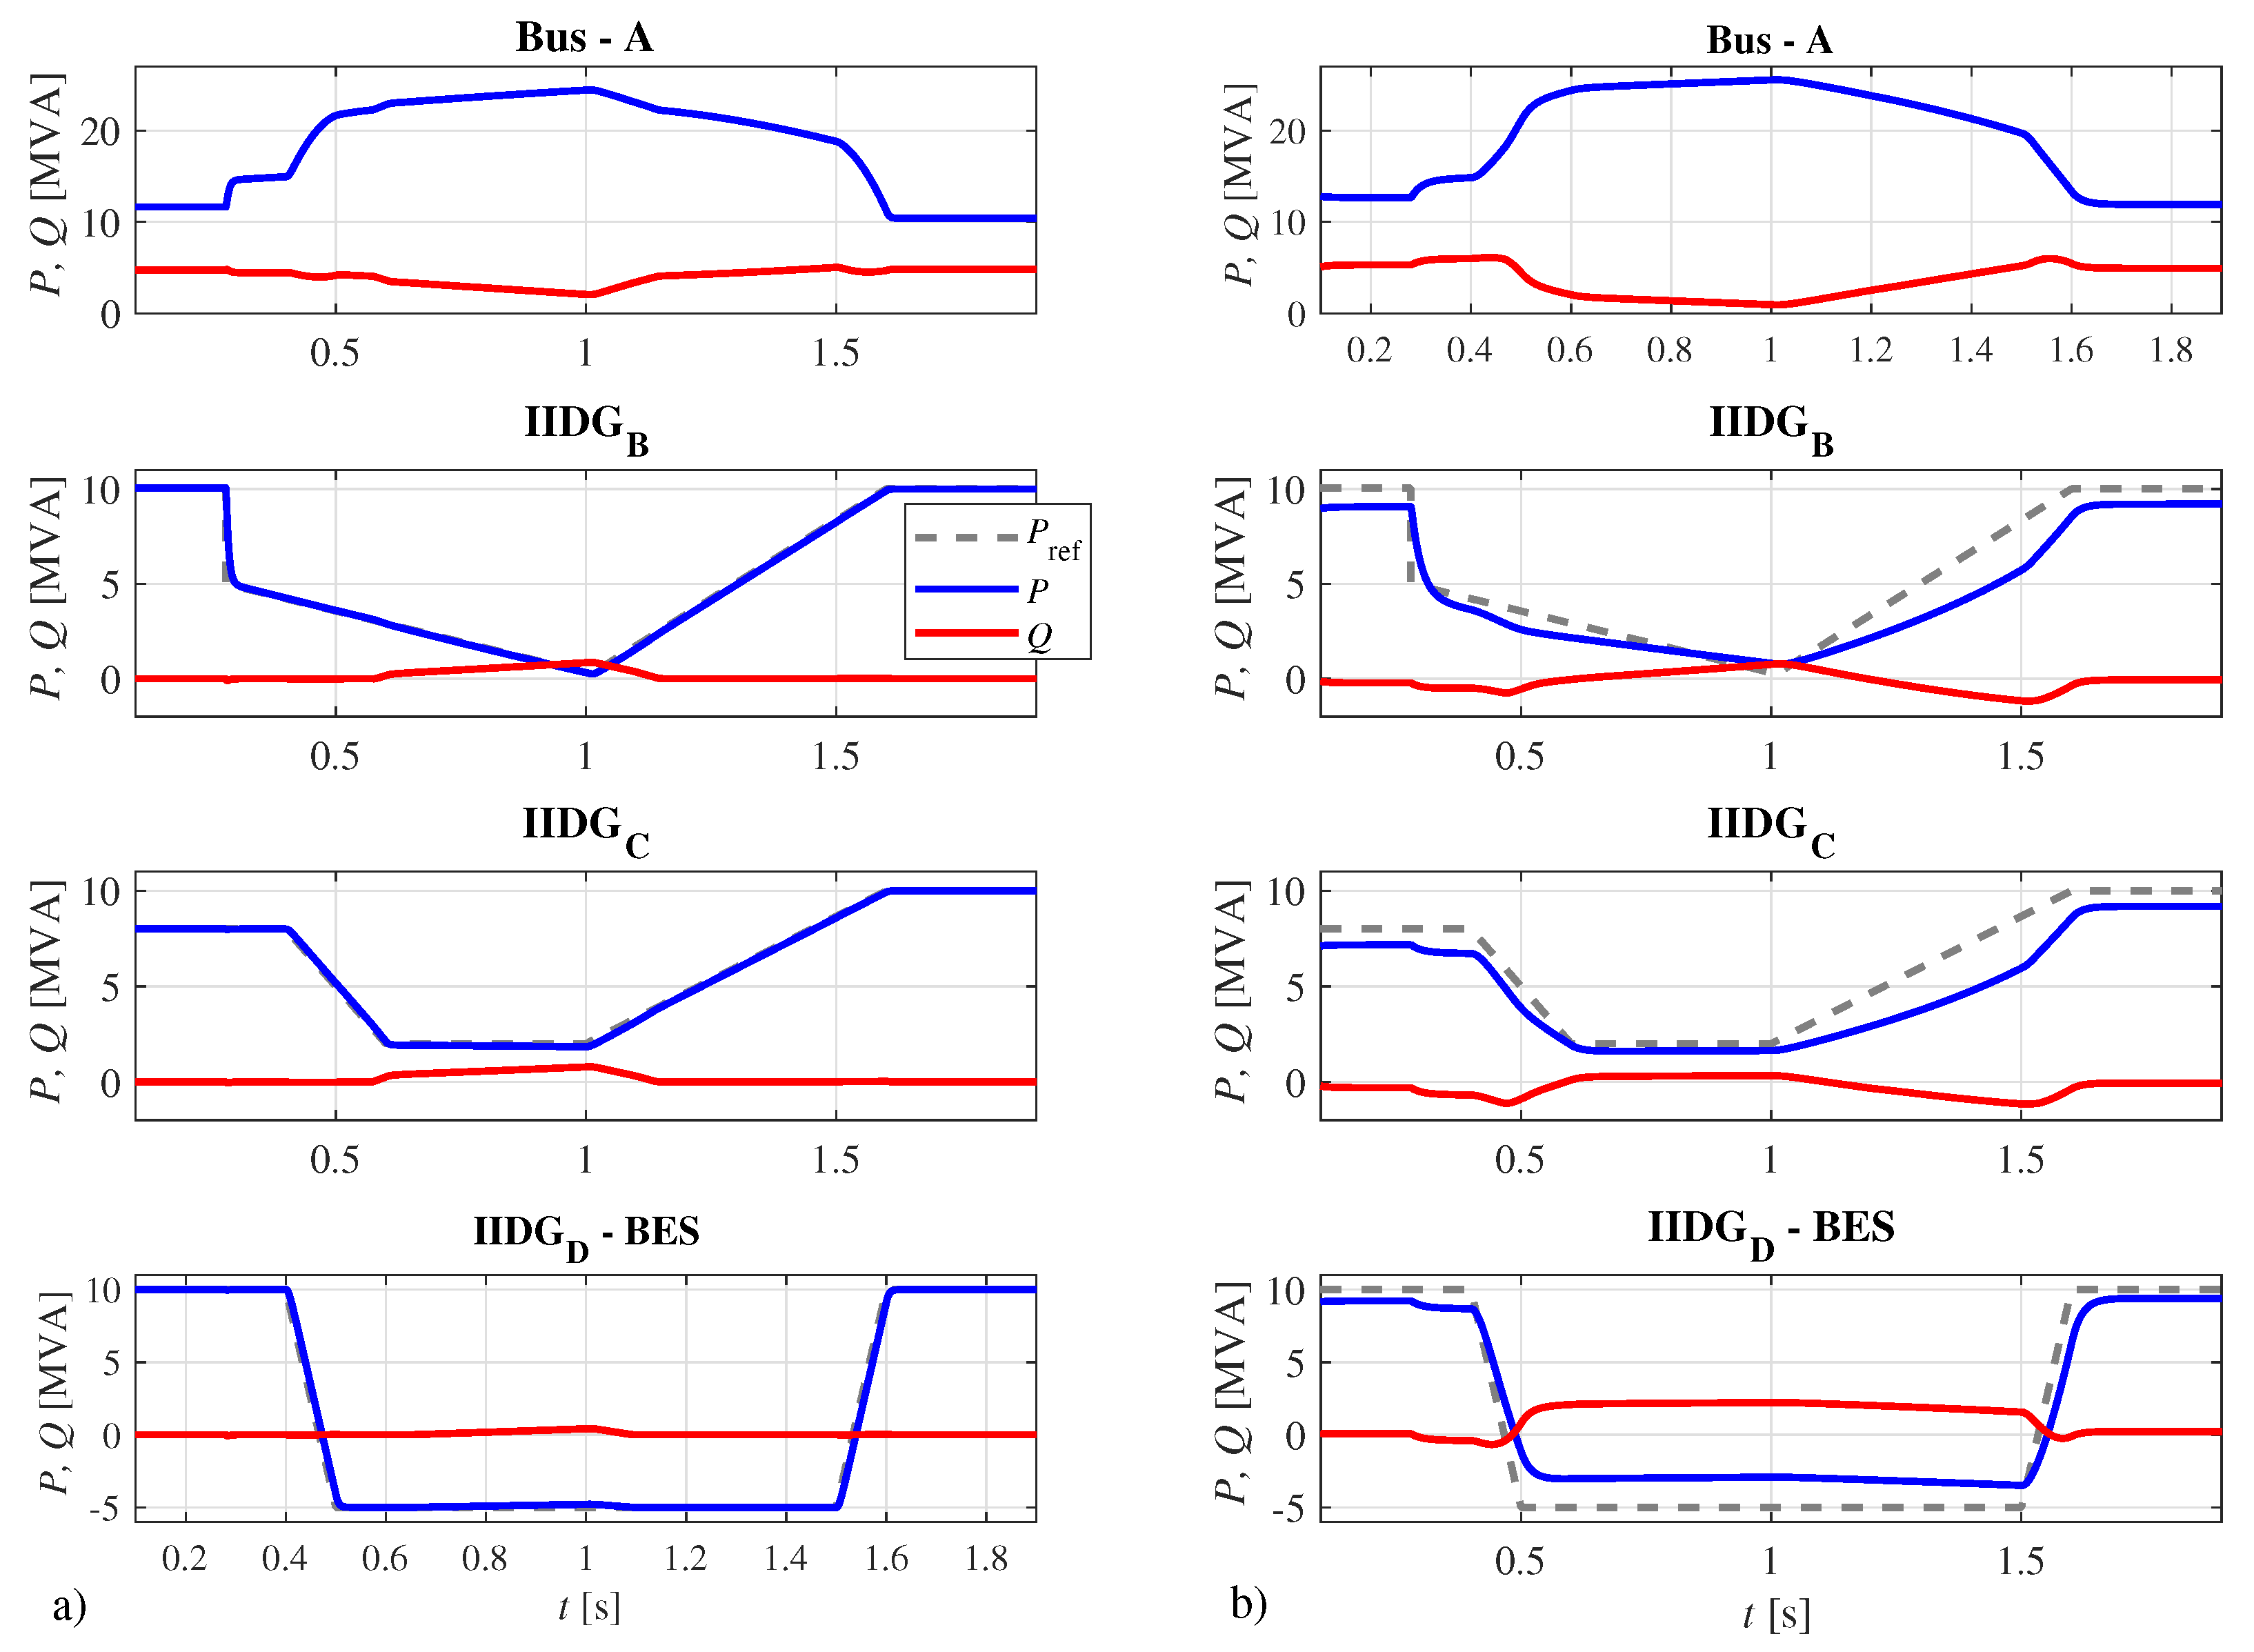
3.1. Reference Tracking
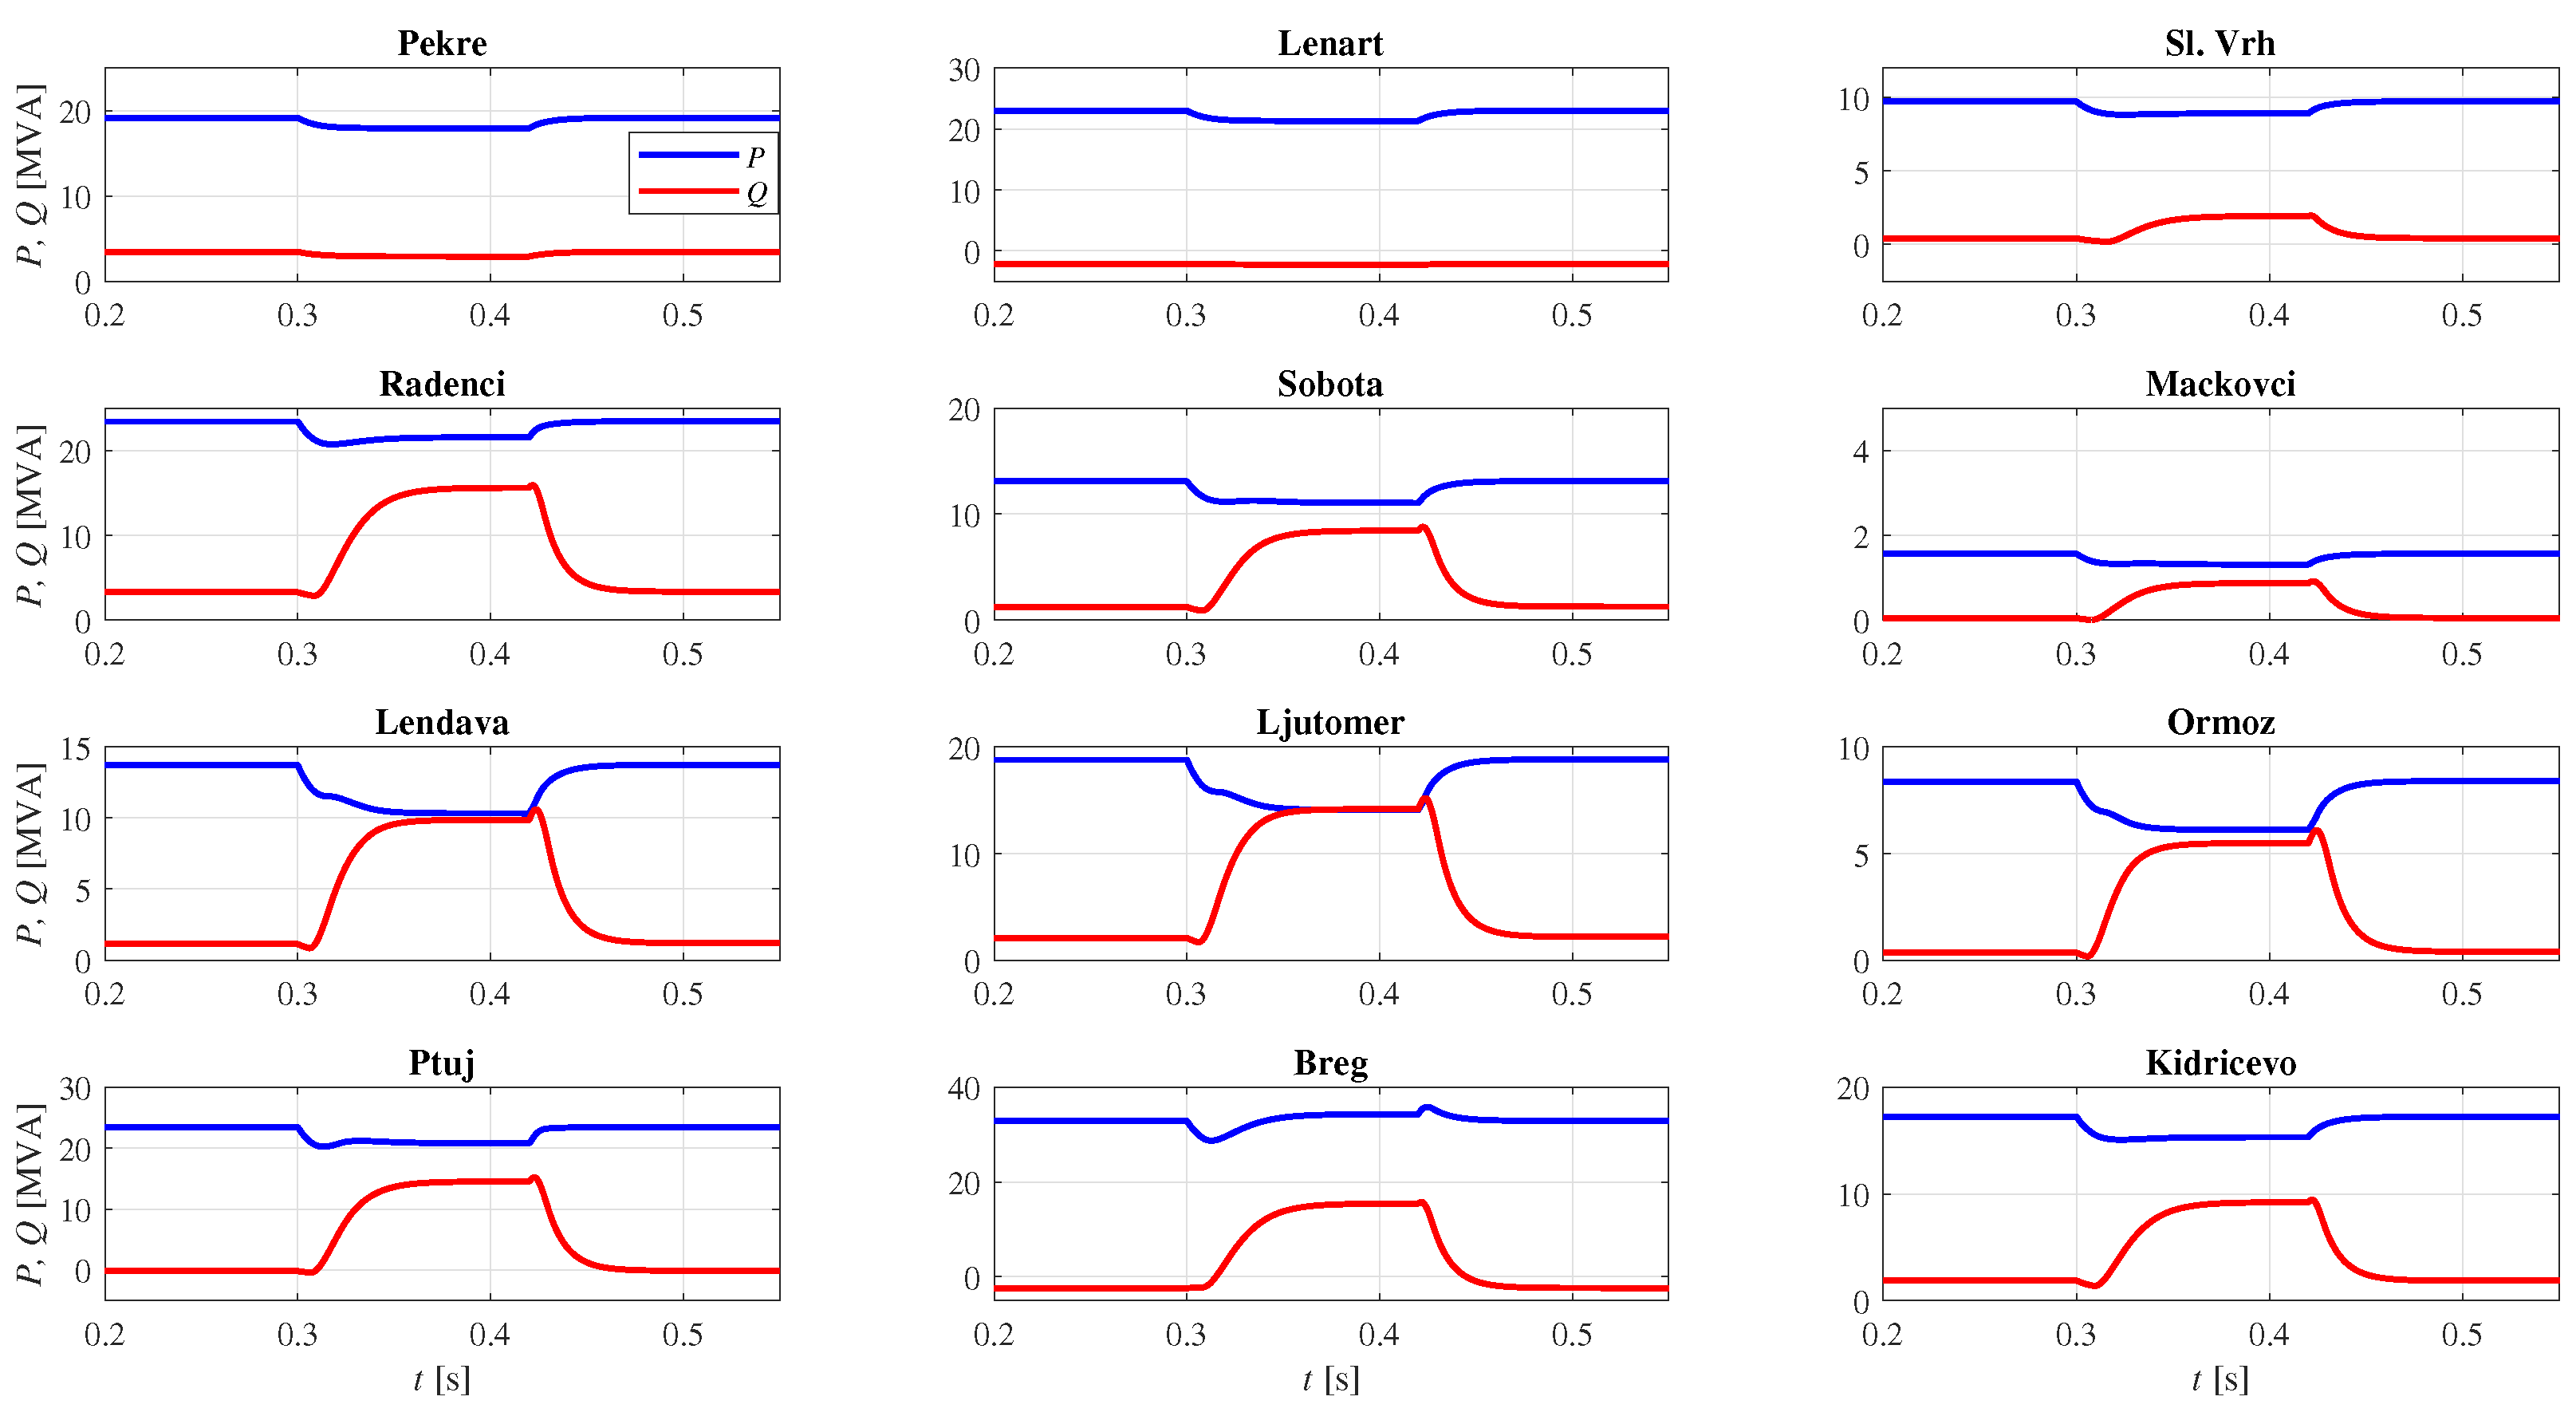
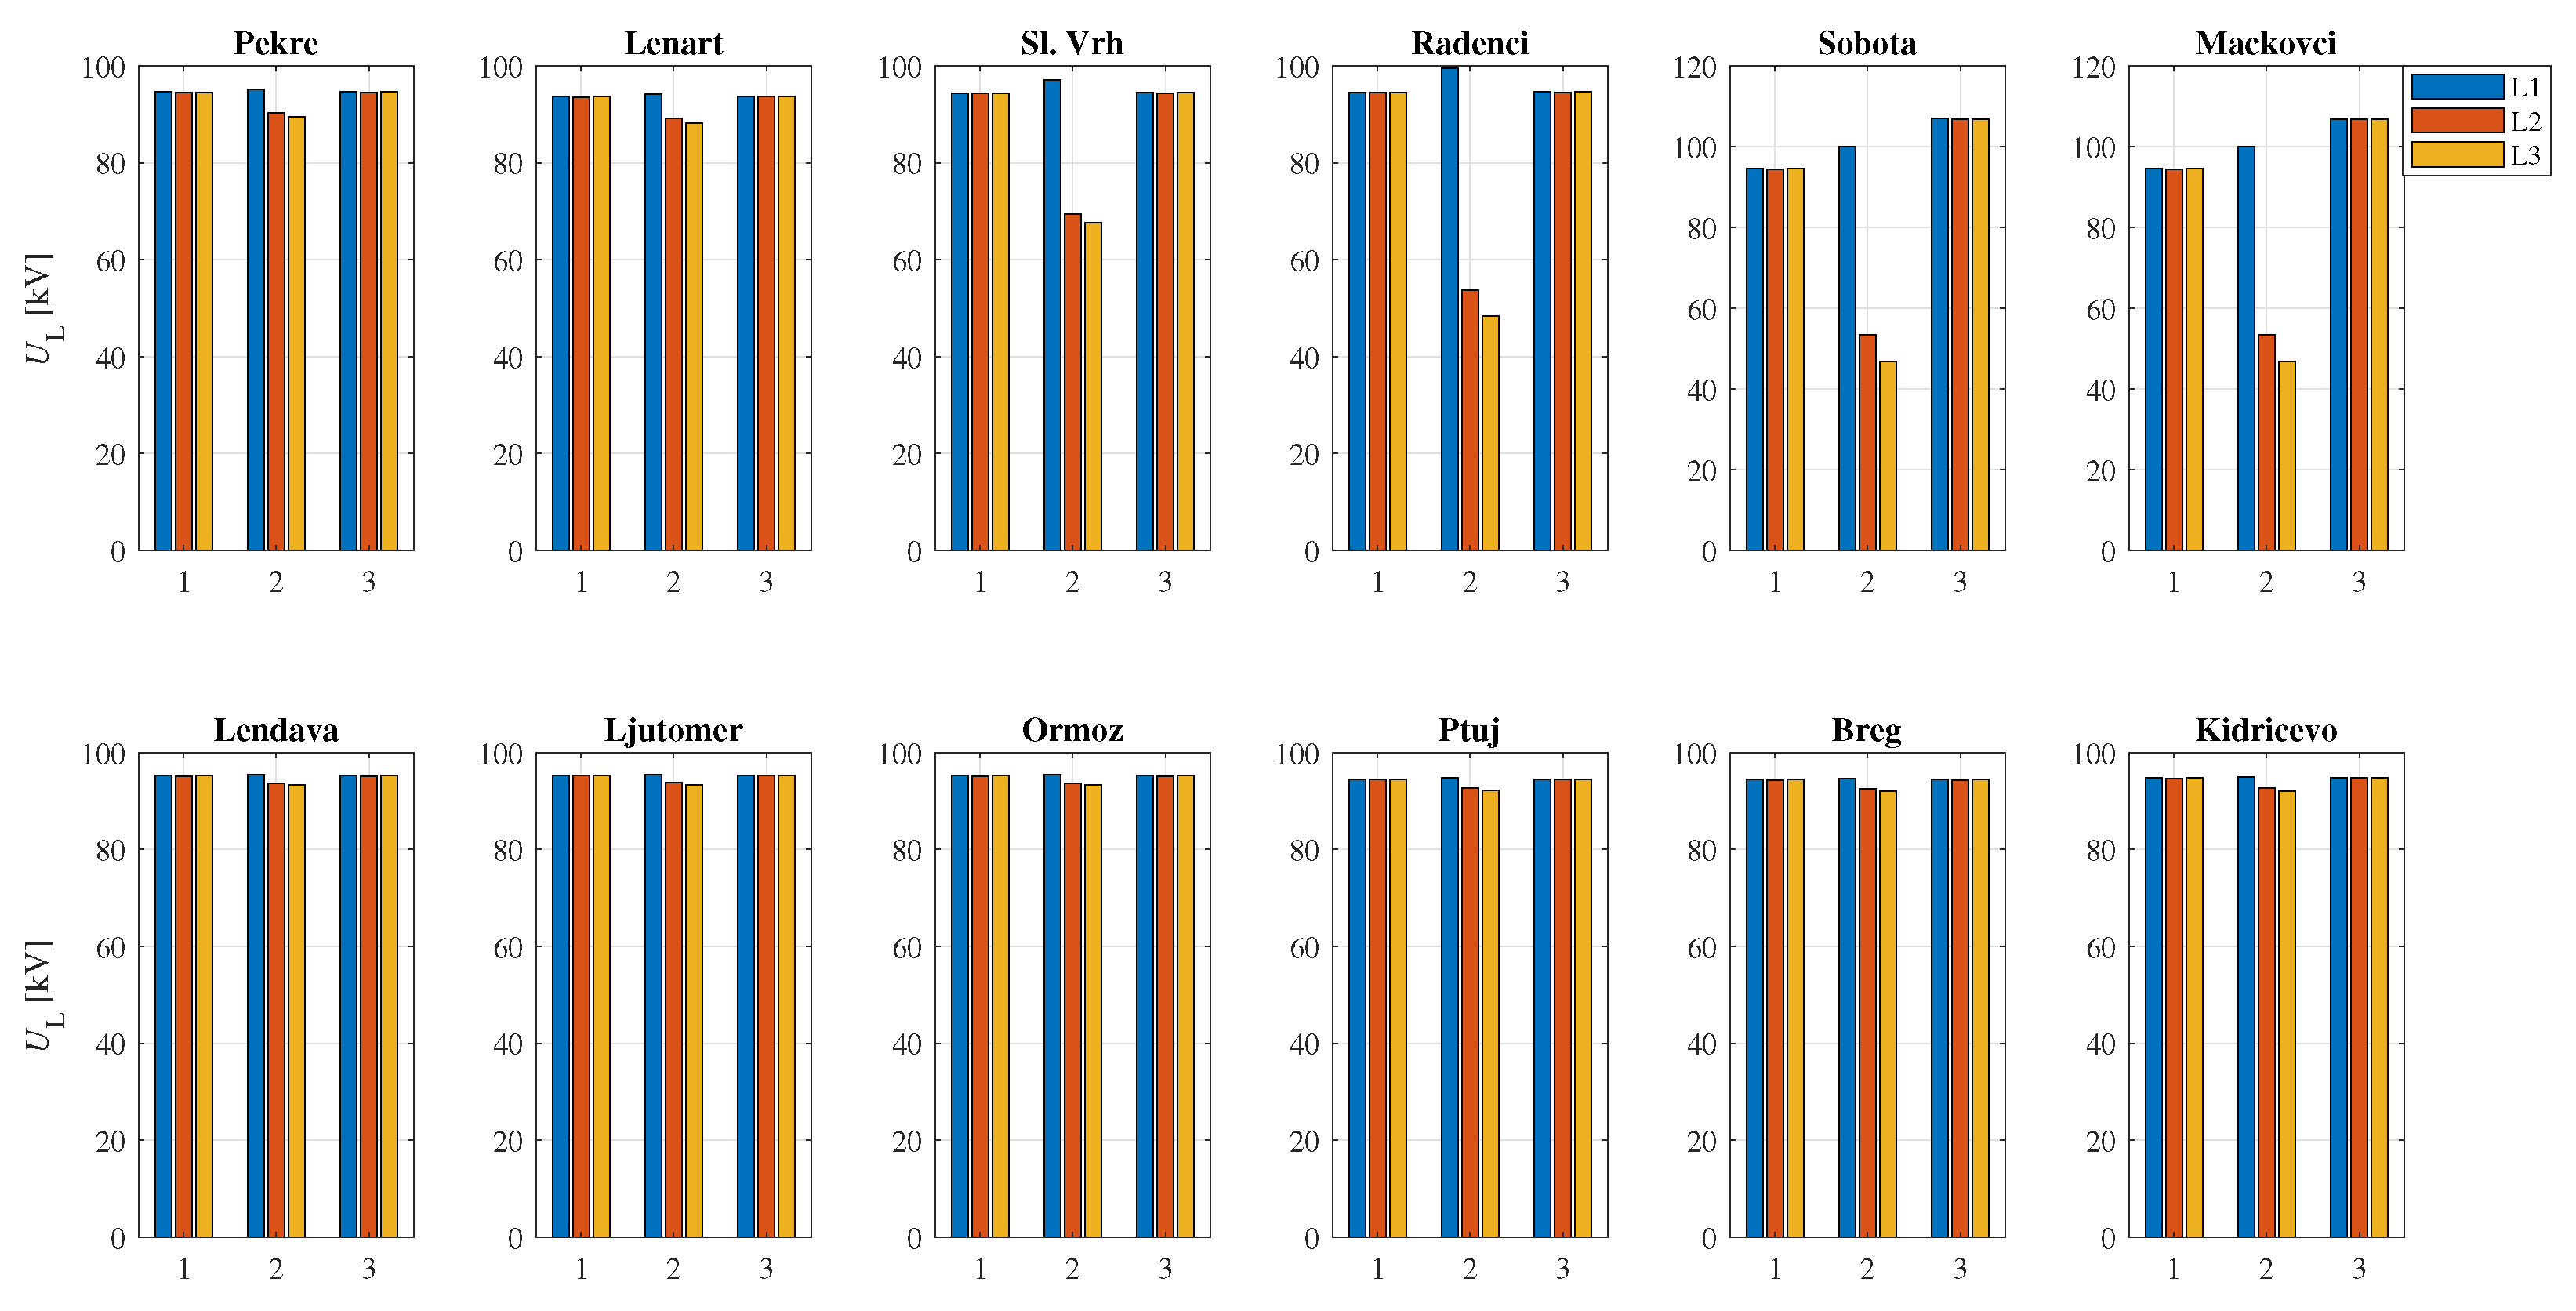
3.2. Responses during Network Faults
3.3. Impact of SSC of an Aggregated Network Supply
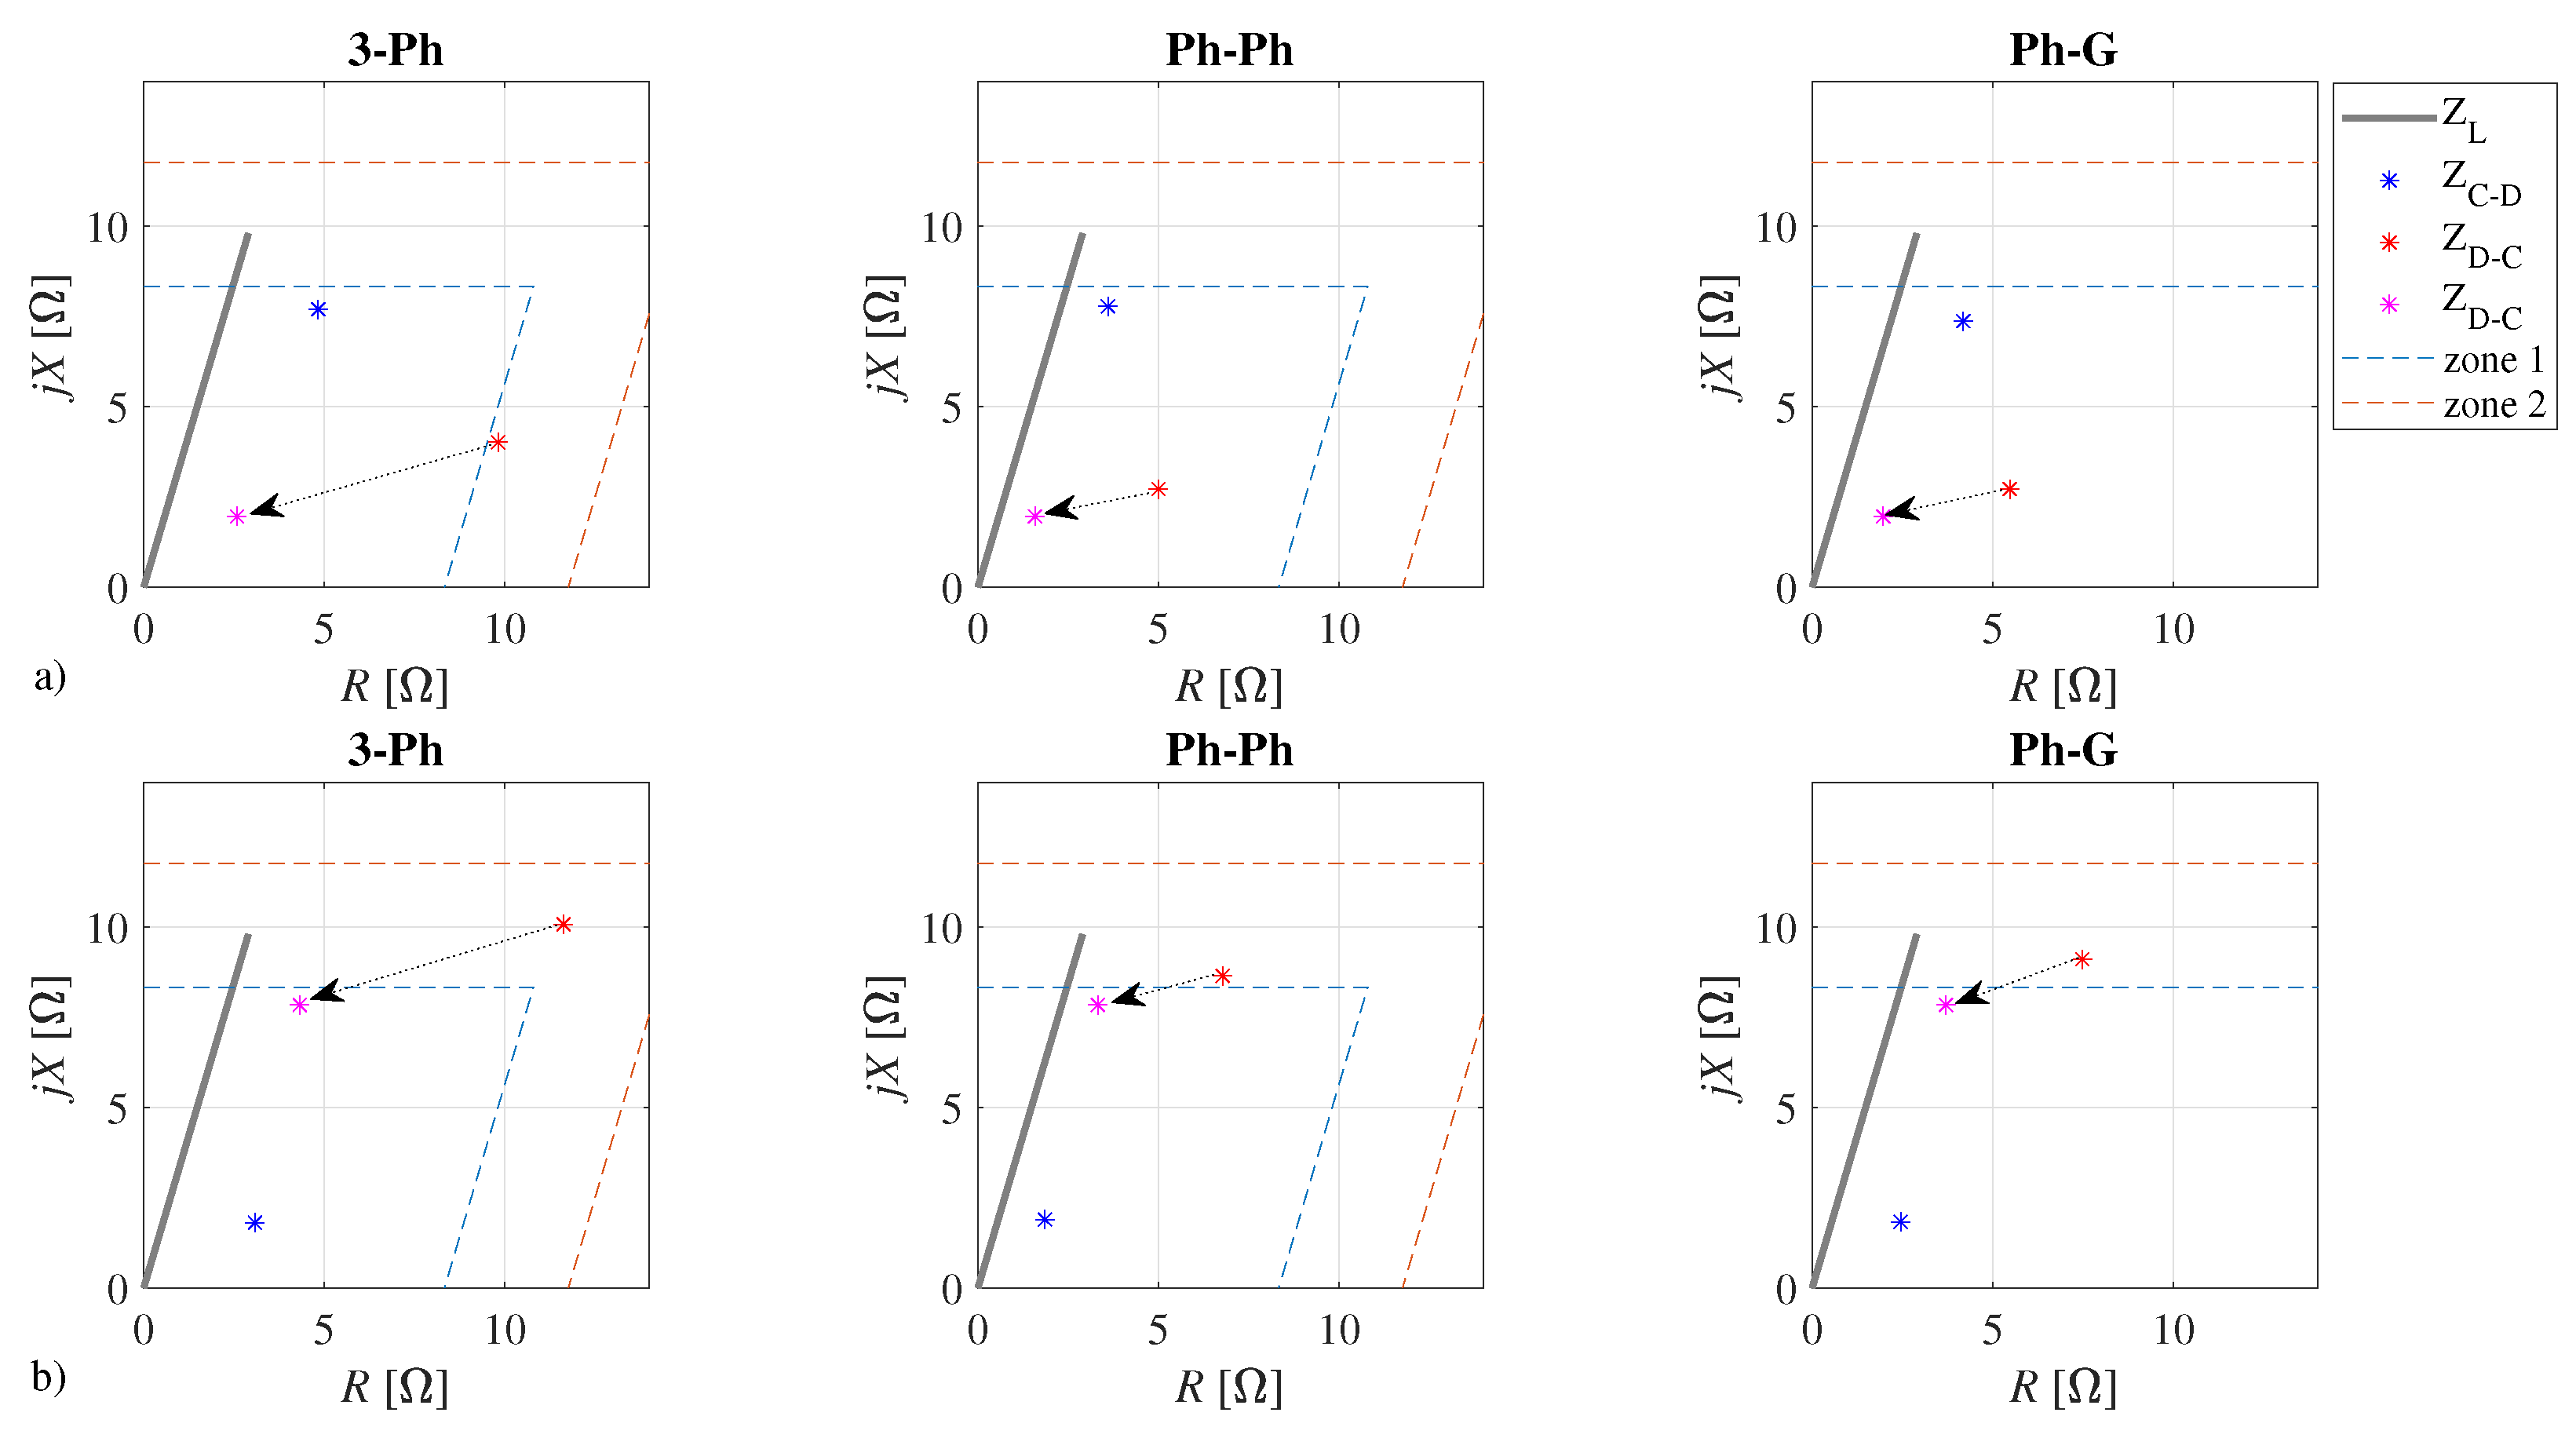
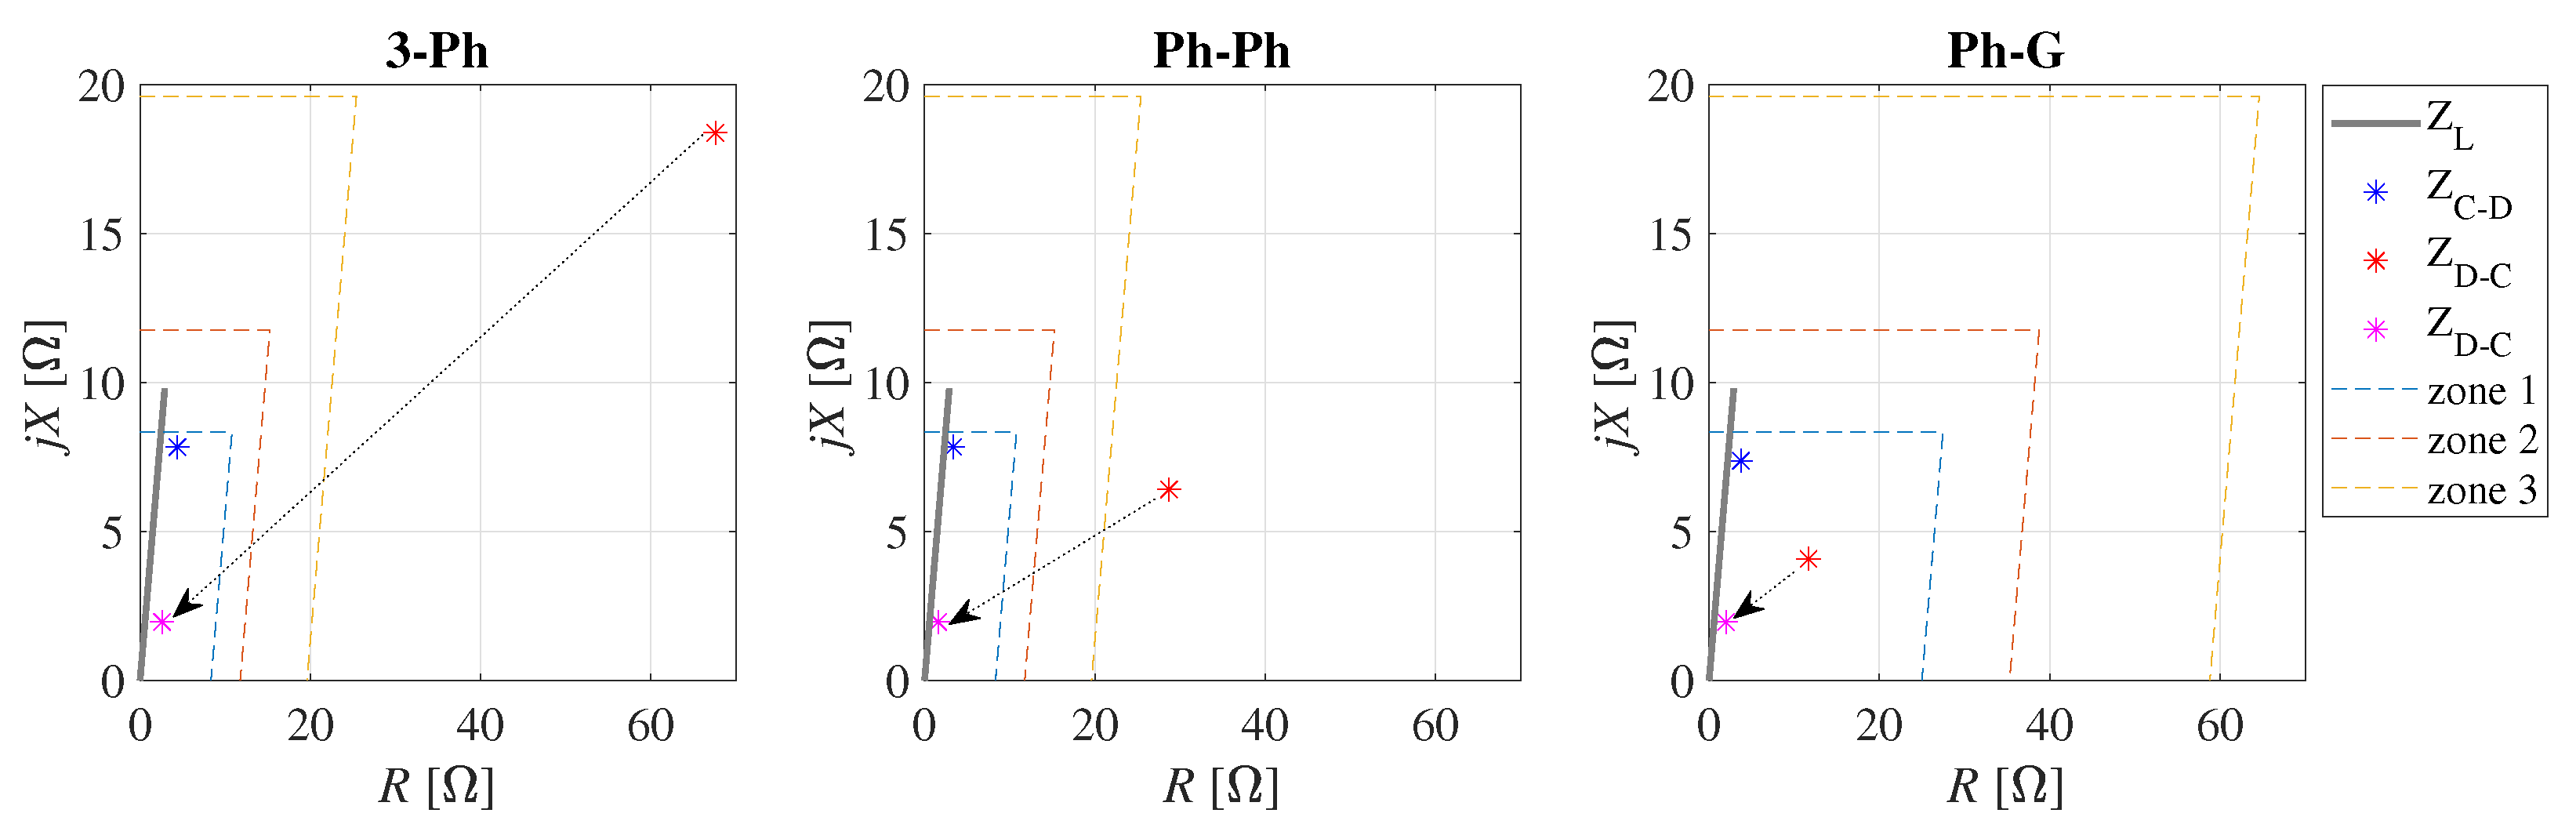
3.4. Distance Protection Operation
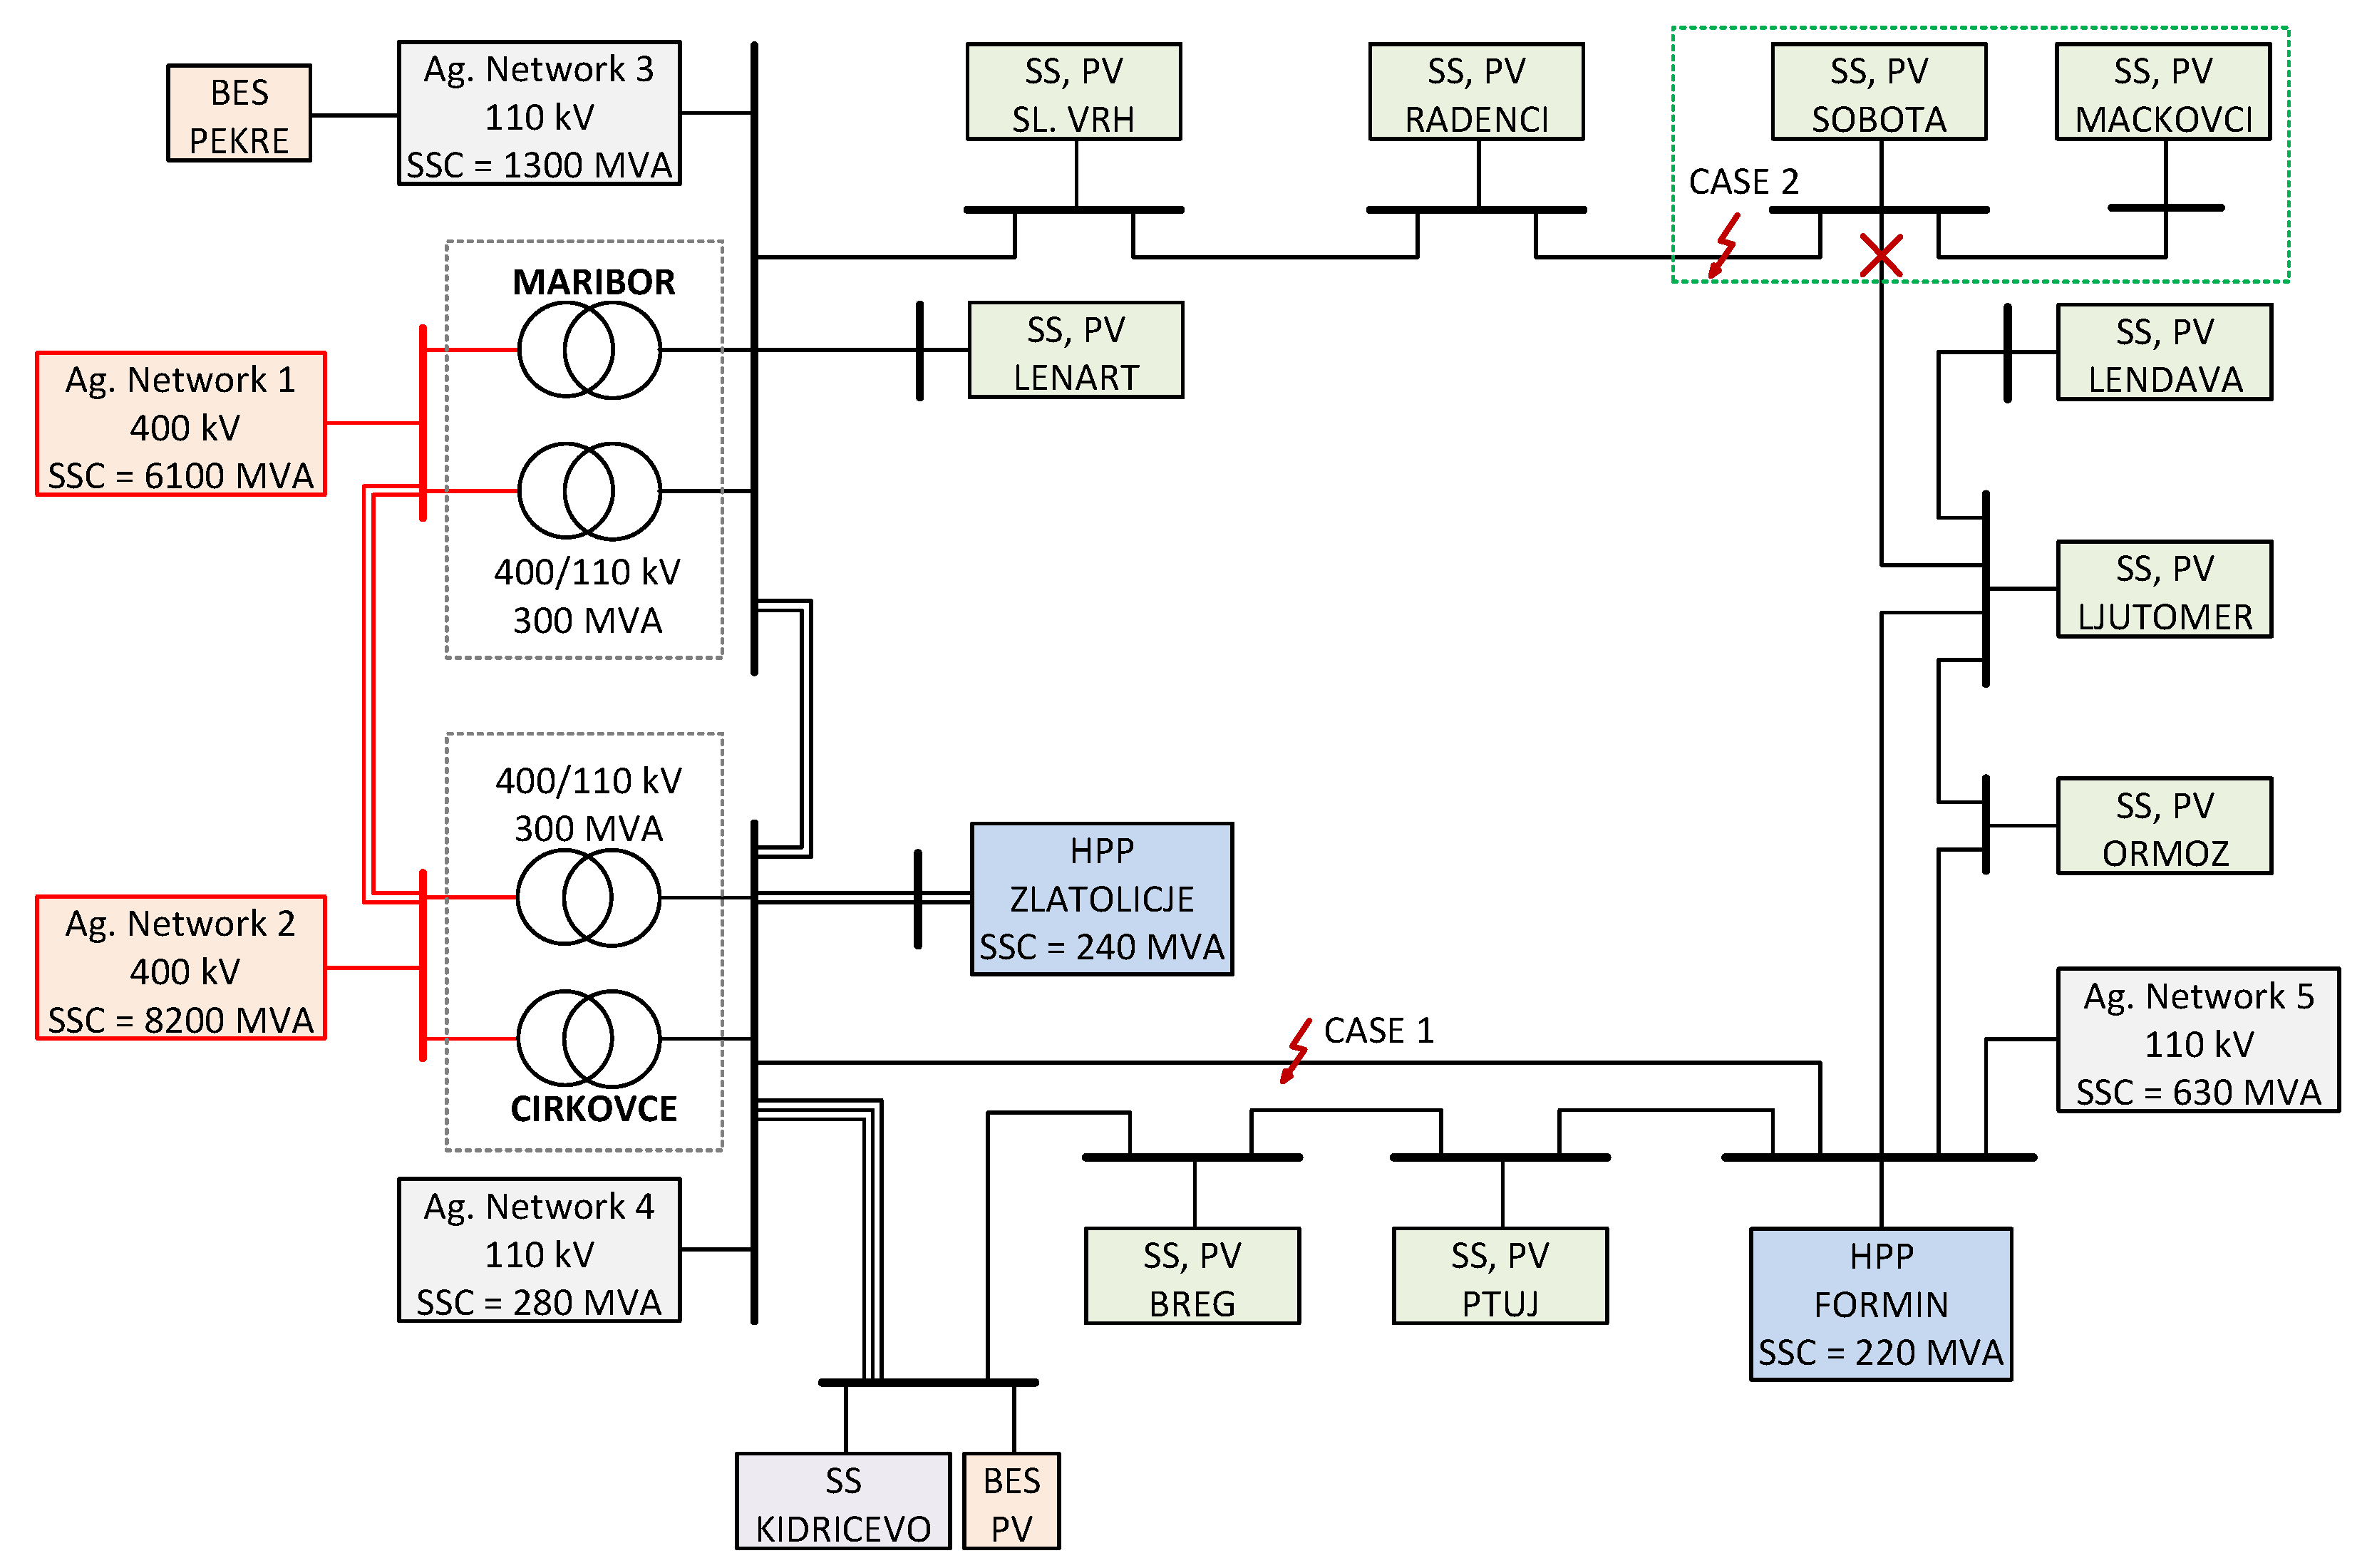
4. Case Study: The Northeast Part of the Slovenian Transmission System
4.1. Case 1—Faults in Loop Topology with a Strong Network Supply
4.2. Case 2—Faults in Radial Topology with Weak IIDGs
5. Discussion and Future Work
6. Conclusions
Author Contributions
Funding
Institutional Review Board Statement
Informed Consent Statement
Data Availability Statement
Acknowledgments
Conflicts of Interest
Abbreviations
| IIDG | Inverter-Interfaced Distributed Generation |
| FFC | Fast Fault Current |
| BFFC | Balanced FFC |
| UFFC | Unbalanced FFC |
| SSC | Short-Circuit Capability |
| BES | Battery Energy Storage |
| PV | Photovoltaic |
| SS | Substation |
| 3-Ph | Three-Phase |
| Ph-Ph | Phase-to-Phase |
| Ph-G | Phase-to-Ground |
References
- EUR-Lex. Establishing a Network Code on Requirements for Grid Connection of Generators; Commission Regulation (EU) 2016/631; European Union: Brussels, Belgium, 2016. [Google Scholar]
- VDE-AR-N 4120:2017-05, Technical Requirements for the Connection and Operation of Customer Installations to the High-voltage Network (TCC High-Voltage); VDE Verlag GmbH: Berlin, Germany, 2017.
- Modeling and Validation Work Group; Renewable Energy Modeling Task Force. WECC Wind Plant Dynamic Modeling Guidelines; WECC: Salt Lake City, UT, USA, 2014. [Google Scholar]
- WECC Modeling and Validation Work Group. Solar Photovoltaic Power Plant Modeling and Validation Guideline; WECC: Salt Lake City, UT, USA, 2019. [Google Scholar]
- Farantatos, E. Model User Guide for Generic Renewable Energy System Models; Technical Update 3002014083; EPRI: Palo Alto, CA, USA, 2018. [Google Scholar]
- Mirhosseini, M.; Pou, J.; Agelidis, V.G. Single- and Two-Stage Inverter-Based Grid-Connected Photovoltaic Power Plants with Ride-Through Capability under Grid Faults. IEEE Trans. Sustain. Energy 2015, 6, 1150–1159. [Google Scholar] [CrossRef]
- Celik, D.; Meral, M.E. Voltage Support Control Strategy of Grid-Connected Inverter System under Unbalanced Grid Faults to Meet Fault Ride through Tequirements. IET Gener. Transm. Distrib. 2020, 14, 3198–3210. [Google Scholar] [CrossRef]
- Camacho, A.; Castilla, M.; Miret, J.; Vasquez, J.C.; Alarcon-Gallo, E. Flexible Voltage Support Control for Three-Phase Distributed Generation Inverters under Grid Fault. IEEE Trans. Power Electron. 2013, 60, 1429–1441. [Google Scholar] [CrossRef]
- Popadic, B.; Dumnic, B.; Strezoski, L. Modeling of Initial Fault Response of Inverter-Based Distributed Energy Resources for Future Power System Planning. Int. J. Electr. Power Energy Syst. 2020, 117, 105722. [Google Scholar] [CrossRef]
- Meyer, R.; Zlotnik, A.; Mertens, A. Fault Ride-Through Control of Medium-Voltage Converters with LCL Filter in Distributed Generation Systems. IEEE Trans. Ind. Appl. 2014, 50, 3448–3456. [Google Scholar] [CrossRef]
- Guo, X.; Liu, W.; Lu, Z. Flexible Power Regulation and Current-Limited Control of the Grid-Connected Inverter under Unbalanced Grid Voltage Faults. IEEE Trans. Ind. Electron. 2017, 64, 7425–7432. [Google Scholar] [CrossRef]
- Afshari, E.; Moradi, G.R.; Rahimi, R.; Farhangi, B.; Yang, Y.; Blaabjerg, F.; Farhangi, S. Control Strategy for Three-Phase Grid-Connected PV Inverters Enabling Current Limitation Under Unbalanced Faults. IEEE Trans. Ind. Electron. 2017, 64, 8908–8918. [Google Scholar] [CrossRef] [Green Version]
- Camacho, A.; Castilla, M.; Miret, J.; Borrell, A.; Garcia de Vicuna, L. Active and Reactive Power Strategies with Peak Current Limitation for Distributed Generation Inverters during Unbalanced Grid Faults. IEEE Trans. Ind. Electron. 2015, 62, 1515–1525. [Google Scholar] [CrossRef] [Green Version]
- Wen, H.; Fazeli, M. A Low-Voltage Ride-Through Strategy Using Mixed Potential Function for Three-Phase Grid-Connected PV Systems. Electr. Power Syst. Res. 2019, 173, 271–280. [Google Scholar] [CrossRef]
- Camacho, A.; Castilla, M.; Miret, J.; Guzman, R.; Borrell, A. Reactive Power Control for Distributed Generation Power Plants to Comply with Voltage Limits During Grid Faults. IEEE Trans. Power Electron. 2014, 29, 6224–6234. [Google Scholar] [CrossRef] [Green Version]
- Islam, M.; Nadarajah, M.; Hossain, M.J. A Grid-Support Strategy with PV Units to Boost Short-Term Voltage Stability under Asymmetrical Faults. IEEE Trans. Power Syst. 2020, 35, 1120–1131. [Google Scholar] [CrossRef]
- Shuvra, M.A.; Chowdhury, B. Distributed Dynamic Grid Support Using Smart PV Inverters during Unbalanced Grid Faults. IET Renew. Power. Gener. 2019, 13, 598–608. [Google Scholar] [CrossRef]
- Khan, H.; Chacko, S.J.; Fernandes, B.G.; Kulkarni, A. Reliable and Effective Ride-Through Controller Operation for Smart PV Systems Connected to LV Distribution Grid under Abnormal Voltages. IEEE J. Emerg. Sel. Top. Power Electron. 2020, 8, 2371–2384. [Google Scholar] [CrossRef]
- Taul, M.G.; Wang, X.; Davari, P.; Blaabjerg, F. Current Reference Generation Based on Next-Generation Grid Code Requirements of Grid-Tied Converters during Asymmetrical Faults. IEEE J. Emerg. Sel. Top. Power Electron. 2020, 8, 3784–3797. [Google Scholar] [CrossRef] [Green Version]
- Garnica, M.; Garcia de Vicuna, L.; Miret, J.; Castilla, M.; Guzman, R. Optimal Voltage-Support Control for Distributed Generation Inverters in RL Grid-Faulty Networks. IEEE Trans. Power Electron. 2020, 67, 8405–8415. [Google Scholar] [CrossRef] [Green Version]
- Zeineldin, H.H.; Sharaf, H.M.; Ibrahim, D.K.; El-Zahab, E.E.-D.A. Optimal Protection Coordination for Meshed Distribution Dystems with DG Using Dual Setting Directional Over-Current Relays. IEEE Trans. Smart Grid 2015, 6, 115–123. [Google Scholar] [CrossRef]
- Huchel, L.; Zeineldin, H.H. Planning the Coordination of Directional Overcurrent Relays for Distribution Systems Considering DG. IEEE Trans. Smart Grid 2016, 7, 1642–1649. [Google Scholar] [CrossRef]
- Pereira, K.; Pereira, B.R.; Contreras, J.; Mantovani, J.R.S. A Multiobjective Optimization Technique to Develop Protection Systems of Distribution Networks with Distributed Generation. IEEE Trans. Power Syst. 2018, 33, 7064–7075. [Google Scholar] [CrossRef] [Green Version]
- Katyara, S.; Staszewski, L.; Leonowicz, Z. Protection Coordination of Properly Sized and Placed Distributed Generations-Methods, Applications and Future Scope. Energies 2018, 11, 2627. [Google Scholar] [CrossRef] [Green Version]
- Bui, D.M.; Le, P.D.; Nguyen, T.P.; Nguyen, H. An adaptive and scalable protection coordination system of overcurrent relays in distributed-generator-integrated distribution networks. Appl. Sci. 2021, 11, 8454. [Google Scholar] [CrossRef]
- Plet, C.A.; Green, T.C. Fault Response of Inverter Interfaced Distributed Generators in Grid-Connected Applications. Electr. Power Syst. Res. 2014, 106, 21–28. [Google Scholar] [CrossRef]
- Pinto, J.O.C.P.; Moreto, M. rotection Strategy for Fault Detection in Inverter-Dominated Low Voltage AC Microgrid. Electr. Power Syst. Res. 2021, 190, 106572. [Google Scholar] [CrossRef]
- Barnes, A.K.; Tabarez, J.E.; Mate, A.; Bent, R.W. Optimization-Based Formulations for Short-Circuit Studies with Inverter-Interfaced Generation in PowerModelsProtection.jl. Energies 2021, 14, 2160. [Google Scholar] [CrossRef]
- Bakkar, M.; Bogarra, S.; Corcoles, F.; Iglesias, J. Overcurrent Protection Based on ANNs for Smart Distribution Networks with Grid-Connected VSIs. IET Gener. Transm. Distrib. 2020, 15, 1159–1174. [Google Scholar] [CrossRef]
- Zarei, S.F.; Khankalantary, S. Protection of Active Distribution Networks with Conventional and Inverter-Based Distributed Generators. Int. J. Electr. Power Energy Syst. 2021, 129, 106746. [Google Scholar] [CrossRef]
- Salem, M.M.; Elkalashy, N.I.; Atia, Y.; Kawady, T.A. Modified Inverter Control of Distributed Generation for Enhanced Relaying Coordination in Distribution Networks. IEEE Trans. Power Deliv. 2017, 32, 78–87. [Google Scholar] [CrossRef]
- Yousaf, M.; Muttaqi, K.M.; Sutanto, D. A Control Strategy to Mitigate the Sensitivity Deterioration of Overcurrent Protection in Distribution Networks with the Higher Concentration of the Synchronous and Inverter-Based DG Units. IEEE Trans. Ind. Appl. 2021, 57, 2298–2306. [Google Scholar] [CrossRef]
- Aljarrah, R.; Marzooghi, H.; Yu, J.; Terzija, V. Sensitivity Analysis of Transient Short Circuit Current Response to the Penetration Level of Non-Synchronous Generation. Int. J. Electr. Power Energy Syst. 2021, 125, 106556. [Google Scholar] [CrossRef]
- ENTSO-E. Short Circuit Contribution of New Generating Units Connected with Power Electronics and Protection Behaviour; ENTSO-E: Brussels, Belgium, 2019. [Google Scholar]
- Ziegler, G. Numerical Distance Protection: Principles and Applications, 4th ed.; Publicis Publishing: Erlangen, Germany, 2011. [Google Scholar]
- Werstiuk, C. The Relay Testing Handbook: Principles and Practice; Valence Electrical Training Services: Littleton, CO, USA, 2012. [Google Scholar]


| [MVA] | IIDG | P [MW] | Q [MVAr] | S [MVA] | [pu] | [pu] | [pu] |
|---|---|---|---|---|---|---|---|
| B | 1.9 | 7.4 | 7.6 | 1.0581 | 0.5204 | 0.5394 | |
| 50 | C | 1.8 | 7.3 | 7.5 | 1.0608 | 0.5306 | 0.5306 |
| D | 2.7 | 7.5 | 8.0 | 1.0581 | 0.5251 | 0.5336 | |
| B | 2.6 | 7.6 | 8.0 | 1.1092 | 0.5537 | 0.5603 | |
| 100 | C | 2.3 | 7.5 | 7.8 | 1.1118 | 0.5607 | 0.5521 |
| D | 2.0 | 7.2 | 7.5 | 1.1092 | 0.5570 | 0.5538 | |
| B | 3.2 | 7.7 | 8.3 | 0.9643 | 0.5718 | 0.4984 | |
| 1000 | C | 1.7 | 7.2 | 7.4 | 0.9670 | 0.5295 | 0.4531 |
| D | 0.5 | 6.2 | 6.2 | 0.9641 | 0.5378 | 0.4622 |
| [MVA] | IIDG | P [MW] | Q [MVAr] | S [MVA] | [pu] | [pu] | [pu] |
|---|---|---|---|---|---|---|---|
| B | 5.6 | 5.8 | 8.1 | 1.1712 | 0.5767 | 0.5965 | |
| 50 | C | 5.5 | 5.8 | 8.0 | 1.1732 | 0.5853 | 0.5884 |
| D | 5.4 | 6.1 | 8.1 | 1.1712 | 0.5828 | 0.5891 | |
| B | 4.6 | 6.5 | 8.0 | 1.1281 | 0.5638 | 0.5638 | |
| 100 | C | 4.4 | 6.5 | 7.8 | 1.1305 | 0.5694 | 0.5621 |
| D | 3.8 | 6.5 | 7.5 | 1.1282 | 0.5673 | 0.5625 | |
| B | 4.0 | 7.4 | 8.4 | 0.9643 | 0.5718 | 0.4983 | |
| 1000 | C | 2.6 | 6.9 | 7.4 | 0.9672 | 0.5292 | 0.4535 |
| D | 0.6 | 6.1 | 6.1 | 0.9642 | 0.5382 | .4619 |
| Substation | TR 110/X [kV] | [MW] | [MW] | [MW] |
|---|---|---|---|---|
| Lenart | 21 | 2 × 20 | 8.2 | 5.9 |
| Sl. Vrh | 21 | 2 × 31.5 | 13.7 | 2.3 |
| Radenci | 21 | 2 × 31.5 | 15 | 7.5 |
| Sobota | 21 | 2 × 40 | 25.3 | 12.6 |
| Mackovci | 21 | 1 × 31.5 | 4.9 | 1.5 |
| Lendava | 21 | 2 × 31.5 | 15.8 | 3.3 |
| Ljutomer | 21 | 2 × 31.5 | 9.2 | 4.5 |
| Ormoz | 21 | 2 × 20 | 7.0 | 2.1 |
| Ptuj | 21 | 2 × 40 | 18.7 | 7.6 |
| Breg | 21 | 2 × 31.5 | 13.6 | 16.1 |
| Kidricevo—PV | 10.5 | 1 × 31.5 | 9.7 | 4.0 |
| Kidricevo—BES | 10.5 | 2 × 31.5 | - | 16.0 |
| Kidricevo—load | 10.5 | 2 × 60 | 60 | - |
| Pekre - BES | 21 | 1 × 15 | - | 6.0 |
| Calculation | Unbalanced | FFC | Max Number | |
|---|---|---|---|---|
| Domain | FFC | Concept | of Used IIDGs | |
| Proposed | Phasor | Optional | Current/Power | 13 |
| [26,27] | Phasor | No | Current | 7 |
| [28] | Phasor | No | Current | 10 |
| [29] | Instantaneous | No | Current | 3 |
| [30] | Instantaneous | Yes | Power | 2 |
| [31] | Instantaneous | No | Power | 1 |
| [32] | Instantaneous | Yes | Power | 5 |
| [33] | Instantaneous | No | Current | 3 |
Publisher’s Note: MDPI stays neutral with regard to jurisdictional claims in published maps and institutional affiliations. |
© 2021 by the authors. Licensee MDPI, Basel, Switzerland. This article is an open access article distributed under the terms and conditions of the Creative Commons Attribution (CC BY) license (https://creativecommons.org/licenses/by/4.0/).
Share and Cite
Polajžer, B.; Grčar, B.; Černelič, J.; Ritonja, J. Power-Based Concept for Current Injection by Inverter-Interfaced Distributed Generations during Transmission-Network Faults. Appl. Sci. 2021, 11, 10437. https://doi.org/10.3390/app112110437
Polajžer B, Grčar B, Černelič J, Ritonja J. Power-Based Concept for Current Injection by Inverter-Interfaced Distributed Generations during Transmission-Network Faults. Applied Sciences. 2021; 11(21):10437. https://doi.org/10.3390/app112110437
Chicago/Turabian StylePolajžer, Boštjan, Bojan Grčar, Jernej Černelič, and Jožef Ritonja. 2021. "Power-Based Concept for Current Injection by Inverter-Interfaced Distributed Generations during Transmission-Network Faults" Applied Sciences 11, no. 21: 10437. https://doi.org/10.3390/app112110437
APA StylePolajžer, B., Grčar, B., Černelič, J., & Ritonja, J. (2021). Power-Based Concept for Current Injection by Inverter-Interfaced Distributed Generations during Transmission-Network Faults. Applied Sciences, 11(21), 10437. https://doi.org/10.3390/app112110437