1. Introduction
The maintenance mode of modern aircraft is changing from scheduled to condition-based maintenance (CBM). CBM can improve reliability, safety and availability, and meanwhile reduce the operating costs of an aircraft’s full life cycle [
1]. The theory of CBM originates from prognostics and health management (PHM). The core point of PHM is to estimate the health status of the monitored equipment, predict the remaining useful life and determine the optimal maintenance time, inspection interval and spare parts order quantity, and then minimize economic costs or equipment failure risks. Therefore, the premise of CBM is to make an accurate estimate of the system operating status, e.g., a health assessment. As the core system of aircraft, the health status of a flight control system directly affects flight safety, and it is therefore necessary to perform its health assessment. On the one hand, it can monitor the system’s operation status and warn of failure symptoms in time, and on the other hand it can support maintenance decision making to improve maintenance efficiency and reduce maintenance costs.
Some articles have studied the health monitoring/assessment of key aircraft systems or components. Sun [
2] proposed a method for extracting health indicators based on available sensor parameters of an aircraft air-conditioning system, as case studies show that the proposed health status indicators can effectively characterize degradation status and provide valuable information for CBM. Che [
3] proposed a PHM model for status assessment, fault classification and remaining useful life prediction of aircraft with multiple deep-learning algorithms. The proposed method is verified with NASA’s C-MAPSS dataset, and the results show that the error and deviation are lower than that of a traditional model. Lee [
4] proposed a method to effectively estimate flight response and capture upset precursors based on a deep auto-encoder; real-time flight datasets were used to verify the proposed method, which show that it can improve the situational awareness of pilots by providing an early safety warning. Shahkar [
5] proposed a fault diagnosis and prediction method based on particle filter for various degradation modes of spoiler actuator’s electro-hydraulic servo valve. Rito [
6] studied model-based health-monitoring algorithms to detect faults of UAV electromechanical actuators, developed two real-time position-tracking algorithms based on different predictors and compared their effectiveness in anti-false alarm and fault detection. Qiang Miao [
7] presents a vibration-based fan-bearing health evaluation method using comblet filtering and an exponentially weighted moving average. The analysis results suggest that the health condition indicator can identify incipient fan-bearing failures and describe the bearing degradation process. Len Gelman [
8] applied health-monitoring technology based on advanced signal processing to in-service intake separation diagnostics in an aircraft engine and developed health-monitoring technology based on the integral measure. Mirko Mazzoleni [
9] presents a health-monitoring approach for electromechanical actuators (EMAs) and verifies the approach using a dataset collected from a large experimental campaign on a 1:1 scale EMA for primary flight controls of small aircrafts.
However, these studies have mostly conducted health assessments under certain conditions, such as complete failure characteristics, known degradation data distribution, etc. In an actual flight process, uncertainties are everywhere, such as data samples, transmissions, etc. Moreover, these uncertainties may couple and diffuse with each other. Thus, an aircraft health assessment under uncertain conditions is more realistic.
Uncertainty is widespread in modeling and actual testing [
10], which are generally divided into two types: one is aleatory uncertainty, also known as inherent uncertainty; the other is epistemic uncertainty caused by researchers’ lack of relevant knowledge, also known as subjective uncertainty [
11].
Uncertainty may affect system decision making. One of the key challenges is how to use the uncertain information in system performance prediction due to input or parameter uncertainty when comparing decision-making alternatives. There have been studies on the impact of uncertainty on risk decision modeling. Fang Liu [
12] investigates the fact that fuzzy preference relations (FPRs) have no additively reciprocal property and addresses their implication for decision making under uncertainty. Yimeng Zhang [
13] addresses the uncertainty measurement problem in interval-set decision tables and proposes an alternative uncertainty measure based on the conditional information entropy. Mahdis Haddadi [
14] proposes a decision-making model to increase the robustness of optimal power flow in the presence of off-shore wind farms (WFs).
Shankar [
15] pointed out that any uncertain research can be divided into four parts: uncertainty representation, quantification, propagation, and management. The traditional method is a Monte Carlo simulation (MCS), based on input distributions, which samples an output distribution accordingly. Despite the fact that many complex statistical models have been proposed for uncertainty problems, MCS still remains the benchmark due to its universality and stability [
16].
There has been related research on the uncertainty of state assessment. In reliability analysis (such as structural health monitoring), the uncertainty quantification domain (UQ) can provide robust decision-making information [
10]. Therefore, it is important to quantify the uncertainty and choose a suitable model to study its propagation. With a prediction model based on the Gaussian regression process, Zhou [
17] evaluated the prediction uncertainty with the data of different batches of lithium batteries. This model can not only be used to determine the credibility of the prediction model but also screen training data. Wang [
18] proposed a four-step analysis framework to quantitatively evaluate the impact of parametric uncertainties on an energy storage system. Combined with a global sensitivity analysis, the key parameters’ influences on the system cost are analyzed and show that the proposed framework can quantitatively evaluate parameter uncertainty. Dong [
19] studied the uncertain factors affecting the status of wind turbines and constructed a unified assessment method with deviation and stability indicators.
However, to the best of the authors’ knowledge, there is currently no research on the health assessment of flight control systems under uncertain conditions. The objective of this paper is to establish a health assessment model of a flight control system under uncertain conditions and obtain the probability distribution of its health index. By comparing the results of the health assessment under certain and uncertain conditions, the validity of the proposed method is obtained.
More precisely, our contribution includes: (1) A health assessment model for the flight control system under uncertain conditions is established. (2) The λ-PDF probability density is improved to quantify the uncertainty of the input parameters. The improved probability density function has better generalization. By changing the parameters of the probability density function, the quantization effect similar is similar to the traditional probability distribution in any finite interval. (3) MCS is used in the uncertainty propagation process to generate data with the same distribution as the original data.
The rest of this paper is organized as follows.
Section 2 establishes a health assessment model for a flight control system under certain conditions.
Section 3 regards the model proposed in
Section 2 as the uncertainty propagation process and proposes a health assessment model under uncertain conditions, including uncertainty representation, interpretation, quantification and propagation.
Section 4 applies the proposed model to actual flight data to obtain assessment results. The final section analyzes the results and presents the conclusion of the whole paper.
2. Basic Theory
We have researched traditional flight control system health assessment in [
20]. This section will restate some important theories and models of flight control system health assessment under certain conditions in the aforementioned studies, so as to facilitate the development of subsequent sections.
In the aforementioned studies, the assessment process can be divided into the following steps: establishing health assessment indicators, dividing health levels, selecting assessment models and choosing a weight distribution method. A detailed description of these processes is given below.
2.1. Establishing Health Assessment Indicators
A flight control system is usually composed of a main control system and an auxiliary control system. The former uses the elevator, aileron and rudder to complete the pitch, roll and yaw actions, which can be divided into these three channels from the operating aspects of the system. As an important part of the auxiliary control system, the flap system plays a major role in providing lift and maintaining attitude. Therefore, failure mode and effect analysis (FMEA) of the main control system and flap system is selected to filter possible failures. Based on FMEA, all possible impacts on the system are studied to complete characteristic parameters selection.
The definition of FMEA is as follows: by analyzing the various possible failures of a system, failures are divided into their failure modes, respectively, and by analyzing the influence of each failure mode on the upper module and entire system, the influence level of the occurrence of these failures can be classified.
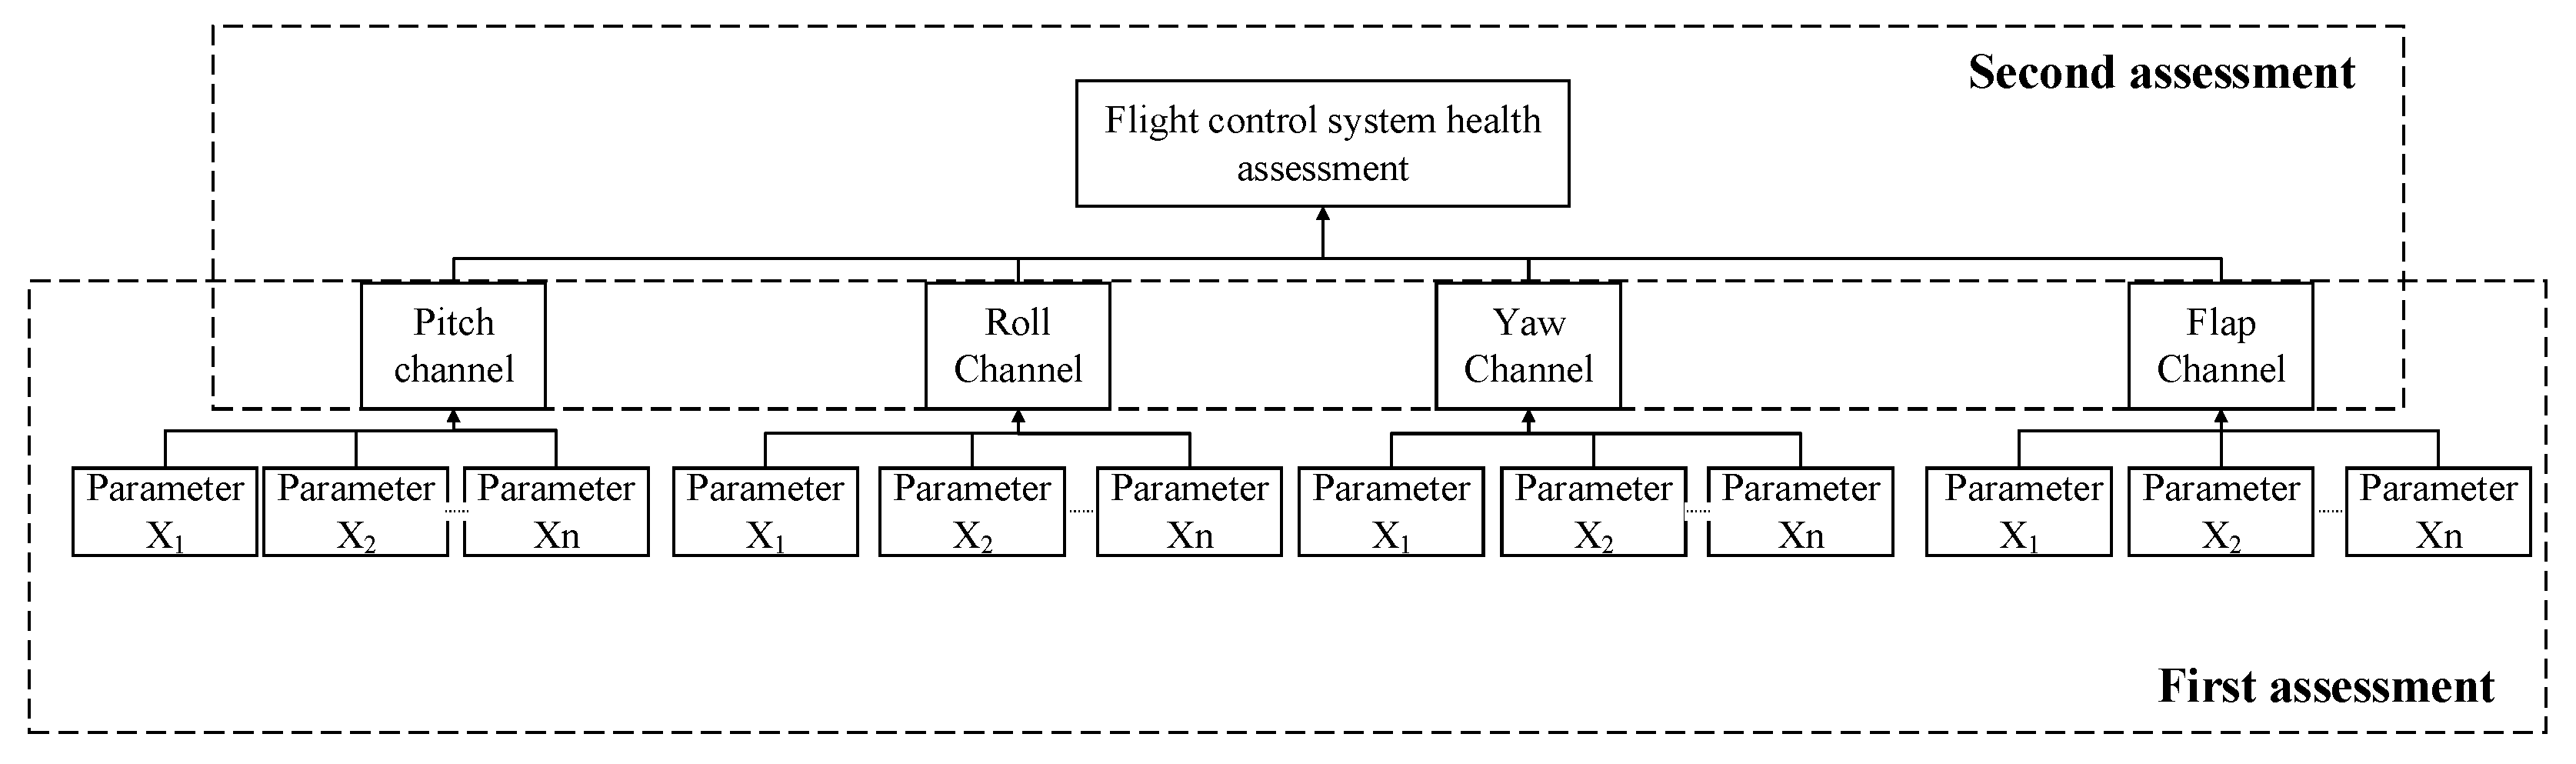
As shown in
Figure 1, according to the FMEA of the flight control system, the transmission coefficients from the control terminal to the acting surface of the three channels are selected as the characteristic parameters, including the pitch channel, roll channel and yaw channel, which indicate the health status of main control system; meanwhile, the main hydraulic pressure is selected to indicate the health status of flap channel. In detail, each channel contains several parameters to evaluate the health status of the channel. According to the flight control system health assessment process under certain conditions, the entire assessment process is divided into two parts: the first assessment is used to evaluate the health status of each channel, and the second assessment is used to evaluate the health status of the whole flight control system.
Then, the relative degradation degree method [
21] is used to normalize each health indicator to obtain the corresponding health index,
. The relative degradation degree refers to the similarity between the current state of a characteristic parameter and the fault state, and the value range is (0,1). A fault state is indicated by 1, and 0 indicates a healthy state. For the analysis of the characteristic parameters, the intermediate method is used for calculation:
where
represents the minimum value of characteristic parameters,
is the maximum value of feature parameters and
and
represent the optimal intervals of characteristic parameters.
2.2. Dividing Health Levels
According to the grey health index theory [
22], the health status of a flight control system is divided into four levels, thereby the mapping relationship between comprehensive health indicators and the health status is established. The definition of the system’s comprehensive health index interval is shown in
Table 1.
The health index is divided into four intervals from 0 to 1: fault,(0,0.25); severe decline,(0.25,0.5); slightly decline,(0.5,0.75); and healthy,(0.75,1). Among them, healthy means that the system is healthy and does not require maintenance; slightly decline means that the system function is slightly degraded and needs to be maintained as planned; severe decline means that the system is near failure and needs immediate maintenance; and fault means that a failure has occurredand the faulty module needs to be replaced.
2.3. Assessment Model—Fuzzy Comprehensive Assessment Model
Because there are fewer fault records of the flight control system operating data, common neural network methods and gray clustering methods are less accurate. Therefore, a fuzzy comprehensive assessment method is selected to evaluate the health status. The method divides the characteristic parameters into a number of intervals, constructs a fuzzy assessment matrix of characteristic parameters in a specific channel, weights the matrix row by row to obtain each channel’s assessment vector and finally outputs the channel health index.
Step1: Establish a health status interval set: This interval is a collection of different health levels of each channel’s characteristic. Assuming there arestatus levels, the health status interval set can be expressed as:
where
represents the health status of each characteristic parameter and
represents the corresponding health level.
Step2: Calculate the membership vector of each characteristic parameter: through the fuzzy calculation of a health status interval as mentioned above, the corresponding factor membership vector can be obtained as:
where
is the membership degree of the
-th characteristic parameter in the
-th channel to the
-th health state.
Step3: Construct a fuzzy assessment matrix: by calculating the membership vector of each characteristic parameter and combining the membership vectors of all the characteristic parameters in each channel, a fuzzy assessment matrix is constructed:
where
is the number of health state intervals and
is the number of channel characteristic parameters.
Step4: Determine the weight vector of characteristic parameters in each channel: based on the characteristic parameter selection in
Section 2.1, the rough set reduction method in
Section 2.4 below is used to identify the importance of the factor to the upper factor, and then construct the weight vector as:
Step 5: Calculate the assessment vector:
where
represents the assessment vector of the
-th channel.
Step 6: Calculate the channel health index: the channel health index is obtained by weighting and normalizing the assessment vector of each channel:
where
is the number of health levels in the health status interval and
is the number of elements in
.
2.4. Objective Weighting Method Based on Rough Set Reduction
In the weight distribution process, it is necessary to minimize the subjective factors’ influence. Here, an objective weighting method based on rough set reduction is used, that is, an attribute is first removed from the set, and its importance is evaluated to determine its weight. The idea of rough set reduction is to continuously remove certain attributes from the original complete attribute set, and then observe whether the state has undergone major changes after classification. If there is a major change, the importance of the attribute is higher, otherwise the importance is lower. The weight determination process is as follows:
Step 1: Construct a decision table: Construct a decision table with different attributes and importance.The bottom factors in
Figure 1 are used as conditional attributes of the decision table:
, and the upper factors are used as decision attributes:
.
Step 2: Calculate the attribute conditional information entropy: assuming that
is a subset of attributes in a system assessment factor,
is a certain attribute, and the conditional information entropy of
to
is:
where
is a finite, non-empty set.
Step 3: Calculate the importance of a single attribute: remove a certain attribute,
, based on the conditional information entropy; the attribute importance of
in
can be obtained as:
Step 4: Calculate the weight: by calculating the importance of a single attribute, the weight of the attribute can be obtained as:
2.5. Flight Control System Health Assessment Process
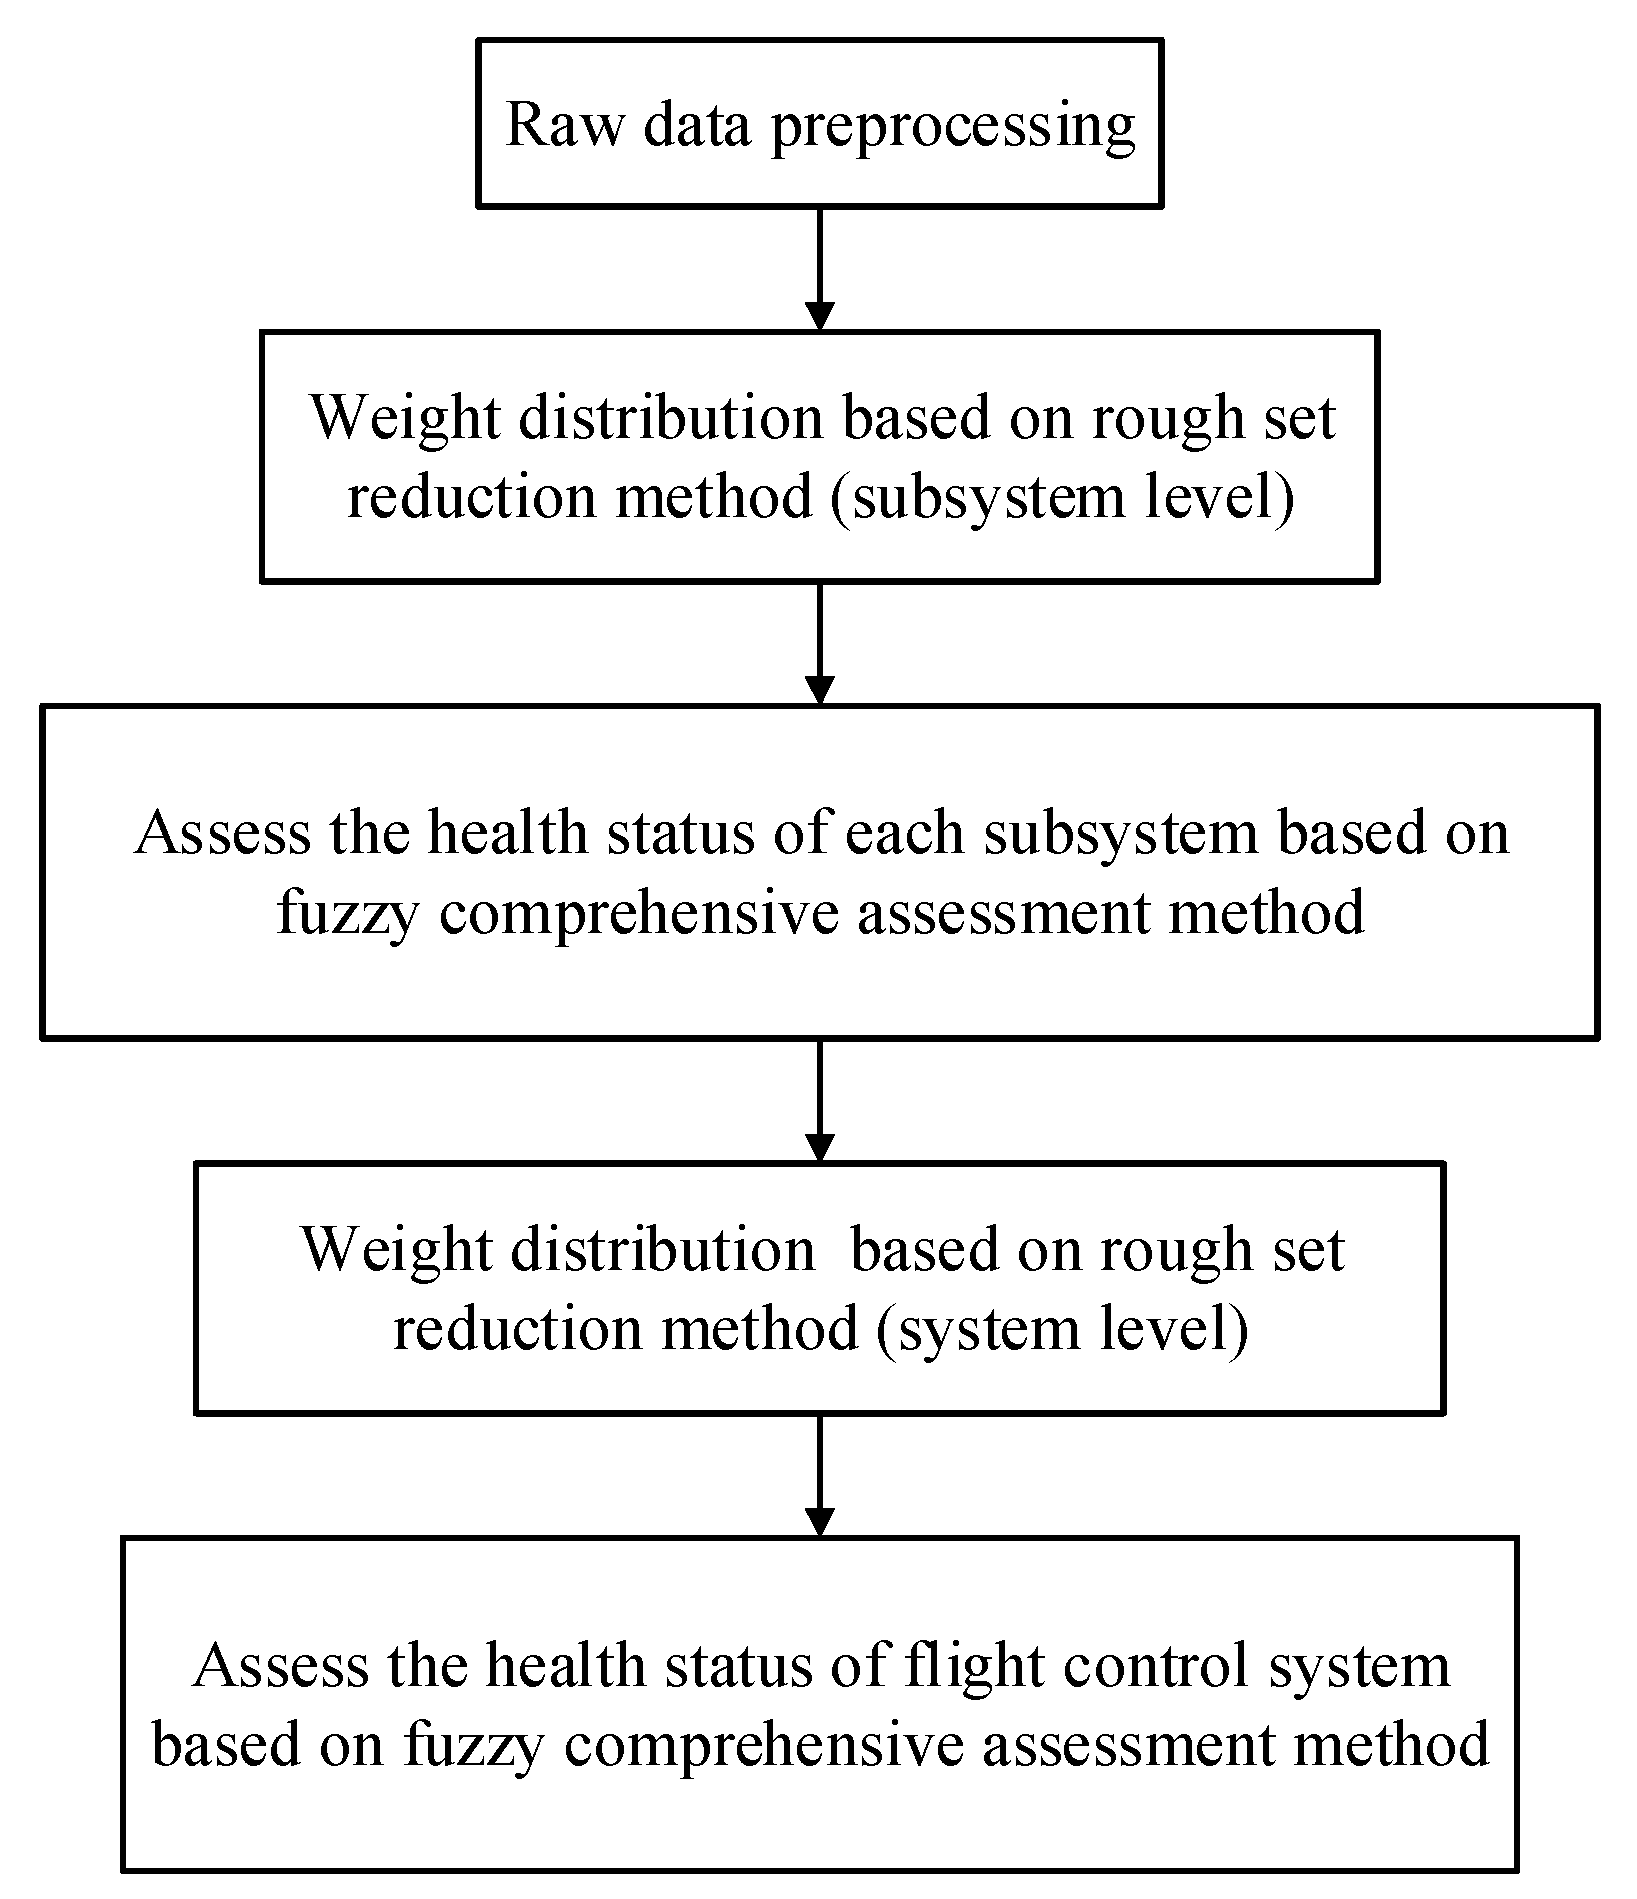
In summary, the health assessment process under certain conditions is shown in
Figure 2.
- (1)
After processing the original data, the rough set reduction algorithm is used to obtain the weight of each characteristic parameter to its subsystem.
- (2)
The health assessment of each subsystem is carried out by the fuzzy comprehensive assessment method, and the health index, , of each subsystem is obtained.
- (3)
The rough set reduction algorithm is used to obtain the weight of each subsystem to the flight control system.
- (4)
The health assessment is carried out by the fuzzy comprehensive assessment method, and the health index, , of the flight control system is obtained.
3. Flight Control System Health Assessment under Uncertainty
Section 2 screens the characteristic parameters that characterize the health status. Although these parameters have nominal values when the aircraft leaves the factory, there are uncertainties in their values during actual flight. Uncertainty can lead to misidentification of assessment results and cause non-damage degradation, that is, false positives. Based on the health assessment process in
Section 2, the uncertain condition is considered to establish the health assessment model in this section.
3.1. Uncertainty Representation and Interpretation
At present, the uncertainty representation is usually based on the following theories: probability theory [
23], fuzzy set theory [
24], evidence theory [
25], interval analysis theory [
26], etc. Among them, probability theory is widely used in health assessment [
27]. In this section, the parameters’ uncertainty will be described in the form of probability distributions.
3.2. Uncertainty Quantification Based on
The propagation problem based on probability theory needs to first know the probability distribution of model inputs. However, in actuality, the model input parameters are not continuous, or their distribution is not a common probability distribution, such as uniform distribution, normal distribution, etc. In view of this, an uncertainty measurement method based on
[
28] is proposed to describe the unknown distribution type.
is a class of bounded, unimodal and symmetrical probability density functions (PDF), which can be used to approximate a variety of common distributions in a specified interval. Its specific form is:
where
.The value of the constant,
, is:
where
is the gamma function.
The continuous unimodal symmetrical distribution with a mean value of 0 in the interval (−1,1) can be approximated by Equation (11) with different value of .
However, the method is only suitable for aparameter with a symmetrical distribution in (−1,1), which is different withactual flight control system parameters. Therefore, in order to quantifythese parameters’ distribution, the method needs to be extended.
First, the following linear expansion is used to enlarge the random variable’s interval:
where
is a new constructed random variable and
and
are related parameters for the first expansion. It can be rewritten as:
Substitute Equation (14) into Equation (11), and the expanded probability density function is:
That is, with the values of and variationin the extended model, the range in the initial method can be extended from (−1,1) to any finite interval.
Further, for the quantification of unimodal, asymmetric and continuously distributed random variables, a quadratic extended method is proposed to fit it.
Consider the following second expansion:
It can be solved by Equation (16):
Substitute Equation (17) into Equation (11), when
and
, and the PDF is:
where the value range of
is
.
When
and
, the PDF is:
where the value range of
is
.
The method after the first and second expansion can be used to describe the distribution of continuous, unimodal, normal or skewed parameters on any finite interval.
Forthe first and second expansion methods, the unknown parameters are and . Theoretically, the common methods for parameter estimation include moment estimation, least square estimation and likelihood estimation. Among them, the moment estimation is simple, even if the parameter’s distribution is unknown; equations can be established through the statistical characteristics of the sample.
Therefore, the moment estimation method is used to solve the parameters in
. First, the second, third and fourthcentral moments are derived from the analytic form of the PDF, and then a set of equations are established and solved simultaneously through the relationship between the central moment and the sample mean, variance, skewness and kurtosis, and then the estimated value of
and
can be obtained. The specific solution process can be found in the
Appendix A.
3.3. Uncertainty Propagation Based on MCS
The MCS algorithm is a random sampling method [
29] which can truly simulate the system’s actual dynamic process, and its calculation result has very little error compared with the actual result, so it has become a standard uncertainty calculation method. The MCS method is used to assess flight control systems’ health status. The basic steps are as follows:
- (1)
For uncertain input parameters, large enough random numbers, , with the same distribution are generated according to its probability density function.
- (2)
Substitute the generated parameters into the health assessment process to obtain multiple health assessment values, .
- (3)
Compute the probability characteristics of the health assessment values. The probability feature solving process is described in detail in
Section 3.4 below.
3.4. Probability Distribution Based on the Maximum Entropy
The maximum entropy is a criterion for selecting the statistical characteristics of random variables that are most in line with the objective situation. When the information of unknown parameters is partly obtained, such as the mean and variance, the maximum entropy selects the probability distribution that conforms to this information and has the largest entropy value as the statistical characteristic of a parameter. The essence of entropy is the uncertainty of random variables; the largest entropy value indicates the largest uncertainty. In this sense, the probability distribution based on the maximum entropy is the most uncertain inference in accordance with the known information. Therefore, for the probability distribution of the assessment output in this paper, the maximum entropy can be considered as a choice that meets the objective situationbest.
Assuming that
is a one-dimensional continuous random variable, and its probability density function exists, the entropy of
can be expressed as:
where
is the integration space and
is the probability density function of.
Take the first
-order center moment of
as a constraint. The maximum entropy can be expressed as:
where
is the mean value of the random variable and
is the central moment of the random variable.
Introduce the Lagrangian multiplier and define the function:
where
is the pending multiplier,
.
Calculate the derivative of
with respect to
when the partial derivative is 0. The maximum entropy PDF can be obtained as:
Substitute Equation (23) into Equation (21) and the undetermined multiplier can be solved. In order to ensure the accuracy of , the first four central moments of the variable are usually selected as the constraints, and as the integral of the probability density function in its integral space is always 1, there are five constraints to solve for five undetermined multipliers from to ; theoretically, there is an optimal solution.
3.5. Flight Control System Health Assessment Process under Uncertain Conditions
All in all, as the input characteristic parameters have an unknown distribution, the uncertainty propagation analysis process of the health assessment is as follows in
Figure 3:
- (1)
Raw data preprocessing: obtain the first four central moments’ analytical form of characteristic parameters; meanwhile, obtain the mean, , variance, , skewness, and kurtosis, , of the raw flight data;
- (2)
Uncertainty quantification of input parameters: according to the distribution of each feature parameter, choose the first or second expansion method to quantify their PDF;
- (3)
Uncertainty propagation based on MCS: According to the PDF of each characteristic parameter, generate random numbers with the same distribution as the input of the flight control system health assessment model under uncertain conditions, and introduce them into the model mentioned in
Section 2 to obtain multiple health indices;
- (4)
Solve the PDF of the system health index via the maximum entropy.
4. Results and Discussion
In this section, the actual flight data of a commercial twin-propeller regional airliner will be used for the health assessment of a flight control system under uncertain conditions.
The data used in this article come from the QAR data (quick access recorder) of a commercial aircraft. A QAR has a relatively smaller storage capacity and can store more data, which greatly improves the integrity of data preservation. Nowadays, QAR data detection and tracking have become an important basis for safety management and are widely favored by various aviation safety management departments.
Due to the small number of aircraft in use, we have obtained 60 pieces of flight data for verification. Part of the data is shown in
Table 2 below:
4.1. Flight Control System Assessment of a Single Flight
Take the PDF calculation of the flap channel’s main hydraulic pressure as an example. First, calculate the
,
,
and
of the main hydraulic pressure, as shown in
Table 3.
Since the main hydraulic pressure distribution is single-peak and the skewness is not zero, the second extended
is used to solve the unknown parameters. According to the equations listed in
Section 3, we can obtain:
Then, the PDF of the main hydraulic pressure and its frequency histogram are obtained, as shown in
Figure 4.
In the same way, the expanded
is used to fit the other characteristic parameters’ PDFs. The polynomial coefficients
and
are shown in
Table 4:
In
Table 4,
is a transmission coefficient from steering column to elevator;
is a transmission coefficient from steering wheel to aileron; and
is a transmission coefficient from pedal to rudder. Then, the PDF of each characteristic parameter is obtained. The results are shown in
Figure 5,
Figure 6,
Figure 7.
With these PDF, the MCS method is used to conduct 10,000 simulations to generate 10,000 assessment input parameters with the same distribution.
The next step is to calculate the health index of the flight control system. According to the theory in
Section 2, the system will be divided into four channels: pitch, roll, yaw and flap, and their health status can be divided into four levels: healthy, slightly decline, severe decline and fault. Firstly, the relative degradation degree of the generated 10,000 input parameters is normalized. The health index of each channel is obtained by constructing the membership function, and then the weight of each channel relative to the flight control system is obtained through rough set reduction. Finally, the health index of all channels is weighted to obtain the whole system’s health index.
According to the maximum entropy, the first four-order statistical moments of this health index are counted firstly in
Table 5:
Then, the PDF of the health index is obtained according to the maximum entropy:
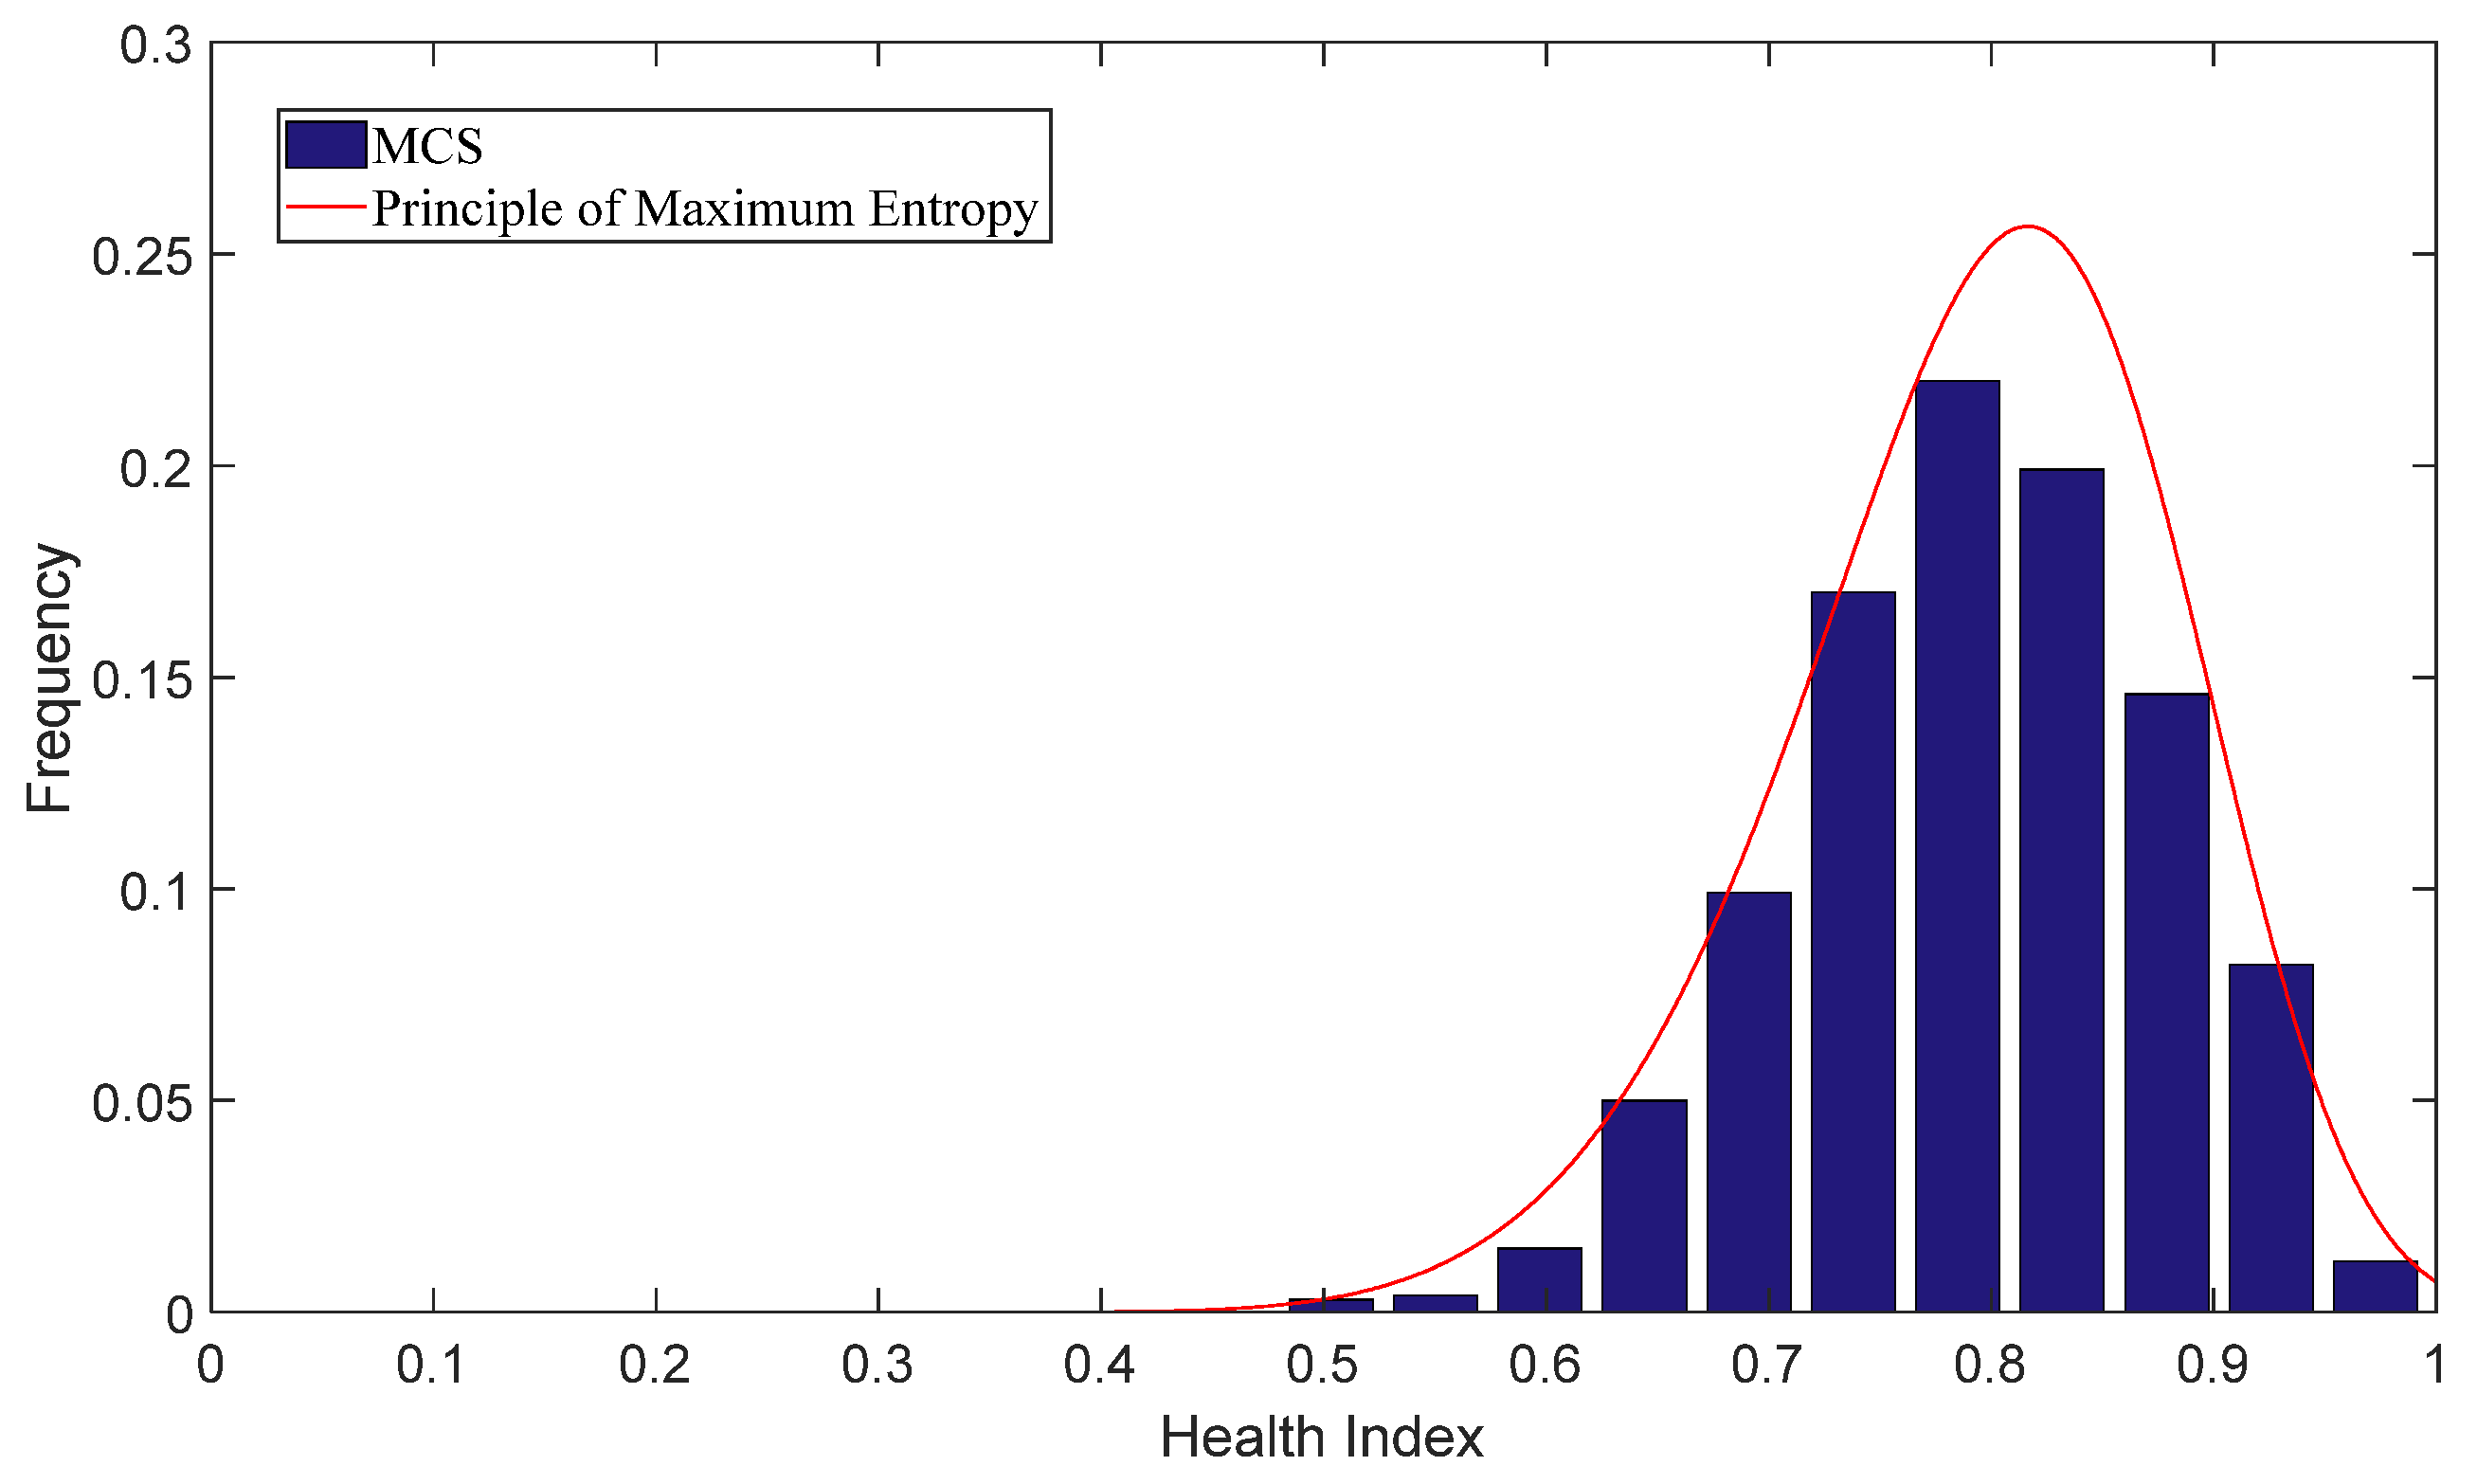
The PDF and the original data histogram are drawn in
Figure 8. It can be seen from the figure that the health index is mostly distributed between 0.75 and 1. Then, we can get the integration of PDF in (0.75, 1) as 0.7088, that is, the probability that the flight control system is in a healthy state is 70.88%, In the same way, the integration in (0, 0.25), (0.25, 0.5) and (0.5, 0.75) is 1.6338×10
−10, 0.0016 and 0.2896, respectively, which indicates that the probability of fault state, severe decline state and slightly decline state is 0%, 0.16% and 28.96%. These results show that the flight control system in this flight is likely to be healthy, and does not require maintenance.
4.2. Flight Control System Assessment of 60 Flights
According to the process above, the health assessment of 60 flights is carried out in this subsection, and the average value of the health index obtained from each simulation is taken as the health index of that flight. Then, the health index of the four channels and flight control system are obtained, which are shown in
Figure 9 and
Figure 10:
It can be seen that the health index for 60 flights under uncertain conditions is mostly distributed around 0.75. Among the 60 flights, the distribution of flights in different health states is shown in
Figure 11 below:
From the above figure, it can be seen that the system in 29 flights is operating well, is slightly degraded in 31 flights and no flight is in severe decline or fault. In addition, flights 34 and 51 have a larger decline.
Table 6 lists the health indices of the four channels of these two flights.
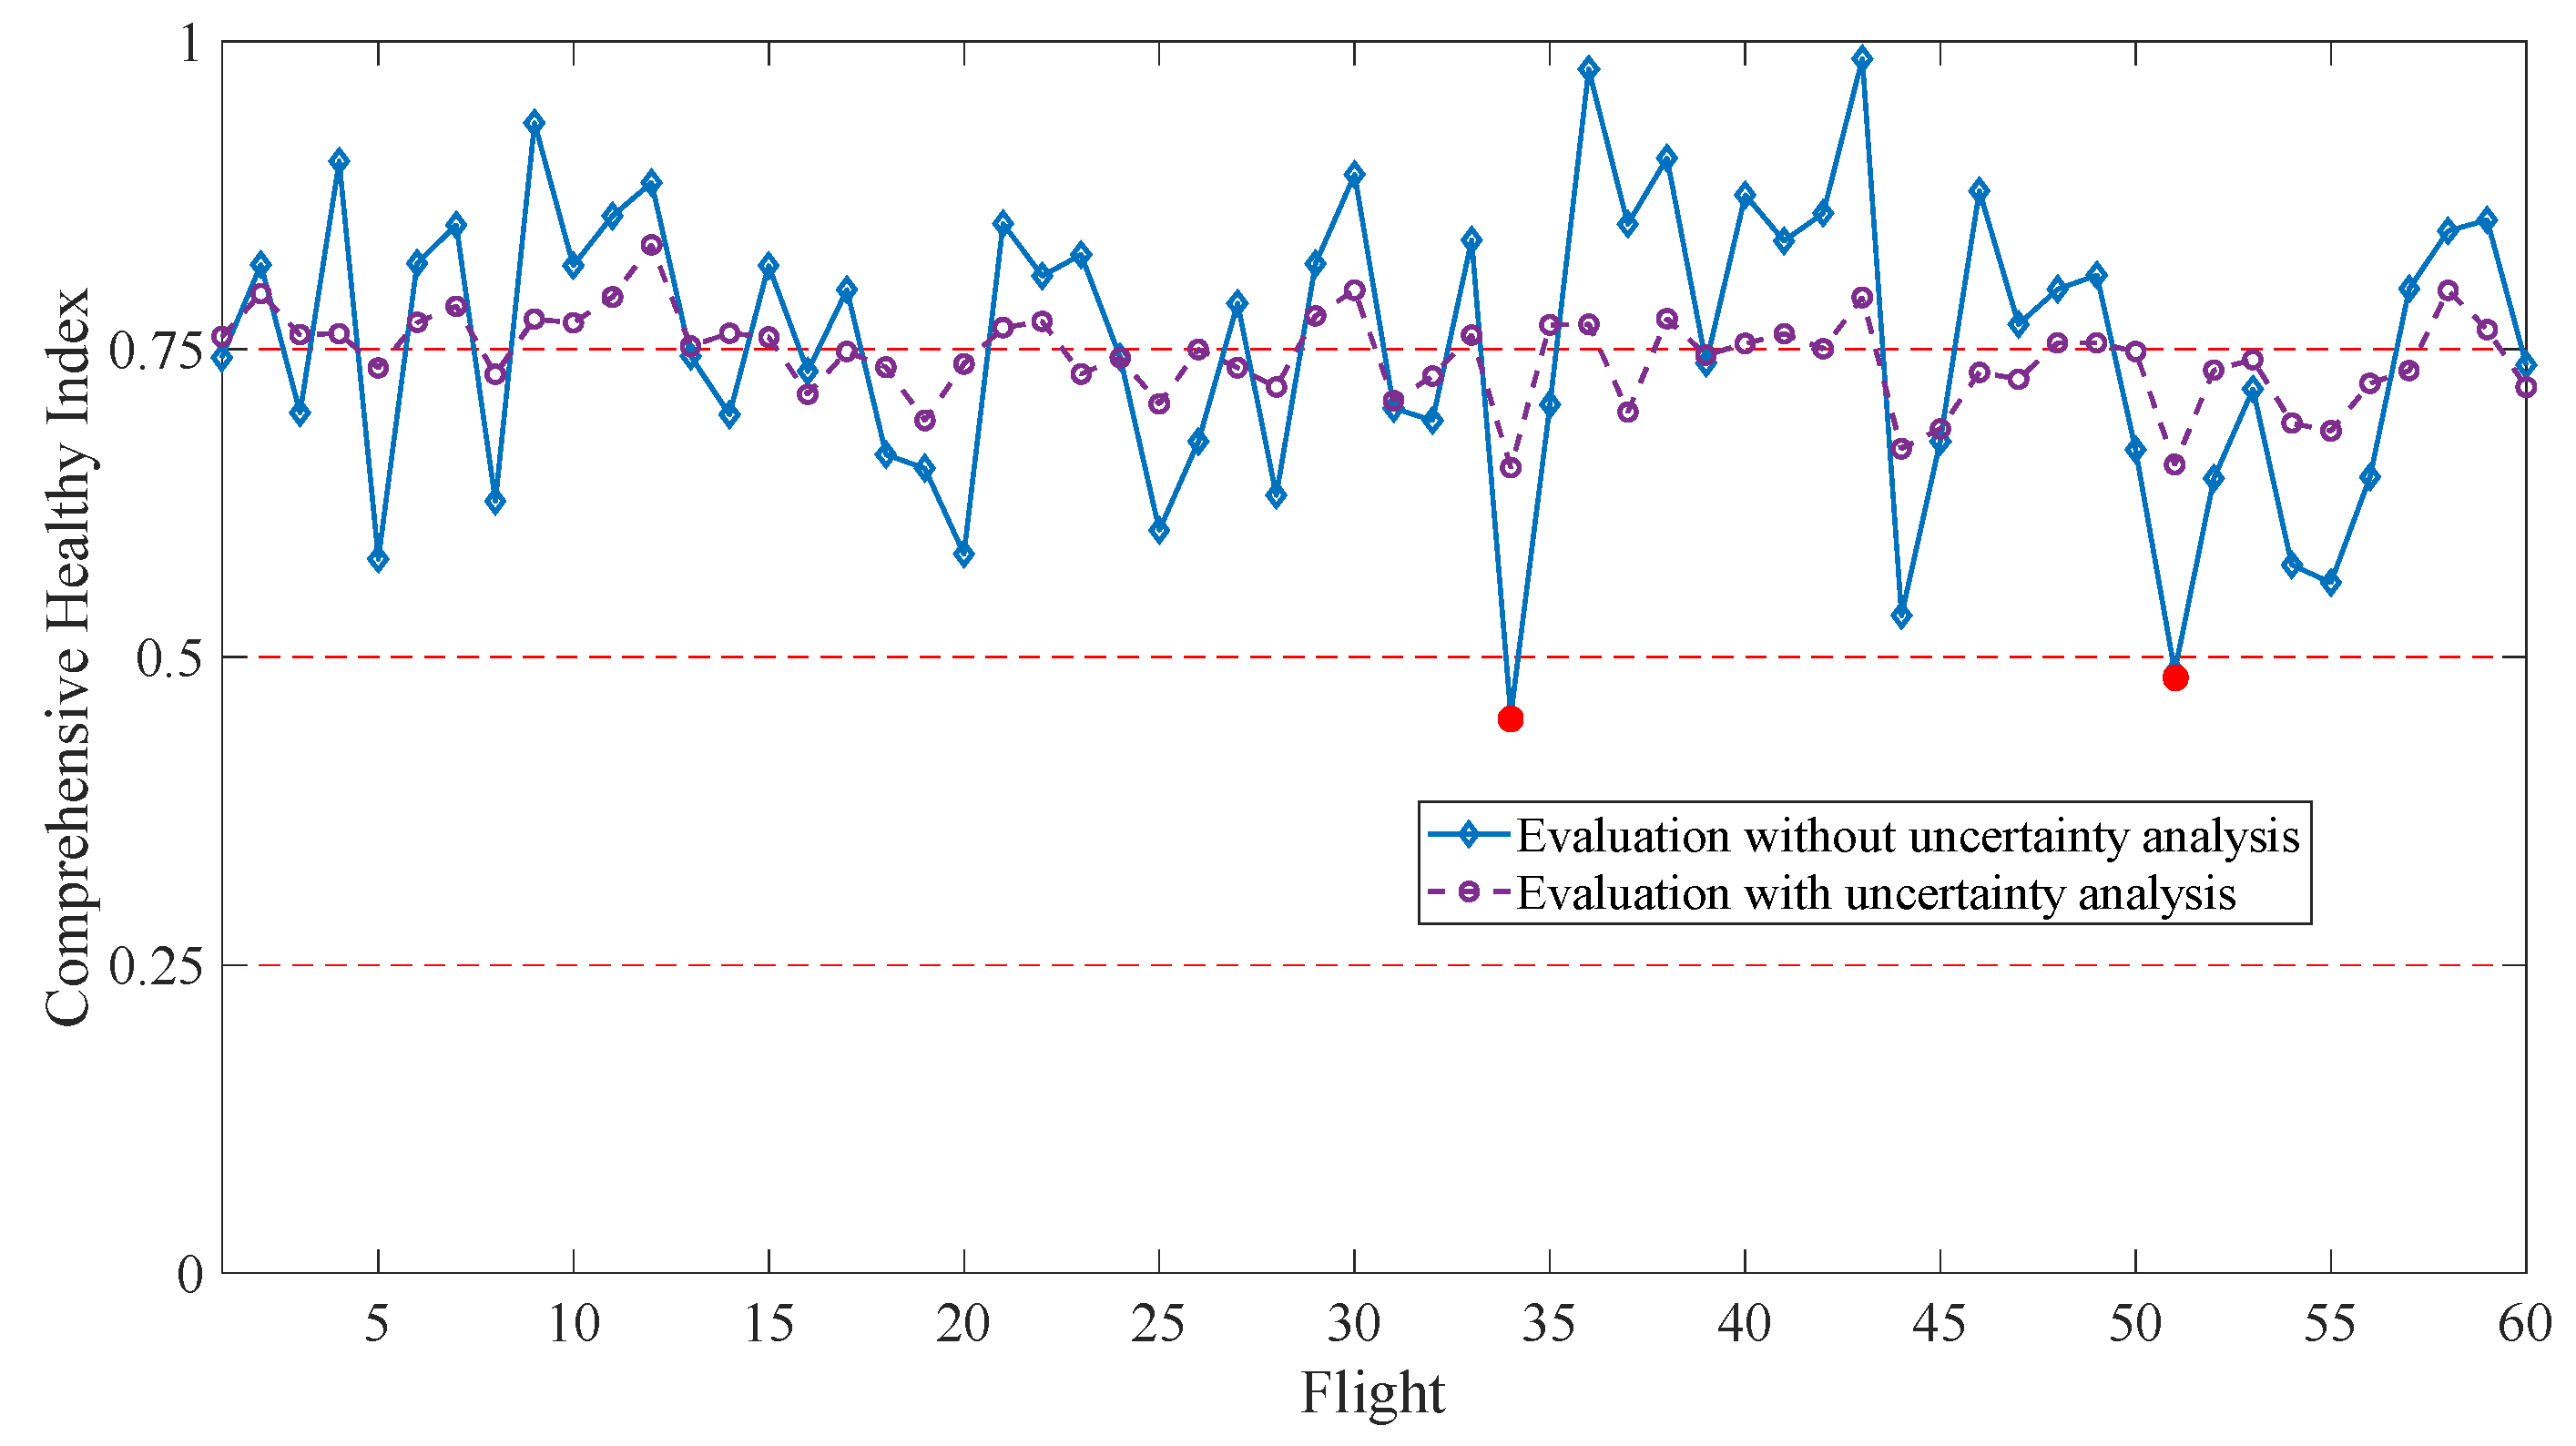
Furthermore, for these 60 flights, the assessment results under certain conditions and uncertain conditions are compared in
Figure 12 below.
4.3. Discussion
- (1)
From the quantification results of the uncertainty of each characteristic parameter in a single flight health assessment, it can be seen that the expansion method can accurately describe the uncertainty of these characteristic parameters; at the same time, the PDF curve and the histogram almost fit, which indicates that the probability distribution solution based on the maximum entropy is effective.
- (2)
The health assessment results of 60 flights under uncertain conditions show that the aircraft is currently in good health. While only some functions slightly degrade, the health indices of flights 34 and 51 (red dots in
Figure 12) are relatively low, and specifically, the health indices of these two flights’ pitch and yaw channels are lower.
- (3)
Comparing the health assessment results with and without the uncertain factors in
Figure 12, the health index has basically the same trend, but the health index under certain conditions fluctuates more. However, for a product with a long life cycle, such a large fluctuation in health status in a short period is obviously not in line with the law of life degradation. Therefore, the assessment results under uncertain conditions are more in line with the actual situation.
- (4)
In addition, a larger health index fluctuation means higher false alarm rates. Taking flights 34 and 51 as an example, the health indices are 0.4524 and 0.4883 without considering the uncertainty, which has reached the severe decline threshold; however, under uncertain conditions, the health indices are 0.6838 and 0.6562. Although these results are relatively low compared with other flights, the aircraft is still in a slightly degraded state and has not reached a state ofsevere decline. Therefore, health assessments under uncertain conditions reduce the influence of outliers on the assessment results.
- (5)
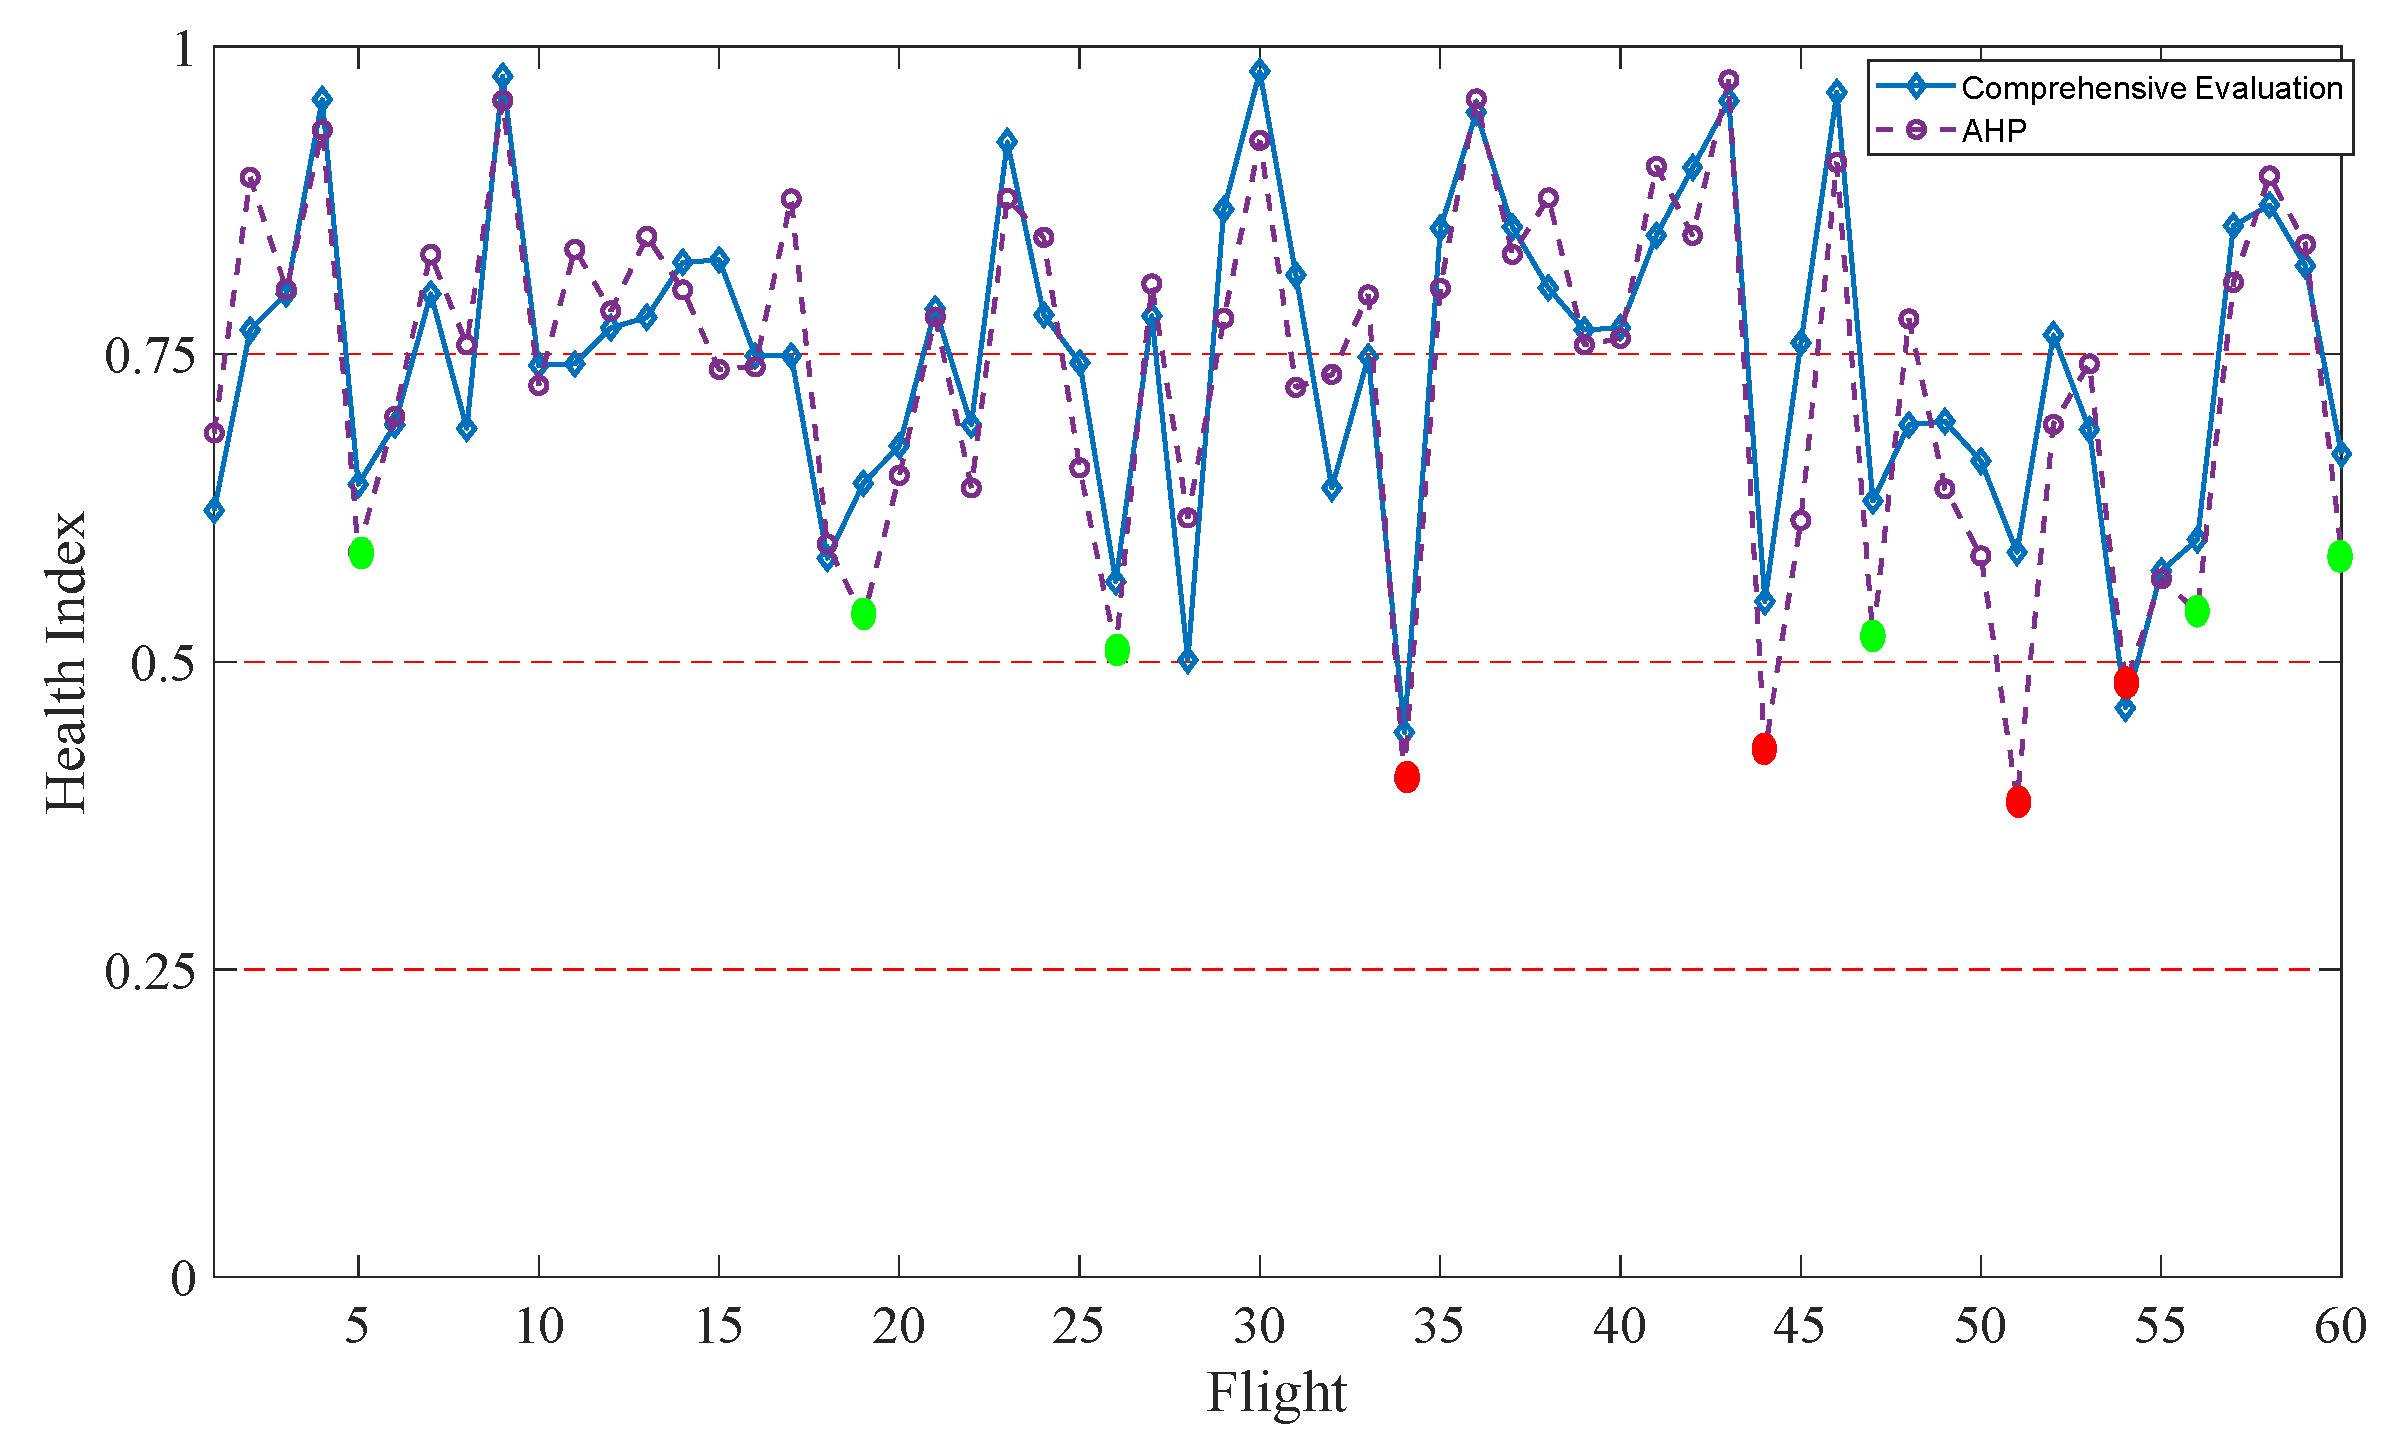
As mentioned at the beginning of
Section 2, the research in this article is based on the authors’ previous research [
14]. In this previous piece of research, we established a health assessment model of a flight control system under certain conditions, obtained the results of the flight control system under certain conditions and compared them with the results obtained by using AHP, as shown in
Figure 13. The conclusion is that the built model can reduce inaccurate evaluation caused by the bias of subjective judgments of humans, which improves the reliability and robustness of evaluation results.
Based on the previously established certain comprehensive evaluation model, this paper establishes an evaluation model for a flight control system under uncertain conditions and compares the evaluation results obtained under certain and uncertain conditions.
The conclusion is that the health assessment model of the flight control system under uncertain conditions can reduce the influence of outliers on the assessment results.
Therefore, by establishing health assessment models under certain and uncertain conditions successively, the influence of human factors and outliers on the assessment results is reduced and the false alarms caused by these factors are therefore reduced.
- (6)
In this paper, a health assessment model for flight control systems under uncertain conditions is established. The research ideas of this model are also applicable to other large-scale systems. That is, an assessment model under certain conditions is first established, whose process includes establishing health assessment indicators, dividing health levels, selecting assessment models and choosing a weight distribution method. Then, uncertainty is introduced into the evaluation process, and uncertainty problem research, including uncertainty expression, uncertainty quantification, uncertainty propagation, etc. is used. Finally, the system’s health assessment results under uncertain conditions are obtained.
- (7)
Although this article has obtained a probabilistic description of the health status of a flight control system for 60 flights, there are still the following aspects that need improvement: Firstly, there are fewer data samples. In future research researchers can consider using more data samples to obtain more accurate results. Secondly, this study analyzed the uncertainty of the parameters that affect the health of a flight control system from a macro perspective, and did not specifically analyze the performance degradation of the key components of a flight control system. Future research can analyze the influence of parameter uncertainty of these components on the evaluation results.
5. Conclusions
PHM technology has now become an important tool to ensure the operation of modern commercial aircraft, because it can provide a large amount of fault information for maintenance decision making, and as an important part of PHM technology health assessments can accurately assess the operational status of aircraft. Health assessment information obtained from aircraft-condition-monitoring system data can be used to improve aircraft maintenance practices to avoid delays and cancellations. The combination of aircraft system degradation indicators and estimation algorithms can provide maintenance personnel with the ability to arrange disassembly and maintenance plans in advance.
Based on flight control system health assessment under certain conditions, this paper establishes a health assessment model under uncertain conditions. Firstly, the characteristic parameters that characterize the health status of a flight control system are selected. Secondly, the uncertain factors are included in the flight control system health assessment modeling process, and the uncertainty of the characteristic parameters is quantified and their propagation was simulated. Finally, the actual flight data are taken as an example to verify the effectiveness of the proposed model. The experimental results show that the health assessment under uncertain conditions is more in line with the actual situation of the degradation of an aircraft’s system life. More importantly, health assessments conducted under uncertain conditions can reduce the false alarm rate, which can support maintenance decisions.
In future research, statistical principles can be combined with machine learning and other methods to more accurately quantify the uncertainty of input parameters, and at the same time a failure prediction model can be established based on health indicators.


