Article

Fermented Cranberry Fortified Buckwheat Product—Phenolic Composition, Antioxidant and Microbiological Properties

by
Anna Mikulajová
1,*,
Zuzana Matejčeková
1,
Silvia Mošovská
1,
Zlatica Kohajdová
2,
Ľubomír Valík
1 and
Eva Hybenová
1
1
Department of Nutrition and Food Quality Assessment, Institute of Food Sciences and Nutrition, Faculty of Chemical and Food Technology, Slovak University of Technology in Bratislava, Radlinského 9, SK-812 37 Bratislava, Slovakia
2
Department of Food Technology, Institute of Food Sciences and Nutrition, Faculty of Chemical and Food Technology, Slovak University of Technology in Bratislava, Radlinského 9, SK-812 37 Bratislava, Slovakia
*
Author to whom correspondence should be addressed.
Appl. Sci. 2021, 11(19), 9241; https://doi.org/10.3390/app11199241
Submission received: 19 August 2021 / Revised: 26 September 2021 / Accepted: 29 September 2021 / Published: 4 October 2021

Abstract

:
This study determined the effect of fermentation by Fresco DVS 1010 starter culture with added probiotic strain Lactobacillus rhamnosus GG and potentially probiotic isolate Lactobacillus plantarum HM1, at fermentation times (0, 8 h) and cold storage period (24 h, 4th day, 7th day, 14th day), on microbial parameters, pH changes, total phenolic content, phenolic compounds profile, and antioxidant activity of buckwheat water- and milk-based mashes, flavored with cranberries and unflavored. The tested starter Fresco culture effectively fermented the buckwheat products and the viable cell counts of potentially probiotic bacteria were sufficient to demonstrate the health-promoting properties of final products. Lactic acid bacteria had a positive impact on total phenolic compound content, total flavonoid content, and antioxidant activity of buckwheat mashes, whereby final values (14 days) were higher by about 16.9–130.8%, 13.4–37.7%, and 14.5–145.9%, respectively, in comparison to initial values (0 h). Seven phenolic acids (gallic, protocatechuic, vanillic, syringic, caffeic, p-coumaric, and ferulic) and two flavonoids (rutin and quercetin) in buckwheat mashes were measured during the experimental period. The content of quercetin, gallic, and protocatechuic acids increased and, conversely, p-coumaric acid decreased, in all products. Prepared buckwheat fermented products have the potential to meet the criteria for potentially functional foods.

1. Introduction

Fermentation is a traditional food processing method employed to improve nutritional and sensory qualities, shelf-life, and safety of final products, in addition to the removal of undesirable components of primary substrate [1,2]. Diverse microorganisms are used to provide specific fermented food products. The largest group of bacteria involved in fermentation processes is lactic acid bacteria (Lactobacillus, Lactococcus, and Pediococcus spp.), yeasts (Candida, Debaryomyces, Hansenula, Pichia, and Saccharomyces spp.), and filamentous fungi (Amylomyces, Aspergillus, Mucor, and Rhizopus spp.) [3,4]. LAB are widely used within the food industry, not only as health promoting cultures, but, due to their growth and metabolism, they also contribute to the safety and stability of final food products [4]. Some strains of LAB have proven beneficial effects on host health via improving intestinal microbial balance. These are called probiotics, which are defined as “live microorganisms which when administered in adequate amounts confer a health benefit on the host” [5]. The most common bacteria used in probiotic preparations are Lactobacillus species such as L. acidophilus, L. rhamnosus, L. casei, or Bifidobacterium species such as B. lactis, B. longum, or B. breve [6].
Cereals and pseudocereals are highly important food sources in the human diet, and represent substantial substrates for the production of fermented foods. Generally, cereals and pseudocereals contribute to the intake of carbohydrates and, as a result, energy and dietary fiber, proteins, minerals, and vitamins, with numerous proven health effects [4]. A variety of technologies are used for cereal processing, but fermentation remains the best choice for improving the quality of proteins by increasing a number of factors, including: the available lysine, methionine, and tryptophan content; protein digestibility by reduction in protease inhibitors; starch digestibility; bioavailability of minerals (iron, zinc, calcium, magnesium) by degradation of phytate; content of B group vitamins; and content of phenolic compounds [4,7,8].
Many of the positive effects on human health of cereals and pseudocereals have been attributed to the presence of phenolic compounds. A valuable source of phenolics is buckwheat (Fagopyrum esculentum Moench), belonging to pseudocereals. Within the phenolics group, buckwheat grain contains phenolic acids (caffeic, p-coumaric, ferulic, sinapic, gallic, protocatechuic, vanillic, syringic, neochlorogenic, and chlorogenic) and flavonoids (rutin, quercetin, procyanidin B2, catechin, epicatechin gallate, vitexine, isovitexin, orientin, isorientin, and kaempferol) [9,10,11,12,13]). Polyphenols of buckwheat occur in free, soluble conjugate, and insoluble bound forms, of which the free form is predominant [14,15]. Many additional nutraceuticals, such as phytosterols (β-sitosterol, campesterol, stigmasterol, and isofucosterol), fagopyrins, and lignans also are present in buckwheat [13,16]. The protein content in buckwheat is higher and the amino acid profile is balanced compared to those of commonly used cereals. Lysine and arginine are present in high quantities, resulting in an amino acid score of 100. Buckwheat protein contains little or no gluten, which determines its usefulness for gluten-free diet, i.e., for people suffering from coeliac disease or an allergy to gluten [11,17]. A considerable number of studies have investigated the application of buckwheat in the production of gluten-free products and as a potential substrate for potentially functional foods. Moore et al. [18] investigated buckwheat as a composite flour in the development of gluten-free breads. Feng et al. [19] prepared an antidiabetic functional food from Tartary buckwheat fermented by Lactobacillus plantarum TK9 and L. paracasei TK1501. Zieliński et al. [20] evaluated gluten-free muffins based on unfermented and L. plantarum-fermented buckwheat flour. Coman et al. [21] tested the prebiotic potential of buckwheat flour (2%, 4%, and 6% w/v) and oat bran (2% and 4% w/v) in a symbiotic fermented milk formulation. Tested strains of L. paracasei and L. rhamnosus preserved viability for 24 days (the counts of lactobacilli remained above 109 CFU/mL). Additionally, several studies have indicated that buckwheat represents a good substrate for probiotic bacteria and thus for preparation of potentially functional products [22,23,24].
Because of its favorable nutritional and nutraceutical characteristics, buckwheat flour was selected as a substrate for fermentation and for fortification with cranberries to increase the level of phenolic compounds. Cranberries are rich in flavonoids, such as anthocyanins (glucosides, galactosides, and arabinosides of delphinidin, cyanidin, petunidin, peonidin, and malvidin), flavanols (procyanidins A, catechin, and epicatechin), favonols (glycosides of quercetin, kaempferol, and myricetin), and phenolic acids (gallic, chlorogenic, caffeic, p-coumaric, ferulic, sinapic, and ellagic acids) [25,26,27,28].
The influence of fermentation on food phenolics has been evaluated in various studies [7,29,30,31,32], with differences in microorganisms used, food matrixes, and fermentation conditions such as temperature and duration. In our study, fermentation behavior, considering microbial parameters and pH changes, total phenolic content, phenolic profile, and antioxidant activity, was assessed during the fermentation process following a cold storage period of 14 days. The extensive potential indicated in previous research and the development of new functional gluten-free products led us to prepare fermented buckwheat products with probiotic potential that are suitable not only for celiac patients and people suffering from allergies to gluten, but also as functional products with health and preventive characteristics.

2. Materials and Methods

2.1. Microorganism

A Fresco DVS 1010 starter culture consisting of Lactococcus lactis ssp. lactis, Lactococcus lactis ssp. cremoris, and Streptococcus thermophilus (commercial culture from Christian and Hansen, Hørsholm, Denmark) was kindly provided by Rajo, a.s. (Bratislava, Slovakia). The Fresco culture was kept in a deep-freezer. The starter culture of Fresco DVS 1010 was stored aerobically overnight at 30 ± 0.5 °C in M17 broth (Biokar Diagnostics, Beauvais, France).
The probiotic strain Lactobacillus rhamnosus GG (ATCC 53103) (isolation source—fecal samples of a healthy adult) was provided by Drs. Salminen and Ouwehand (University of Turku, Turku, Finland), through the mediation of Dr. Lauková (State Veterinary and Food Institute, Košice, Slovakia). A potentially probiotic isolate Lactobacillus plantarum HM1 was isolated from breast milk and identified by Liptáková et al. [33]. L. rhamnosus GG and L. plantarum HM1 were maintained in de Man Rogosa Sharpe (MRS) broth (Biokar Diagnostics, Beauvais, France). Starter cultures of L. rhamnosus GG and L. plantarum HM1 were obtained by overnight incubation at 37 ± 0.5 °C (5% CO2) in MRS broth. Pure cultures of studied lactic acid bacteria were centrifuged (6000 rpm for 5 min, Centrifuge EBA 20, Hettichlab, Tuttlingen, Germany); pellets of the cells were washed in 10 mL of sterile distilled water and centrifuged again under the same conditions. After centrifugation, the supernatant was removed and pellets were re-suspended in distilled water to its original volume, in compliance with the procedure of Matejčeková et al. [34].

2.2. Enumeration of Bacteria

Each 2 h during the fermentation and each day during the cold storage, serial ten-fold dilutions of samples of buckwheat mashes were prepared by rinsing with sterile saline solution (Biolife, Milan, Italy). The presumptive numbers of the cocci of Fresco culture were enumerated on M17 agar plates (Biokar Diagnostics, Beauvais, France) according to EN ISO 15214 [35]. Inoculated Petri dishes were cultivated for 24 h (30 ± 0.5 °C), aerobically. Presumptive numbers of L. plantarum HM1 and L. rhamnosus GG were estimated using Vegiton MRS agar (Sigma-Aldrich Chemie GmbH, Buchs, Switzerland). Inoculated Petri dishes were cultivated at anaerobic conditions at 37 ± 0.5 °C (5% CO2) [34].

2.3. Evaluation of Growth and Metabolic Parameters

Growth and metabolic parameters (specific growth rate, rate constant for decrease in counts, rate constant for decrease in pH, lag time duration) of the studied lactic acid bacteria in buckwheat mashes were fitted and calculated using the mechanistic model DMFit by Baranyi and Roberts [36]. Growth and metabolic parameters were calculated from each growth curve. Specific growth rates μ (1/h) were recalculated from the log10-based growth rates (GR) according to the equation μ = ln 10 × GR.
The pH values of the samples were monitored during fermentation and storage period using a pH meter with a penetration electrode (Knick Portamess, Berlin, Germany) calibrated with buffers at pH 4.0, 7.0, and 10.0 (Fisher Scientific, Loughborough, UK).

2.4. Preparation of Buckwheat Substrate

The buckwheat mash used as a substrate was prepared from buckwheat flour (ash (1.52% (w/w)), fat (2.12% (w/w)), proteins (8.31% (w/w)), reducing sugars (2.31% (w/w)); Kroner, Ltd., Bratislava, Slovakia), distilled water, or UHT milk (fat content 1.5%) (Rajo, a.s., Bratislava, Slovakia). To achieve optimal consistency of final products for consumption by spoon, the content of flour was 9.6% (w/v) in milk- and 9% (w/v) in water- based mash with the addition of sucrose in a concentration of 2% (w/v), in both. Weighed components as mentioned above were heated with stirring at 100 °C for 20 min, and then sterilized at 121 °C for 20 min. After sterilization the mashes were cooled and sterilized lyophilized cranberry powder (2.5 g/100 g) was added to flavor the samples. The sterility of prepared samples was regularly confirmed by the plating method prior to the inoculation.

2.5. Samples Fermentation

One hundred grams of sterile mashes was inoculated using Fresco DVS 1010 culture (5% (v/v)) to achieve inoculation levels of approximately 6 log CFU/mL. Static fermentation was performed at 37 ± 0.5 °C for 8 h (5% CO2). After this period, L. plantarum HM1 and L. rhamnosus GG (10% (v/v)) were singly inoculated (cell counts of approximately 8–9 log CFU/mL) into fermented samples and stored at 6 ± 0.5 °C for another 14 days with periodical determination of pH values and viability of studied bacteria. The experiments were carried out in duplicate.
Unfermented samples and samples after 8 h, 24 h, 4 days, 7 days, and 14 days underwent extraction procedures, and analyses of phenolic composition and antioxidant activity.

2.6. Extraction Procedure

Firstly, samples were freeze-dried and subsequently extracted with 65% ethanol (80 °C, 1 h, three times) [37]. Phenolic compounds were separated using ethyl acetate (Centralchem, Bratislava, Slovak Republic) from combined extracts. After solvent evaporation, the residues were reconstituted in 96% ethanol, and stored at −24 °C until further analysis.

2.7. Analysis of Total Phenolic Compounds

The total content of phenolic compounds was analyzed using Folin-Ciocalteu reagent (Sigma-Aldrich, Steinheim, Germany) according to Yu et al. [38], with minor modifications, as described previously by Mikulajová et al. [39]. The standard calibration curve prepared for gallic acid (Sigma-Aldrich, Steinheim, Germany) was used for calculation of total phenol content. Results are expressed as mg of gallic acid equivalent per gram of sample (mg GAE/g).

2.8. Analysis of Total Flavonoids

The total flavonoid content was analyzed using the AlCl3 method described by Kreft et al. [40]. The formed colored products were measured at 420 nm after 30 min. Quercetin (Sigma-Aldrich, Steinheim, Germany) was used as a standard. Results were expressed in mg of quercetin equivalent per gram of sample (mg QE/g).

2.9. Analysis of Individual Phenolic Compounds

Individual phenolic compounds were identified and quantified by high-performance liquid chromatography with diode array detection (HPLC/DAD, Agilent 1200 Series, Agilent Technologies, Santa Clara, CA, USA) analysis. Chromatographic separations were performed on a Zorbax Eclipse XDB-C18 column (4.6 × 150 mm, 5 μm, Agilent Technologies, Santa Clara, CA, USA) using a gradient system of elution with solvent flow rate of 1 mL/min. The solvent system selected for elution was water/acetic acid adjusted to pH 2.8 (solvent A) and acetonitrile (solvent B). The solvent A/solvent B ratio was changed from 95/5 to 70/30. Detection was carried out at 272 and 350 nm, respectively. Standard curves of individual phenolic compounds were prepared and used for identification and quantification of phenolic compounds in our samples using ChemStation software 12.2 (Agilent Technologies, Santa Clara, CA, USA). Results were expressed as µg per gram of sample (µg/g).

2.10. Analysis of Antioxidant Activity

The antioxidant activity was assessed by 2,2-diphenyl-1-picrylhydrazyl free radical (DPPH) (Sigma-Aldrich, Steinheim, Germany) assay measured according to Yen and Chen [41] with modifications, as explained previously by Mikulajová et al. [39]. Sample extracts were allowed to react with DPPH solution for 10 min. Discoloration was measured at 517 nm. DPPH solution in 96% ethanol (c = 0.12 mg/mL) was used to prepare the calibration curve. Results were expressed as the amount of scavenged DPPH radicals per gram of sample (mg DPPH/g).

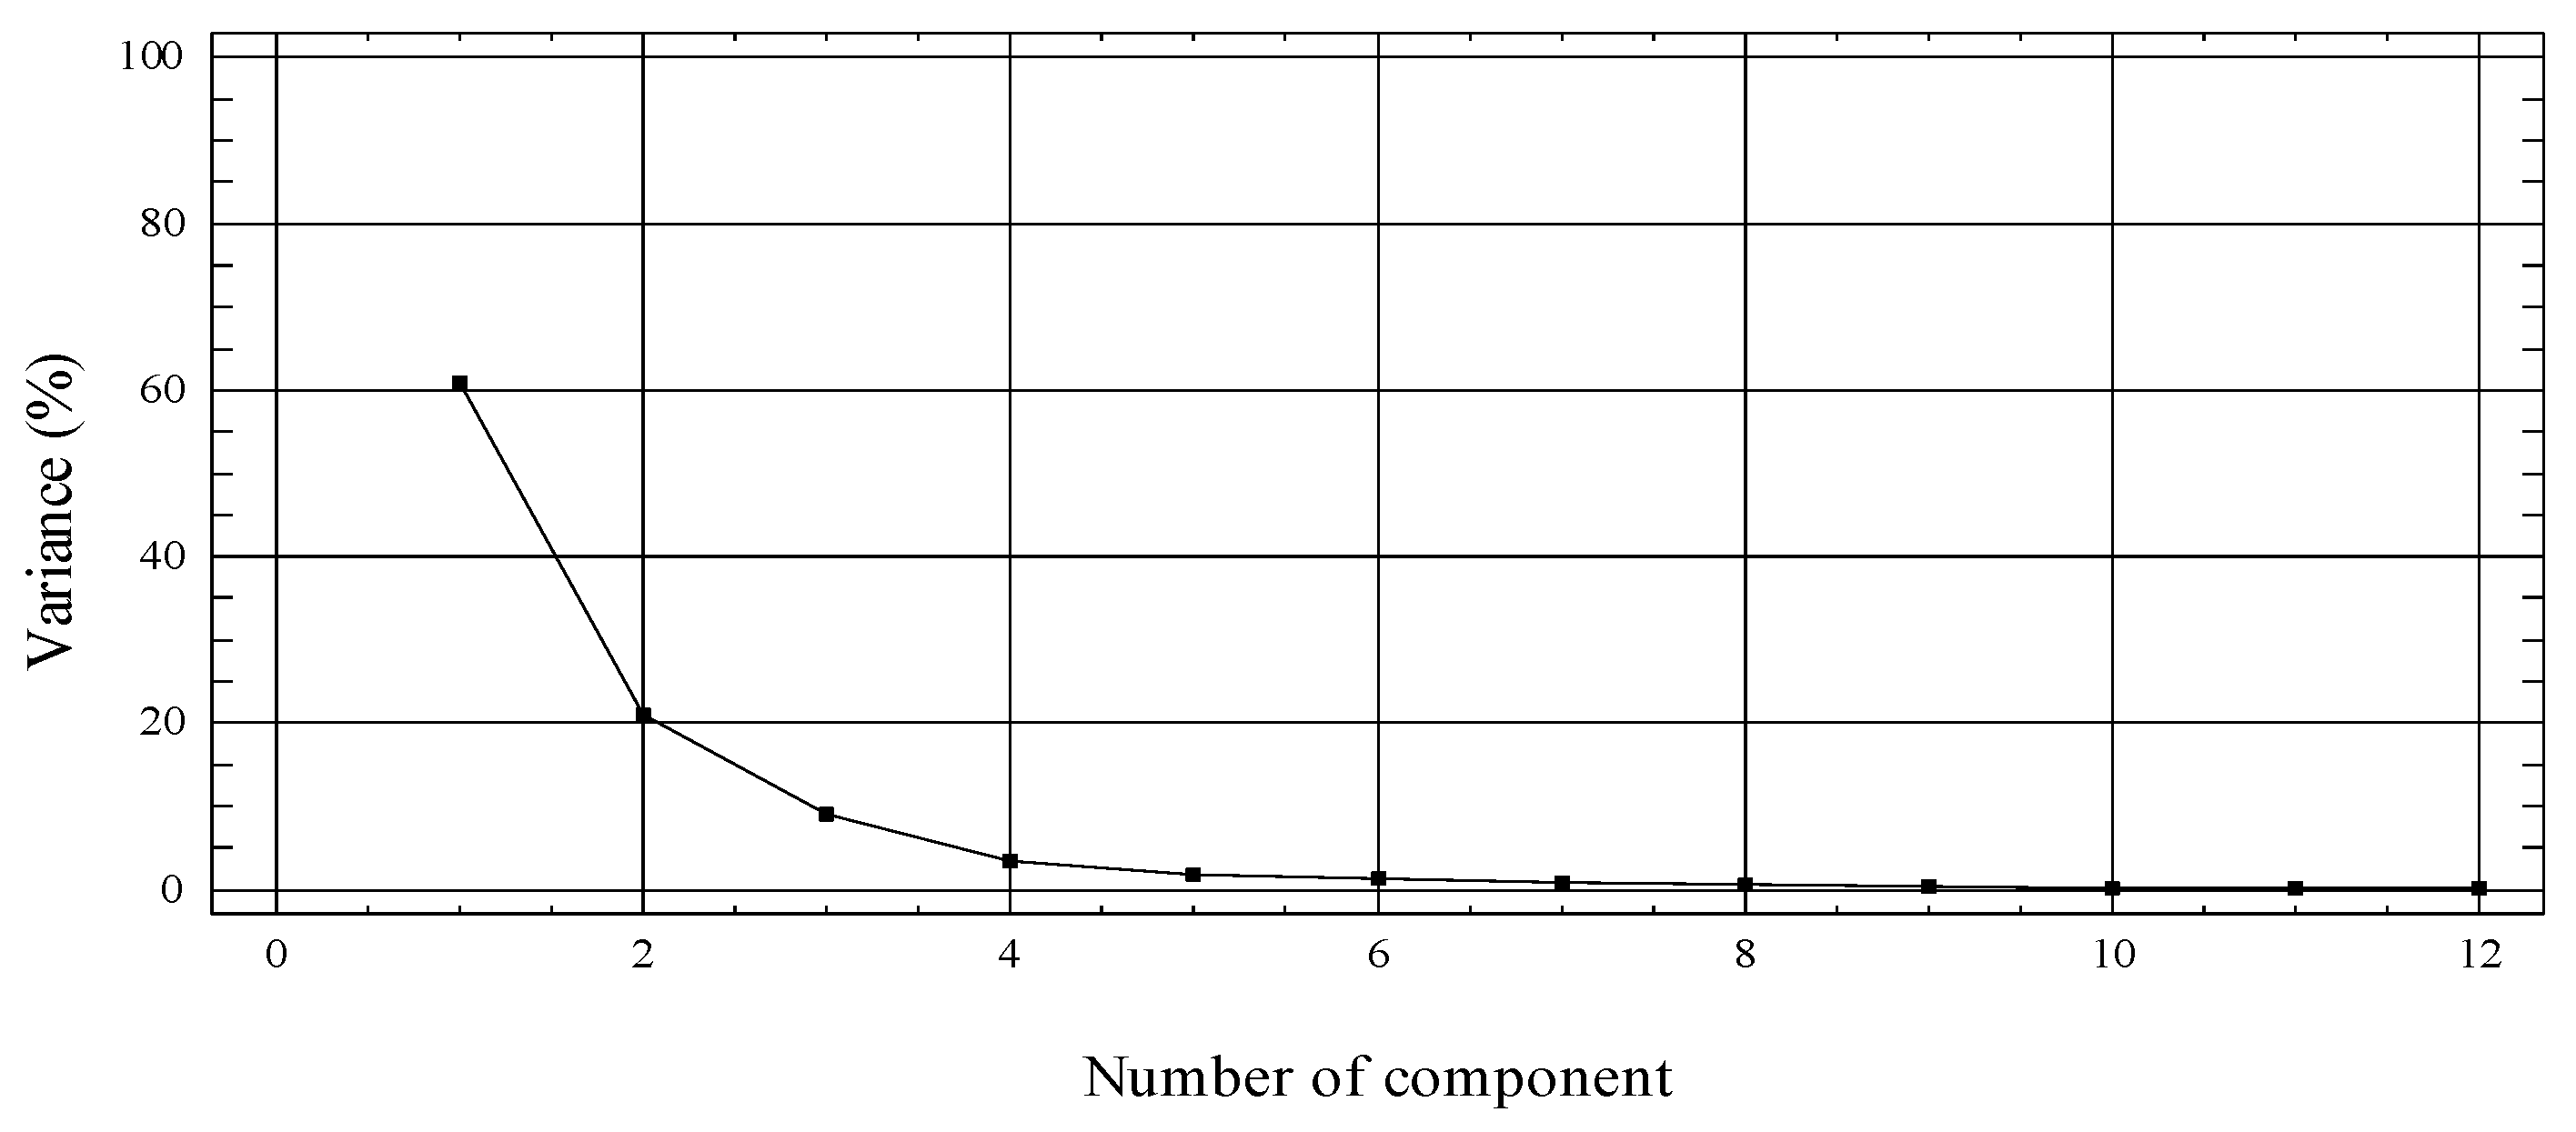
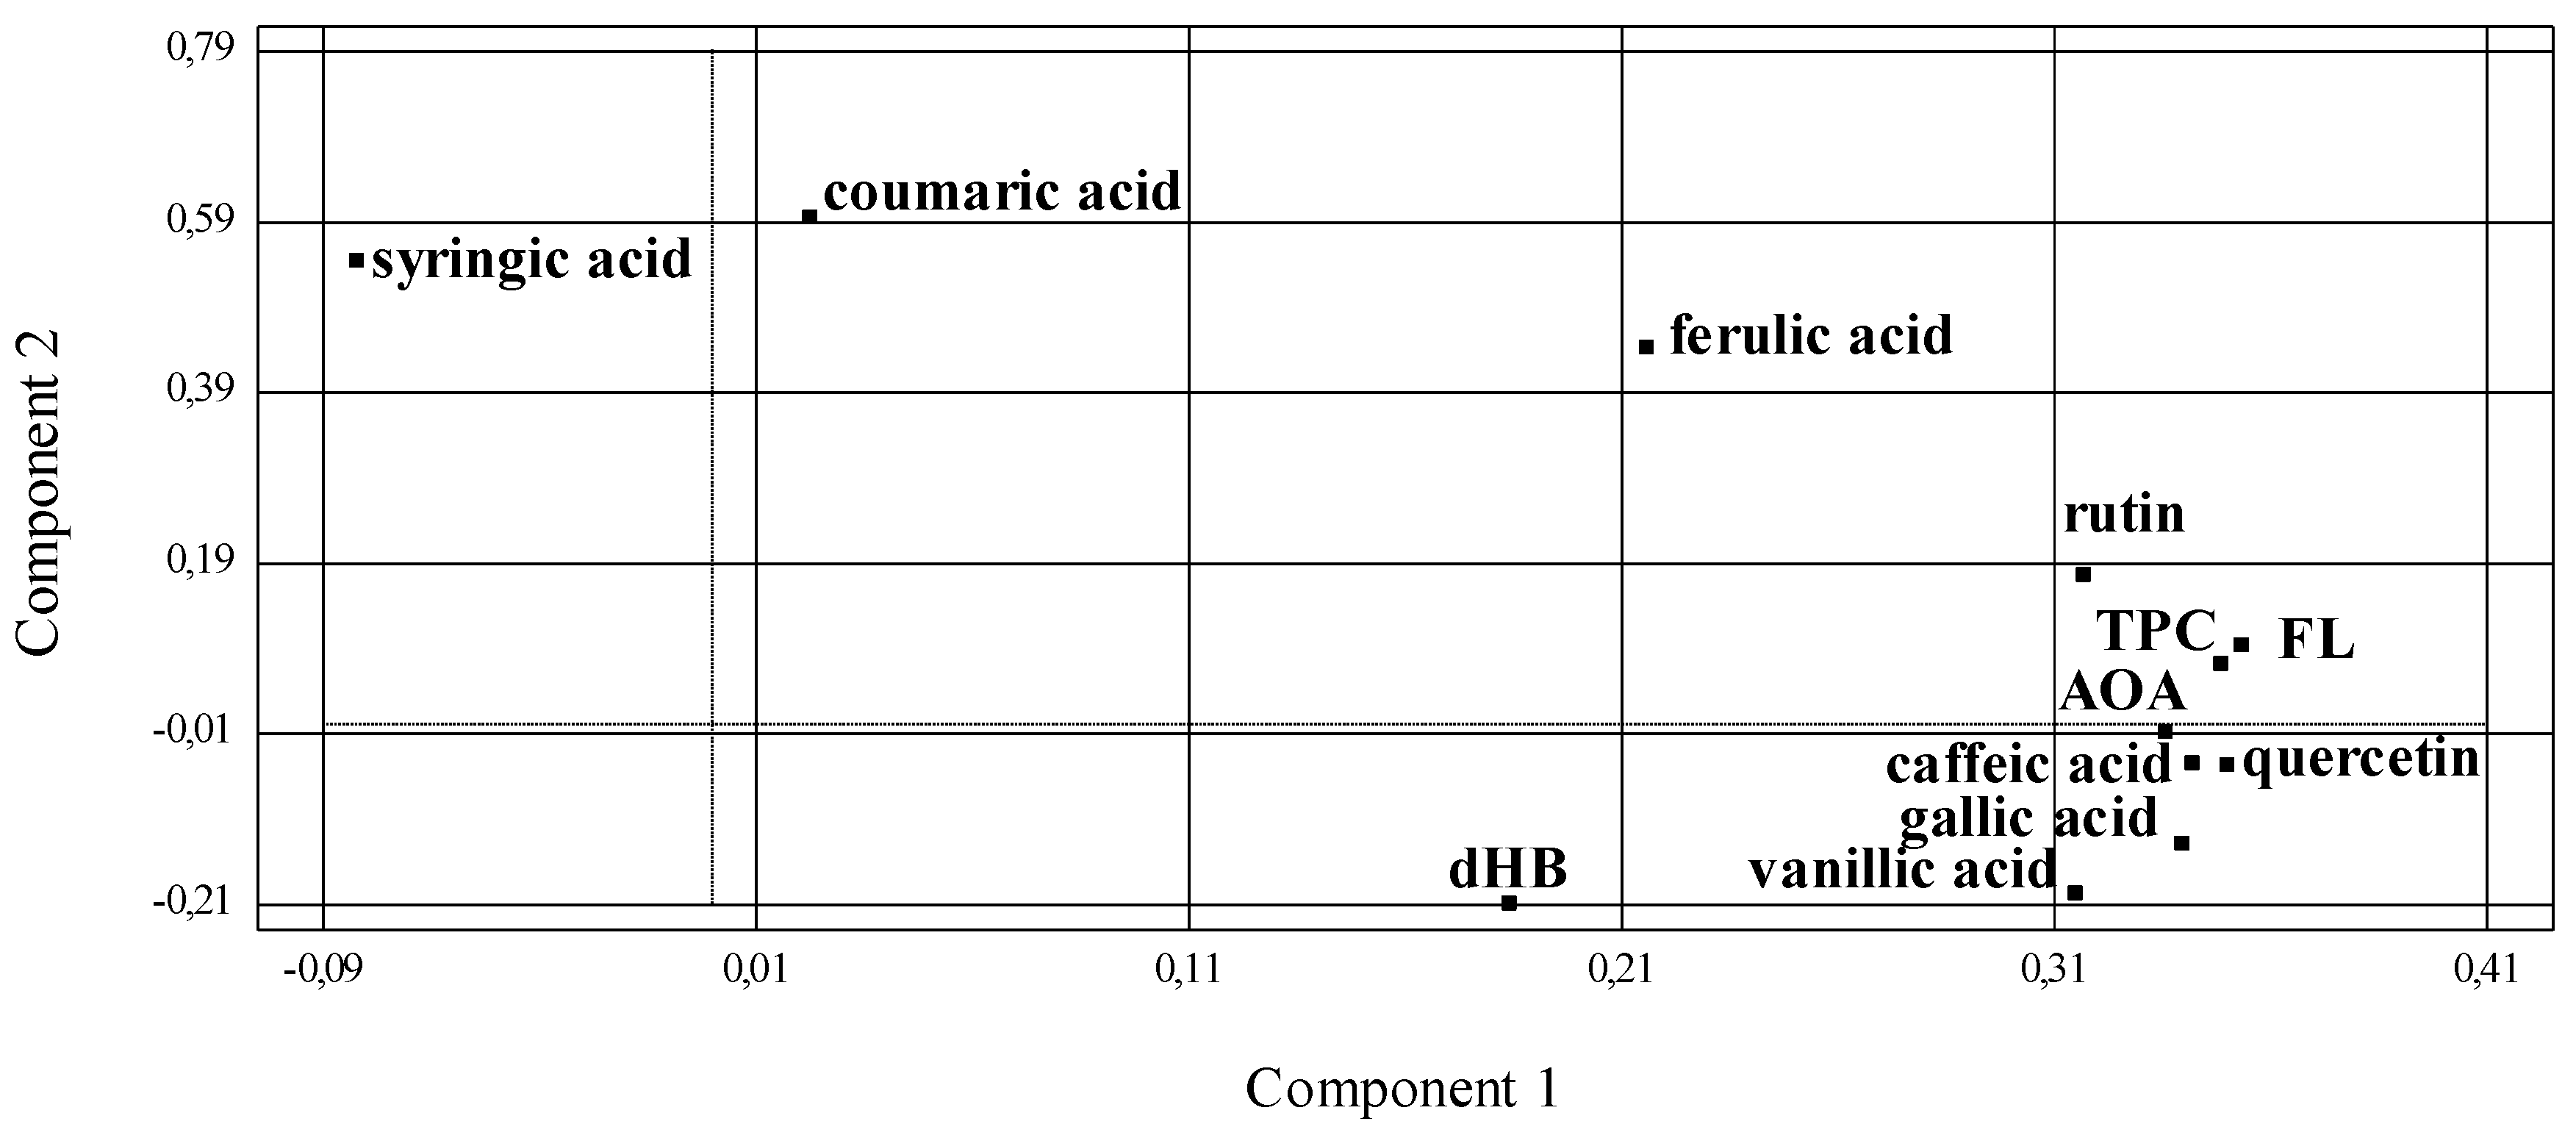
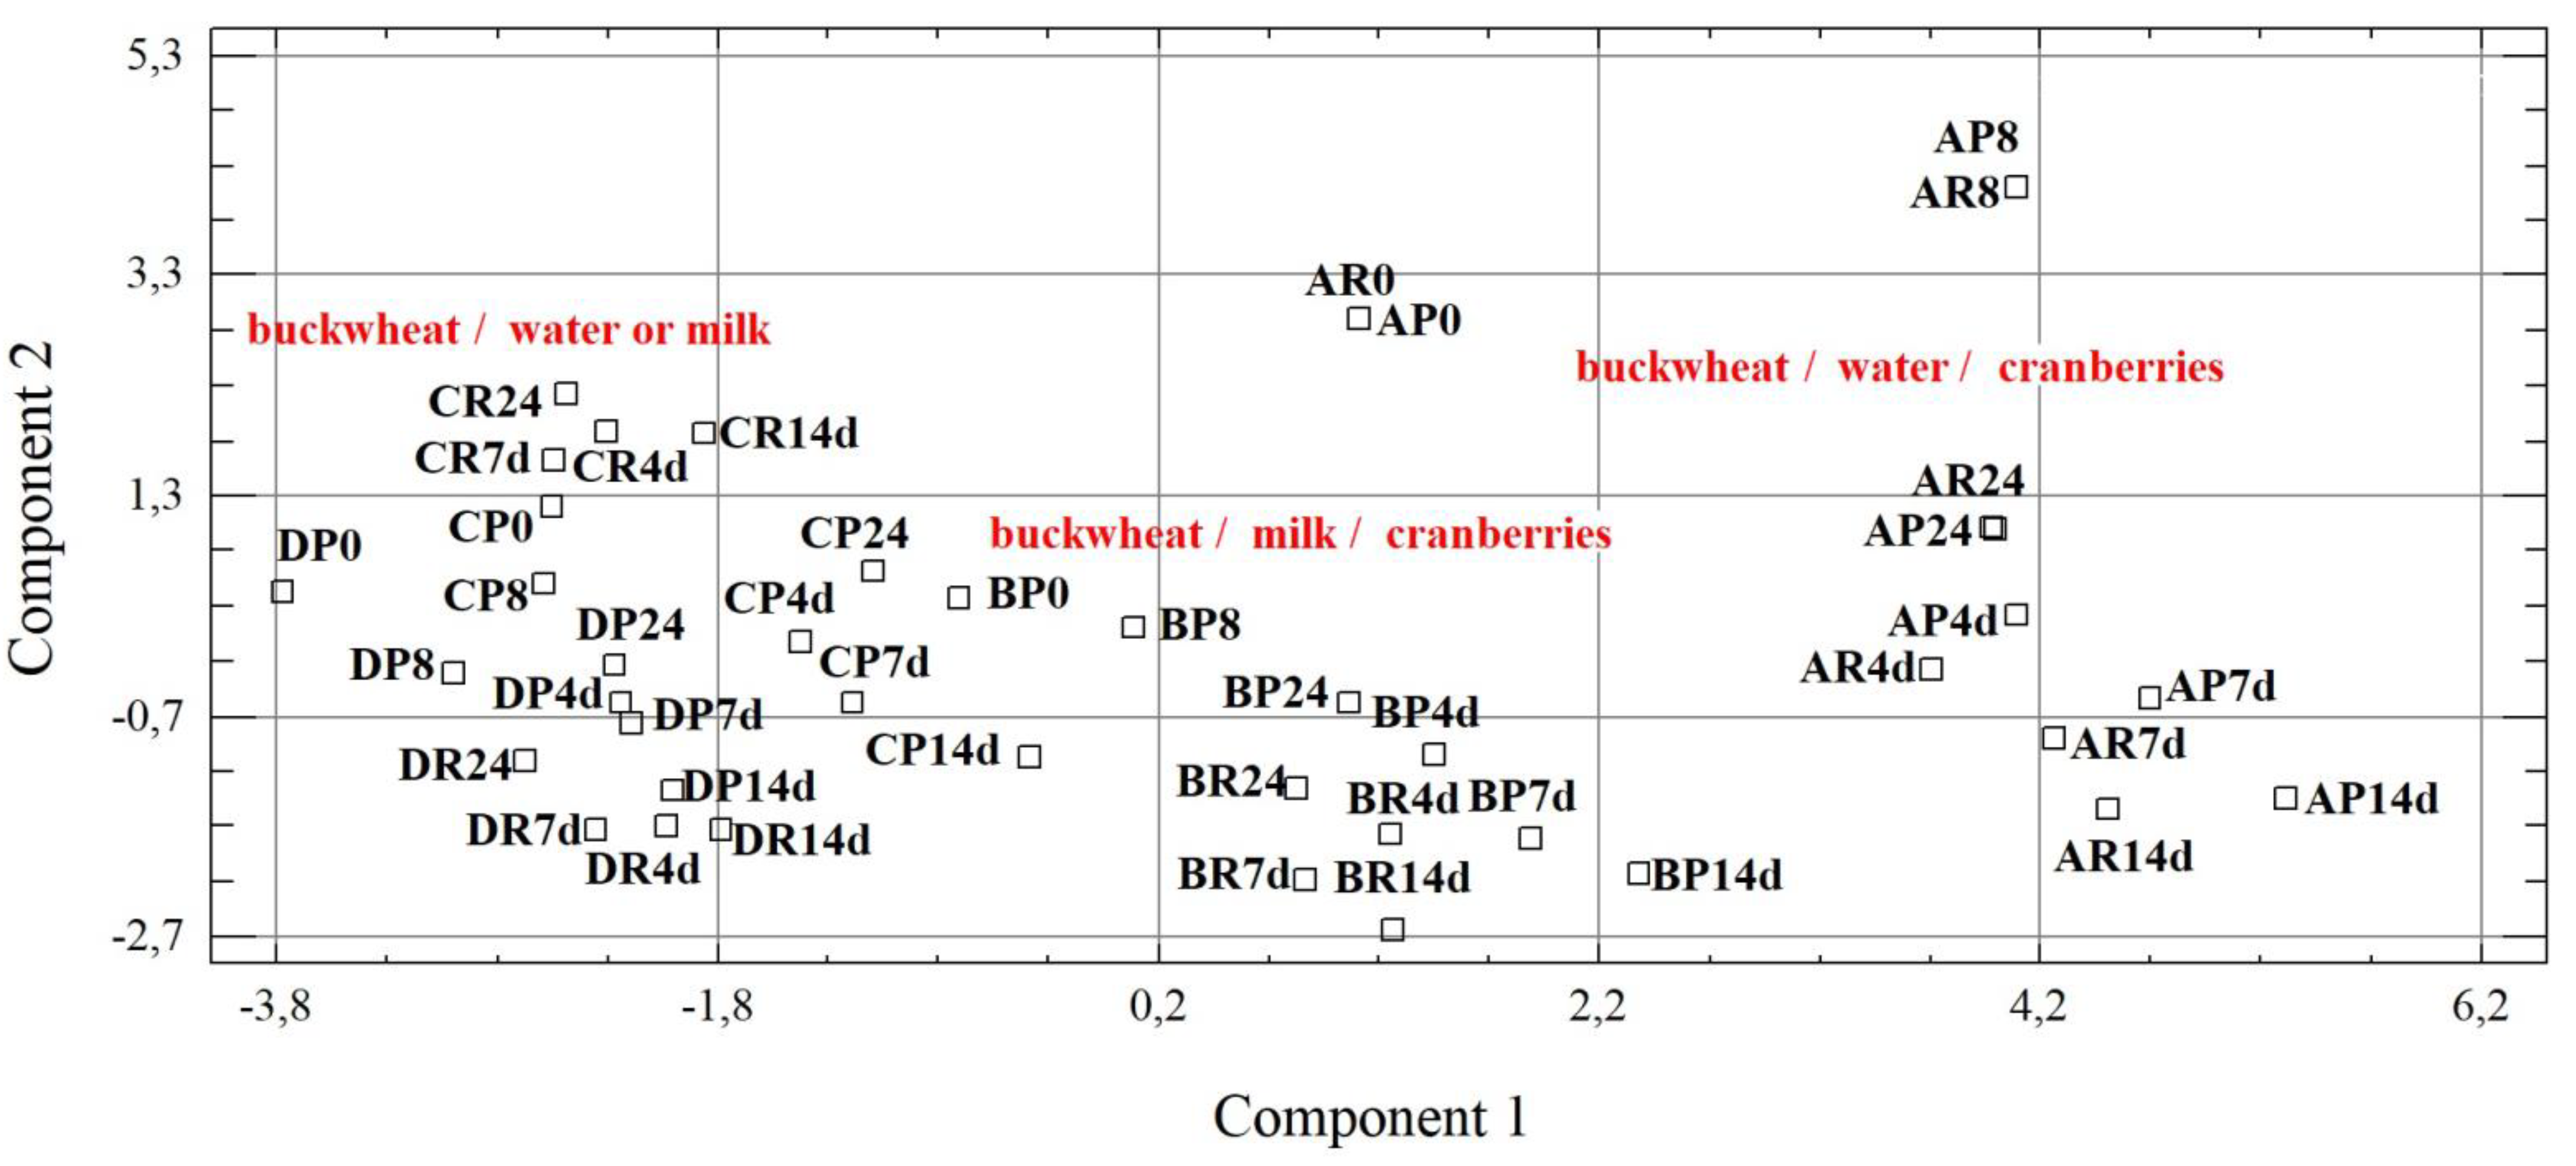
2.11. Statistical Analysis

Fermentation experiments and extractions were carried out in duplicate and remaining analyses were performed in triplicate. The results were reported as means ± standard deviation. Statistical analyses were carried out using Microsoft Excel 2013 (Microsoft, Redmond, WA, USA). Data were analyzed by Student’s t-test (microbial parameters, total phenolic compounds, total flavonoids, and antioxidant activity), one-way analysis of variance, and Fisher’s LSD procedure (individual phenolic compounds) at the p = 0.05 significance level. A Pearson correlation analysis was used for evaluating the strength of the correlations between the analyzed parameters. The results were also submitted to principal component analysis (PCA). This multivariate statistical method was used to display patterns of studied parameters in the reduced dimensions of 3 newly obtained coordinates (PC—principal components)—PC1, PC2 and PC3. The number of components was chosen on the basis of Kaiser’s criterion, also called the eigenvalue-one criterion. According to this criterion, any component with an eigenvalue greater than 1.00 is retained and interpreted [42]. Statistical analyses were conducted using Statgraphic Plus, Version 3.1 (Statsoft; Tulsa, OK, USA) software.

3. Results

3.1. Fermentation Process

In our study, eight plant-based mashes with probiotic potential were prepared using mixed Fresco DVS 1010 starter culture 5% (v/v). A short fermentation time (8 h) was preferable to minimize the risk of contamination. Fresco culture immediately entered the exponential phase of growth with specific growth rates of 0.66 and 0.87 1/h in water- and milk-based mash, respectively. The higher specific growth rate in milk-based mash can be explained by the higher content of nutrients in milk, which can serve as a substrate for the growth and metabolism for the cocci of the Fresco culture. In flavored mashes with added cranberries, specific growth rates were about 20% lower compared to unflavored samples. Nonetheless, the levels of the cocci of the Fresco in mashes with dried cranberries reached densities of 8–9 log CFU/mL after 8 h, representing 2–3 log unit increases compared to the initial state. This indicates an optimal fermentation condition for the growth of cocci and buckwheat media provided all of the desired nutrients. The metabolic activity of Fresco culture during the fermentation process resulted in a decrease in pH levels to 4.42 and 5.06 in water- and milk-based products, respectively (decrease of about 2.0 and 1.6 units). The calculated rate constants for the decrease in pH were −0.45 and −0.20 1/h in water and milk products, respectively. In cranberry-flavored mashes, acid production during fermentation was lower, representing a decrease of 1.03 and 1.25 units compared to the initial state, with the rates of −0.12 and −0.17 1/h in milk- and water-based products, respectively. Addition of cranberry powder to the flavored samples resulted in lower initial pH values of flavored samples (5.5 and 5.4 in water- and milk-based cranberry products). The different fermentation rates of pH decrease can be attributed to the differences in prepared buckwheat media; thus, their usefulness is best limited to relative comparisons within a specific substrate. Within the cold storage period, pH values reached after fermentation remained almost constant within the storage period, and after 14 days of cold storage, pH values in milk buckwheat mashes ranged from 4.31 to 4.99, and in water-based mashes from 4.01 to 4.33. To achieve health benefits, probiotic products are expected to support the growth and survival of probiotic strains with the minimum level of 6 log CFU/mL at the expiration date of the products [4]. Therefore, the cell counts of potentially probiotic isolate L. plantarum HM1 and probiotic strain L. rhamnosus GG were evaluated (Table 1). In general, bacterial counts in samples were well maintained above the limit of 6 log CFU/mL, with the exception of L. plantarum HM1 in water product with cranberries. This fact can be explained by the lower pH reached at the end of the cold storage period (pH 4.01). The antimicrobial effect of added cranberries may also be taken into account [43]. Despite the decline in levels of L. plantarum HM1 of about 3.2 log units within 14 days, the counts remained above the level of 5 log CFU/mL, the minimum level of probiotics suggested by some authors [44].

3.2. Total Phenolic Content

The contents of total phenolic compounds in evaluated mashes are presented in Table 2. During the whole fermentation process, the total quantity of phenolic compounds was higher in all tested samples in comparison to unfermented samples. Some differences in the course of changes in phenolic compounds were found in individual stages of fermentation. After fermentation with Fresco culture (8 h), increases were observed in phenolics of about 9.4% and 48.9% in mashes with cranberries, and of about 20.5% and 52.6% in unflavored mashes were observed. In subsequent stages, only moderate changes were achieved, which are probably due to storage at a lower temperature after 8 h (at 6 °C instead of 37 °C). The increasing trend of phenolic content was maintained until the end of storage in mashes to which L. plantarum HM1 was added. An exception was noted in the water-based cranberry product, where the decrease in phenols after 24 h and 4 days of storage period was seen, followed by a repeated increase in the next period. However, the final phenolic levels (0.737 mg GAE/g) did not exceed the level of fermentation at 8 h (0.887 mg GAE/g). A similar trend was also observed in the same matrices with L. rhamnosus GG. In remaining samples with L. rhamnosus GG, the effect of the fermentation process on phenolic content varied. The decrease and subsequent increase in total phenolics were noted after 24 h and 7 days in unflavored milk- and water-based mash, respectively. The quantity of phenols in milk-based cranberry mash increased during the whole experimental period. The initial values (in unfermented samples) of total phenolics ranged from 0.154 to 0.596 mg GAE/g and final products reached values in the range from 0.254 to 0.737 mg GAE/g, representing an increase of 1.2–2.3-fold. Water products contained higher amounts of phenols than milk products (about 31.6%, on average), as did products enriched with cranberries compared to unflavored products (about 70.7%, on average). Mashes with L. plantarum HM1 reached a significantly higher (p < 0.05) total phenolic content (after 14 days) than mashes with L. rhamnosus GG.

3.3. Total Flavonoid Content

Similar to total phenolic content results, in fermented samples, total flavonoid content was higher compared to unfermented samples (Table 3).
The most remarkable increment in total flavonoids was observed after 8 h of fermentation (about 7.8–40.4% compared to initial values). Water-based cranberry mashes reached the flavonoid maximum after 8 h, whereas other mashes reached the maximum at the end of fermentation (14 days). At the end of the storage period, final values were higher by about 13.4–19.1% and 24.2–37.7% for products with cranberry and unflavored products, respectively. Incorporation of lyophilized cranberry powder into natural buckwheat samples promoted increases of 129.2% and 145.2% in total flavonoids determined in water and milk products (calculated at the 14th day), respectively. Water products contained about 30.1% higher flavonoid levels than milk products.

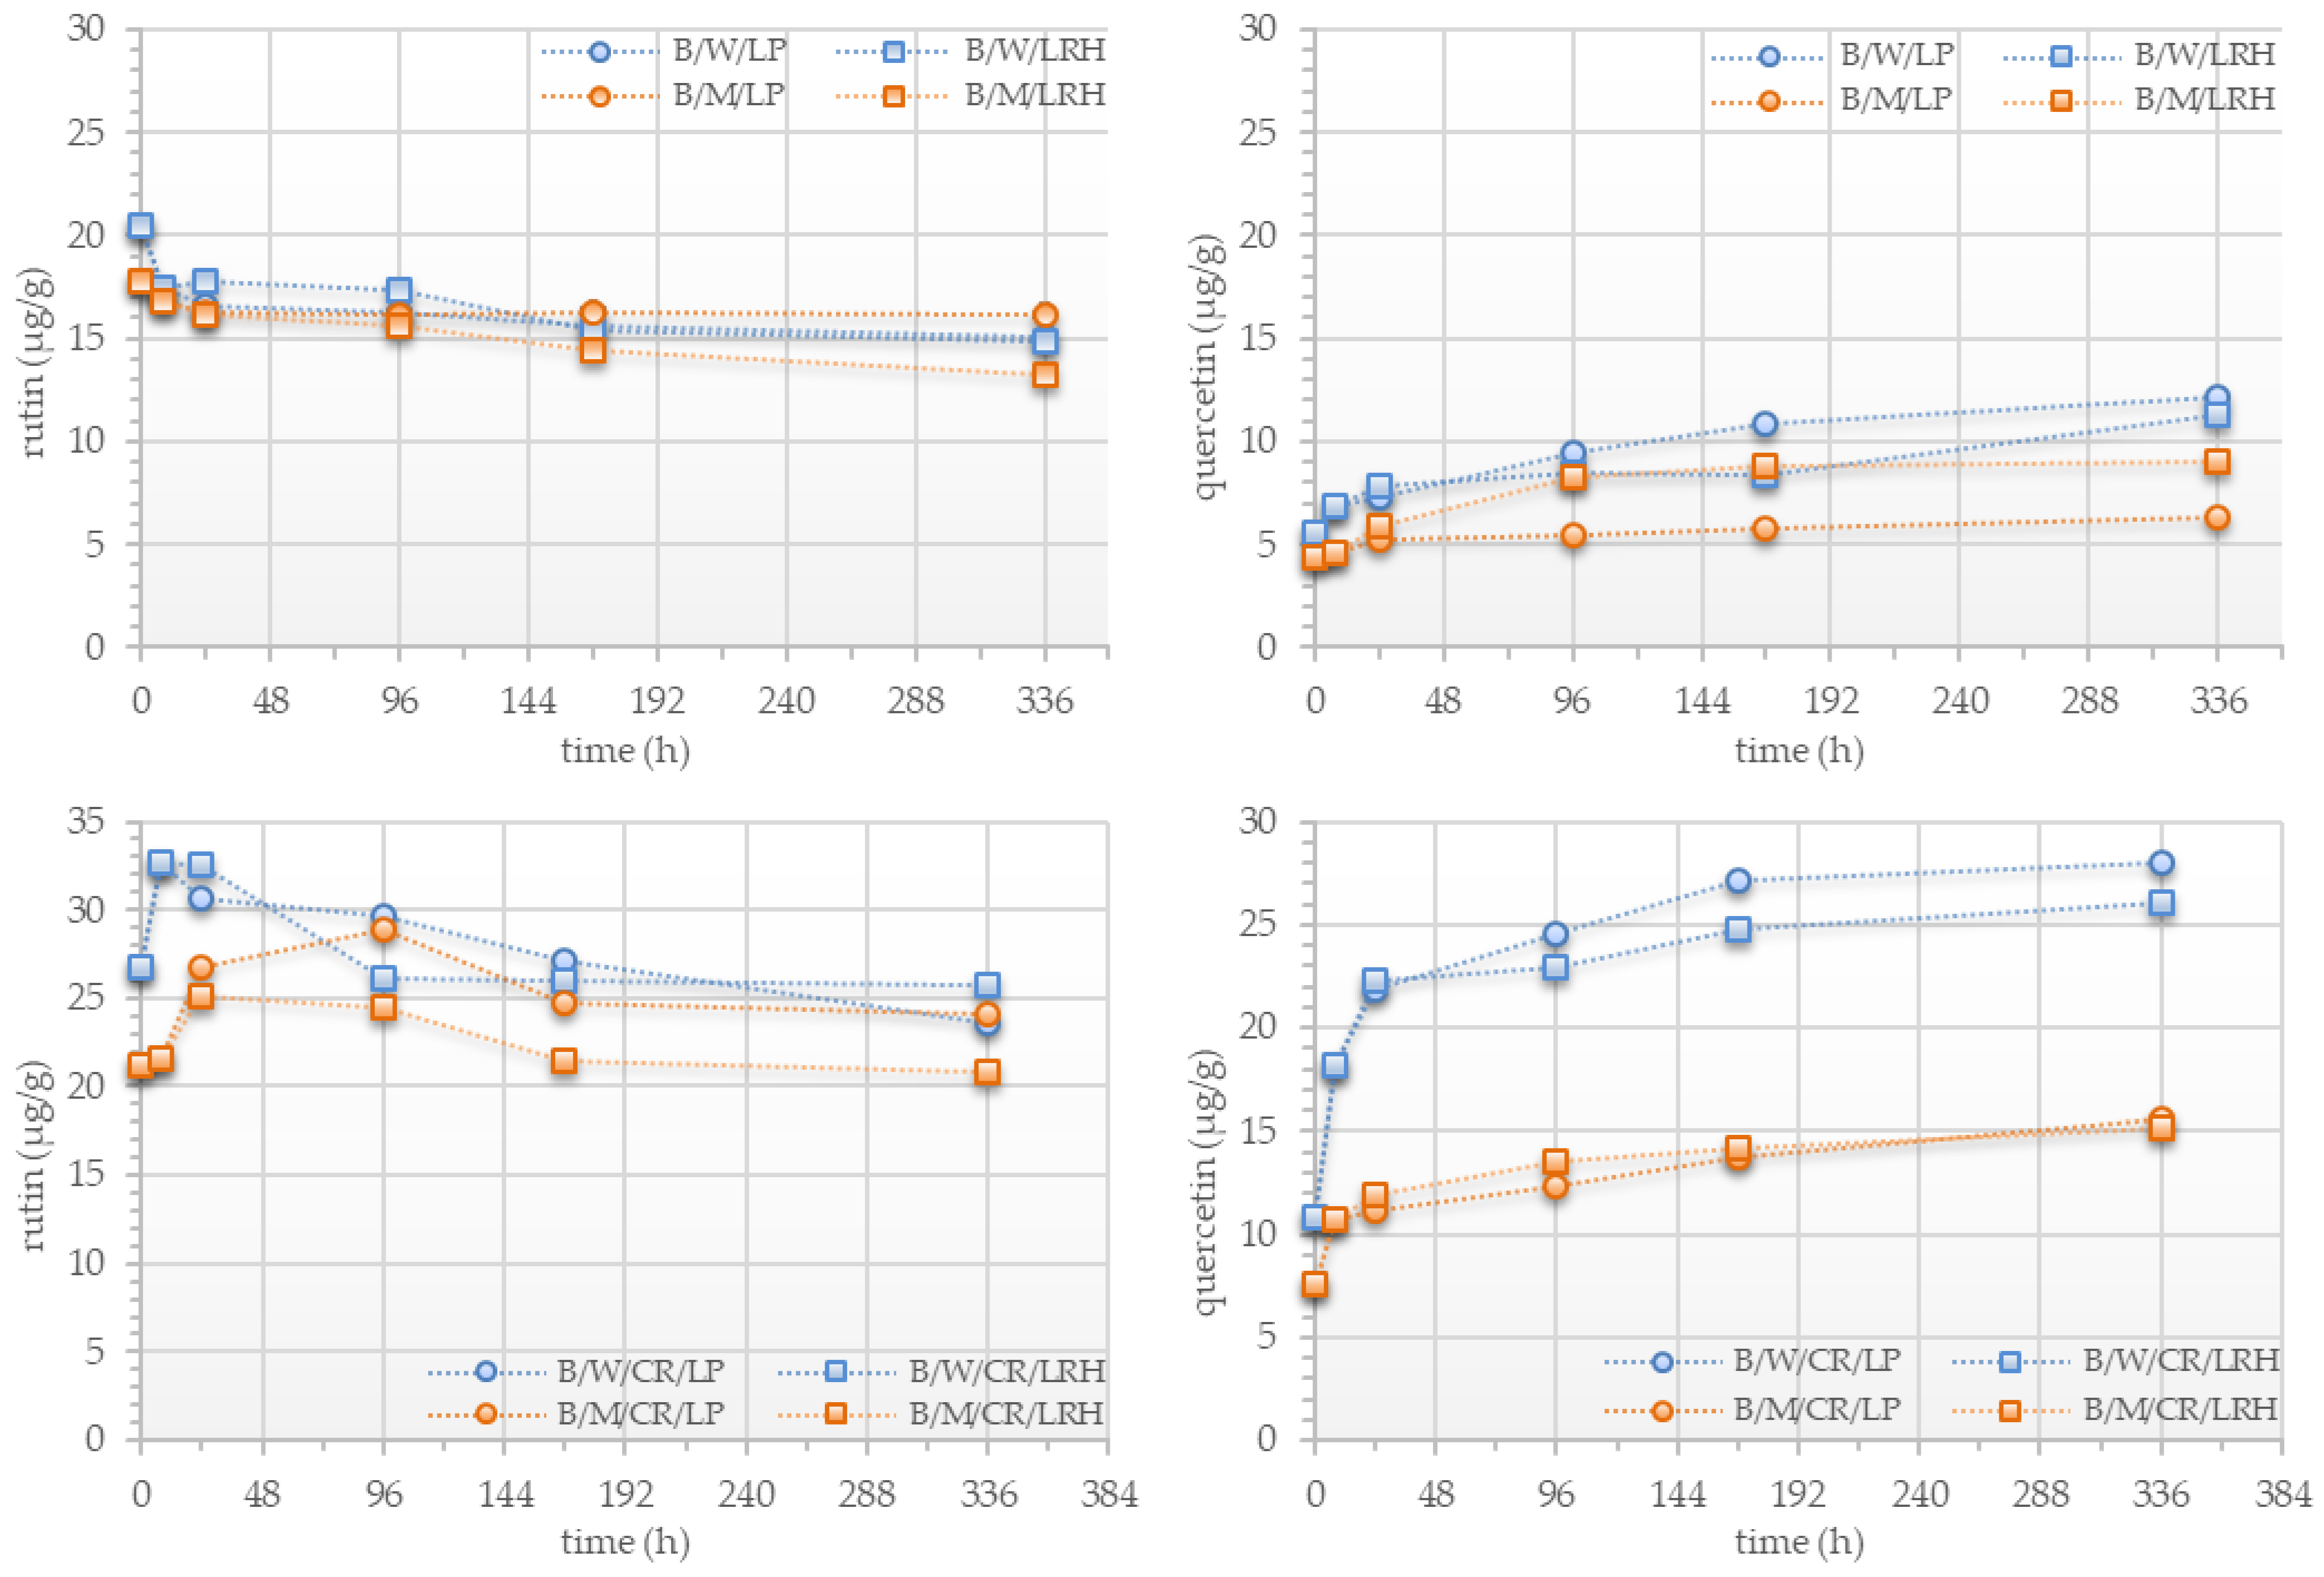
3.4. Phenolic Compounds Profile

The results from the identification and quantification of phenolic compounds are presented in Table 4 and Figure 1. Seven phenolic acids (gallic, protocatechuic, vanillic, syringic, caffeic, p-coumaric, and ferulic) and two flavonoids (rutin and quercetin) were detected from the unfermented and fermented samples. The content and proportions of each compound were dependent on the experimental period. Rutin and p-coumaric acids were the dominant phenolics in unfermented samples, accounting for 21.1% and 19.7%, on average, respectively, and their proportion to total phenolic content (quantified by HPLC analysis) decreased after 14 days of fermentation. In contrast, the contents of gallic and protocatechuic acids, and quercetin, were, in all samples, higher at the end of fermentation by 34.3–134.9%, 8.0–105.0%, and 46.2–160.2%, respectively. Significant increases (p < 0.05) were also observed with vanillic and caffeic acids (28.1% and 32.5%, on average) in all mashes, with the exception of unflavored water mash with L. rhamnosus GG. This mash also achieved the opposite final results in ferulic, p-coumaric, and syringic acid contents compared with remaining mashes.

3.5. Antioxidant Activity

As shown in Table 5, the fermentation process resulted in a positive effect on antioxidant activity. After fermentation with Fresco culture (8 h), the antioxidant activity was higher by about 7.9% and 11.8% in unflavored samples, and by about 13.2% and 20.2% in samples with cranberries (p < 0.05).
In unflavored milk mashes, the most significant changes occurred after 24 h; antioxidant activity values reached 0.667 and 0.484 mg DPPH/g in samples with L. plantarum HM1 and L. rhamnosus GG from the initial 0.315 mg DPPH/g, representing increases of 89.2% and 37.4%, respectively. In mashes fermented with L. plantarum, antioxidant activity increased throughout the experimental period, except for 4th day of experiment, when the antioxidant activity in mashes with cranberries decreased, or did not show a significant difference (p > 0.05) in unflavored mashes. Mashes with L. rhamnosus GG did not show a significant decline (p > 0.05) in milk-based cranberry mash, and a decrease after 4 days and subsequent increase were observed in unflavored mashes. In the water-based cranberry sample, antioxidant activity was already reduced after 24 h. At the end of the 14 day experimental period, antioxidant activities were 1.1–2.5 times higher compared to the initial values (0 h). Several studies have also reported an increase in antioxidant activity during buckwheat fermentation [45,46,47]. Similar to phenolic content results, water products showed better antioxidant activities than milk products (about 16.1%, on average), and cranberry flavored products than unflavored products (about 84.3%, on average). Mashes with L. plantarum HM1 scavenged a significantly higher (p < 0.05) quantity of DPPH free radicals (after 14 days) than mashes with L. rhamnosus GG.

4. Discussion

To date, numerous scientific studies have focused on the development and preparation of new types of fermented products with probiotic and functional properties [48,49]. Fermentation is a complex system consisting of many partial processes, the continuity, relationship, and interaction of which are diverse. During fermentation, degradation of individual components, structural changes, and formation of new compounds take place. The character and degree of changes are affected by various factors, including microbial strains, substrate composition, and fermentation conditions. The various profiles of enzymes secreted by microbes during fermentation may affect the content and composition of phenolic compounds. Microbial enzymes have the ability to release phenolics from bound forms and to enhance free phenolic content. For example, protease, cellulase, and amylase can hydrolyze the structural components, and facilitate the action of esterase and xylanase, causing the release of insoluble-bound phenolics from their covalent bonds in the cell wall [29,45,50]. Glucosidases are able to release phenolic compounds from their soluble conjugated forms, and are often conjugated to sugars as glycosides [51]. Additionally, lactic acid produced by the present microbiota can help release bound phenols to their free forms. Moreover, stability of phenolic compounds is pH dependent, where the structure of phenolics is a determining factor. Anthocyanins and catechins are stable at low pH, but the amount of ferulic acid decreases, and proanthocyanidins may be degraded into flavanols [50,52,53]. It should be noted that pH influences the degradation of microbial enzymes. Considering the health benefits of buckwheat, in this study, fermented buckwheat mashes with probiotic potential were prepared. The application of mixed or combined cultures in fermentation technologies causes accelerated and efficient organic acid production within a short fermentation period. Food industries also prefer short fermentation periods in order to reduce microbial contamination and increase plant output. Thus, in our study, cocci of the Fresco DVS 1010 mixed culture were used for lactic acid fermentation within 8 h. Salmerón et al. [54] also preferred a shorter fermentation time (10 h, 37 °C) in non-dairy cereal beverages fermented with L. plantarum. Pelikánová et al. [55] similarly proved the adequacy of an 8 h fermentation time during lactic acid fermentation of buckwheat products. Within 8 h of fermentation, Fresco culture showed good growth in all our experiments, resulting in a decrease in pH from 4.2 to 4.4, with the exception of the milk-based mash (5.06). In our previous study, the pH values reached after the fermentation with Fresco culture in buckwheat mashes were below 4.5, with the exceptions of milk and milk chocolate mash [56]. A pH range of approximately 3.5 to 4.5 in the final product may help buffer the pH increase in the gastrointestinal tract, thus enhancing the stability and beneficial features of consumed probiotic strains [57]. The viability of probiotic bacteria is an important criterion for the use of probiotics in functional foods, because they should survive with minimal densities of 6 log CFU/mL at the end of the shelf life. In our study, the functionality of buckwheat mashes was proven with high viable bacterial lactobacilli counts (6.0–7.7 log CFU/mL) at the end of the storage period. An exception was observed in water-based mash, where the density of L. plantarum HM1 at the end of 14 days was 5.8 log CFU/mL. Gueimonde et al. [44] evaluated densities of lactobacilli in 10 commercial fermented drinks. During 30 days of cold storage, a slow decrease in counts was noted (0.8–1.9 log orders); nonetheless, the population of microorganisms remained above 5 log CFU/mL, the minimum level suggested by some authors.
Our study confirmed a positive effect of lactic acid bacteria fermentation on both phenolic compound contents and antioxidant activity. It can be supposed that the mentioned mechanisms were applied to the fermentation process. The phenolics in buckwheat and cranberry are mainly in the form of soluble free compounds and soluble conjugates [14,15,28]. Lactic acid bacteria, through the acidification and hydrolysis of glycosylated forms, enhanced the total phenol and flavonoid content. The observed higher levels of measured parameters of water-based products in comparison to milk-based products are probably related to the complex formation between phenolics and milk components (proteins, lipids, and peptides), which makes them less able to be assayed. Milk protein–phenolic interactions increase with an increasing number of hydroxyl groups in phenolic compounds [58]. On day 4 of fermentation, the decrease in phenolic content and antioxidant activity in several mashes was noticed, and may be attributed to changes in enzyme activities during fermentation. Saharan et al. [59] measured amylase, xylanase, and β-glucosidase activities during cereal fermentation with Aspergillus oryzae, and the maximum enzyme activities recorded on the 5th day of incubation. Similarly, the authors observed a linear correlation between enzyme activities and total phenolics and flavonoids.
Further metabolic pathways recognized in lactic acid bacteria involve decarboxylation and/or reduction. Lactobacilli can produce phenolic acid reductase, feruoylesterase, and phenolic acid decarboxylase [50,60]. Caffeic, ferulic, and p-coumaric acids are decarboxylated into corresponding vinyl derivatives, which can be subsequently reduced to corresponding ethyl derivatives. Phenolic acid reductase reduces phenolic acids to hydroxyphenylpropionic acids (e.g., dihydrocaffeic and dihydroferulic acid) [51,60,61,62]. Our results confirmed the loss of ferulic and p-coumaric acids during fermentation. No significant changes (p > 0.05) or degradation of caffeic acid were only recorded in unflavored samples with L. rhamnosus GG. The increase in the caffeic acid level in the remaining samples can be attributed to the hydrolysis of chlorogenic acid into their two constituents—caffeic and quinic acids [60]. These conclusions indicate that phenolic metabolism is specific to the substrate, substrate concentration, and microbial strain [60]. Buckwheat is an important source of rutin and catechin. We observed declining rutin content (about 1.7–27.2%) during fermentation in contrast to an increasing amount of quercetin (about 46.2–160.2%). Our findings are in agreement with the study of Lukšič et al. [63], where the authors noted the conversion of rutin into quercetin. Rutin (quercetin-3-O-rhamnoglucoside) can be hydrolyzed by α-rhamnosidase to quercetin-3-glucoside, and further converted by β-glucosidase to free quercetin, and eventually directly into quercetin by hesperidinase. Moreover, production of further compounds such as kaempferol-3-rutinoside, kaempferol-3-glucoside, and free kaempferol, in addition to protocatechuic and 4-hydroxybenzoic acids, was reported [51]. Percentage increments of quercetin in our samples suggest its additional formation pathway, e.g., degradation of quercetin glycosides such as quercitrin (quercetin-3-rhamnoside), isoquercitrin (quercetin-3-β-D-glucoside), and hyperoside (quercetin-3-D-galactoside) contained in buckwheat [12,64], or hyperoside (predominant), avicularin (quercetin-3-arabinoside), quercitrin, isoquercitrin, quercetin 3-xyloside, quercetin-3-O-(6″-p-coumaroyl)-β-galactoside, and quercetin-3-O-(6″-benzoyl)-β-galactoside identified in cranberries [26,65].
Similar to buckwheat, cranberries are an abundant source of flavanols, which occur as monomers, oligomers, and polymers. The fermentation process induces depolymerization, and production of free catechins, catechin esters, and gallic acid [51]. The increase in gallic acid (about 34.3–134.9%) observed in our experiment is in accordance with the above-mentioned results.
Anthocyanin glucoside metabolism comprises deglycosylation into corresponding aglycones followed by feasible ring fission. Thus, the predominant anthocyanidins in cranberry—cyanidin, malvidin, delphinidin, and peonidin—can be converted into protocatechuic, syringic, gallic, and vanillic acid, respectively [28,51]. This can be considered to be one of the mechanisms leading to the increase in protocatechuic, gallic, and vanillic acids in our fermented products. The published literature also reported condensation reactions between flavanols and anthocyanins to form an anthocyanin–flavanol complex [15]. Transformation of vanillic acid into protocatechuic acid and vanillyl alcohol, and of syringic acid into syringaldehyde and syringol, was described [51].
Correlation analysis was undertaken for the evaluation of the linear association between the analyzed parameters. As concluded from Table S1 (see Supplementary Materials), positive strong correlations were observed between total phenolic content, total flavonoid content, rutin content, and antioxidant activity of the studied mashes (r = 0.819–0.957). Moreover, positive strong correlations were also found between total phenolic and flavonoid content, gallic acid, rutin, and quercetin content (r = 0.810–0.969), caffeic acid and quercetin content (r = 0.929), gallic acid and caffeic acid (r = 0.896), gallic acid and quercetin (r = 0.948), and quercetin, rutin, and total flavonoid content (r = 0.841, r = 0.915). The results of the PCA showed that the three principal components (PC), which accounted together for 90.8% of the total variation (Figure 2), were extracted.
PC1 explained 60.9% of the total variation of the studied data and was related to variables flavonoid content, phenolic content, phenolic and flavonoid compounds, and antioxidant activity. PC2 and PC3 explained 20.9% and 9.1% of the total variation, respectively, and mainly reflected the contribution of the variables p-coumaric and syringic acids (PC2) and protocatechuic (Figure 3).
The visualization score plot of samples in the coordinates of PC1 and PC2 with the distribution of samples on the plane of principal components is presented in Figure 4.
PCA divided the samples into three groups according to the applied raw materials for recipe formulation: unflavored water- or milk-based mashes (samples CP0-CP14d, CR0-CR14d, DP0-DP14d, and DR0-DR14d) characterized by the lowest content of total phenolics and total flavonoids and antioxidant activity; milk-based cranberry mashes (BP0-BP14d and BR0-BR14d) characterized by the lowest content of p-coumaric acid; and water-based cranberry mashes (AP0-AP14d and AR0-AR14d) characterized by the highest content of total phenolics and total flavonoids. In addition, PCA also differentiated groups of mashes with or without the addition of cranberries (Figure 4). By comparison, PCA did not separate the mashes based on the added lactic acid bacteria.

5. Conclusions

The popularity of functional products fermented with probiotics continues to increase because consumers desire flavorful food products with beneficial effects to their health. Thus, in our study, the potential of buckwheat flour for production of lactic acid-fermented mashes was tested. It was shown that the fermentation process (8 h) significantly increased cocci of the Fresco culture in the products. In milk-based mash, the calculated specific growth rates were about 24% higher compared to water-based mashes, due to the nutrients present in milk. Within the cold storage period (6 °C, 14 days), we tested the survival of the officially recognized strain L. rhamnosus GG and novel isolate L. plantarum HM1. At the end of the cold storage period, statistically significant changes in counts of lactobacilli were noted (p < 0.05). Nonetheless, the population of lactobacilli added after the 8 h fermentation process did not drop below the limit of 6 log CFU/mL, with the exception of L. plantarum HM1 in water-based mash to which cranberries were added. The applied microbial strains showed the ability to metabolize present nutritive and other bioactive compounds. Supplementation of buckwheat mashes with cranberries led to increases in total phenols (of about 70.7%, on average), total flavonoids (of about 136.2%, on average), and antioxidant activities (of about 84.3%, on average) in comparison with buckwheat mashes without cranberries. Water-based mashes contained higher quantities of phenols (by about 31.6%, on average) and flavonoids (by about 30.1%, on average), and showed better antioxidant activities (by about 16.1%, on average) than milk-based mashes. Prepared buckwheat-fermented products had enhanced bioactive phenolic compound contents with better antioxidant properties. Furthermore, changes in the examined compounds induced by fermentation may improve their digestibility and bioavailability, which can have beneficial effects in promoting health.

Supplementary Materials

The following are available online at https://www.mdpi.com/article/10.3390/app11199241/s1, Table S1: Pearson correlation coefficients for parameters studied.

Author Contributions

Conceptualization, writing—original draft preparation and review; A.M., Z.M., Z.K., S.M. and Ľ.V.; experiments: A.M., Z.M. and E.H.; data analysis: A.M., Z.M., Z.K. and Ľ.V. All authors have read and agreed to the published version of the manuscript.

Funding

This publication was supported by the Scientific Grant Agency of the Ministry of Education, Science, Research and Sport of the Slovak Republic and Slovak Academy of Sciences, grant number VEGA 1/0363/19 and by the Operational Program Integrated Infrastructure within the project: Drive4SIFood 313011V336, cofinanced by the European Regional Development Fund.

Institutional Review Board Statement

Not applicable.

Informed Consent Statement

Not applicable.

Data Availability Statement

Supporting data are available in the Supplementary Materials.

Conflicts of Interest

The authors declare no conflict of interest.

References

  1. Kwaw, E.; Ma, Y.; Tchabo, W.; Apaliya, M.T.; Wu, M.; Sackey, A.S.; Xiao, L.; Tahir, H.E. Effect of lactobacillus strains on phenolic profile, color attributes and antioxidant activities of lactic-acid-fermented mulberry juice. Food Chem. 2018, 250, 148–154. [Google Scholar] [CrossRef]
  2. Kaprasob, R.; Kerdchoechuen, O.; Laohakunjit, N.; Sarkar, D.; Shetty, K. Fermentation-based biotransformation of bioactive phenolics and volatile compounds from cashew apple juice by select lactic acid bacteria. Process Biochem. 2017, 59, 141–149. [Google Scholar] [CrossRef]
  3. Coda, R.; Rizzello, C.G.; Trani, A.; Gobbetti, M. Manufacture and characterization of functional emmer beverages fermented by selected lactic acid bacteria. Food Microbiol. 2011, 28, 526–536. [Google Scholar] [CrossRef]
  4. Liptáková, D.; Matejčeková, Z.; Valík, Ľ. Lactic acid bacteria and fermentation of cereals and pseudocereals, fermentation processes. In Fermentation Processes; Jozala, A.F., Ed.; InTech: Rijeka, Croatia, 2017; Volume 3, pp. 223–254. [Google Scholar] [CrossRef] [Green Version]
  5. Hill, C.; Guarner, F.; Reid, G.; Gibson, G.R.; Merenstein, D.J.; Pot, B.; Morelli, L.; Canani, R.B.; Flint, H.J.; Salminen, S.; et al. The international scientific association for probiotics and prebiotics consensus statement on the scope and appropriate use of the term probiotic. Nat. Rev. Gastroenterol. Hepatol. 2014, 11, 506–514. [Google Scholar] [CrossRef] [PubMed] [Green Version]
  6. Charalampopoulos, D.; Wang, R.; Pandiella, S.S.; Webb, C. Application of cereals and cereal components in functional foods: A review. Int. J. Food Microbiol. 2002, 79, 131–141. [Google Scholar] [CrossRef]
  7. Ghamry, M.; Li, L.; Zhao, W. A metabolomics comparison of Lactobacillus communities isolated from breast milk and camel milk and Lactobacillus apis isolated from bee gut during cereals-based fermentation vs. Lactobacillus plantarum as a reference. LWT-Food Sci. Technol. 2021, 146, 111400. [Google Scholar] [CrossRef]
  8. Kohajdová, Z.; Karovičová, J. Fermentation of cereals for specific purpose. J. Food Nutr. Res. 2007, 46, 51–57. [Google Scholar]
  9. Mikulajová, A.; Šedivá, D.; Hybenová, E.; Mošovská, S. Buckwheat cultivars—Phenolic compounds profiles and antioxidant properties. Acta Chim. Slov. 2016, 9, 124–129. [Google Scholar] [CrossRef] [Green Version]
  10. Kiprovski, B.; Mikulic-Petkovsek, M.; Slatnar, A.; Veberic, R.; Stampar, F.; Malencic, D.; Latkovic, D. Comparison of phenolic profiles and antioxidant properties of European Fagopyrum esculentum cultivars. Food Chem. 2015, 185, 41–47. [Google Scholar] [CrossRef]
  11. Sytar, O.; Brestic, M.; Zivcak, M.; Tran, L.S. The contribution of buckwheat genetic resources to health and dietary diversity. Curr. Genom. 2016, 17, 193–206. [Google Scholar] [CrossRef] [PubMed] [Green Version]
  12. Kalinová, J.P.; Vrchotová, N.; Tříska, J. Phenolics levels in different parts of common buckwheat (Fagopyrum esculentum) achenes. J. Cer. Sci. 2019, 85, 243–248. [Google Scholar] [CrossRef]
  13. Vollmannová, A.; Musilová, J.; Lidiková, J.; Árvay, J.; Šnirc, M.; Tóth, T.; Bojňanská, T.; Čičová, I.; Kreft, I.; Germ, M. Concentrations of phenolic acids are differently genetically determined in leaves, flowers, and grain of common buckwheat (Fagopyrum esculentum Moench). Plants 2021, 10, 1142. [Google Scholar] [CrossRef]
  14. Inglett, G.E.; Chen, D.; Berhow, M.; Lee, S. Antioxidant activity of commercial buckwheat flours and their free and bound phenolic compositions. Food Chem. 2011, 125, 923–929. [Google Scholar] [CrossRef]
  15. Li, F.-H.; Yuan, Y.; Yang, X.-I.; Tao, S.-Y.; Ming, J. Phenolic profiles and antioxidant activity of buckwheat (Fagopyrum esculentum Möench and Fagopyrum tartaricum L. Gaerth) hulls, brans and flours. J. Integr. Agric. 2013, 12, 1684–1693. [Google Scholar] [CrossRef] [Green Version]
  16. Ahmed, A.; Khalid, N.; Ahmad, A.; Abbasi, N.A.; Latif, M.S.Z.; Randhawa, M.A. Phytochemicals and biofunctional properties of buckwheat: A review. J. Agric. Sci. 2014, 152, 349–369. [Google Scholar] [CrossRef]
  17. Rodríguez, J.P.; Rahman, H.; Thushar, S.; Singh, R.K. Healthy and resilient cereals and pseudo-cereals for marginal agriculture: Molecular advances for improving nutrient bioavailability. Front. Genet. 2020, 11, 49. [Google Scholar] [CrossRef] [Green Version]
  18. Moore, M.M.; Schober, T.J.; Dockery, P.; Arendt, E.K. Textural comparisons of gluten-free and wheat-based doughs, batters, and breads. Cereal Chem. 2004, 81, 567–575. [Google Scholar] [CrossRef]
  19. Feng, L.; Xie, Y.; Peng, C.; Liu, Y.; Wang, H. A novel antidiabetic food produced via solid-state fermentation of tartary buckwheat by L. plantarum TK9 and L. paracasei TK1501. Food Technol. Biotechnol. 2018, 56, 373–380. [Google Scholar] [CrossRef] [PubMed]
  20. Zieliński, H.; Ciesarová, Z.; Kukurová, K.; Zielinska, D.; Szawara-Nowak, D.; Starowicz, M.; Wronkowska, M. Effect of fermented and unfermented buckwheat flour on functional properties of gluten-free muffins. J. Food Sci. Technol. 2017, 54, 1425–1432. [Google Scholar] [CrossRef] [PubMed]
  21. Coman, M.M.; Verdenelli, M.C.; Cecchini, C.; Silvi, S.; Vasile, A.; Bahrim, G.E.; Orpianesi, C.; Cresci, A. Effect of buckwheat flour and oat bran on growth and cell viability of the probiotic strains Lactobacillus rhamnosus IMC 501®, Lactobacillus paracasei IMC 502® and their combination SYNBIO®, in synbiotic fermented milk. Int. J. Food Microbiol. 2013, 167, 261–268. [Google Scholar] [CrossRef]
  22. Kocková, M.; Valík, Ľ. Development of new cereal-, pseudocereal-, and cereal-leguminous-based probiotic foods. Czech J. Food Sci. 2014, 32, 391–397. [Google Scholar] [CrossRef]
  23. Liptáková, D.; Petruláková, M.; Pelikánová, J.; Valík, Ľ.; Krištúfková, K. Rast a prežívanie probiotickych laktobacilov v lisovanom pohánkovom produkte. Chem. Listy 2016, 110, 149–152. [Google Scholar]
  24. Moroni, A.V.; Arendt, E.K.; Bello, F.D. Biodiversity of lactic acid bacteria and yeast in spontaneously-fermented buckweath and teff sourdoughs. Food Microbiol. 2011, 28, 497–502. [Google Scholar] [CrossRef] [PubMed]
  25. Peron, G.; Sut, S.; Pellizzaro, A.; Brun, P.; Voinovich, D.; Castagliuolo, I.; Dall’Acqua, S. The antiadhesive activity of cranberry phytocomplex studied by metabolomics: Intestinal PAC-A metabolites but not intact PAC-A are identified as markers in active urines against uropathogenic Escherichia coli. Fitoterapia 2017, 122, 67–75. [Google Scholar] [CrossRef] [PubMed]
  26. Blumberg, J.B.; Camesano, T.A.; Cassidy, A.; Kris-Etherton, P.; Howell, A.; Manach, C.; Ostertag, L.M.; Sies, H.; Skulas-Ray, A.; Vita, J.A. Cranberries and their bioactive constituents in human health. Adv. Nutr. 2013, 4, 618–632. [Google Scholar] [CrossRef] [PubMed] [Green Version]
  27. Može, S.; Polak, T.; Gasperlin, L.; Koron, D.; Vanzo, A.; Poklar Ulrih, N.; Abram, V. Phenolics in Slovenian bilberries (Vaccinium myrtillus L.) and blueberries (Vaccinium corymbosum L.). J. Agric. Food Chem. 2011, 59, 6998–7004. [Google Scholar] [CrossRef] [PubMed]
  28. Ancillotti, C.; Ciofi, L.; Pucci, D.; Sagona, E.; Giordani, E.; Biricolti, S.; Gori, M.; Petrucci, W.A.; Giardi, F.; Bartoletti, R.; et al. Polyphenolic profiles and antioxidant and antiradical activity of Italian berries from Vaccinium myrtillus L. and Vaccinium uliginosum L. subsp. gaultherioides (Bigelow) S.B. Young. Food Chem. 2016, 204, 176–184. [Google Scholar] [CrossRef] [PubMed]
  29. Khan, S.A.; Zhang, M.; Liu, L.; Dong, L.; Ma, Y.; Wei, Z.; Chi, J.; Zhang, R. Co-culture submerged fermentation by lactobacillus and yeast more effectively improved the profiles and bioaccessibility of phenolics in extruded brown rice than single-culture fermentation. Food Chem. 2020, 326, 126985. [Google Scholar] [CrossRef]
  30. Chen, G.; Chen, B.; Song, D. Co-microbiological regulation of phenolic release through solid-state fermentation of corn kernels (Zea mays L.) to improve their antioxidant activity. LWT-Food Sci. Technol. 2021, 142, 111003. [Google Scholar] [CrossRef]
  31. Ravisankar, S.; Dizlek, H.; Awika, J.M. Changes in extractable phenolic profile during natural fermentation of wheat, sorghum and teff. Food Res. Int. 2021, 145, 110426. [Google Scholar] [CrossRef]
  32. Santetti, G.S.; Dacoreggio, M.V.; Inácio, H.P.; Biduski, B.; Hoff, R.B.; Fritzen Freire, C.B.; Gutkoski, L.C.; Amboni, R.D.M.C. The addition of yerba mate leaves on bread dough has influences on fermentation time and the availability of phenolic compounds? LWT-Food Sci. Technol. 2021, 146, 111442. [Google Scholar] [CrossRef]
  33. Liptáková, D.; Koreňová, J.; Hornická, M.; Valík, Ľ. Mikrobiologická analýza materského mlieka. Lek. Obz. 2016, 65, 227–231. (In Slovak) [Google Scholar]
  34. Matejčeková, Z.; Mikulajová, A.; Vlková, E.; Liptáková, D.; Moškovská, S.; Hybenová, E.; Valík, Ľ. Design of bacterial cultures in fermented functional maize product formulation. Pol. J. Food Nutr. Sci. 2019, 69, 417–426. [Google Scholar] [CrossRef]
  35. EN ISO 15214. Microbiology of Food and Animal Feeding Stuffs. In Horizontal Method for the Enumeration of Mesophilic Lactic Acid Bacteria. Colony-Count Technique at 30 °C; International Organization of Standardization (ISO): Geneva, Switzerland, 2002; pp. 1–12. [Google Scholar]
  36. Baranyi, J.; Roberts, A.T. Mathematics of predictive food microbiology. Int. J. Food Microbiol. 1995, 26, 199–218. [Google Scholar] [CrossRef] [Green Version]
  37. Mikulajová, A.; Takácsová, M.; Alexy, P.; Brindzová, L. Optimalization of extraction of phenolic compounds from buckwheat on the basis of results of experimental design method. Chem. Listy 2007, 101, 563–568. [Google Scholar]
  38. Yu, L.; Haley, S.; Perret, J.; Harris, M.; Wilson, J.; Qian, M. Free radical scavenging properties of wheat extracts. J. Agric. Food Chem. 2002, 50, 1619–1624. [Google Scholar] [CrossRef]
  39. Mikulajová, A.; Takácsová, M.; Rapta, P.; Brindzová, L.; Zalibera, M.; Németh, K. Total phenolic contents and antioxidant capacities of cereal and pseudocereal genotypes. J. Food Nutr. Res. 2007, 46, 150–157. [Google Scholar]
  40. Kreft, S.; Štrukelj, B.; Gaberščik, A.; Kreft, I. Rutin in buckwheat herbs grown at different UV-B radiation levels: Comparison of two UV spectrophotometric and an HPLC method. J. Exp. Bot. 2002, 53, 1801–1804. [Google Scholar] [CrossRef]
  41. Yen, G.C.; Chen, H.Y. Antioxidant activity of various tea extracts in relation to their mutagenicity. J. Agric. Food Chem. 1995, 43, 27–32. [Google Scholar] [CrossRef]
  42. Michalak, M.; Kubik-Komar, A.; Waśko, A.; Polak-Berecka, M. Starter culture for curly kale juice fermentation selected using principal component analysis. Food Biosci. 2020, 35, 100602. [Google Scholar] [CrossRef]
  43. Srisukchayakul, P.; Charalampopoulos, D.; Karatzas, K.A. Study on the effect of citric acid adaptation toward the subsequent survival of Lactobacillus plantarum NCIMB 8826 in low pH fruit juices during refrigerated storage. Food Res. Int. 2018, 111, 198–204. [Google Scholar] [CrossRef] [Green Version]
  44. Gueimonde, M.; Delgado, S.; Mayo, B.; Ruas-Madiedo, P.; Margolles, A.; Reyes-Gavilán, C.G. Viability and diversity of probiotic Lactobacillus and Bifidobacterium populations included in commercial fermented milks. Food Res. Int. 2004, 37, 839–850. [Google Scholar] [CrossRef]
  45. Đorđević, T.M.; Šiler-Marinković, S.S.; Dimitrijević-Branković, S.I. Effect of fermentation on antioxidant properties of some cereals and pseudo cereals. Food Chem. 2010, 119, 957–963. [Google Scholar] [CrossRef]
  46. Chen, T.; Piao, M.; Rahman, E.S.M.; Zhang, L.; Deng, Y. Influence of fermentation on antioxidant and hypolipidemic properties of maifanite mineral water-cultured common buckwheat sprouts. Food Chem. 2020, 321, 126741. [Google Scholar] [CrossRef] [PubMed]
  47. Kang, M.; Zhai, F.-H.; Li, X.-X.; Cao, J.-L.; Han, J.-R. Total phenolic contents and antioxidant properties of buckwheat fermented by three strains of Agaricus. J. Cereal Sci. 2017, 73, 138–142. [Google Scholar] [CrossRef]
  48. Gallo, M.; Nigro, F.; Passannanti, F.; Salameh, D.; Schiattarella, P.; Budelli, A.; Nigro, R. Lactic fermentation of cereal flour: Feasibility tests on rice, oat and wheat. Appl. Food Biotechnol. 2019, 3, 165–172. [Google Scholar] [CrossRef]
  49. Rathore, S.; Salmeron, I.; Pandiella, S. Production of potentially probiotic beverages using single and mixed cereal substrates fermented with lactic acid bacteria cultures. Food Microbiol. 2012, 30, 239–244. [Google Scholar] [CrossRef]
  50. Hur, S.; Lee, S.Y.; Kim, Y.; Choi, I.; Kim, G. Effect of fermentation on the antioxidant activity in plant-based foods. Food Chem. 2014, 160, 346–356. [Google Scholar] [CrossRef]
  51. Leonard, W.; Zhang, P.; Ying, D.; Adhikari, B.; Fang, Z. Fermentation transforms the phenolic profiles and bioactivities of plant-based foods. Biotechnol. Adv. 2021, 49, 107763. [Google Scholar] [CrossRef]
  52. Hansen, H.B.; Andreasen, M.F.; Nielsen, M.M.; Larsen, L.M.; Bach Knudsen, K.E.; Meyer, A.S.; Christensen, L.P.; Hansen, Å. Changes in dietary fibre, phenolic acids and activity of endogenous enzymes during rye bread-making. Eur. Food Res. Technol. 2002, 214, 33–42. [Google Scholar] [CrossRef]
  53. Abraha, H.S.; Gabaza, M.; Vandevelde, J.; Raes, K. Soluble and bound phenolic contents and antioxidant capacity of tef injera as affected by traditional fermentation. J. Food Compost. Anal. 2017, 58, 52–59. [Google Scholar] [CrossRef]
  54. Salmerón, I.; Thomas, K.; Pandiella, S.S. Effect of substrate composition and inoculum on the fermentation kinetics and flavour compound profiles of potentially non-dairy probiotic formulations. LWT-Food Sci. Technol. 2014, 55, 240–247. [Google Scholar] [CrossRef]
  55. Pelikánová, J.; Liptáková, D.; Valík, Ľ. Suitability of lactic acid bacteria for fermentation of maize and amaranth. J. Food Nutr. Res. 2015, 54, 354–364. [Google Scholar]
  56. Matejčeková, Z.; Liptáková, D.; Valík, Ľ. Functional probiotic products based on fermented buckwheat with Lactobacillus rhamnosus. LWT-Food Sci. Technol. 2017, 81, 35–41. [Google Scholar] [CrossRef]
  57. Kailasapathy, K.; Chin, J. Survival and therapeutic potential of probiotic organisms with reference to Lactobacillus acidophilus and Bifidobacterium spp. Immunol. Cell Biol. 2000, 78, 80–88. [Google Scholar] [CrossRef]
  58. Muniandy, P.; Shori, A.B.; Baba, A.S. Influence of green, white and black tea addition on the antioxidant activity of probiotic yogurt during refrigerated storage. Food Packag. Shelf Life 2016, 8, 1–8. [Google Scholar] [CrossRef]
  59. Saharan, P.; Sadh, P.K.; Duhan, J.S. Comparative assessment of effect of fermentation on phenolics, flavanoids and free radical scavenging activity of commonly used cereals. Biocatal. Agric. Biotechnol. 2017, 12, 236–240. [Google Scholar] [CrossRef]
  60. Filannino, P.; Bai, Y.; Di Cagno, R.; Gobbetti, M.; Gänzle, M.G. Metabolism of phenolic compounds by Lactobacillus spp. during fermentation of cherry juice and broccoli puree. Food Microbiol. 2015, 46, 272–279. [Google Scholar] [CrossRef]
  61. Ripari, V.; Bai, Y.; Gänzle, M.G. Metabolism of phenolic acids in whole wheat and rye malt sourdoughs. Food Microbiol. 2019, 77, 43–51. [Google Scholar] [CrossRef]
  62. Degrain, A.; Manhivi, V.; Remize, F.; Garcia, C.; Sivakumar, D. Effect of lactic acid fermentation on color, phenolic compounds and antioxidant activity in African nightshade. Microorganisms 2020, 8, 1324. [Google Scholar] [CrossRef]
  63. Lukšič, L.; Bonafaccia, G.; Timoracka, M.; Vollmannova, A.; Trček, J.; Nyambe, T.K.; Melini, V.; Acquistucci, R.; Germ, M.; Kreft, I. Rutin and quercetin transformation during preparation of buckwheat sourdough bread. J. Cereal Sci. 2016, 69, 71–76. [Google Scholar] [CrossRef]
  64. Huda, M.N.; Lu, S.; Jahan, T.; Ding, M.; Jha, R.; Zhang, K.; Zhang, W.; Georgiev, M.I.; Park, S.U.; Zhou, M. Treasure from garden: Bioactive compounds of buckwheat. Food Chem. 2021, 335, 127653. [Google Scholar] [CrossRef] [PubMed]
  65. Pappas, E.; Schaich, K.M. Phytochemicals of cranberries and cranberry Products: Characterization, potential health effects, and processing stability. Crit. Rev. Food Sci. Nutr. 2019, 49, 741–781. [Google Scholar] [CrossRef] [PubMed]
Figure 1. Rutin and quercetin content of buckwheat mashes obtained by HPLC analysis (µg/g). B/W/LP: buckwheat/water/L. plantarum HM1; B/W/LRH: buckwheat/water/L. rhamnosus GG; B/M/LP: buckwheat/milk/L. plantarum HM1; B/M/LRH: buckwheat/milk/L. rhamnosus GG; B/W/CR/LP: buckwheat/water/cranberries/L. plantarum HM1; B/W/CR/LRH: buckwheat/water/cranberries/L. rhamnosus GG; B/M/CR/LP: buckwheat/milk/cranberries/L. plantarum HM1; B/M/CR/LRH: buckwheat/milk/cranberries/L. rhamnosus GG.
Applsci 11 09241 g001
Figure 2. Scree plot visualization: The dependence between the number of principal components and % of explained variance.
Applsci 11 09241 g002
Figure 3. Loadings of variables studied in coordinates PC1 and PC2. TPC: total phenolic content; FL: total flavonoid content; AOA: antioxidant activity; dHB: protocatechuic acid.
Applsci 11 09241 g003
Figure 4. Principal component analysis graph of the studied samples at different fermentation terms and storage: AP0-AP14d: buckwheat/water/cranberries/L. plantarum HM1; AR0-AR14d: buckwheat/water/cranberries/L. rhamnosus GG; BP0-BP14d: buckwheat/milk/cranberries/L. plantarum HM1; BR0-BR14d: buckwheat/milk/cranberries/L. rhamnosus GG; CP0-CP14d: buckwheat/water/L. plantarum HM1; CR0-CR14d: buckwheat/water/L. rhamnosus GG; DP0-DP14d: buckwheat/milk/L. plantarum HM1; DR0-DR14d: buckwheat/milk/L. rhamnosus GG during experimental period 0–14 days.
Applsci 11 09241 g004
Table 1. Parameters evaluating behavior of L. plantarum HM1 and L. rhamnosus GG at 6 ± 0.5 °C for 14 days added after fermentation (8 h).
Buckwheat SubstrateNend
[log CFU/mL]
kd
[log CFU/mL h]
water + cranberries + L. plantarum HM15.78 a−0.011
water + cranberries + L. rhamnouss GG6.00 b−0.010
milk + cranberries + L. plantarum HM16.86 d−0.011
milk + cranberries + L. rhamnouss GG6.78 c−0.007
water + L. plantarum HM17.62 g−0.005
water + L. rhamnouss GG7.58 f−0.006
milk + L. plantarum HM17.43 e−0.018
milk + L. rhamnosus GG7.69 h−0.001
Nend—counts after storage period; kd—rate constant for decrease in counts; a–h Means within a column with different superscript letters differ significantly (p < 0.05).
Table 2. Total phenolic content of buckwheat mashes (mg GAE/g).
Time
Buckwheat Substrate0 h8 h24 h4 d7 d14 d
water + cranberries
+ L. plantarum HM10.596 ± 0.002 a0.887 ± 0.019 b0.715 ± 0.004 c0.706 ± 0.002 d0.734 ± 0.001 e0.737 ± 0.001 f,x
+ L. rhamnosus GG0.596 ± 0.002 a0.887 ± 0.019 b0.793 ± 0.006 c0.708 ± 0.011 d0.707 ± 0.001 d0.718 ± 0.004 e,y
milk + cranberries
+ L. plantarum HM10.542 ± 0.001 a0.593 ± 0.005 b0.628 ± 0.001 c0.630 ± 0.001 c0.638 ± 0.001 d0.642 ± 0.001 e,x
+ L. rhamnosus GG0.542 ± 0.001 a0.593 ± 0.005 b0.611 ± 0.007 c0.613 ± 0.005 c0.628 ± 0.002 d0.634 ± 0.001 e,y
water
+ L. plantarum HM10.267 ± 0.001 a0.322 ± 0.003 b0.372 ± 0.006 c0.380 ± 0.002 c0.430 ± 0.005 d0.578 ± 0.009 e,x
+ L. rhamnosus GG0.267 ± 0.001 a0.322 ± 0.003 b0.384 ± 0.002 c0.389 ± 0.001 d0.356 ± 0.004 e0.412 ± 0.006 f,y
milk
+ L. plantarum HM10.154 ± 0.002 a0.235 ± 0.001 b0.344 ± 0.006 c0.347 ± 0.003 c0.351 ± 0.002 d0.356 ± 0.001 e,x
+ L. rhamnosus GG0.154 ± 0.002 a0.235 ± 0.001 b0.230 ± 0.00 c0.235 ± 0.002 b0.244 ± 0.001 d0.254 ± 0.001 e,y
a–f Means within a line with different superscript letters differ significantly (p < 0.05); x,y Mean values of respective samples with L. plantarum HM1 and L. rhamnosus GG (after 14 days) within a column with different superscript letters differ significantly (p < 0.05).
Table 3. Total flavonoid content of fermented buckwheat mashes (mg QE/g).
Time
Buckwheat Substrate0 h8 h24 h4 d7 d14 d
water + cranberries
+ L. plantarum HM10.113 ± 0.001 a0.158 ± 0.002 b0.128 ± 0.000 c0.121 ± 0.000 d0.124 ± 0.001 e0.134 ± 0.001 f,x
+ L. rhamnosus GG0.113 ± 0.001 a0.158 ± 0.002 b0.137 ± 0.000 c0.130 ± 0.000 d0.130 ± 0.000 d0.128 ± 0.001 e,y
milk + cranberries
+ L. plantarum HM10.092 ± 0.000 a0.099 ± 0.000 b0.107 ± 0.000 c0.102 ± 0.001 d0.103 ± 0.000 d0.108 ± 0.000 d,x
+ L. rhamnosus GG0.092 ± 0.000 a0.099 ± 0.000 b0.101 ± 0.000 c0.104 ± 0.000 d0.099 ± 0.001 b0.107 ± 0.000 e,y
water
+ L. plantarum HM10.043 ± 0.000 a0.050 ± 0.001 b0.058 ± 0.000 c0.055 ± 0.000 d0.057 ± 0.000 e0.059 ± 0.000 f,x
+ L. rhamnosus GG0.043 ± 0.000 a0.050 ± 0.001 b0.050 ± 0.000 b0.049 ± 0.001 b0.052 ± 0.000 c0.055 ± 0.001 d,y
milk
+ L. plantarum HM10.035 ± 0.001 a0.039 ± 0.000 b0.041 ± 0.000 c0.040 ± 0.000 b0.043 ± 0.000 d0.045 ± 0.001 d,x
+ L. rhamnosus GG0.035 ± 0.001 a0.039 ± 0.000 b0.040 ± 0.000 c0.039 ± 0.000 b0.042 ± 0.001 c0.043 ± 0.001 c,x
a–f Means within a line with different superscript letters differ significantly (p < 0.05); x,y Mean values of respective samples with L. plantarum HM1 and L. rhamnosus GG (after 14 days) within a column with different superscript letters differ significantly (p < 0.05).
Table 4. Phenolic acids profile in buckwheat mashes obtained by HPLC analysis (µg/g).
Buckwheat Substrate GallicdHBVanillicSyringicCaffeicp-CoumaricFerulic
water + cranberries0 h8.995 ± 0.11311.778 ± 0.0026.624 ± 0.01916.936 ± 0.04016.376 ± 0.10727.736 ± 0.0506.537 ± 0.051
+ L. plantarum HM18 h12.216 ± 0.036 *11.629 ± 0.0126.647 ± 0.01414.497 ± 0.094 *21.676 ± 0.042 *38.251 ± 0.190 *8.729 ± 0.024 *
24 h14.136 ± 0.100 *12.467 ± 0.129 *6.839 ± 0.0209.877 ± 0.030 *24.439 ± 0.097 *22.987 ± 0.165 *7.225 ± 0.039 *
4 d14.302 ± 0.058 *12.658 ± 0.040 *7.253 ± 0.037 *8.938 ± 0.045 *25.582 ± 0.140 *20.132 ± 0.261 *6.537 ± 0.017
7 d15.702 ± 0.147 *13.836 ± 0.129 *7.652 ± 0.018 *7.002 ± 0.010 *26.326 ± 0.055 *18.382 ± 1.006 *6.899 ± 0.013 *
14 d18.283 ± 0.147 *16.420 ± 0.111 *8.200 ± 0.067 *7.946 ± 0.010 *29.574 ± 0.016 *16.106 ± 0.083 *5.625 ± 0.029 *
water + cranberries0 h8.995 ± 0.11311.778 ± 0.0026.624 ± 0.01916.936 ± 0.04016.376 ± 0.10727.736 ± 0.0506.537 ± 0.051
+ L. rhamnosus GG8 h12.216 ± 0.036 *11.629 ± 0.0126.647 ± 0.01414.497 ± 0.094 *21.676 ± 0.042 *38.251 ± 0.190 *8.729 ± 0.024 *
24 h14.633 ± 0.210 *13.084 ± 0.104 *6.687 ± 0.05410.021 ± 0.024 *21.729 ± 0.008 *23.665 ± 0.165 *6.711 ± 0.020 *
4 d15.786 ± 0.250 *13.254 ± 0.003 *7.738 ± 0.013 *8.536 ± 0.006 *21.301 ± 0.145 *17.694 ± 0.049 *6.610 ± 0.037
7 d17.303 ± 0.103 *13.374 ± 0.046 *8.485 ± 0.041 *7.408 ± 0.019 *21.529 ± 0.134 *14.405 ± 0.102 *6.830 ± 0.028 *
14 d17.636 ± 0.063 *13.959 ± 0.123 *8.545 ± 0.009 *7.320 ± 0.021 *24.438 ± 0.069 *12.080 ± 0.073 *5.715 ± 0.019 *
milk + cranberries0 h7.365 ± 0.1098.764 ± 0.0465.691 ± 0.02911.224 ± 0.03213.680 ± 0.11816.467 ± 0.1344.060 ± 0.009
+ L. plantarum HM18 h7.961 ± 0.0379.819 ± 0.0235.734 ± 0.05811.125 ± 0.01015.816 ± 0.197 *15.419 ± 0.043 *4.001 ± 0.008
24 h11.343 ± 0.025 *10.048 ± 0.002 *6.666 ± 0.023 *10.950 ± 0.073 *17.161 ± 0.214 *10.839 ± 0.043 *3.334 ± 0.011 *
4 d11.498 ± 0.037 *9.335 ± 0.033 *8.079 ± 0.049 *9.541 ± 0.024 *17.747 ± 0.183 *9.649 ± 0.006 *3.238 ± 0.004 *
7 d12.049 ± 0.078 *11.758 ± 0.064 *9.408 ± 0.049 *9.220 ± 0.028 *18.143 ± 0.083 *8.385 ± 0.011 *3.186 ± 0.048 *
14 d13.371 ± 0.068 *13.366 ± 0.108 *9.752 ± 0.018 *9.405 ± 0.033 *19.001 ± 0.058 *8.309 ± 0.027 *2.881 ± 0.050 *
milk + cranberries0 h7.365 ± 0.1098.764 ± 0.0465.691 ± 0.02911.224 ± 0.03213.680 ± 0.11816.467 ± 0.1344.060 ± 0.009
+ L. rhamnosus GG8 h7.961 ± 0.0379.819 ± 0.0235.734 ± 0.05811.125 ± 0.01015.816 ± 0.197 *15.419 ± 0.043 *4.001 ± 0.008
24 h8.860 ± 0.078 *9.862 ± 0.015 *7.105 ± 0.024 *6.373 ± 0.016 *15.767 ± 0.144 *12.344 ± 0.018 *3.450 ± 0.021 *
4 d9.224 ± 0.033 *10.837 ± 0.038 *7.988 ± 0.015 *5.743 ± 0.001 *16.098 ± 0.053 *11.099 ± 0.044 *3.651 ± 0.027 *
7 d10.839 ± 0.064 *9.658 ± 0.046 *6.444 ± 0.051 *5.280 ± 0.040 *17.777 ± 0.131 *10.157 ± 0.037 *2.393 ± 0.009 *
14 d12.004 ± 0.004 *11.161 ± 0.033 *6.388 ± 0.018 *5.069 ± 0.025 *18.865 ± 0.058 *8.867 ± 0.045 *2.069 ± 0.008 *
water0 h5.649 ± 0.00429.685 ± 0.0384.272 ± 0.03013.672 ± 0.03714.280 ± 0.06520.237 ± 0.1654.424 ± 0.022
+ L. plantarum HM18 h6.972 ± 0.004 *10.021 ± 0.079 *3.620 ± 0.020 *11.958 ± 0.046 *12.748 ± 0.212 *19.592 ± 0.027 *3.622 ± 0.029 *
24 h7.011 ± 0.064 *12.309 ± 0.115 *5.421 ± 0.019 *11.388 ± 0.074 *17.531 ± 0.059 *19.527 ± 0.132 *6.245 ± 0.014 *
4 d8.733 ± 0.071 *10.567 ± 0.086 *5.106 ± 0.019 *10.588 ± 0.099 *16.220 ± 0.100 *18.528 ± 0.051 *4.301 ± 0.020
7 d11.185 ± 0.066 *11.354 ± 0.129 *4.328 ± 0.03510.157 ± 0.062 *16.021 ± 0.042 *16.724 ± 0.057 *3.510 ± 0.029 *
14 d13.268 ± 0.014 *12.728 ± 0.036 *4.941 ± 0.012 *9.982 ± 0.025 *16.195 ± 0.076 *14.592 ± 0.121 *3.513 ± 0.026 *
water0 h5.649 ± 0.0429.685 ± 0.0384.272 ± 0.03013.672 ± 0.03714.280 ± 0.06520.237 ± 0.1654.424 ± 0.022
+ L. rhamnosus GG8 h6.972 ± 0.004 *10.021 ± 0.079*3.620 ± 0.020 *11.958 ± 0.046 *12.748 ± 0.212 *19.592 ± 0.027 *3.622 ± 0.029 *
24 h6.412 ± 0.020 *7.990 ± 0.009 *3.143 ± 0.025 *12.474 ± 0.047 *11.952 ± 0.047 *29.509 ± 0.110 *5.244 ± 0.027 *
4 d7.235 ± 0.024 *9.874 ± 0.039 *3.266 ± 0.016 *12.592 ± 0.014 *12.345 ± 0.085 *29.117 ± 0.100 *4.962 ± 0.047 *
7 d6.888 ± 0.032 *8.958 ± 0.049 *3.341 ± 0.008 *10.753 ± 0.073 *10.465 ± 0.055 *26.628 ± 0.243 *6.006 ± 0.043 *
14 d7.588 ± 0.012 *10.457 ± 0.024 *3.645 ± 0.065 *13.391 ± 0.165 *13.081 ± 0.043 *27.001 ± 0.143 *5.693 ± 0.050 *
milk0 h4.642 ± 0.0397.524 ± 0.0453.928 ± 0.02411.369 ± 0.09413.411 ± 0.01316.983 ± 0.0733.669 ± 0.003
+ L. plantarum HM18 h6.426 ± 0.038 *11.114 ± 0.084 *4.418 ± 0.014 *10.395 ± 0.036 *14.001 ± 0.024 *18.181 ± 0.099 *3.169 ± 0.040 *
24 h7.237 ± 0.007 *11.232 ± 0.066 *4.701 ± 0.027 *10.843 ± 0.034 *14.310 ± 0.158 *16.772 ± 0.0003.776 ± 0.021
4 d7.186 ± 0.002 *13.306 ± 0.097 *4.601 ± 0.027 *11.509 ± 0.034 *13.850 ± 0.021 *15.175 ± 0.132 *3.273 ± 0.023 *
7 d7.405 ± 0.010 *11.650 ± 0.115 *3.883 ± 0.0359.107 ± 0.056 *13.966 ± 0.014 *13.159 ± 0.106 *4.123 ± 0.003 *
14 d8.564 ± 0.040 *11.910 ± 0.012 *4.049 ± 0.001 *8.036 ± 0.036 *14.215 ± 0.037 *12.507 ± 0.030 *3.236 ± 0.012 *
milk0 h4.642 ± 0.0397.524 ± 0.0453.928 ± 0.02411.369 ± 0.09413.411 ± 0.01316.983 ± 0.0733.669 ± 0.003
+ L. rhamnosus GG8 h6.426 ± 0.038 *11.114 ± 0.084 *4.418 ± 0.014 *10.395 ± 0.036 *14.001 ± 0.024 *18.181 ± 0.099 *3.169 ± 0.040 *
24 h6.424 ± 0.015 *11.988 ± 0.007 *4.690 ± 0.031 *7.844 ± 0.017 *13.289 ± 0.08516.355 ± 0.132 *3.299 ± 0.017 *
4 d8.647 ± 0.003 *14.955 ± 0.050 *5.448 ± 0.051 *8.771 ± 0.087 *14.107 ± 0.049 *13.561 ± 0.075 *3.200 ± 0.020 *
7 d7.404 ± 0.041 *13.063 ± 0.029 *5.270 ± 0.039 *7.392 ± 0.012 *12.421 ± 0.022 *12.931 ± 0.050 *3.373 ± 0.014 *
14 d8.943 ± 0.058 *15.424 ± 0.007 *5.573 ± 0.019 *8.666 ± 0.002 *13.581 ± 0.04414.669 ± 0.104 *3.362 ± 0.017 *
* Denotes a statistically significant difference (p < 0.05) between the unfermented samples (0 h) and fermented and stored samples; dHB: protocatechuic acid
Table 5. Antioxidant activity of buckwheat mashes (mg DPPH/g) determined by DPPH test.
Time
Buckwheat Substrate0 h8 h24 h4 d7 d14 d
water + cranberries
+ L. plantarum HM11.157 ± 0.006 a1.391 ± 0.010 b1.393 ± 0.005 b1.353 ± 0.006 c1.425 ± 0.005 d1.462 ± 0.012 e,x
+ L. rhamnosus GG1.157 ± 0.006 a1.391 ± 0.010 b1.220 ± 0.037 c1.194 ± 0.005 d1.314 ± 0.002 e1.334 ± 0.005 f,y
milk + cranberries
+ L. plantarum HM11.112 ± 0.002 a1.259 ± 0.003 b1.258 ± 0.005 b1.220 ± 0.002 c1.255 ± 0.001 b1.274 ± 0.005 d,x
+ L. rhamnosus GG1.112 ± 0.002 a1.259 ± 0.003 b1.282 ± 0.010 c1.278 ± 0.005 c1.312 ± 0.006 d1.329 ± 0.006 e,y
water
+ L. plantarum HM10.609 ± 0.006 a0.658 ± 0.005 b0.724 ± 0.006 c0.716 ± 0.004 c0.768 ± 0.007 d0.819 ± 0.011 e,x
+ L. rhamnosus GG0.609 ± 0.006 a0.658 ± 0.005 b0.751 ± 0.009 c0.651 ± 0.004 b0.623 ± 0.010 d0.727 ± 0.003 e,y
milk
+ L. plantarum HM10.315 ± 0.012 a0.353 ± 0.001 b0.667 ± 0.011 c0.660 ± 0.002 c0.721 ± 0.003 d0.776 ± 0.006 e,x
+ L. rhamnosus GG0.315 ± 0.012 a0.353 ± 0.001 b0.484 ± 0.005 c0.400 ± 0.001 d0.473 ± 0.017 c0.609 ± 0.024 e,y
a–f Means within a line with different superscript letters differ significantly (p < 0.05); x,y Mean values of respective samples with L. plantarum HM1 and L. rhamnosus GG (after 14 days) within a column with different superscript letters differ significantly (p < 0.05).
Publisher’s Note: MDPI stays neutral with regard to jurisdictional claims in published maps and institutional affiliations.

