Article

Metal Binding and Sources of Humic Substances in Recent Sediments from the Cananéia-Iguape Estuarine-Lagoon Complex (South-Eastern Brazil)

1
Instituto Oceanográfico, Universidade de São Paulo, Praça do Oceanográfico 191, São Paulo 05508-120, Brazil
2
Dipartimento di Scienze Agroalimentari, Ambientali e Animali, Università degli Studi di Udine, Via delle Scienze 206, 33100 Udine, Italy
3
Dipartimento di Matematica e Geoscienze, Università degli Studi di Trieste, Via Weiss 2, 34128 Trieste, Italy
4
Dipartimento di Scienze Chimiche e Farmaceutiche, Università degli Studi di Trieste, Via Licio Giorgieri 1, 34127 Trieste, Italy
*
Author to whom correspondence should be addressed.
Appl. Sci. 2021, 11(18), 8466; https://doi.org/10.3390/app11188466
Submission received: 7 July 2021 / Revised: 23 August 2021 / Accepted: 9 September 2021 / Published: 12 September 2021

Abstract

:
The Cananéia-Iguape estuarine–lagoon complex (São Paulo state, Brazil) is a natural laboratory to study metal binding by humic substances (HS) in subtropical settings. This transitional environment is evolving into a freshwater environment due to water input from the Ribeira River, funneled through the Valo Grande Canal (Iguape). Past mining activities in the Ribeira River basin and maritime traffic are suspected to be potential sources of trace metals in the system. In this study, the trace metal contents of Free Humic Acids (FHA), Bound Humic Acids (BHA), and Fulvic Acids (FA) extracted from sedimentary organic matter were investigated. Moreover, the sources of HS were traced using their stable carbon isotope compositions and C/N ratios. The results suggested a mixed marine–terrestrial source of FHA, BHA, and FA. Copper and Cr were the most abundant trace metals bound to HS. On average, Cu showed concentrations of 176, 115, and 37.9 μg g−1 in FHA, BHA, and FA, respectively, whereas Cr showed average concentrations of 47.4, 86.3, and 43.9 μg g−1 in FHA, BHA, and FA, respectively. Marine FHA showed the highest binding capacity for trace metals, whereas terrestrial FA derived from the decay of mangrove organic matter showed the lowest binding capacity.

1. Introduction

Humic substances (HS) are important components of natural organic matter in water and sediments, where they represent the most refractory fraction [1,2]. HS consist of heterogeneous mixtures of organic molecules formed during the decay of plant, animal, and microbial remains [3]. Based on their solubility, HS are subdivided into three fractions: fulvic acids (FA, soluble in acidic and basic solutions), humic acids (HA, insoluble in acidic solutions), and humin (insoluble). HA, in turn, can be subdivided into Free HA (FHA) and Bound HA (BHA), the latter being the fraction bound to mineral surfaces by formation of cationic bridges. BHA can only be solubilised by extraction with Na4P2O7, which complexes calcium and breaks cationic bridges [4,5,6].
The study of HS is relevant in coastal oceanography because HS can bind metals, either by complexation or by surface adsorption. This binding ability is due to the fact that HS consist of a mixture of carboxylated and fused alicyclic structures, which can constitute ligands for metal binding [7]. HS may be present in water either as a dissolved or as a colloidal organic phase [8,9]. In the dissolved form, HS form complexes with metals by oxy-functional groups and N moieties [10], whereas in the solid suspended form, they bind metal by surface adsorption [8], which is the prevailing binding process in sediments [11]. The binding sites in HA and FA correspond mainly to the carboxylic and phenolic groups present, although N- and S-containing groups may also be relevant for metal ion binding [12]. Due to this metal retention capacity, HS play a potential role in the dispersion of metals in estuarine environments [8,13,14,15]. Since HS are associated with fine sediments and particulate organic matter, they can contribute to the transfer of metals from the water column to the sediment [10,16].
The carbon isotope composition and C/N ratio of organic matter is a well-established tool to distinguish between terrestrial and marine organic matter in transitional environments [17,18]. Terrestrial plants fixation of CO2 results in 13C depletion of plant tissues relative to atmospheric CO2 (having a δ13C value of −8‰) [19]. Freshwater aquatic C3 plants have typical δ13C values between −50 and −11‰ [20,21], whereas C4 plants exhibit a range of δ13C values between −17 to −9‰ [22]. C3 and C4 plants are characterized by C/N ratios ≥12 and >30 [23], respectively.
Marine phytoplankton relies mainly on HCO3 ion as a carbon source. Since HCO3 is 13C enriched relative to CO2, the δ13C values of marine phytoplankton are generally higher than those of both freshwater and terrestrial plants. Freshwater algae and marine algae have δ13C values in the range of − 26 to −30‰ [23] and −16 to −23‰ [24], respectively.
The δ13C values of fluvial particulate organic carbon (POC) reflect the isotopic signature of freshwater phytoplankton (−25 to −30‰) and terrestrial POC (−25 to −33‰) [25,26,27]. Marine POC (−21 to −18‰) reflects the isotopic signature of marine phytoplankton [27,28,29]. Phytoplankton C/N ratios are generally between 5 and 7 [23], which results in typical marine organic matter C/N ratios < 8 [30].
The same concept applies to dissolved organic carbon (DOC), which reflects the isotopic signature of phytoplankton in the marine environment and a mixture of terrestrial organic matter and freshwater phytoplankton in rivers. Marine DOC has typical δ13C values between −22 and −25‰, whereas freshwater DOC has typical δ13C values between −26 and −28‰ [31,32].
Based on the above considerations, the source of HS can be determined based on their δ13C and C/N values, which reflect the characteristic signature of the terrestrial or marine organic matter from which HS originated [33]. For an exhaustive review on the use of δ13C and C/N values to determine the source of organic matter, we refer the reader to the excellent paper of Lamb and collaborators [18].
The Cananéia-Iguape estuarine–lagoon complex (São Paulo state, Brazil), today a Biosphere Reserve recognized by the UNESCO, presents moderate metal contamination linked to past mining activities in the Ribeira River Basin. This region was an important mining site until 1995, with nine major mines operating mainly on lead extraction. Mining activities resulted in dumping of residues in the river and on the river banks, leading to an estimated accumulation of 89,000 m3 of metal rich material [34]. The Valo Grande Canal in Iguape connects the Ribeira River to the estuarine system, and together with sewage discharge and maritime activities, is the main source of contaminants in the area [35,36,37].
In this research, the marine vs. terrestrial source and the metal contents (As, Cr, Cu, Mn, Ni, Pb, V, Zn) of FHA, BHA, and FA extracted from sedimentary organic matter (SOM) in surface sediments collected in the Cananéia-Iguape estuarine–lagoon complex were investigated. These metals correspond to the complexed fraction of the metals potentially retained by HS.
The work hypothesis underlying the study was that FHA, BHA, and FA might have distinct environmental sources and different binding capacities for different metals. The specific objectives were (1) to compare the As, Cr, Cu, Mn, Ni, Pb, V, and Zn concentrations in FHA, BHA, and FA; (2) to identify the source (marine, terrestrial or mixed) of FHA, BHA, and FA based on their δ13C and C/N values; and (3) to investigate the factors governing the distribution of metals bound to FHA, BHA, and FA. This research is the first dealing with the concentration of complexed trace metals in HS in the Cananéia-Iguape estuarine–lagoon complex, and will contribute to the understanding of the relationship between organic matter and metal contamination in subtropical settings.

2. Materials and Methods

2.1. Study Area

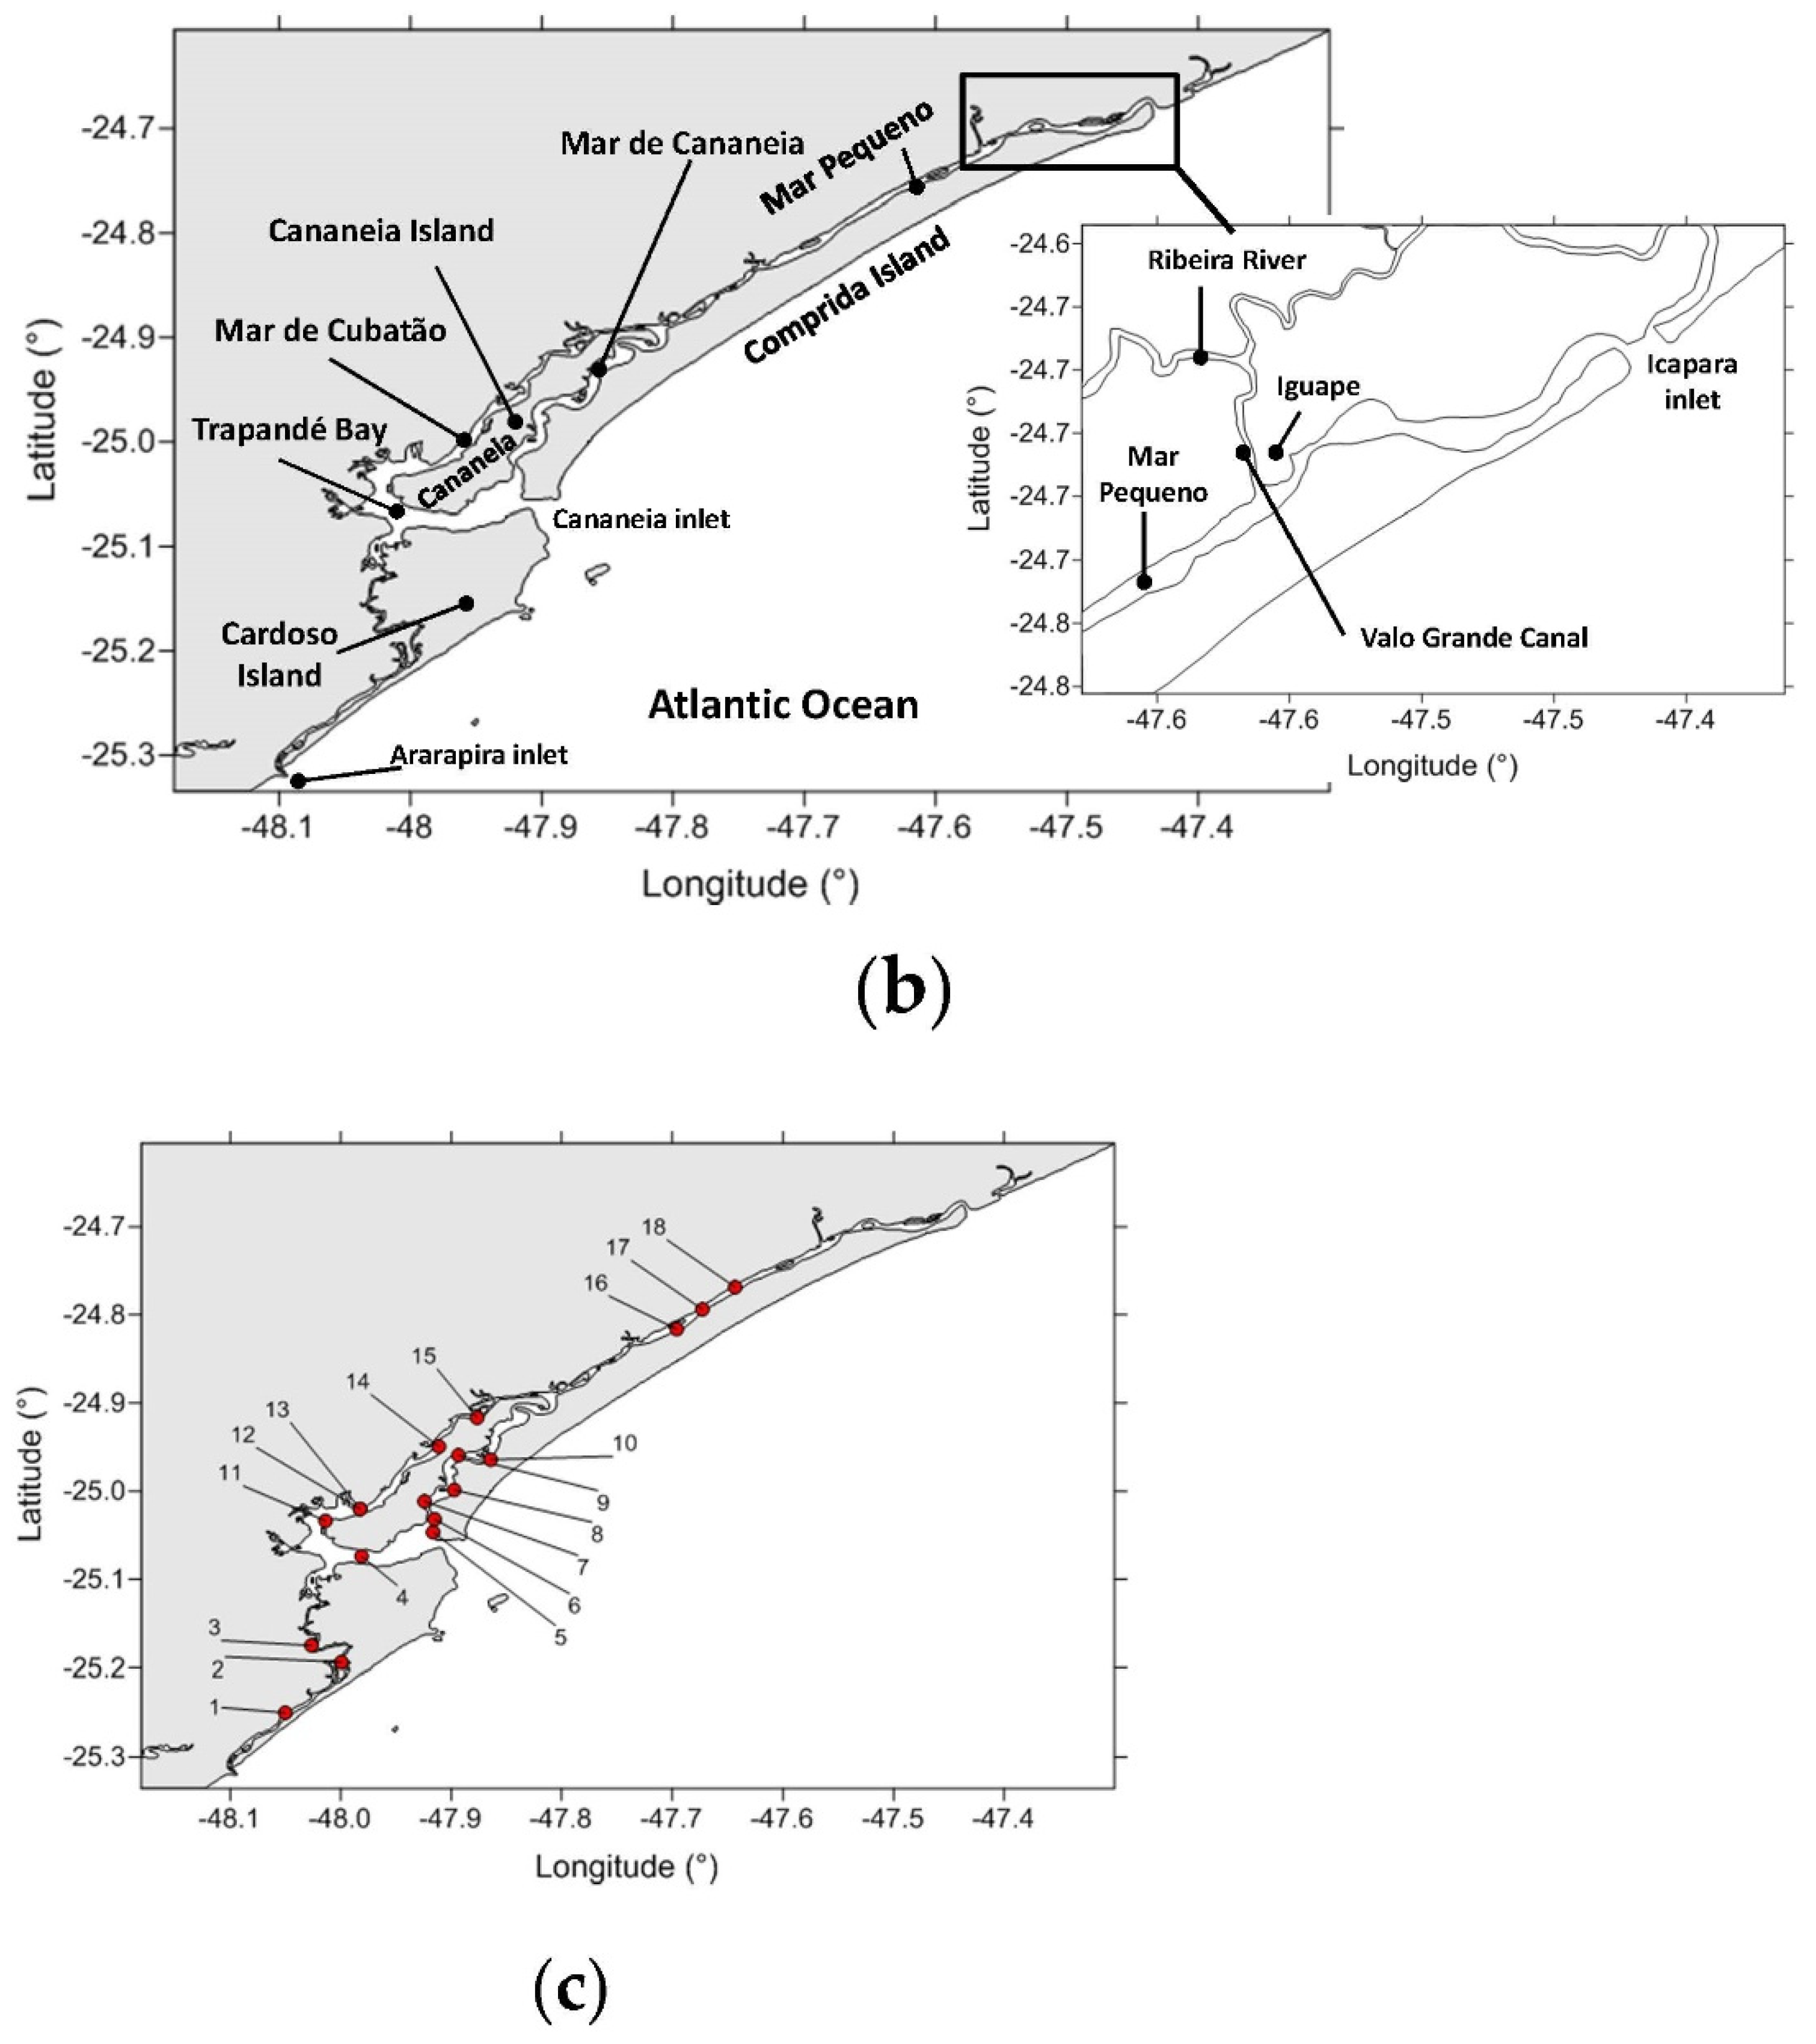
The Cananéia-Iguape estuarine–lagoon complex is located at the southern limit of the São Paulo state, between the latitudes 24°50′ S and 25°40′ S and the longitudes 47°20′ W and 48°20′ W (Figure 1). The system is separated from the Atlantic Ocean by the Comprida Island, a narrow and elongated island extending over about 70 km in a SW-NE direction (Figure 1b). Water exchange with the Atlantic Ocean occurs through two mouths, named “Barra de Icapara” (near to the city of Iguape) and “Barra de Cananéia” (near to the city of Cananéia), which separates Comprida Island from Cardoso Island. The western shore of Comprida Island is bathed by a narrow and elongated body of water, named “Mar Pequeno” in the north and “Mar de Cananéia” in the south, which separate Comprida Island from Cananéia Island (Figure 1b).
Tide is semidiurnal, with spring and neap tide average heights of 120 cm and 26 cm, respectively [38]. Freshwater enters the estuarine–lagoon complex mostly through the Valo Grande Canal, linked to the Ribeira River. The Valo Grande Canal is 4 km long and was built between 1828 and 1852 for the transport of merchandises in the Iguape region. The Valo Grande Canal was originally 4.4 m wide and 2 m deep, but increased progressively in width and depth due to progressive erosion associated with intense flood events. In 1978, the Valo Grande reached a width of 250 m and a depth of 8 m, and was closed by a dam [16]. Since then, the canal has been closed and reopened several times and it is now open since 1995. This results in an annual average freshwater flux of about 770 m3 s−1 into the Cananéia-Iguape estuarine–lagoon complex [39]. This freshwater flux is associated with a discharge of suspended particulate matter in the order of 106 m3 per year [35]. As a consequence, the northern sector of the Cananéia-Iguape estuarine–lagoon complex has evolved into a freshwater-dominated system, also in terms of abundance of terrestrial organic matter in water and sediments [35,36,40], whereas mangroves are preponderant in the southern sector. The sediment grain size distribution is characterised by patches of sand and silt, the latter being more abundant in the northern sector and to the south of Ararapira.
Previous studies of metal contamination in the Cananéia-Iguape estuarine–lagoon complex were focused on metal and metalloid contents in sediments. A previous study [41] raised concern about the levels of As and Cr in sediments nearby the city of Cananéia, and pointed out a positive correlation of metal concentrations with both mud content and sedimentary organic matter. Sediment cores were analysed to reconstruct the evolution of metal input from the Valo Grande Canal since the opening of this artificial waterway in 1852 [35,36]. The results of these studies indicated maximum metal concentrations in sediments deposited between 1940 and 1990, which corresponds to the peak of mining operations in the site. Even after the end of mining activities, the concentrations of Pb, Cu, and Cr remained comparable to those measured in the Santos Estuary, the largest industrial area on the Brazilian coast.
Tramonte and collaborators [42,43] built on the studies of [35,36] to assess the potential mobility of metals present in sediments. By means of a three-step extraction procedure, the authors quantified the acid-soluble, the reducible, and the oxidizable metal fractions in surface and subsurface sediments. The results indicated that Pb, Cu, and Zn, mainly associated to Fe and Mn oxides, are environmentally critical.
Contamination by potentially toxic trace elements has been also observed in local fish, namely Hg in Cathorops spixii [44] and Cu, Zn, and Br in Mugil curema [45]. Moderate contamination by Cd, Cu, Pb, Mn, and Ni was found in green turtles (Chelonia mydas) [46].

2.2. Sediment Sampling

A sampling campaign with the research boat Albacora (Institute of Oceanography—University of São Paulo—IOUSP) took place in mid-August 2019. Surface sediment samples were collected at 18 stations (Table S1), starting from the Ararapira tidal mouth (SW sector of the study area), through the Mar de Cubatão, as far as the Mar Pequeno (NE sector of the study area) (Figure 1b,c).
Sediment samples were retrieved with a van Veen grab. After opening the grab, the surface layer of the retrieved sediment was collected with a plastic spatula, homogenized (by mixing with the spatula), and temporarily stored in plastic containers at 4 °C. Then, sediment samples were freeze-dried and subdivided in aliquots prior to preparation for the following analyses:
(1) Determination of calcium carbonate content (CaCO3%), Total Organic Carbon (TOC), Total Nitrogen (TN), and stable carbon isotope composition of SOM (δ13CSOM) were performed at IOUSP;
(2) Extraction of FHA, BHA, and FA from SOM, and stable carbon isotope analyses of FHA, BHA, and FA (δ13CFHA, δ13CBHA and δ13CFA) were performed at the University of Udine (Italy);
(3) Measurement of grain size and determination of metal contents in FHA, BHA, and FA were performed at the University of Trieste (Italy).

2.3. Grain Size Analysis of Sediments

For grain size analysis, 15–20 g of each sediment sample was processed using hydrogen peroxide (H2O2, 10%) for 24 h to eliminate organic matter, and then wet-sieved with a 2 mm sieve. The resulting < 2 mm fraction was analysed using a Malvern Mastersizer 3000 (Malvern Instruments Ltd., Worcestershire, UK). Sediments were classified according to the Shepard’s classification [47] (sand 0.63 μm–2 mm; silt 4 μm–0.63 μm; clay < 4 μm).

2.4. Calcium Carbonate Content (CaCO3%)

Freeze-dried sediment samples were disaggregated with an agate pestle and mortar. About 1 g of each sample was placed in a 20 mL Falcon tube, previously weighed with a precision scale. 2 mL HCl 1M was added using a Whirli Mixer (Fisherbrand). Drops of concentrated HCl were added until no visible reaction was observable. Samples were rinsed with 8 mL Milli-Q water and centrifuged (2000× g rpm) for 10 min, after which the supernatant was discarded. Rinsing and centrifugation were repeated five times, and pH was measured with paper pH test strips to make sure that no HCl remained. Samples were dried in an oven (60 °C) and weighed again to calculate the percentage of CaCO3 based on the difference between the initial and the final mass.

2.5. TOC, TN and δ13C Values of SOM, FHA, BHA, and FA

TOC, TN, and δ13C values of SOM, FHA, BHA, and FA were measured by gas chromatography (Thermo Scientific GC Combustion III) coupled with a continuum He-flow isotope ratio mass spectrometry (IRMS—Thermo Scientific Delta V Advantage) following a standard, semi-automated procedure. In brief, 10 mg of (CaCO3 free) sample (sediment in the case of SOM, or FHA, BHA, and FA extracted from SOM) was conditioned in tin capsules and combusted on line, to release carbon dioxide (CO2) and nitrogen oxide (NOx). The latter was reduced to diatomic nitrogen on line, through a reduction column. Both CO2 and N2 were quantified by gas chromatography to yield the percentages of TOC and TN in the sample. Subsequently, CO2 was run to the IRMS to determine the δ13C value.
δ13C values are given relative to international reference Vienna-Pee Dee Belemnite (V-PDB), through calibration of raw values with certified reference materials (caffeine IAEA 600 and L-glutamic acid USGS 40). The analytical precision (1σ standard deviation) of δ13C analyses was <0.1‰.

2.6. Extraction of FHA, BHA, and FA from Sediments

Humic substances (FHA, BHA, and FA) were extracted through a sequential extraction procedure (Figure S1). This method has already been used to isolate HS from coastal sediments [6]. Freeze-dried sediments were sieved (1 mm mesh) to remove coarse material and extracted firstly with 0.5 M NaOH (free extract) and then with 0.1 M NaOH plus 0.1 M Na4P2O7 (bound extract). Both extractions were carried out at a sediment/extractant ratio of 1:10 (g ml−1) by shacking suspensions for 4 h. To avoid organic matter oxidation in alkaline conditions, extractant solutions were de-aerated and N2 saturated. Sediment residues were separated by centrifugation and supernatants filtered through 0.2 μm cellulose filters. Free and Bound HA were precipitated from the respective solutions with 6 M HCl at pH 1, allowed to settle overnight, and then separated by centrifugation. Then, HA were washed twice with distilled water, frozen, freeze-dried, and finally weighted.
To isolate FA, the free and bound supernatants were mixed and loaded on a XAD-8 resin column. The residue was discarded and the XAD-8 column, containing the retained FA, was rinsed with 0.8 column volumes of distilled H2O. The FA were desorbed from the resin with 0.5 column volume of 0.1M NaOH, followed by two column volumes of water. The eluate was immediately acidified with H+-saturated cation-exchange resin and finally freeze-dried. The ash content was determined by burning a certain amount of freeze-dried HS (600 °C for 4 h) and was lower than 5% in all samples.

2.7. Analysis of Metals Content in FHA, BHA, and FA

Metal contents (As, Cr, Cu, Mn, Ni, Pb, V, Zn) were determined by Inductively Coupled Plasma—Mass Spectrometry (ICP-MS, NexION 350x, PerkinElmer), conducted on FHA, BHA, and FA. Sample preparation was as follows: 20 mg of HA were acid digested in a closed microwave system (Anton Paar Multiwave PRO) using 1 mL of Milli-Q water, 2.5 mL HNO3, and 0.5 mL of H2O2. The sample volume was set to 25 mL, diluted ten times, and run to the ICP-MS. The instrument was calibrated using five standard solutions in the range 0.1–10 μg L−1 with the only exception of Fe (1–500 μg L−1), with 1% of HNO3 (>69% VWR—USA). Standards were prepared by dilution from the multistandard Periodic Table Mix 1 (Sigma Aldrich, St. Louis, MO, USA), having an initial concentration of 10 mg L−1. Kinetic energy discrimination (KED) mode was used to avoid and minimise cell-formed polyatomic ion interference. Relative standard deviation of measurements was <3%. Internal standard (stock solution Sc, Y and Ho Sigma Aldrich 1000 mg L−1) was spiked into the blank, the calibration standards, and the samples to ensure the quality of the analysis. Moreover, additional quality control was performed by analysing laboratory fortified samples prepared by spiking a certain amount of trace elements (depending on their concentration in the samples) into the original sample. A different multistandard solution from that used for instrument calibration was employed and acceptable recoveries were obtained (92–105%).

2.8. Statistical Data Analysis

To investigate the factors governing the distribution of metals bound to FHA, BHA, and FA, Pearson’s correlation matrices were obtained for the parameters measured in sediment samples, namely CaCO3, TOC, TN, δ13C values and concentrations of FHA, BHA, and FA, percentages of sand, silt and clay (Table 1), and concentrations of Pb, V, Cr, Mn, Ni, Cu, Zn, and As in FHA, BHA, and FA, respectively (Table 2, Table 3 and Table 4). Correlation matrices were obtained with the software Statistica (StatSoft, version 8).

3. Results

3.1. Grain Size, CaCO3, TOC, and TN Contents

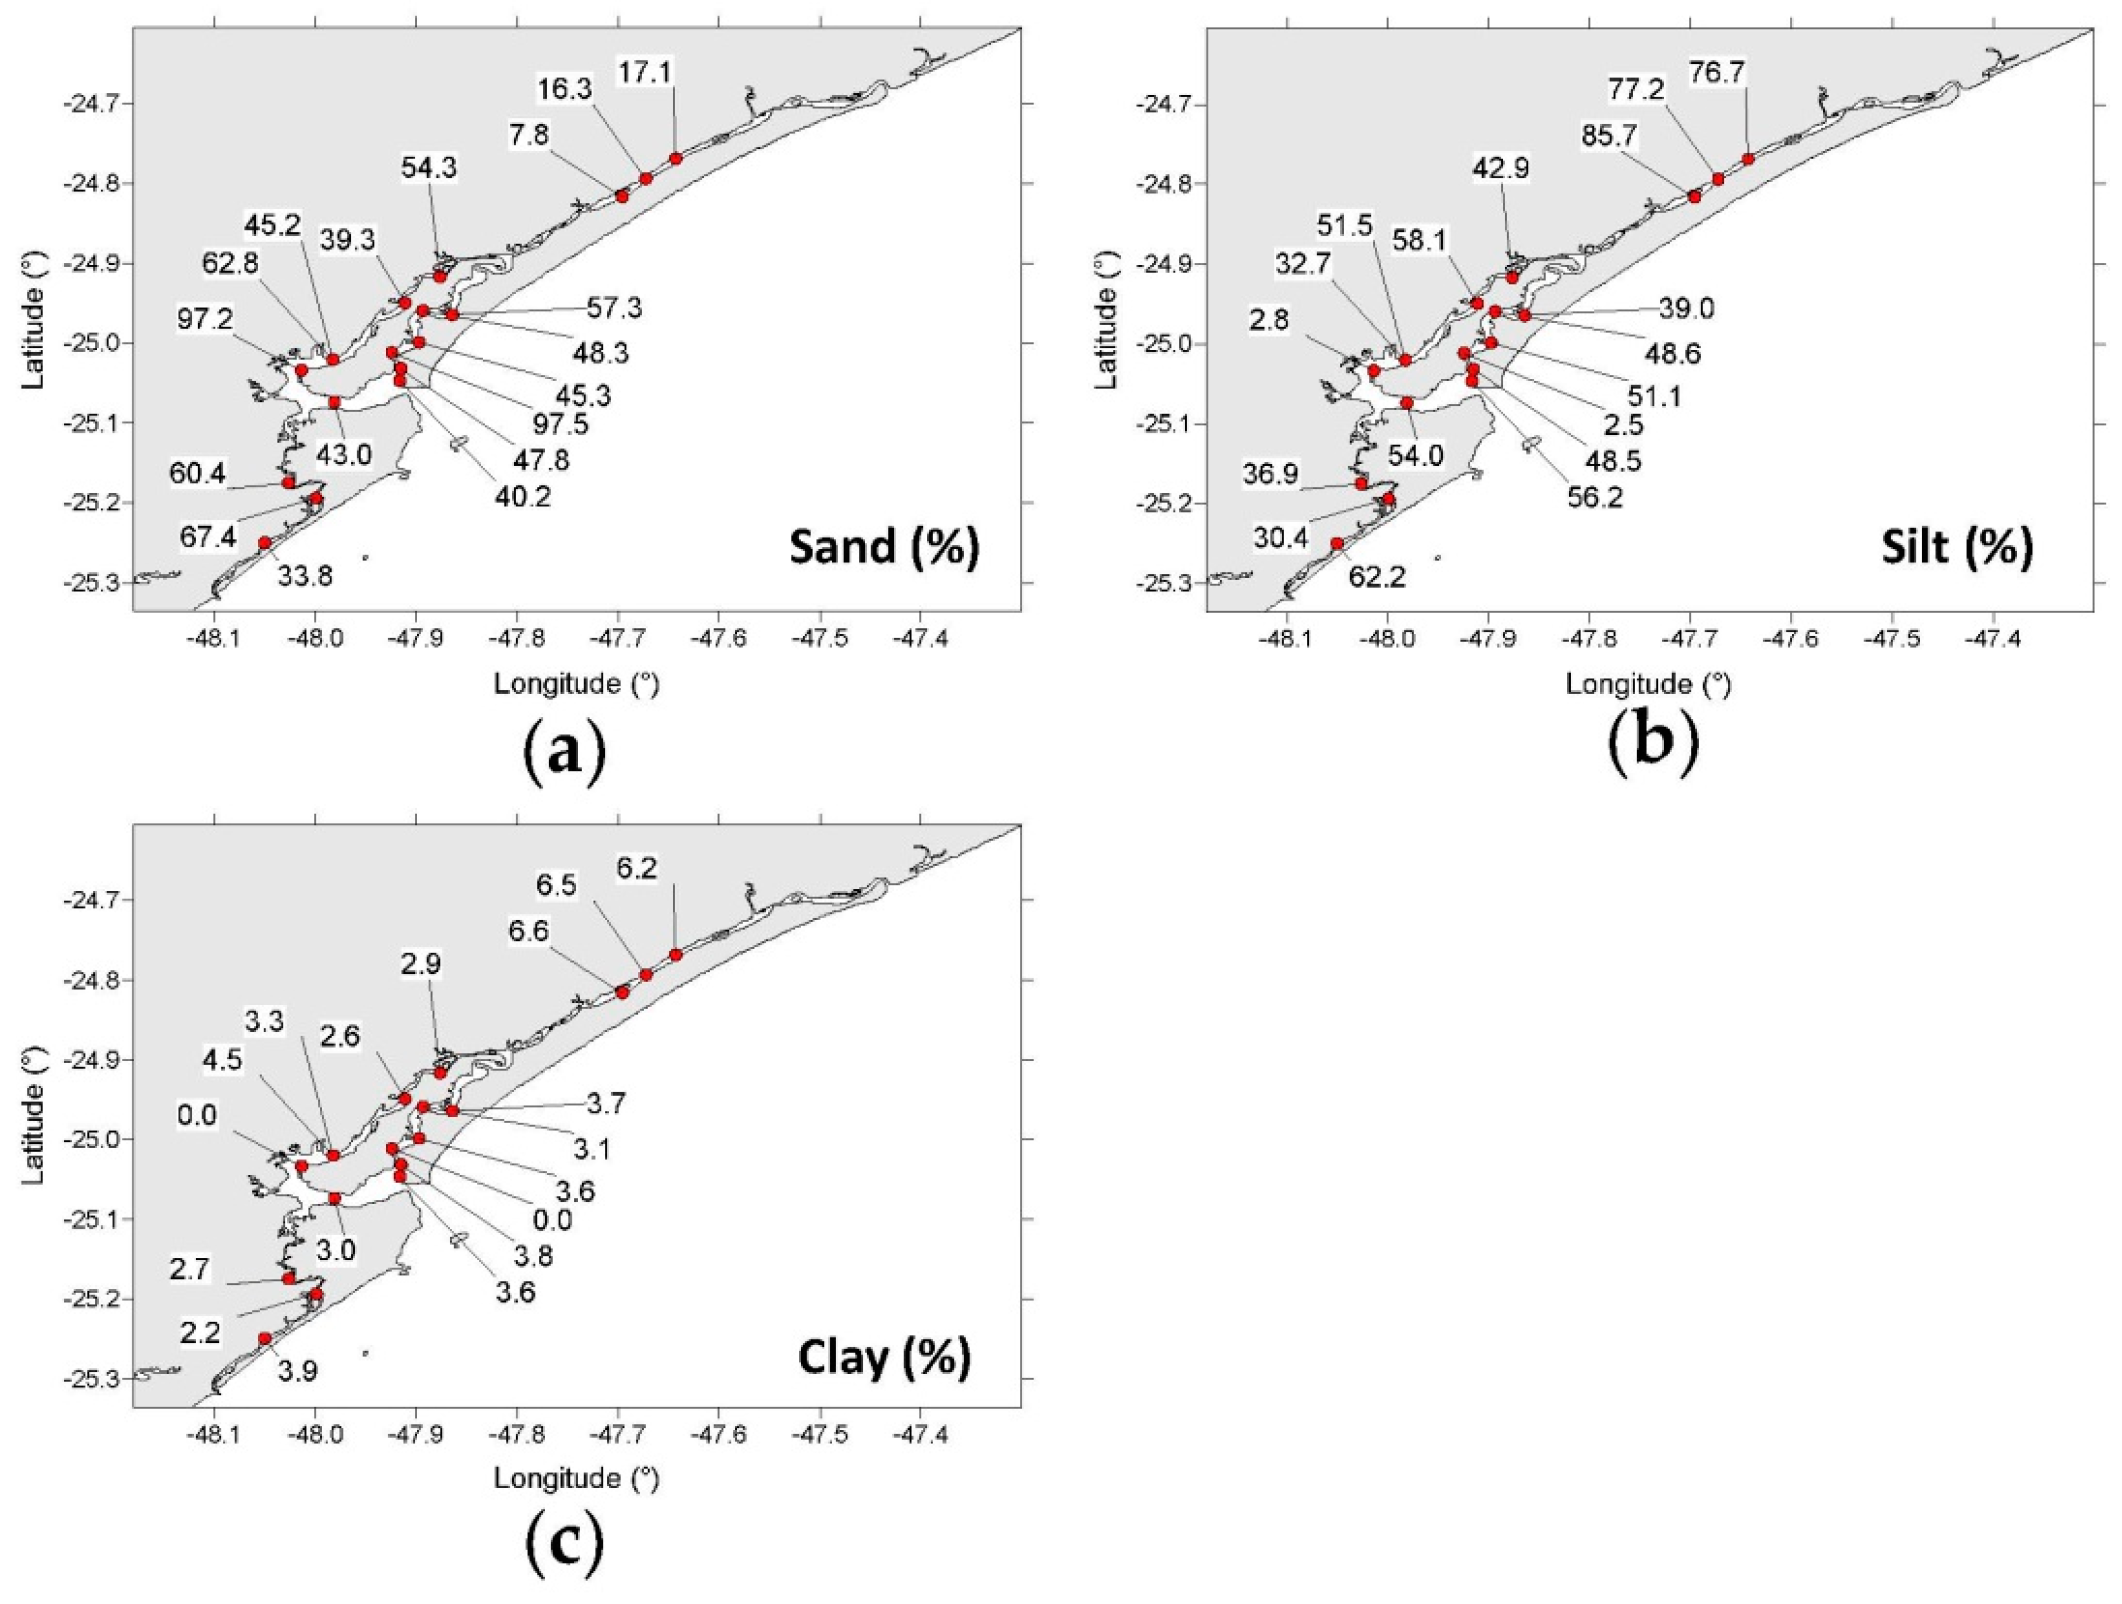
The grain size composition of the surface sediments collected in the study area is shown in Figure 2. Sand, silt, and clay content ranges were 7.78–97.5%, 2.53–85.7%, and 0.00–6.55%, respectively. Grain size distribution varied irregularly, with the exception of silt, which showed the highest abundance (average = 79.9 ±5.5%) in the NE sector (Mar Pequeno).
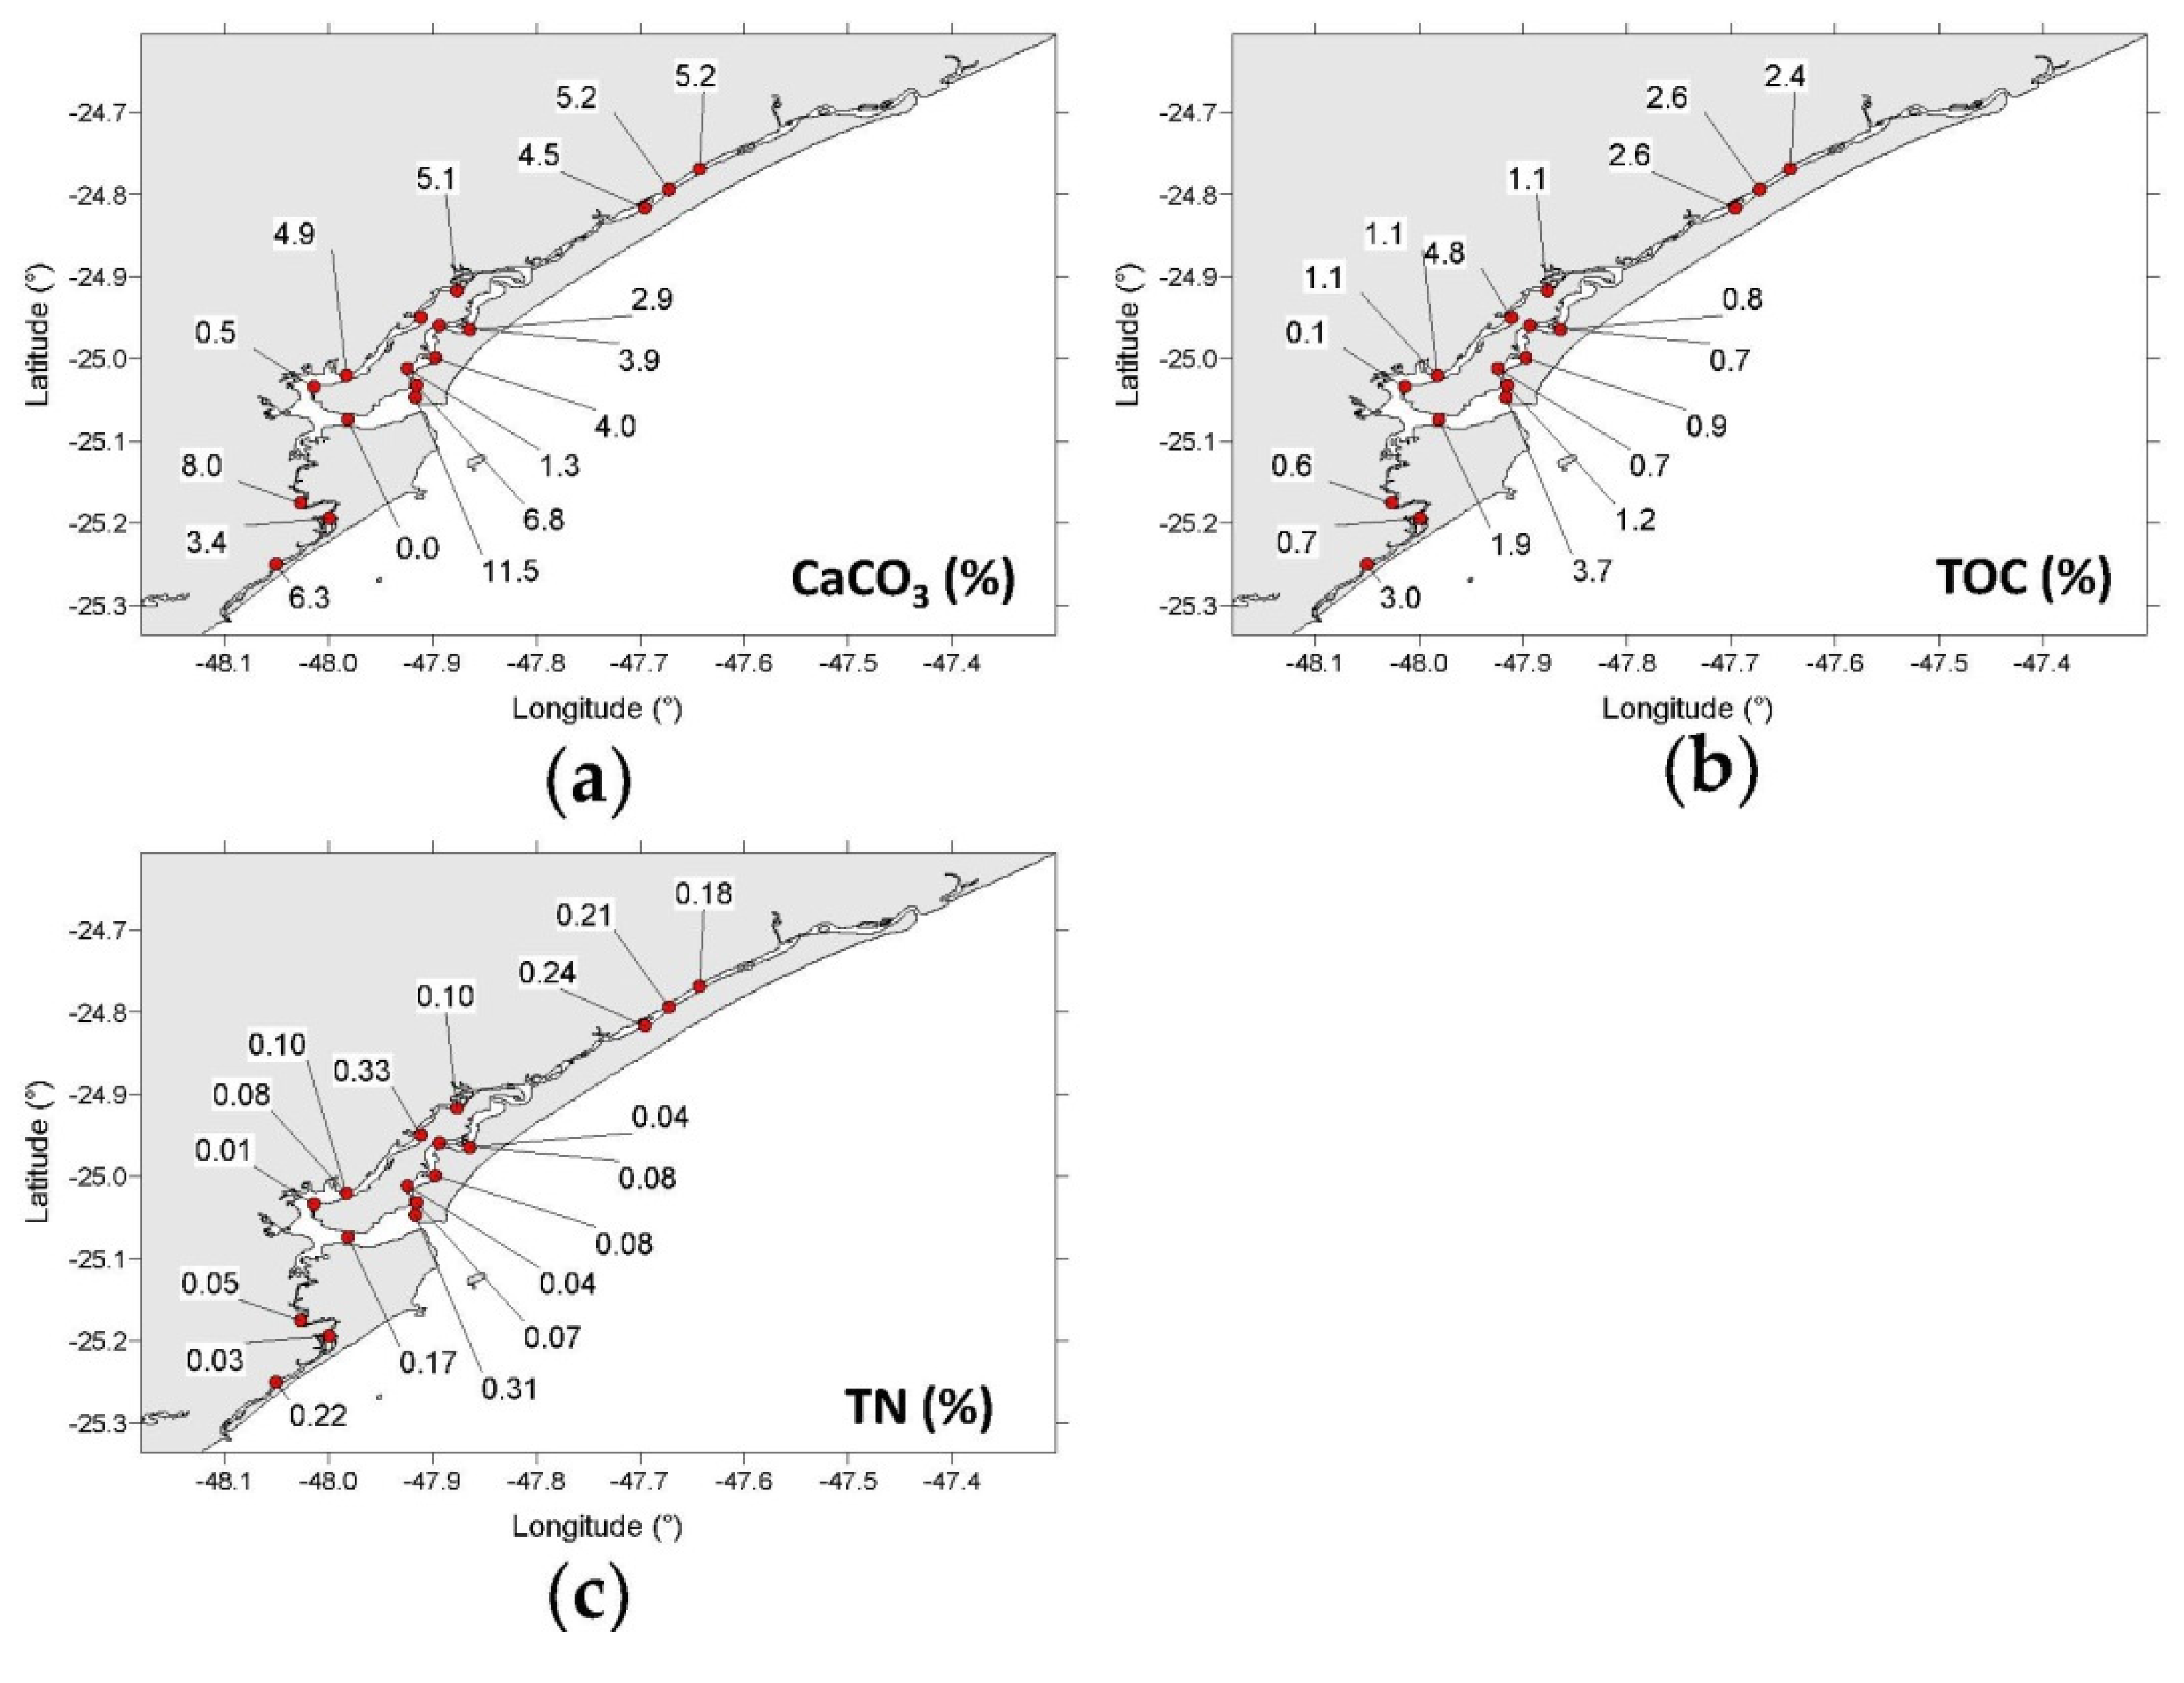
The mean CaCO3 content was 4.6%, ranging between 0.0% (to the west of Cananéia Island) and 11.5% (Cananéia inlet) (Figure 3a). TOC mean value was 1.7%, with maximum values close to the Cananéia and Ararapira inlets (3.7 and 3.0%, respectively) and in Mar Pequeno (2.4–2.6%) (Figure 3b). TN mean value was 0.13% (Figure 3c). As observed in the case of TOC, maximum TN values occurred close to the Cananéia and Ararapira inlets (0.31 and 0.22%, respectively) and in Mar Pequeno (0.18–0.24%) (Figure 3c). TOC/TN molar ratio varied between 21.8 and 9.6, and was found to be consistent with previous results provided by [48]. The results for each station are also reported in Table S1.

3.2. Concentration of HS

The concentration of HS in sediment mimics the spatial distribution patterns of TOC and TN. HS concentration ranged between 0.2 and 15.2 mg g−1 with maximum values close to the Cananéia and Ararapira inlets (9.98 and 11.0 mg g−1, respectively) and in Mar Pequeno (9.96–14.9 mg g−1). The spatial variability of the concentrations of FHA, BHA, and FA followed that of HS. Maximum, minimum, and mean concentrations, respectively, of FHA, BHA, and FA were: 9.2; 0.1 and 2.0 mg g−1 for FHA; 7.8; 0.0 and 2.1 mg g−1 for BHA; 3.9; 0.1 and 1.7 mg g−1 for FA (Figure 4). Maximum, minimum, and mean, respectively, of C/N were: 13.2; 5.8 and 9.3 for FHA; 18.6; 10.2 and 13.7 for BHA; 32.7; 19.0 and 23.4 for FA. The results for each station are also reported in Table S1.

3.3. δ13C Values of SOM, FHA, BHA and FA

δ13CSOM values varied from −28.3 to −24‰, becoming more negative from the Ararapira inlet toward the Valo Grande Canal (i.e., in a NE direction) (Figure 5). δ13C values of HS varied as follows: δ13CFHA from −28.0 to −21.6‰ (mean = −24.2‰), δ13CBHA from −27.2 to −22.0‰ (mean = −24.7‰), δ13CFA from −27.0 to −23.8‰ (mean = −26.0‰). The difference between the maximum and minimum δ13C values in FHA and BHA (6.5 and 5.2‰, respectively) was higher than in SOM (4.3‰) and in FA (3.2‰). As in the case of SOM, HA and FA became more 13C-depleted toward the NE sector of the study area, reflecting the proximity of Valo Grande Canal, which is affected by freshwater and terrestrial (13C-depleted) SOM from the Ribeira River. Relatively low δ13C values were also observed in Mar de Cubatão. The results for each station are also reported in Table S1.

3.4. Metal and Metalloid Contents in FHA, BHA, and FA

3.4.1. Copper, Chromium, Zinc, and Arsenic

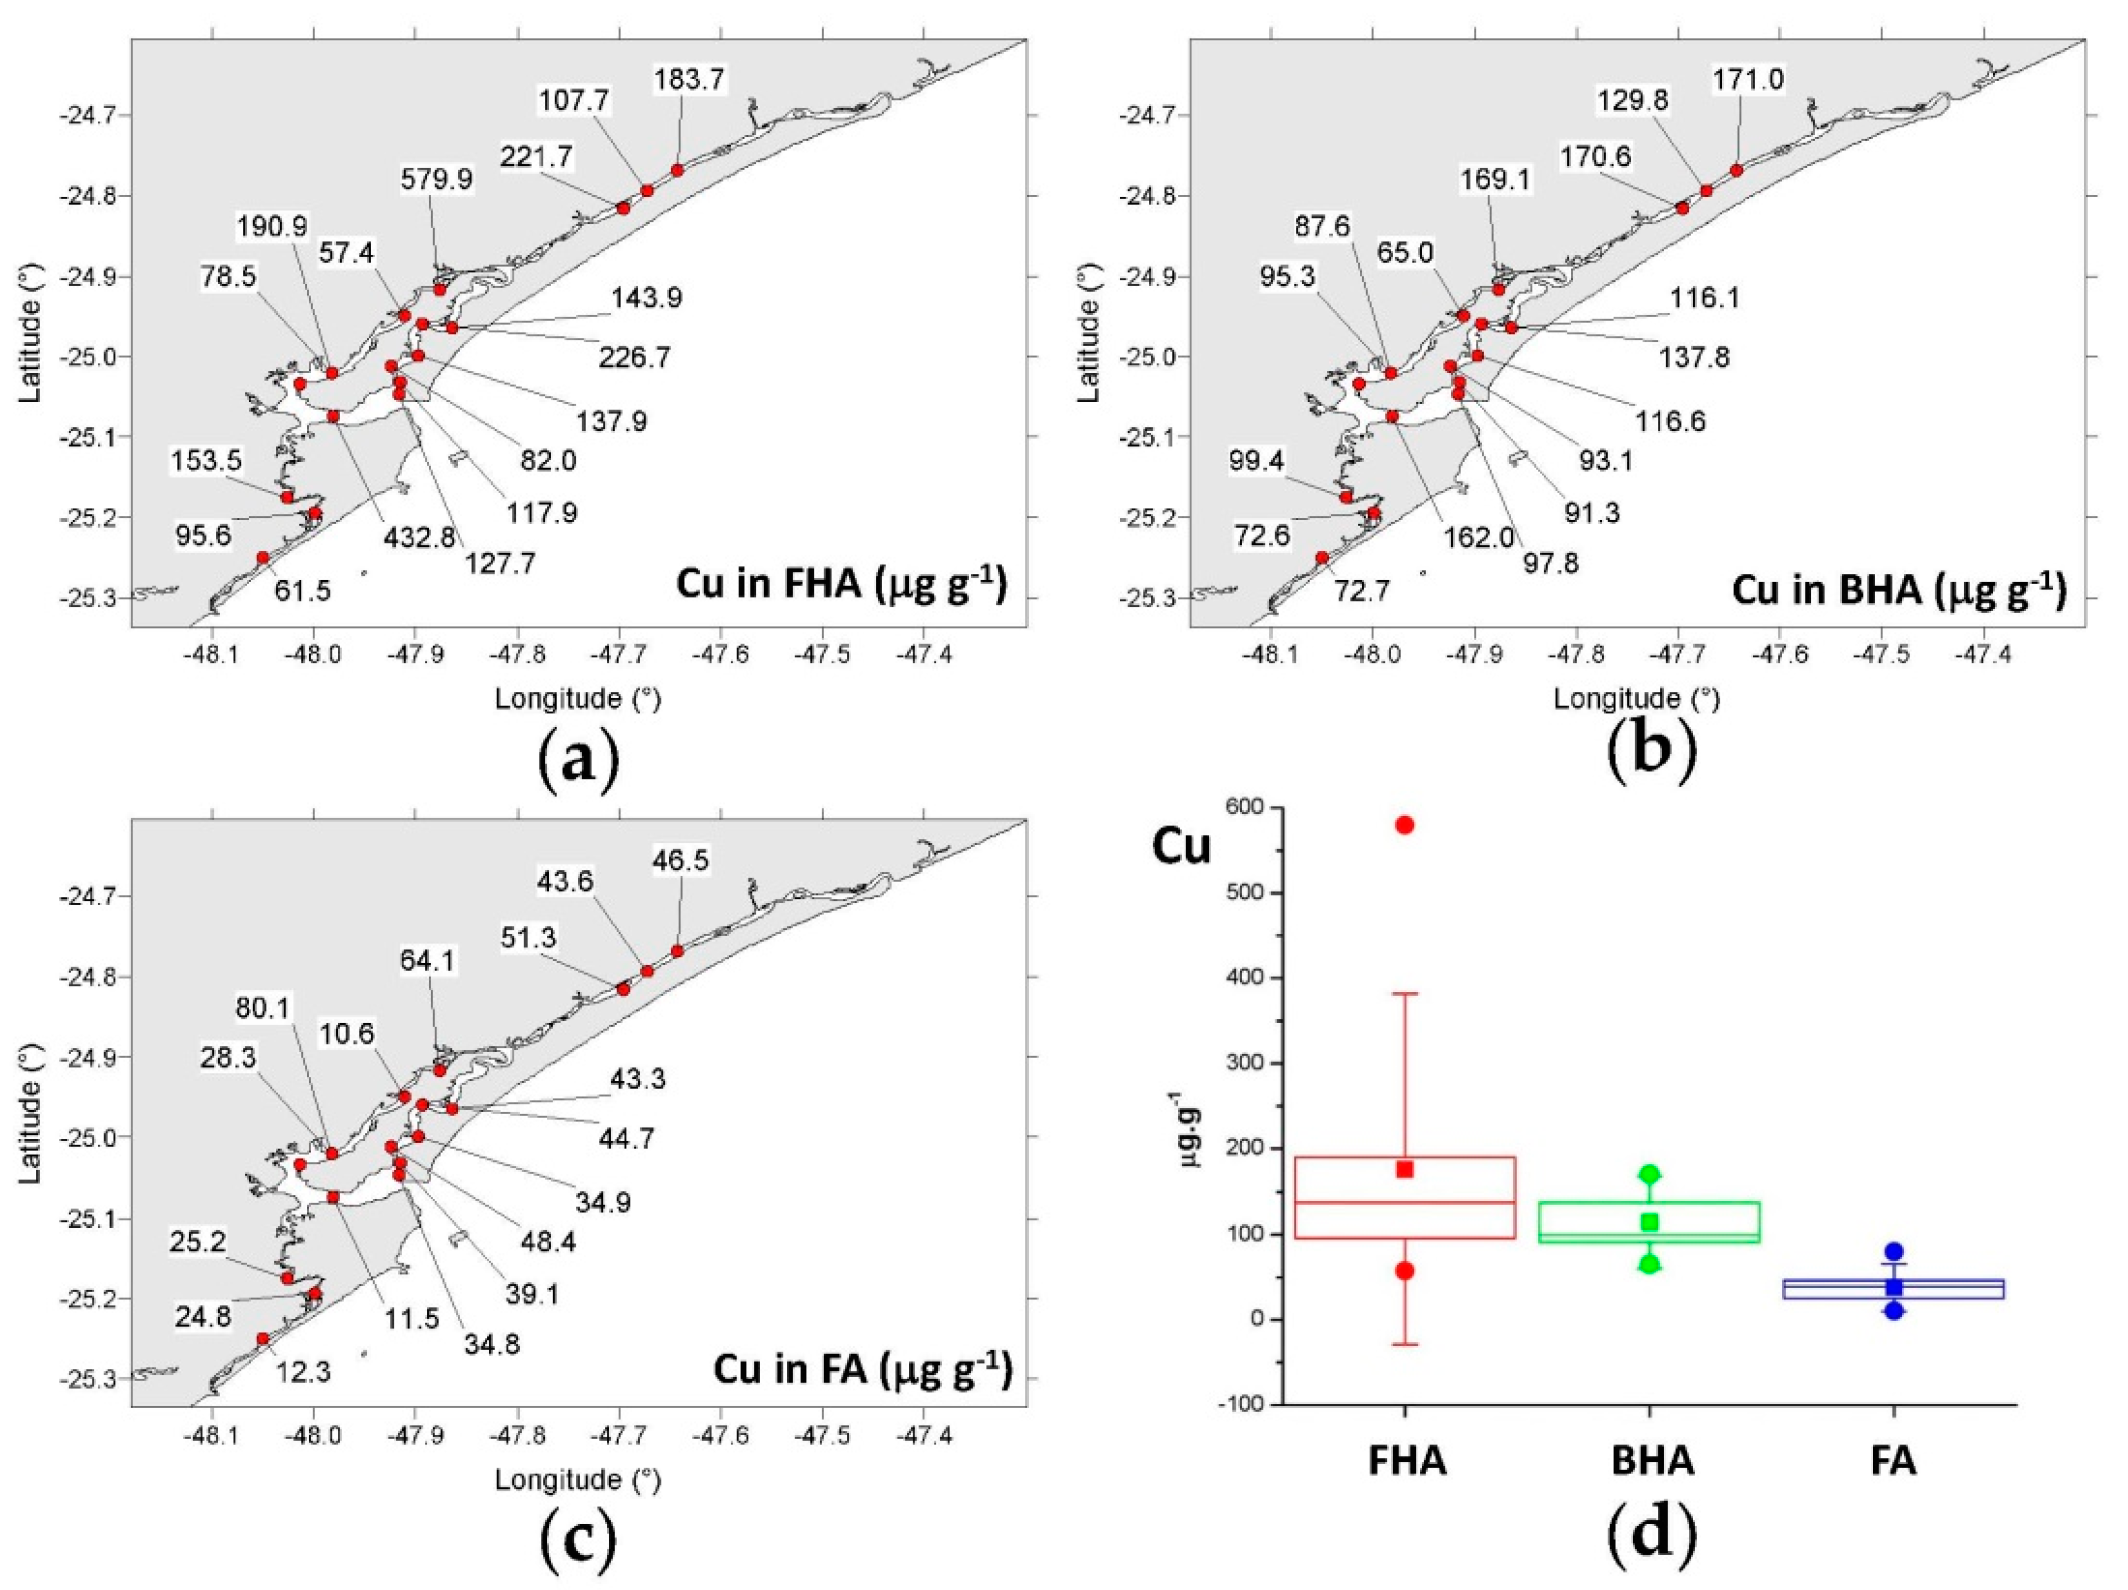
The highest concentration in HS was reached by Cu (Figure 6). Concentration ranges were:
  • FHA: 57.4–580 μg g−1 (mean = 176 μg g−1);
  • BHA: 65.0–171 μg g−1 (mean = 115 μg g−1);
  • FA: 10.6–80.1 μg g−1 (mean = 37.9 μg g−1).
Copper contents were highest in FHA, where they presented the highest dispersion of values about the mean. The absolute maximum of 580 μg g−1 was observed in the NE sector of Mar de Cubatão (Figure 6a). This value stood out considerably, exceeding the 1σ standard deviation of Cu concentrations in FHA. Copper concentration was relatively high also in FHA from the Trapandé Bay (424 μg g−1), Mar de Cananéia (227 μg g−1), and Mar Pequeno (108–222 μg g−1).
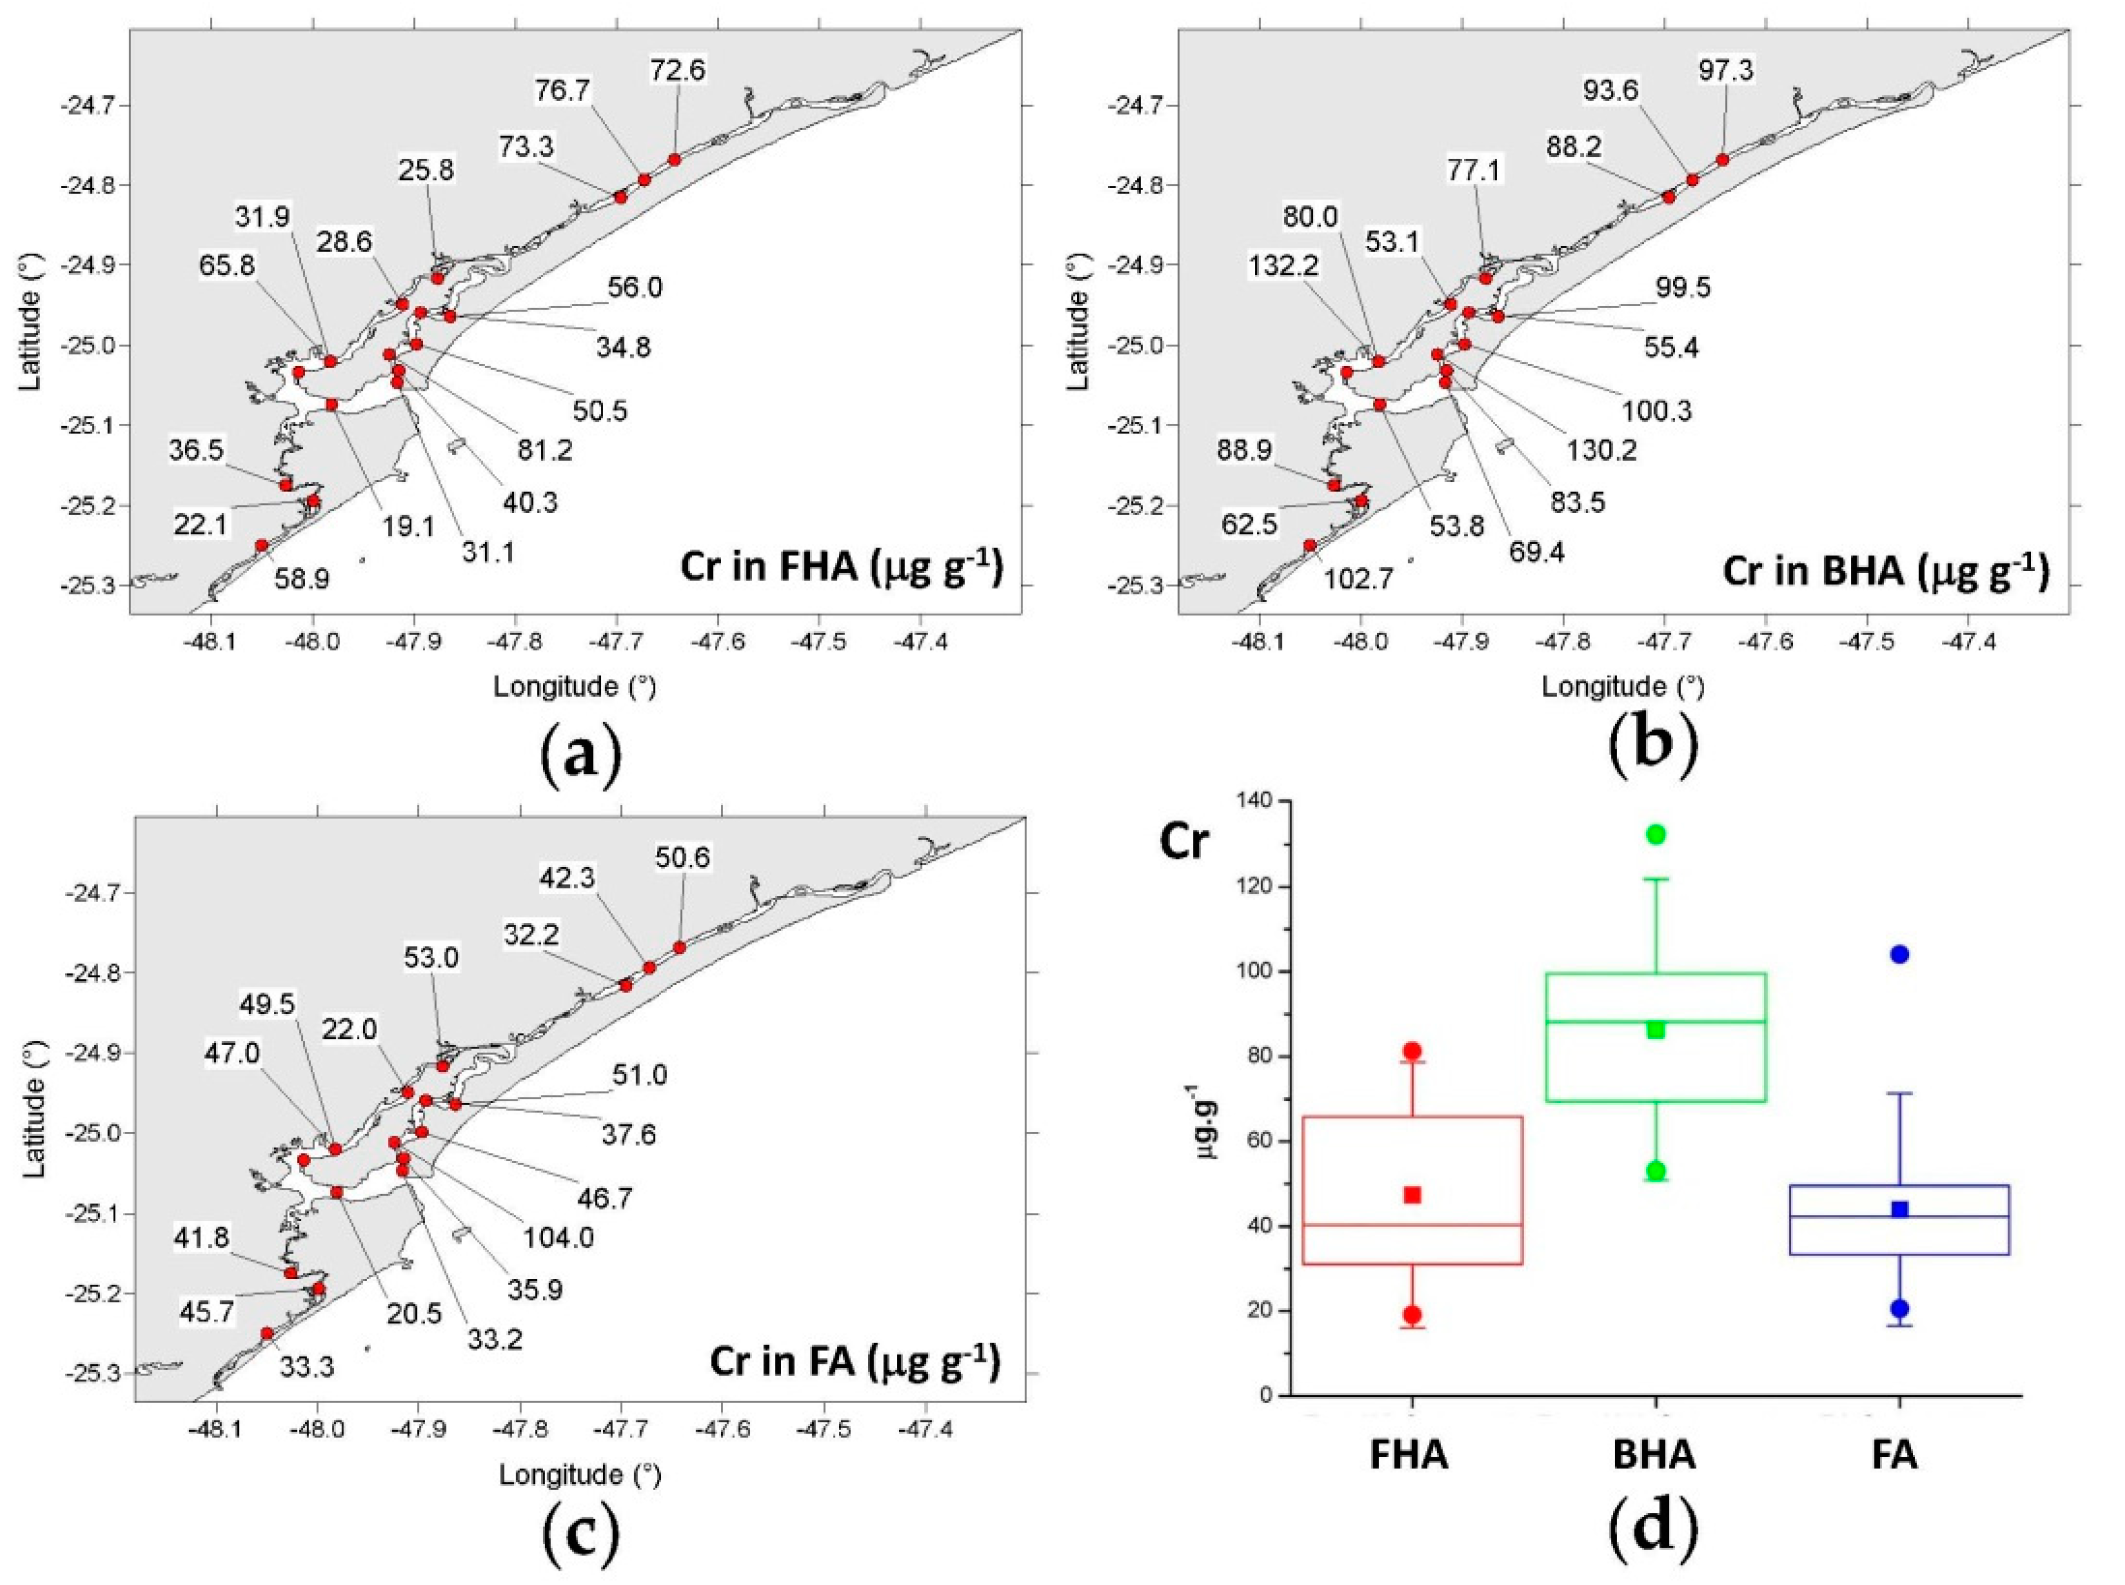
Chromium was the second-most abundant metal associated with HS (Figure 7). Concentrations ranges were:
  • FHA: 19.1–81.2 μg g−1 (mean = 47.4 μg g−1);
  • BHA: 53.1–132 μg g−1 (mean = 86.3 μg g−1);
  • FA: 20.5–104 μg g−1 (mean = 43.9 μg g−1).
Chromium concentration was highest in BHA, particularly near the city of Cananéia, at the Ararapira inlet and in the SW sector of Mar de Cubatão (Figure 7b).
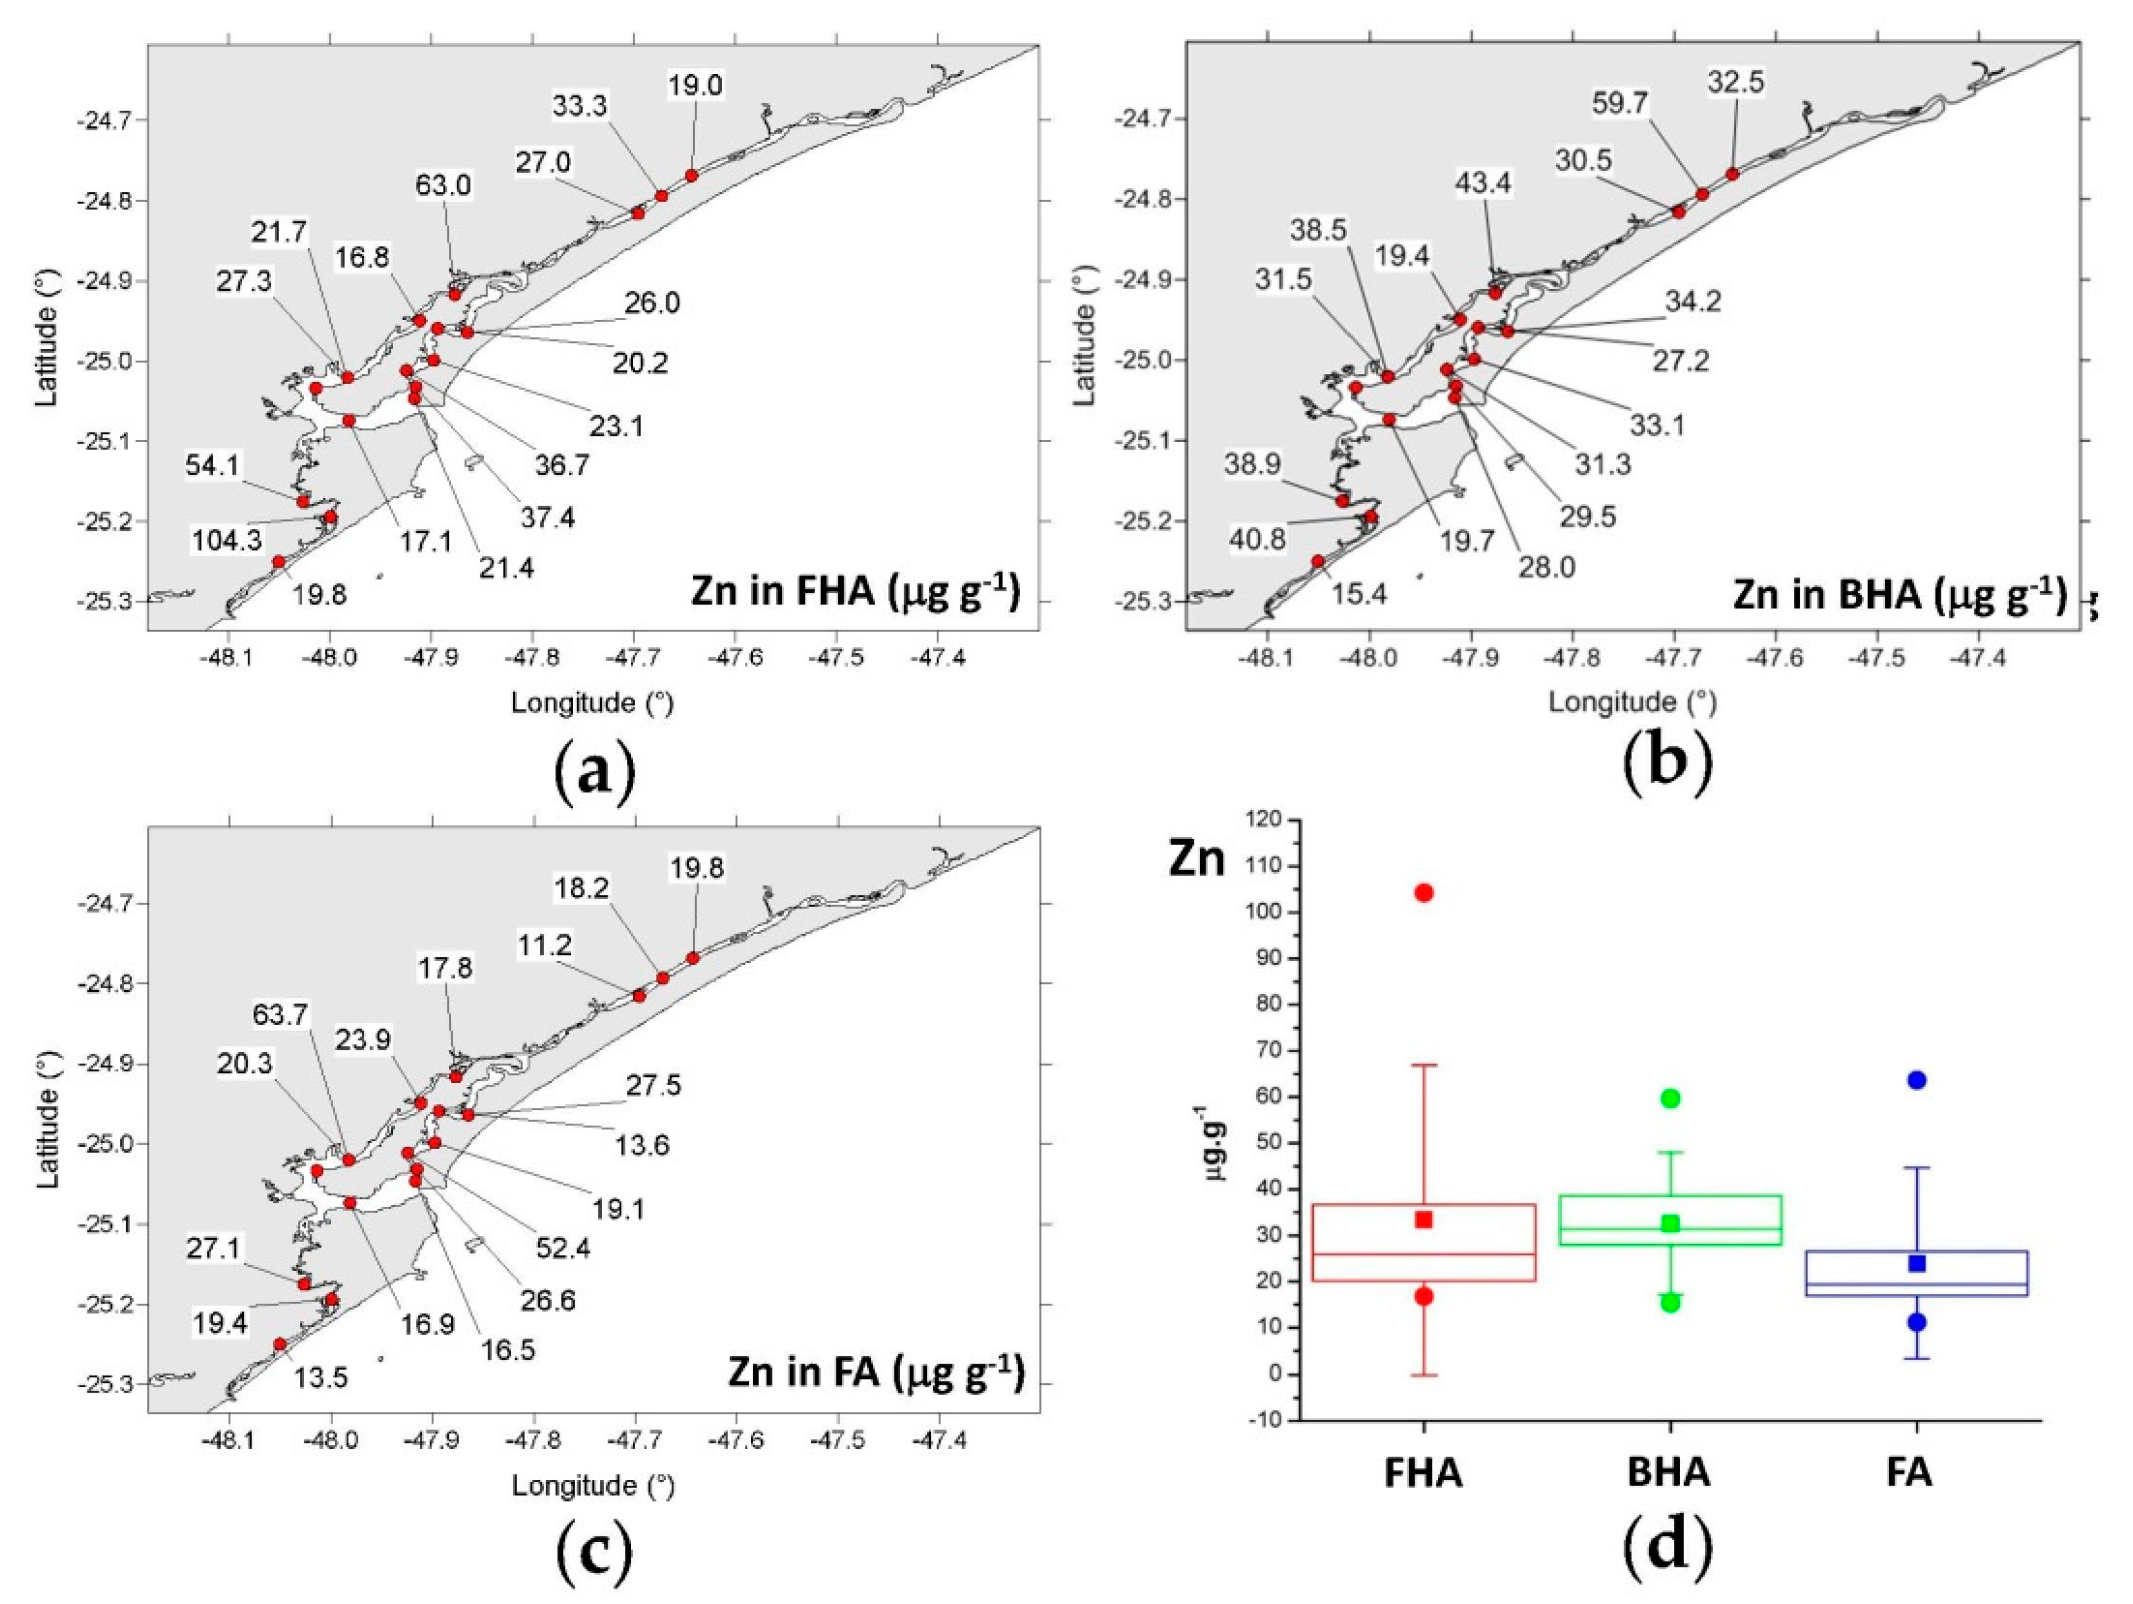
Zinc and As showed comparable concentrations and areal distributions (Figure 8 and Figure 9). Zn concentration ranges were:
  • FHA: 16.8–104 μg g−1 (mean = 33.4 μg g−1);
  • BHA: 15.4–59.7 μg g−1 (mean = 32.6 μg g−1);
  • FA: 11.2–63.7 μg g−1 (mean = 24.0 μg g−1).
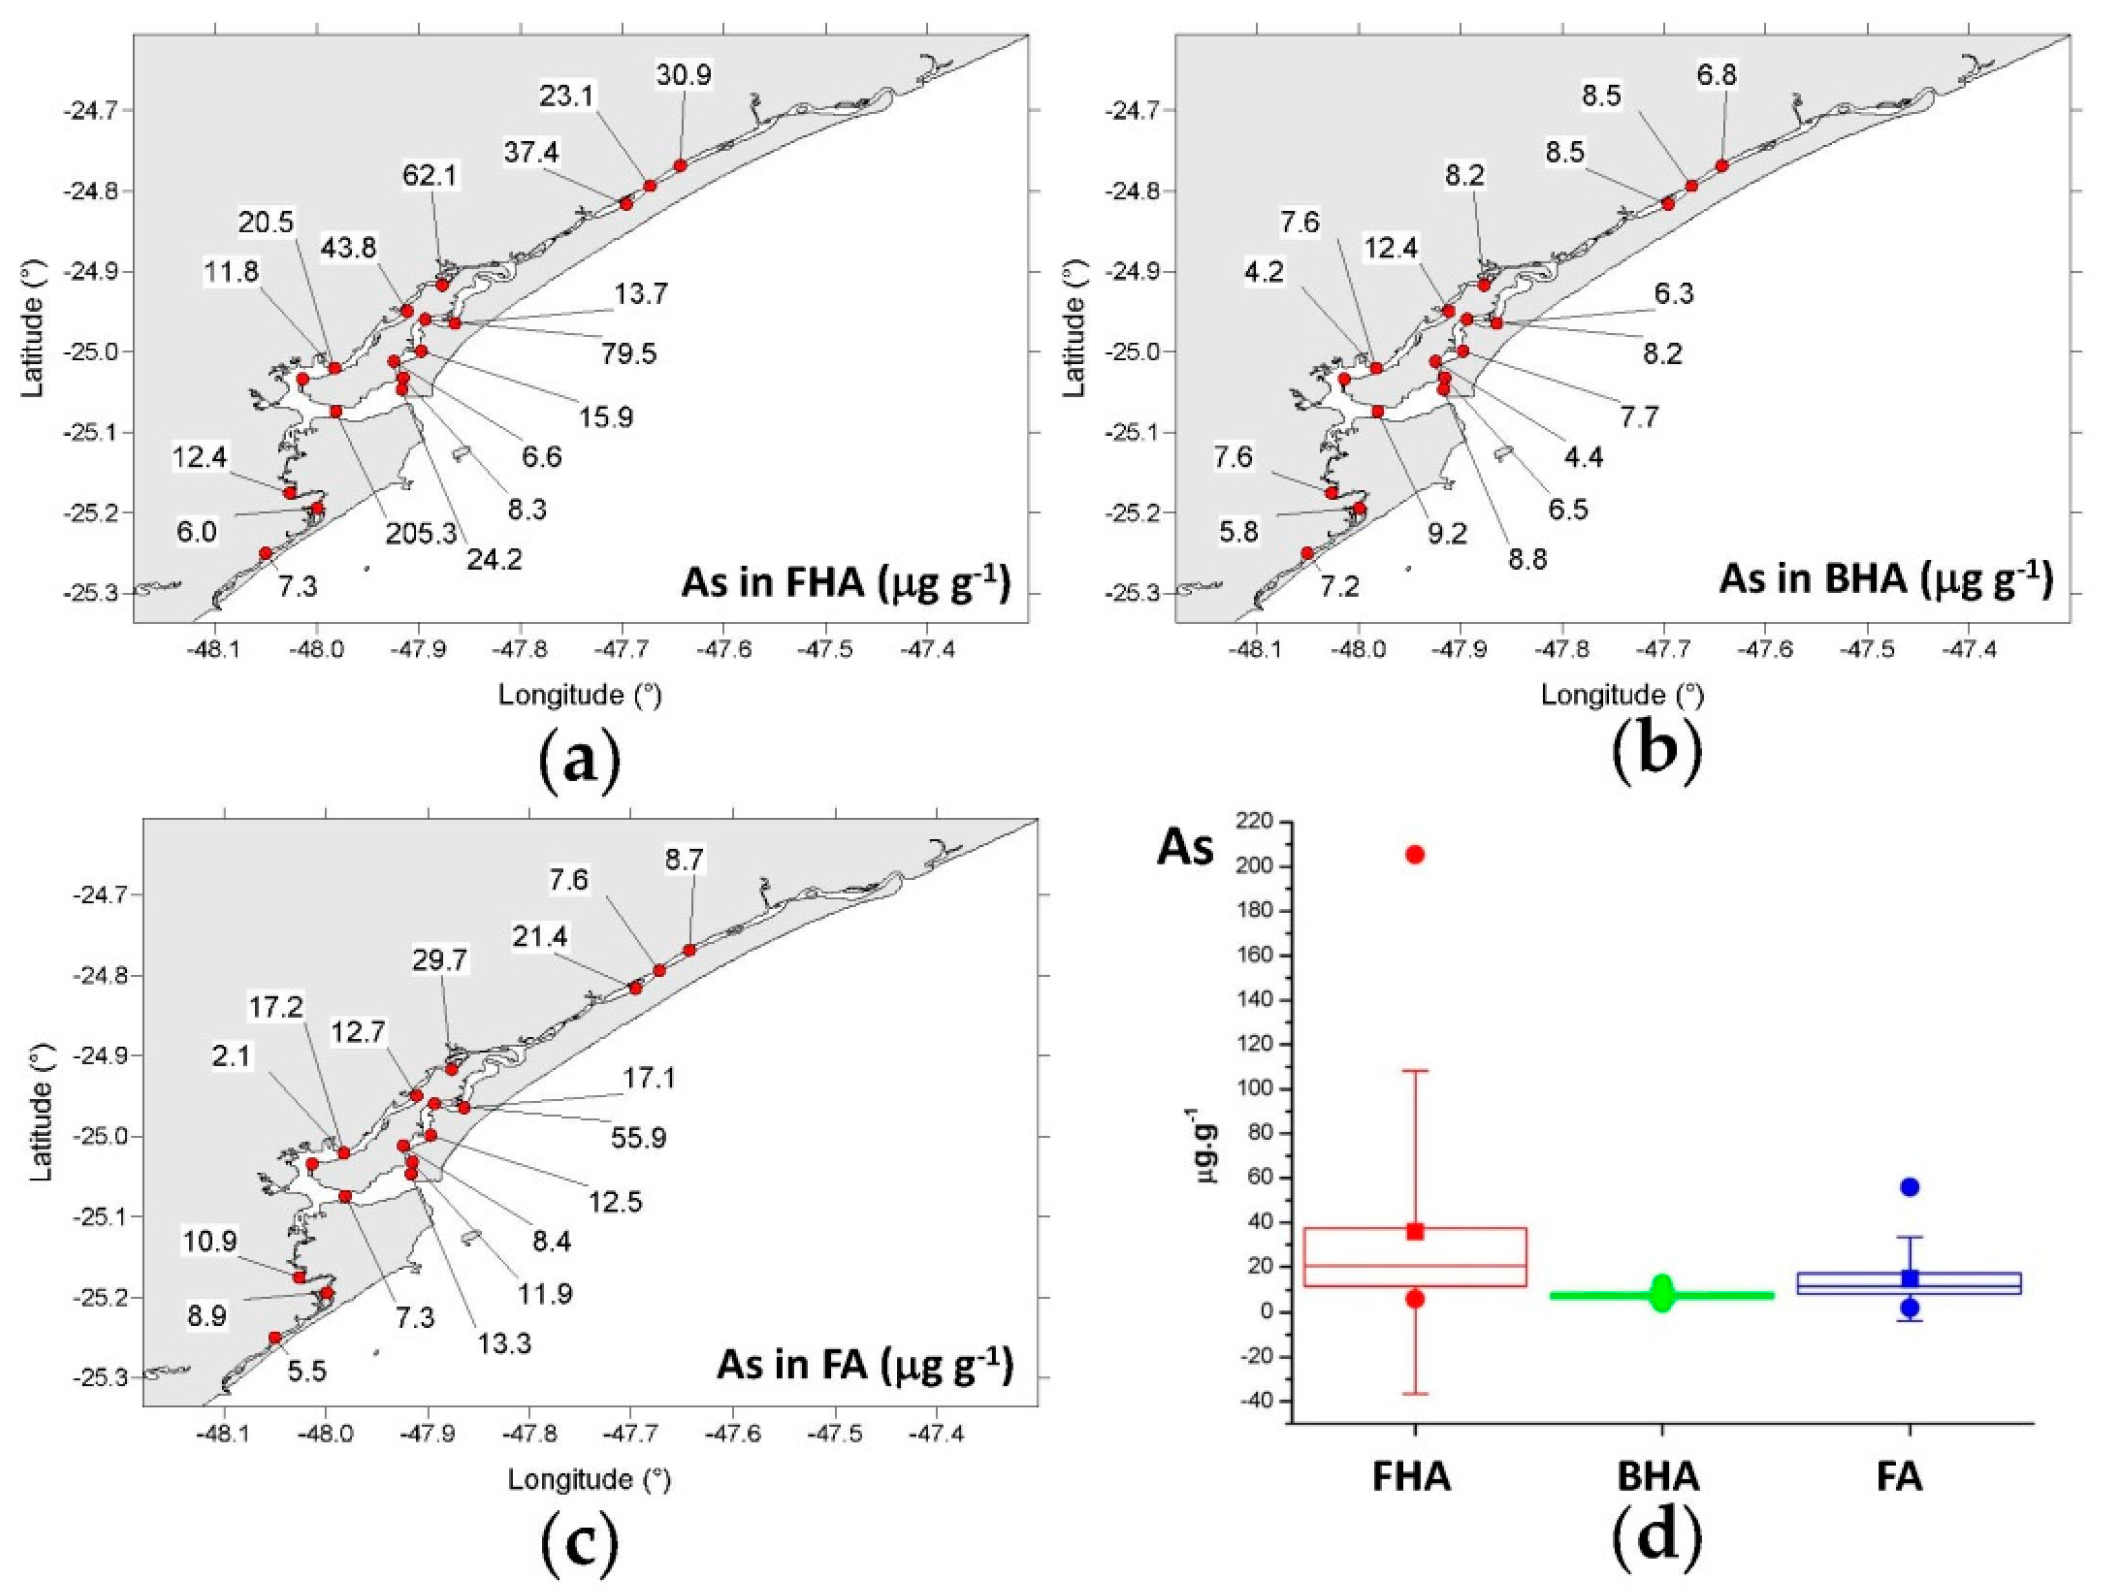
As concentration ranges were:
  • FHA: 6.00–205 μg g−1 (mean = 35.8 μg g−1);
  • BHA: 4.22–12.4 μg g−1 (mean = 7.53 μg g−1);
  • FA: 2.11–55.9 μg g−1 (mean = 14.8 μg g−1).
Both Zn and As showed maximum concentrations in FHA and relatively similar abundances in the three fractions of HS (Figure 8 and Figure 9). In terms of location, the maximum Zn and As concentrations were observed near the Ararapira inlet and in the Trapandé Bay, respectively. The results for each station are also reported in Table S2.

3.4.2. Nickel, Manganese, Vanadium, and Lead

Ni, Mn, V, and Pb concentrations in HS were generally lower than those observed for Cu, Cr, Zn, and As.
Ni concentrations ranges were:
  • FHA: 9.65–38.0 μg g−1 (mean = 23.0 μg g−1);
  • BHA: 14.8–45.5 μg g−1 (mean = 30.5 μg g−1);
  • FA: 2.26–10.6 μg g−1 (mean = 5.98 μg g−1).
Mn concentrations ranges were:
  • FHA: 6.98–50.0 μg g−1 (mean = 19.7 μg g−1);
  • BHA: 2.98–88.1 μg g−1 (mean = 20.9 μg g−1);
  • FA: 3.32–18.4 μg g−1 (mean = 7.90 μg g−1).
V concentrations ranges were:
  • FHA: 8.13–69.8 μg g−1 (mean = 23.2 μg g−1);
  • BHA: 6.01–71.9 μg g−1 (mean = 22.1 μg g−1);
  • FA: 1.16–10.2 μg g−1 (mean = 5.44 μg g−1).
Pb concentrations ranges were:
  • FHA: 1.30–18.7–1.3 μg g−1 (mean = 4.10 μg g−1);
  • BHA: 1.85–12.2 μg g−1 (mean = 5.76 μg g−1);
  • FA: 0.66–28.3 μg g−1 (mean = 3.82 μg g−1).
The results for each station are also reported in Table S2.

4. Discussion

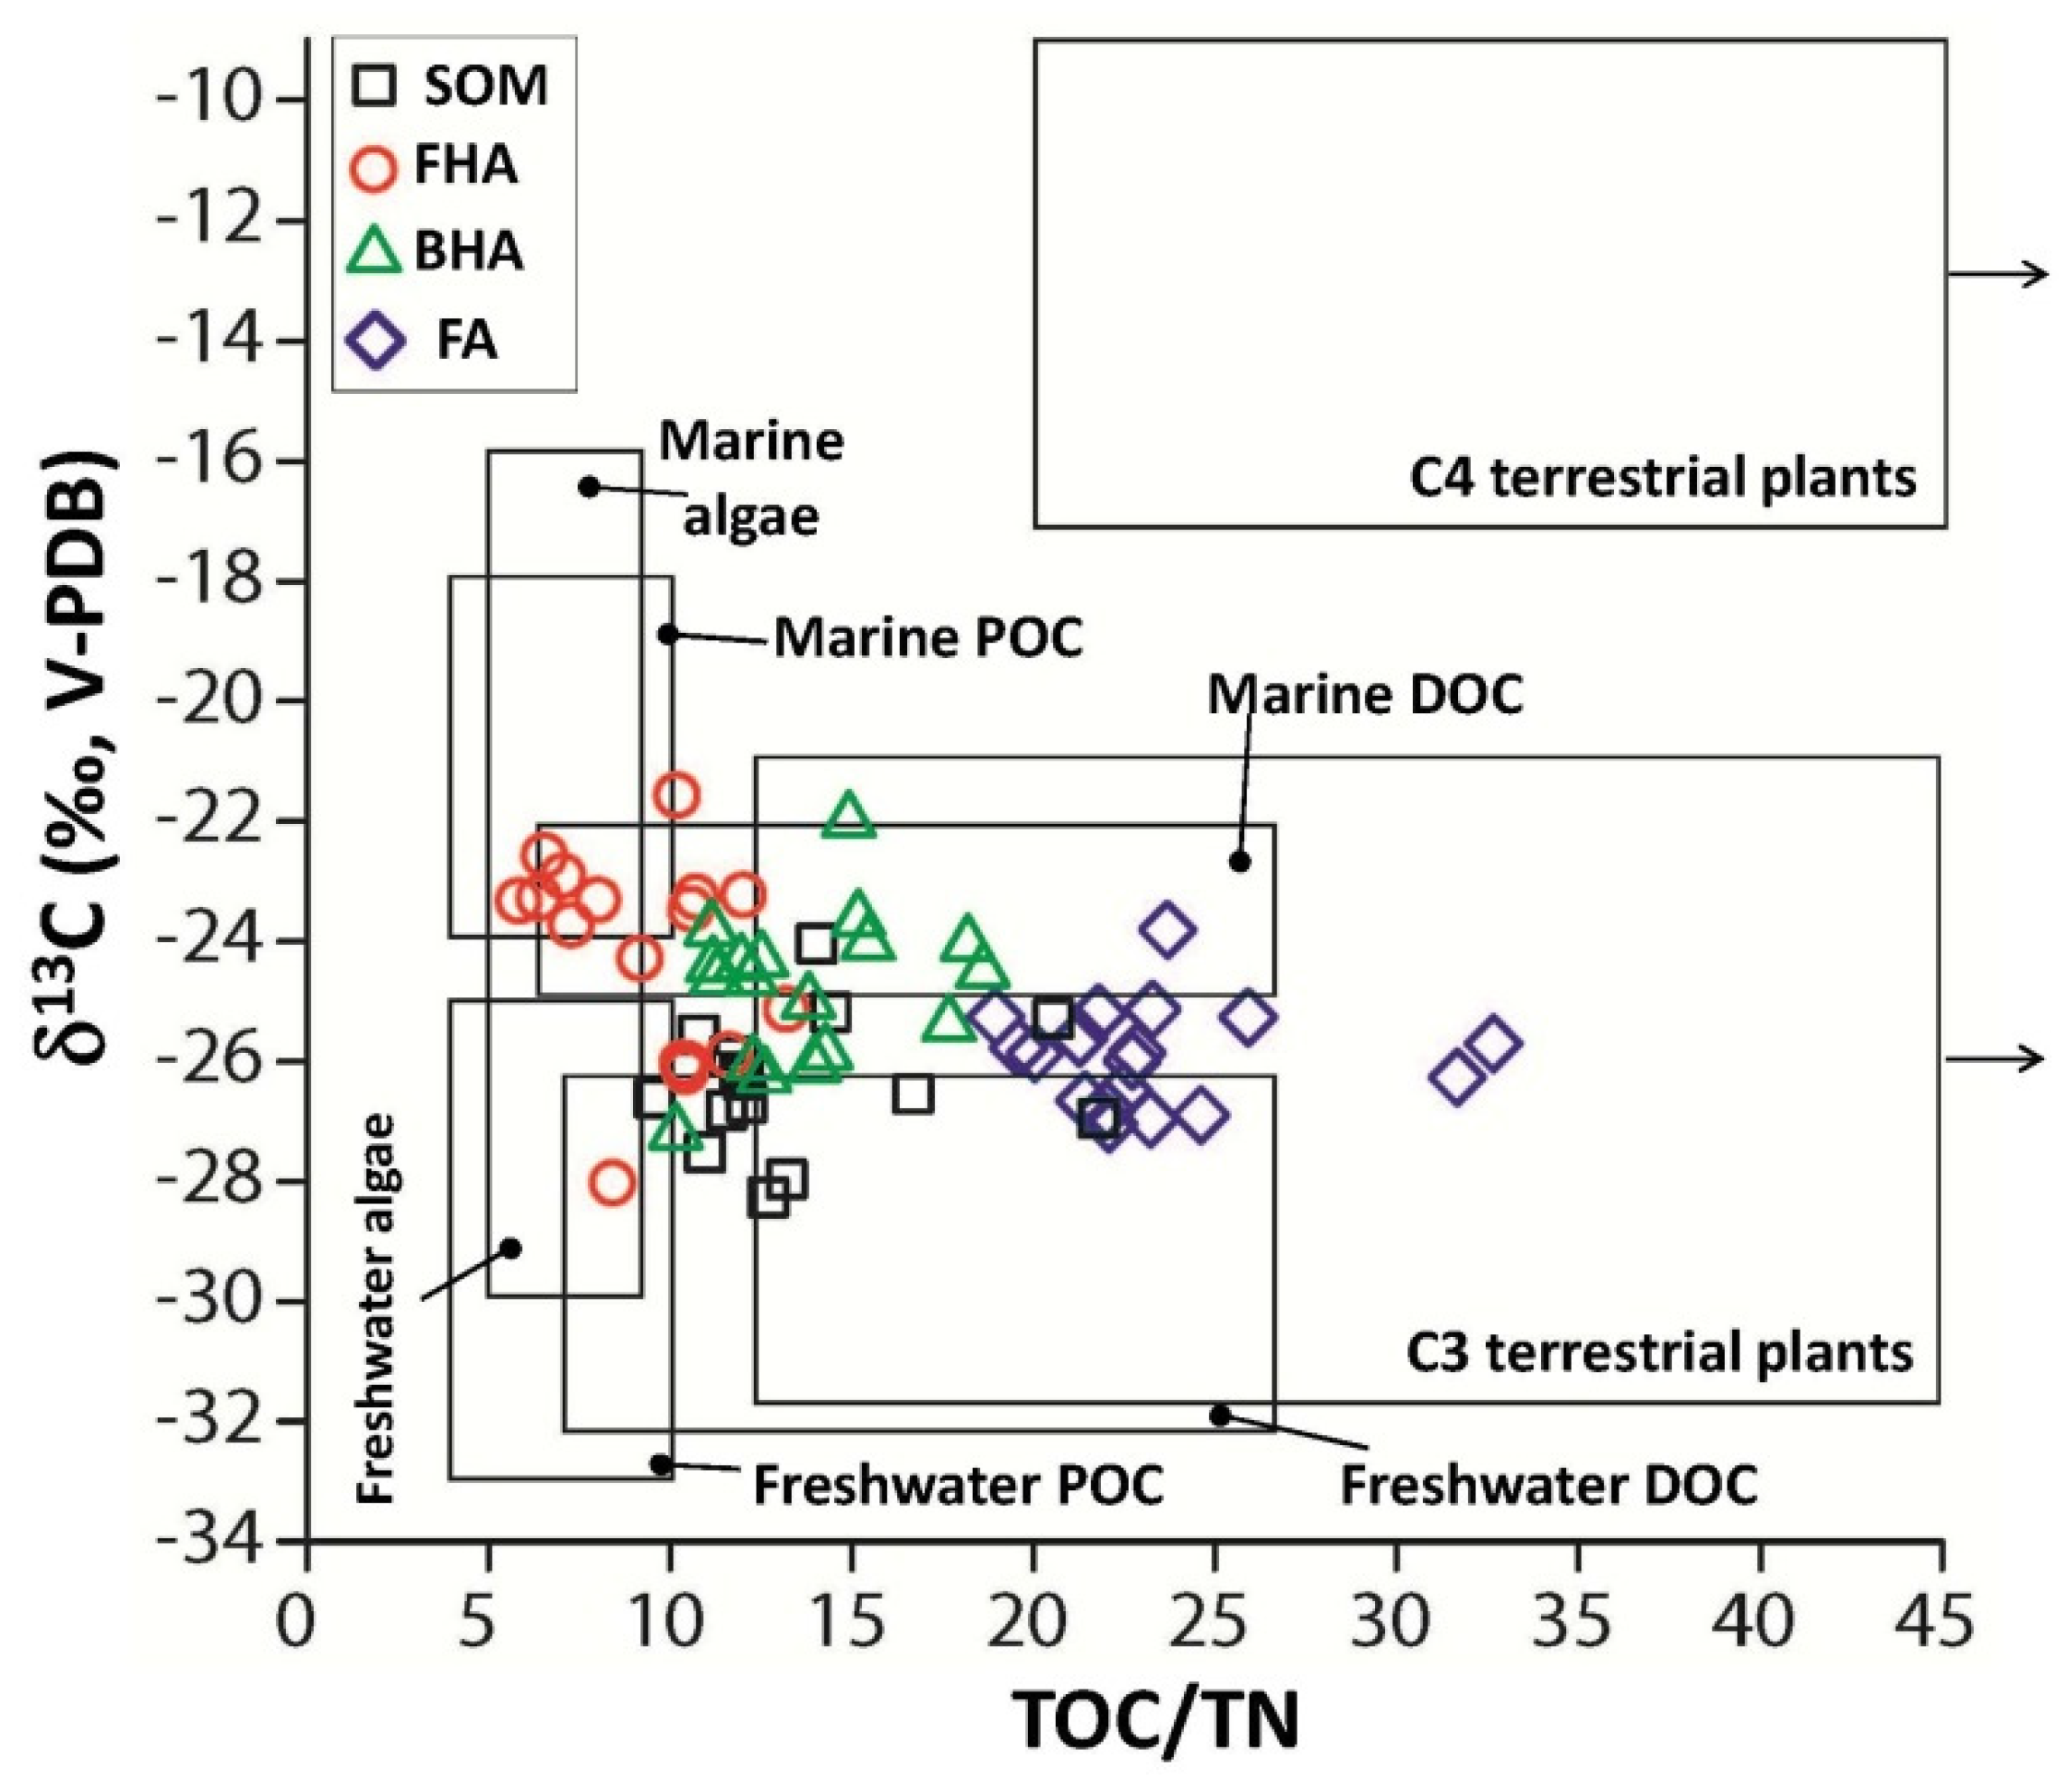
The source of SOM, FHA, BHA, and FA was identified based on their δ13C values and TOC/TN molar ratios. Figure 10 shows the cross plots of δ13C values against TOC/TN for the four components, superimposed to the fields corresponding to the geochemical signatures of different contributors to the aquatic organic matter, namely C3 and C4 plants, and freshwater and marine DOC, POC, and algae. Their characteristic δ13C vs. TOC/TN fields are after [18].
Marine compounds are 13C-enriched relative to their freshwater counterparts, whereas TOC/TN ratios in plants are higher than in algae. Overall, SOM and BHA showed a mixed (freshwater-marine) signature, the latter displaying a slightly higher marine contribution (Figure 10). FHA showed a dominant marine signature, with the exception of a few samples characterised by a freshwater signature. One of these samples was collected in Mar de Cubatão and showed a typical freshwater–algal signature (δ13CFHA = −28.0‰), whereas the others were collected in the NE sector of the study area (Mar Pequeno), thus suggesting the influence of the freshwater input from Valo Grande Canal.
FA showed a mixed δ13C signal and the highest TOC/TN ratios, reflecting the geochemical signature of C3 plants. This indicated that FA likely originated from the decay of organic matter derived from local mangroves, in line with previous data of [48], pointing out that mangrove plants leaved a significant isotopic imprint (δ13C ~ −25.6‰) in the sedimentary organic matter of the study area.
Regardless their source, both SOM and HS exhibited a distinct SW-NE 13C-depletion trend of the order of 1.5 to 2.0‰ (Figure 5). This 13C-depletion trend clearly reflected the increasing contribution of terrestrial organic matter linked to the freshwater input from the Valo Grande Canal. This behavior was also confirmed by the statistical correlation between the δ13C values of SOM, FHA, BHA, and FA. δ13CSOM, δ13CFHA, δ13CBHA, and δ13CFA showed Pearson’s correlation coefficients (r) of 0.89, 0.91, and 0.91, respectively (Table 1). The positive correlation was even higher (r = 0.90–0.98) among δ13CFHA, δ13CBHA, and δ13CFA. δ13CFHA showed a negative correlation (r = −0.82) with clay, which reinforced the conclusion drawn from their geochemical signature that FHA were dominantly of marine source.
The concentration of FHA showed negative correlation (r = −0.92) with sand and positive correlations with silt and clay (r = 0.92). Since FHA exhibited a dominant marine geochemical signature (Figure 10), the positive correlation with fine sediment may suggest that FHA underwent adsorption onto mud particles. Interestingly, the concentration of FHA was negatively correlated (r = −0.83) with δ13CFHA values (Table 1), suggesting that 13C-depleted FHA (i.e., FHA with a weaker marine signature) were more abundant.
In terms of metal content, FHA was the HS fraction with the maximum concentrations of bound Cu, Zn, and As (Figure 6, Figure 8, Figure 9 and Section 3.4.1.). These metals showed no correlation with one another, nor were they correlated with Pb, Cr, V, and Mn, with the exception of Cu and Pb (r = 0.77) (Table 2). This suggests a common origin for Cu and Pb, which was likely derived from mining residues. In turn, a positive correlation (r = 0.76–0.94) was observed among Cr, V, and Mn (Table 2), which was possibly derived from a common binding mechanism. In fact, contrary to Cu, Zn, and Pb; As, Cr, and V exist in the environment as oxyanions, whereas soluble Mn species include ionic couples with bicarbonate and sulphate ions [49].
Unlike FHA, the concentrations of BHA and FA were not correlated with grain size but were positively correlated with TOC and TN (r = 0.76–0.92) (Table 1). Both BHA and FHA geochemical signatures indicated a mixed or dominantly terrestrial origin (Figure 10). BHA was the HS fraction with the maximum concentration of Cr, whereas FA were depleted in all minerals, relative to FHA and BHA (Figure 6, Figure 7, Figure 8 and Figure 9). Like FHA, BHA also showed a positive correlation between V and Mn (Table 3), whereas FA did not show any significant correlation among metals (Table 4).
In summary, the order of metal binding in HS observed in this study was as follows:
  • FHA: Cu (57.4–579.9 μg g−1) > As (6.0–205.3 μg g−1) > Zn (16.8–104.3 μg g−1) > Cr (19.1–81.2 μg g−1) > V (8.1–69.8 μg g−1) > Mn (7.0–50.0 μg g−1) > Ni (9.6–38.0 μg g−1) > Pb (1.3–18.7 μg g−1).
  • BHA: Cu (65.0–171.0 μg g−1) > Cr (53.1–132.2 μg g−1) > Mn (31.0–88.1 μg g−1) > V (6.0–71.9 μg g−1) > Zn (15.4–59.7 μg g−1) > Ni (14.0–45.5 μg g−1) > As (4.2–12.4 μg g−1) > Pb (1.9–12.2- μg g−1).
  • FA: Cr (20.5–104.0 μg g−1) > Cu (10.6–80.1 μg g−1) > Zn (11.2–63.7 μg g−1) > As (2.1–55.9 μg g−1) > Pb (0.7–28.3 μg g−1) > Mn (3.3–18.4 μg g−1) > Ni (2.3–10.6 μg g−1) > V (1.2–10.2 μg g−1).
These data confirmed previous observations that Cu has a strong chemical affinity for HS, since Cu ions react with both the COOH and OH groups of humic ligands and tend to occupy most HS binding sites [33,50,51]. In this respect, results from this study added new information, indicating that FHA was the HS fraction with the highest affinity for Cu, BHA had the highest affinity for Cr, whereas As, Mn, Ni, V, Pb, and Zn showed the same affinity for HS, irrespective of the fraction considered.
This study is the first dealing with the concentration of complexed metals in HS in the Cananéia-Iguape estuarine–lagoon complex. Previous studies have dealt with metal concentration in SOM or in sediments. Considering the concentrations of Cr and As in SOM, ref. [41] reported Cr concentrations four times lower than those observed in this study, whereas As concentration in SOM were 40 times lower. As regards metal concentration in sediments, ref. [37] reported Cu and Zn concentrations in the range of 15–61 and 31–101 μg g−1, respectively. Recent work by [43] showed that the maximum concentrations of environmentally available Pb, Cu, and Zn were 178, 18.7, and 123 μg g−1, respectively. These values were significantly higher than those measured in 2003 by [52] (56, 35, and 74 μg g−1 for Pb, Cu, and Zn, respectively). Although these results are not directly comparable with those presented in this study (because they show metal concentrations per gram of sediment rather than per gram of HS), we can use them to show that, unlike Cu and Zn, Pb is relatively abundant in the sediment but shows low concentrations in HS. This aspect deserves to be investigated further, because it may be interesting in terms of environmental mobility of this potentially toxic metal.

5. Conclusions

The results presented in this study highlight the importance of HS as carriers and sinks for trace metals in tropical estuarine settings. In the Cananéia-Iguape estuarine–lagoon complex, a clear relationship between trace metal concentrations and HS was observed. Cu showed the highest chemical affinity for marine FHA associated with silt and clay. In turn, Cr showed the highest chemical affinity for terrestrial BHA and a positive correlation with TOC and TN. As, Mn, Ni, V, Pb, and Zn were also bound to HS but did not show preferential affinity for either FHA, BHA, or FA.
Although the Cananéia-Iguape estuarine–lagoon complex is evolving into a freshwater environment, marine HS play an important role in binding potentially toxic metals. In contrast, terrestrial FA present the lowest contribution to the retention of complexed metals in these sediments.

Supplementary Materials

The following are available online at https://www.mdpi.com/article/10.3390/app11188466/s1. Table S1: Coordinates of sampling locations and geochemical parameters measured, Table S2: Metal concentrations in FHA, BHA, and FA, Figure S1: Flow chart of the method to extract FHA, BHA, and FA from the sediment samples.

Author Contributions

Conceptualization, C.M., C.B., S.C. and E.d.S.B.; methodology, M.C. (Marco Contin) and M.D.N.; formal analysis, M.C. (Matteo Crosera), C.B., E.P. (Elena Pavoni), E.P. (Elisa Petranich) and B.O.S.; investigation, C.M., C.B., S.C. and E.d.S.B.; resources, C.M., C.d.M.S. and E.d.S.B.; data curation, C.M. and C.B.; writing—original draft preparation, C.M.; writing—review and editing, C.M., C.B., S.C., E.P. (Elena Pavoni), E.P. (Elisa Petranich), M.D.N., M.C. (Marco Contin) and E.d.S.B.; supervision, C.M.; project administration, C.M.; funding acquisition, C.M. All authors have read and agreed to the published version of the manuscript.

Funding

This research was funded by FUNDAÇÃO DE AMPARO À PESQUISA DO ESTADO DE SÃO PAULO (FAPESP), grant number FAPESP 2018/08738-2.

Acknowledgments

We thank the Captain and crew of the research boat Albacora (Sérgio Aparício, Avandiro Cubas, Ulisses Pires Paiva, Adriano Paiva), Clóvis Ribeiro Xavier Jr., and the staff of the Oceanographic Station of IOUSP in Cananéia. We thank Alexandre B. Salaroli, Gilberto P. Dias, Vitor G. Chiozzini and Glaucia Bueno Benedetti Berbel for technical support. We thank the Editors Bean Li and Hardy Liu, and two anonymous reviewers for their constructive comments, which greatly improved the quality of the manuscript.

Conflicts of Interest

The authors declare no conflict of interest. The funders had no role in the design of the study; in the collection, analyses, or interpretation of data; in the writing of the manuscript, or in the decision to publish the results.

References

  1. Coates, J.D.; Cole, K.A.; Chakraborty, R.; O’Connor, S.M.; Achenbach, L.A. Diversity and ubiquity of bacteria capable of utilizing humic substances as electron donors for anaerobic respiration. Appl. Environ. Microbiol. 2002, 68, 2445–2452. [Google Scholar] [CrossRef] [PubMed] [Green Version]
  2. Powlson, D.; Smith, P.; De Nobili, M. Soil organic matter. In Soil Conditions and Plant Growth; Gregory, P.J., Nortcliff, S., Eds.; Blackwell Publishing Ltd.: Oxford, UK, 2013; pp. 86–131. [Google Scholar]
  3. International Humic Substances Society (IHSS). Available online: https://humic-substances.org (accessed on 3 July 2021).
  4. Olk, D.C.; Cassman, K.G.; Fan, T.W.M. Characterization of two humic acid fractions from a calcareous vermiculitic soil: Implications for the humification process. Geoderma 1995, 65, 195–208. [Google Scholar] [CrossRef]
  5. De Nobili, M.; Contin, M.; Mahieu, N.; Randall, E.W.; Brookes, P.C. Assessment of chemical and biochemical stabilization of organic C in soils from the long-term experiments at Rothamsted (UK). Waste Manag. 2008, 28, 723–733. [Google Scholar] [CrossRef] [PubMed]
  6. Bravo, C.; Millo, C.; Covelli, S.; Contin, M.; De Nobili, M. Terrestrial-marine continuum of sedimentary natural organic matter in a mid-latitude estuarine system. J. Soils Sediments 2020, 20, 1074–1086. [Google Scholar] [CrossRef]
  7. Yang, R.; van den Berg, C.M.G. Metal Complexation by Humic Substances in Seawater. Environ. Sci. Technol. 2009, 43, 7192–7197. [Google Scholar] [CrossRef]
  8. Ashley, J.T.F. Adsorption of Cu(II) and Zn(II) by estuarine, riverine and terrestrial humic acids. Chemosphere 1996, 33, 2175–2187. [Google Scholar] [CrossRef]
  9. Orsetti, S.; Andrade, E.M.; Molina, F.V. Application of a constrained regularization method to extraction of affinity distributions: Proton and metal binding to humic substances. J. Colloid Interface Sci. 2009, 336, 377–387. [Google Scholar] [CrossRef] [PubMed]
  10. Alberts, J.J.; Filip, Z. Metal Binding in Estuarine Humic and Fulvic Acids: FTIR Analysis of Humic Acid-Metal Complexes. Environ. Technol. 1998, 19, 923–931. [Google Scholar] [CrossRef]
  11. Botero, W.G.; Souza, S.d.O.; Santos, O.S.; Oliveira, L.C.d.; Amarante, C.B.d. Influência das substâncias húmicas de sedimentos na biodisponibilidade de metais para o sistema aquático. Química Nova 2014, 37, 943–949. [Google Scholar] [CrossRef]
  12. Kinniburgh, D.G.; van Riemsdijk, W.H.; Koopal, L.K.; Borkovec, M.; Benedetti, M.F.; Avena, M.J. Ion binding to natural organic matter: Competition, heterogeneity, stoichiometry and thermodynamic consistency. Colloids Surf. A Physicochem. Eng. Asp. 1999, 151, 147–166. [Google Scholar] [CrossRef]
  13. Fengler, G.; Grossman, D.; Kersten, M.; Liebezeit, G. Trace metals in humic acids from recent Skagerrak sediments. Mar. Pollut. Bull. 1994, 28, 143–147. [Google Scholar] [CrossRef]
  14. Nissenbaum, A.; Swaine, D.J. Organic matter-metal interactions in Recent sediments: The role of humic substances. Geochim. Cosmochim. Acta 1976, 40, 809–816. [Google Scholar] [CrossRef]
  15. Wasserman, J.C.; Oliveira, F.B.L.; Bidarra, M. Cu and Fe associated with humic acids in sediments of a tropical coastal lagoon. Org. Geochem. 1998, 28, 813–822. [Google Scholar] [CrossRef]
  16. Schaeffer-Novelli, Y.; Mesquita, H.d.S.L.; Cintrón-Molero, G. The Cananéia Lagoon estuarine system, São Paulo, Brazil. Estuaries 1990, 13, 193–203. [Google Scholar] [CrossRef]
  17. Megens, L.; van der Plicht, J.; de Leeuw, J.W.; Smedes, F. Stable carbon and radiocarbon isotope compositions of particle size fractions to determine origins of sedimentary organic matter in an estuary. Org. Geochem. 2002, 33, 945–952. [Google Scholar] [CrossRef] [Green Version]
  18. Lamb, A.L.; Wilson, G.P.; Leng, M.J. A review of coastal palaeoclimate and relative sea-level reconstructions using δ13C and C/N ratios in organic material. Earth-Sci. Rev. 2006, 75, 29–57. [Google Scholar] [CrossRef]
  19. Keeling, C.D.; Whorf, T.P.; Wahlen, M.; van der Plichtt, J. Interannual extremes in the rate of rise of atmospheric carbon dioxide since 1980. Nature 1995, 375, 666–670. [Google Scholar] [CrossRef]
  20. Osmond, C.B.; Valaane, N.; Haslam, S.M.; Uotila, P.; Roksandic, Z. Comparisons of δ13C values in leaves of aquatic macrophytes from different habitats in Britain and Finland; some implications for photosynthetic processes in aquatic plants. Oecologia 1981, 50, 117–124. [Google Scholar] [CrossRef]
  21. Keeley, J.E.; Sandquist, D.R. Carbon: Freshwater plants. Plant Cell Environ. 1992, 15, 1021–1035. [Google Scholar] [CrossRef]
  22. Deines, P. Chapter 9—The Isotopic Composition of Reduced Organic Carbon. In The Terrestrial Environment, A; Fritz, P., Fontes, J.C., Eds.; Elsevier: Amsterdam, The Netherlands, 1980; pp. 329–406. [Google Scholar]
  23. Meyers, P.A. Preservation of elemental and isotopic source identification of sedimentary organic matter. Chem. Geol. 1994, 114, 289–302. [Google Scholar] [CrossRef] [Green Version]
  24. Haines, E.B. Stable carbon isotope ratios in the biota, soils and tidal water of a Georgia salt marsh. Estuar. Coast. Mar. Sci. 1976, 4, 609–616. [Google Scholar] [CrossRef]
  25. Salomons, W.; Mook, W.G. Field observations of the isotopic composition of particulate organic carbon in the southern North Sea and adjacent estuaries. Mar. Geol. 1981, 41, M11–M20. [Google Scholar] [CrossRef]
  26. Barth, J.A.C.; Veizer, J.; Mayer, B. Origin of particulate organic carbon in the upper St. Lawrence: Isotopic constraints. Earth Planet. Sci. Lett. 1998, 162, 111–121. [Google Scholar] [CrossRef]
  27. Middelburg, J.J.; Nieuwenhuize, J. Carbon and nitrogen stable isotopes in suspended matter and sediments from the Schelde Estuary. Mar. Chem. 1998, 60, 217–225. [Google Scholar] [CrossRef]
  28. Peters, K.E.; Sweeney, R.E.; Kaplan, I.R. Correlation of carbon and nitrogen stable isotope ratios in sedimentary organic matter 1. Limnol. Oceanogr. 1978, 23, 598–604. [Google Scholar] [CrossRef]
  29. Wada, E.; Minagawa, M.; Mizutani, H.; Tsuji, T.; Imaizumi, R.; Karasawa, K. Biogeochemical studies on the transport of organic matter along the Otsuchi River watershed, Japan. Estuar. Coast. Shelf Sci. 1987, 25, 321–336. [Google Scholar] [CrossRef]
  30. Bordovskiy, O.K. Sources of organic matter in marine basins. Mar. Geol. 1965, 3, 5–31. [Google Scholar] [CrossRef]
  31. Goñi, M.A.; Teixeira, M.J.; Perkey, D.W. Sources and distribution of organic matter in a river-dominated estuary (Winyah Bay, SC, USA). Estuar. Coast. Shelf Sci. 2003, 57, 1023–1048. [Google Scholar] [CrossRef]
  32. Otero, E.; Culp, R.; Noakes, J.E.; Hodson, R.E. The distribution and δ13C of dissolved organic carbon and its humic fraction in estuaries of southeastern USA. Estuar. Coast. Shelf Sci. 2003, 56, 1187–1194. [Google Scholar] [CrossRef]
  33. Rashid, M.A. Geochemistry of Marine Humic Compounds; Springer: New York, NY, USA, 1985; pp. 1–300. [Google Scholar]
  34. Abessa, D.M.d.S.; Morais, L.G.; Perina, F.C.; Davanso, M.B.; Rodrigues, V.G.S.; Martins, L.M.d.P.; Sígolo, J.B. Sediment geochemistry and climatic influences in a river influenced by former mining activities: The case of Ribeira de Iguape River, SP-PR, Brazil. Open J. Water Pollut. Treat. 2014, 1, 43–53. [Google Scholar] [CrossRef]
  35. Mahiques, M.M.d.; Burone, L.; Figueira, R.C.L.; Lavenére-Wanderley, A.A.d.O.; Capellari, B.; Rogacheski, C.E.; Barroso, C.P.; Samaritano dos Santos, L.A.; Cordero, L.M.; Cussioli, M.C. Anthropogenic influences in a lagoonal environment: A multiproxy approach at the valo grande mouth, Cananéia-Iguape system (SE Brazil). Braz. J. Oceanogr. 2009, 57, 325–337. [Google Scholar] [CrossRef]
  36. De Mahiques, M.M.; Figueira, R.C.L.; Salaroli, A.B.; Alves, D.P.V.; Gonçalves, C. 150 years of anthropogenic metal input in a Biosphere Reserve: The case study of the Cananéia–Iguape coastal system, Southeastern Brazil. Environ. Earth Sci. 2013, 68, 1073–1087. [Google Scholar] [CrossRef]
  37. Cruz, A.C.F.; Davanso, M.B.; Araujo, G.S.; Buruaem, L.M.; Santaella, S.T.; de Morais, R.D.; Abessa, D.M.S. Cumulative influences of a small city and former mining activities on the sediment quality of a subtropical estuarine protected area. Environ. Monit. Assess. 2014, 186, 7035–7046. [Google Scholar] [CrossRef]
  38. Mesquita, A.R.; Harari, J. Tides and Tide gauges of Cananeia and Ubatuba. Relat. Interno Inst. Oceanogr. USP 1983, 1, 14. [Google Scholar]
  39. Bérgamo, A.L. Caraterística da Hidrografia, Circulação e Transporte de Sal: Barra de Cananéia, Sul do Mar de Cananéia e Baia do Trapandé. Master Thesis, University of São Paulo, São Paulo, Brazil, 2000. [Google Scholar]
  40. De Mahiques, M.M.; Figueira, R.C.; Alves, D.P.; Italiani, D.M.; Martins, C.C.; Dias, J.M. Coastline changes and sedimentation related with the opening of an artificial channel: The Valo Grande Delta, SE Brazil. Anais Acad. Bras. Cienc. 2014, 86, 1597–1607. [Google Scholar] [CrossRef] [PubMed] [Green Version]
  41. Amorim, E.P.; Fávaro, D.I.T.; Berbel, G.B.B.; Braga, E.S. Assessment of metal and trace element concentrations in the Cananéia estuary, Brazil, by neutron activation and atomic absorption techniques. J. Radioanal. Nucl. Chem. 2008, 278, 485–489. [Google Scholar] [CrossRef]
  42. Tramonte, K.M.; Figueira, R.C.L.; de Lima Ferreira, P.A.; Ribeiro, A.P.; Batista, M.F.; de Mahiques, M.M. Environmental availability of potentially toxic elements in estuarine sediments of the Cananéia–Iguape coastal system, Southeastern Brazil. Mar. Pollut. Bull. 2016, 103, 260–269. [Google Scholar] [CrossRef] [PubMed]
  43. Tramonte, K.M.; Figueira, R.C.L.; Majer, A.P.; de Lima Ferreira, P.A.; Batista, M.F.; Ribeiro, A.P.; de Mahiques, M.M. Geochemical behavior, environmental availability, and reconstruction of historical trends of Cu, Pb, and Zn in sediment cores of the Cananéia-Iguape coastal system, Southeastern Brazil. Mar. Pollut. Bull. 2018, 127, 1–9. [Google Scholar] [CrossRef]
  44. Azevedo, J.S.; Braga, E.S.; Favaro, D.T.; Perretti, A.R.; Rezende, C.E.; Souza, C.M.M. Total mercury in sediments and in Brazilian Ariidae catfish from two estuaries under different anthropogenic influence. Mar. Pollut. Bull. 2011, 62, 2724–2731. [Google Scholar] [CrossRef]
  45. Fernandez, W.S.; Dias, J.F.; Boufleur, L.A.; Amaral, L.; Yoneama, M.L.; Dias, J.F. Bioacumulation of trace elements in hepatic and renal tissues of the white mullet Mugil curema Valenciennes, 1836 (Actinopterygii, Mugilidae) in two coastal systems in southeastern Brazil. Nucl. Instrum. Methods Phys. Res. Sect. B Beam Interact. Mater. At. 2014, 318, 94–98. [Google Scholar] [CrossRef]
  46. Barbieri, E. Concentration of heavy metals in tissues of green turtles (Chelonia mydas) sampled in the Cananéia estuary, Brazil. Braz. J. Oceanogr. 2009, 57, 243–248. [Google Scholar] [CrossRef]
  47. Shepard, F.P. Nomenclature based on sand-silt-clay ratios. J. Sediment. Res. 1954, 24, 151–158. [Google Scholar]
  48. Barcellos, R.L.; Camargo, P.B.; Galvão, A.; Weber, R.R. Sedimentary Organic Matter in Cores of the Cananéia-Iguape Lagoonal Estuarine System, São Paulo State, Brazil. J. Coast. Res. 2009, SI 56, 1335–1339. [Google Scholar]
  49. Hem, J.D. Chemical equilibria affecting the behavior of Manganese in natural water. Int. Assoc. Sci. Hydrol. Bull. 1963, 8, 30–37. [Google Scholar] [CrossRef]
  50. Manunza, B.; Deiana, S.; Maddau, V.; Gessa, C.; Seeber, R. Stability Constants of Metal-Humate Complexes: Titration Data Analyzed by Bimodal Gaussian Distribution. Soil Sci. Soc. Am. J. 1995, 59, 1570–1574. [Google Scholar] [CrossRef]
  51. De la Rosa, J.M.; Santos, M.; Araújo, M.F. Metal binding by humic acids in recent sediments from the SW Iberian coastal area. Estuar. Coast. Shelf Sci. 2011, 93, 478–485. [Google Scholar] [CrossRef]
  52. Aguiar, V.M.C.; Braga, E.S.; Baptista Neto, J.A. Heavy metal assessment in two subtropical estuarine systems in the state of São Paulo, Brazil. In Marine Pollution: New Research, 1st ed.; Hofer, T.N., Ed.; Nova Publishers: New York, NY, USA, 2008; pp. 379–397. [Google Scholar]
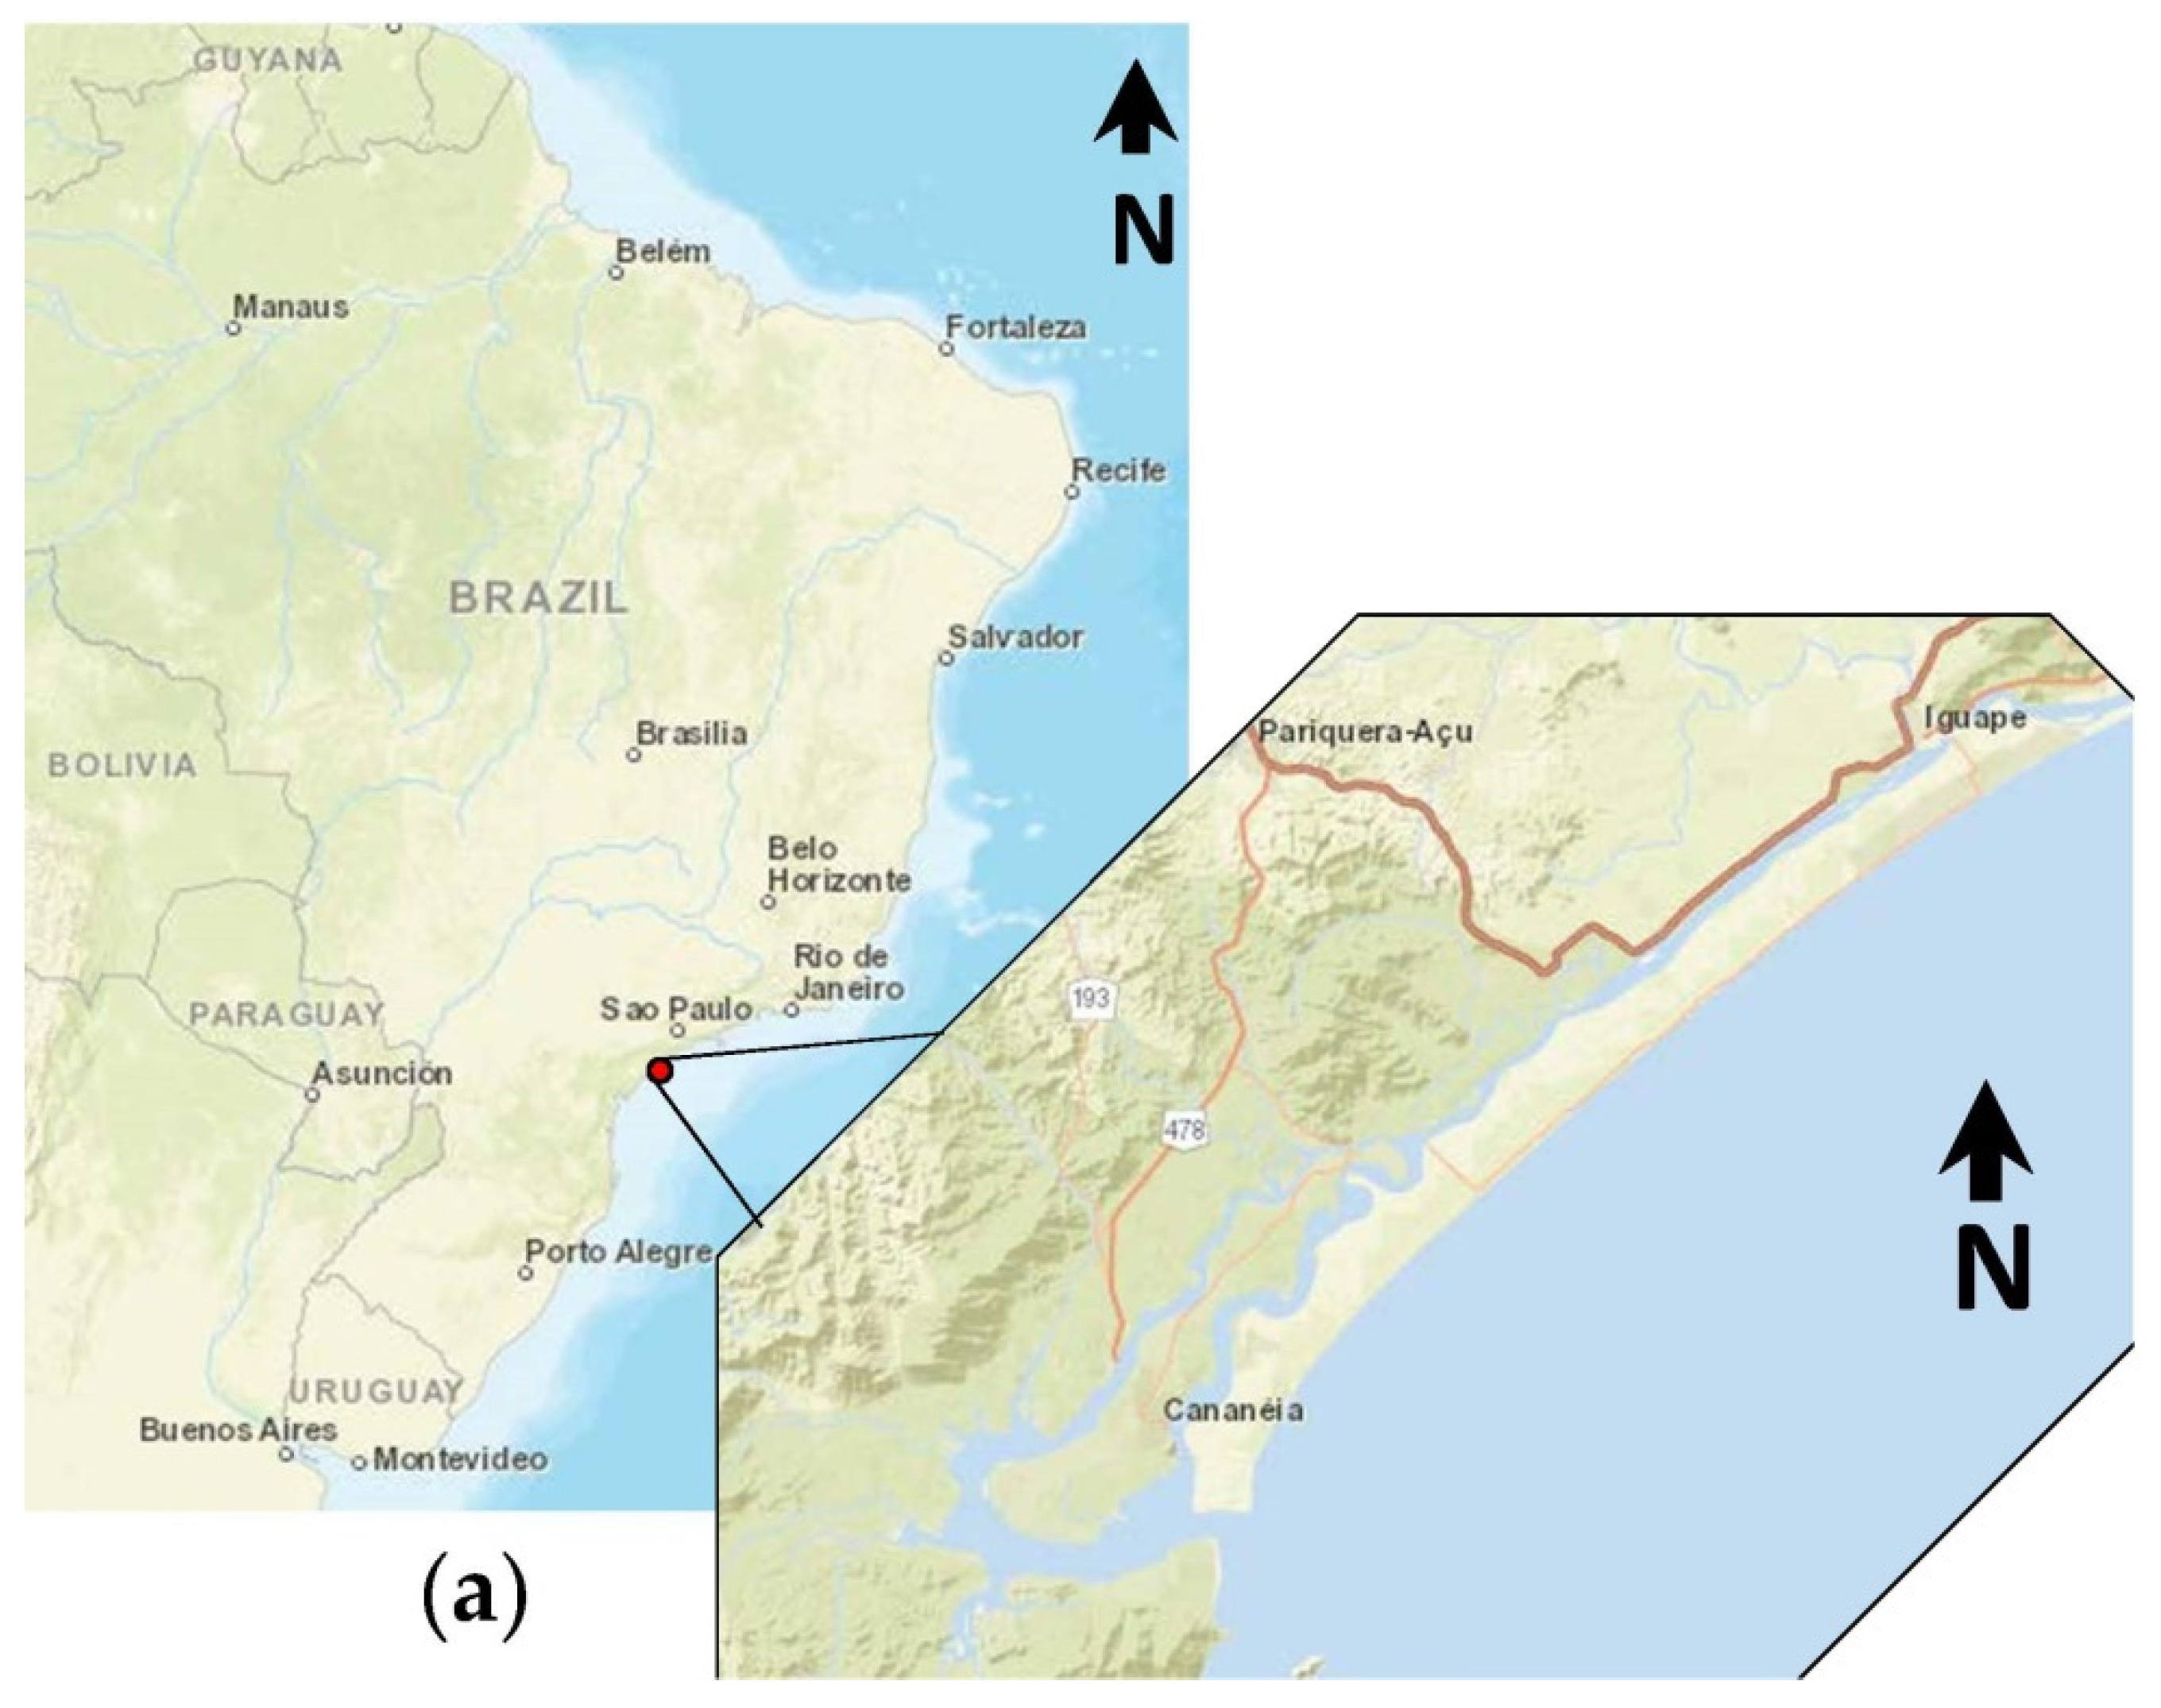
Figure 1. (a) Location of the city of Cananéia in south-western Brazil (National Geographic Map Maker). (b) Map of the Cananéia-Iguape estuarine–lagoon complex. Black rectangle corresponds to the inset map showing the city of Iguape, the Valo Grande Canal, and the Ribeira River. (c) Location of sampling stations.
Applsci 11 08466 g001aApplsci 11 08466 g001b
Figure 2. Percentage distribution of the three main grain size components: (a) Sand; (b) Silt; (c) Clay.
Applsci 11 08466 g002
Figure 3. Spatial distribution of: (a) Calcium carbonate (%); (b) Total Organic Carbon (%); (c) Total Nitrogen (%).
Applsci 11 08466 g003
Figure 4. Spatial distribution of the concentrations (mg g−1) of: (a) Humic Substances; (b) Free Humic Acids; (c) Bound Humic Acids; (d) Fulvic Acids.
Applsci 11 08466 g004
Figure 5. Spatial distribution of the δ13C values (‰ vs. V-PDB) of: (a) Sedimentary Organic Matter; (b) Free Humic Acids; (c) Bound Humic Acids; (d) Fulvic Acids.
Applsci 11 08466 g005
Figure 6. Spatial distribution of Cu concentrations (μg g−1) in: (a) Free Humic Acids; (b) Bound Humic Acids; (c) Fulvic Acids. (d) Box plots of Cu concentrations (μg g−1) in the three fractions. Horizontal lines in whiskers represent the median, upper, and lower quartiles, respectively. Solid squares represent mean values. Solid circles represent the maximum and minimum values. Vertical bars represent 1σ standard deviations.
Applsci 11 08466 g006
Figure 7. Spatial distribution of Cr concentrations (μg g−1) in: (a) Free Humic Acids; (b) Bound Humic Acids; (c) Fulvic Acids. (d) Box plots of Cr concentrations (μg g−1) in the three fractions. Horizontal lines in whiskers represent the median, upper, and lower quartiles, respectively. Solid squares represent mean values. Solid circles represent the maximum and minimum values. Vertical bars represent 1σ standard deviations.
Applsci 11 08466 g007
Figure 8. Spatial distribution of Zn concentrations (μg g−1) in: (a) Free Humic Acids; (b) Bound Humic Acids; (c) Fulvic Acids. (d) Box plots of Zn concentrations (μg g−1) in the three fractions. Horizontal lines in whiskers represent the median, upper, and lower quartiles, respectively. Solid squares represent mean values. Solid circles represent the maximum and minimum values. Vertical bars represent 1σ standard deviations.
Applsci 11 08466 g008
Figure 9. Spatial distribution of As concentrations (μg g−1) in: (a) Free Humic Acids; (b) Bound Humic Acids; (c) Fulvic Acids. (d) Box plots of As concentrations (μg g−1) in the three fractions. Horizontal lines in whiskers represent the median, upper, and lower quartiles, respectively. Solid squares represent mean values. Solid circles represent the maximum and minimum values. Vertical bars represent 1σ standard deviations.
Applsci 11 08466 g009
Figure 10. Cross-plot of δ13C vs. TOC/TN values for SOM (squares), Free Humic Acids (circles), Bound Humic Acids (triangles), and FA (diamonds). Rectangles indicate the geochemical signatures of the different contributors to aquatic organic matter according to [18] (C3 plants, C4 plants, and marine and freshwater Dissolved Organic Carbon, Particulate Organic Carbon, and algae).
Applsci 11 08466 g010
Table 1. Pearson’s correlation matrix between paired parameters in bulk sediments (N = 13; p < 0.05). Correlation coefficients > 0.69 are indicated in bold.
CaCO3TOCTNδ13CSOMSandSiltClayδ13CFHAδ13CBHAδ13CFA[FHA][BHA][FA]
CaCO31.000.550.51−0.02−0.170.170.16−0.030.04−0.010.130.090.24
TOC 1.000.98−0.07−0.690.700.54−0.19−0.07−0.050.600.760.89
TN 1.00−0.13−0.720.740.55−0.26−0.16−0.160.650.730.92
δ13CSOM 1.000.44−0.43−0.560.890.910.91−0.610.350.04
Sand 1.00−1.00−0.940.690.510.43−0.92−0.44−0.60
Silt 1.000.93−0.68−0.50−0.420.920.460.62
Clay 1.00−0.82−0.63−0.530.920.200.37
δ13CFHA 1.000.940.90−0.830.21−0.09
δ13CBHA 1.000.98−0.710.33−0.02
δ13CFA 1.00−0.650.32−0.03
[FHA] 1.000.280.53
[BHA] 1.000.88
[FA] 1.00
Table 2. Pearson’s correlation matrix among metals in FHA (N = 13; p < 0.05). Correlation coefficients > 0.69 are indicated in bold.
PbVCrMnNiCuZnAs
Pb1.00−0.19−0.25−0.27−0.070.770.390.12
V 1.000.760.86−0.62−0.10−0.32−0.06
Cr 1.000.67−0.35−0.43−0.37−0.41
Mn 1.00−0.58−0.22−0.21−0.10
Ni 1.00−0.14−0.27−0.08
Cu 1.000.080.68
Zn 1.00−0.23
As 1.00
Table 3. Pearson’s correlation matrix among metals in BHA (N = 13; p < 0.05). Correlation coefficients > 0.69 are indicated in bold.
PbVCrMnNiCuZnAs
Pb1.000.530.470.460.39−0.050.54−0.03
V 1.000.340.97−0.440.190.690.27
Cr 1.000.190.13−0.070.14−0.32
Mn 1.00−0.440.150.680.33
Ni 1.00−0.44−0.37−0.18
Cu 1.000.090.49
Zn 1.00−0.04
As 1.00
Table 4. Pearson’s correlation matrix among metals in FA (N = 13; p < 0.05). Correlation coefficients > 0.69 are indicated in bold.
PbVCrMnNiCuZnAs
Pb1.00−0.120.230.270.370.040.230.00
V 1.000.15−0.02−0.220.40−0.190.35
Cr 1.000.170.110.620.400.11
Mn 1.000.450.060.20−0.24
Ni 1.00−0.020.08−0.03
Cu 1.000.610.40
Zn 1.00−0.09
As 1.00
Publisher’s Note: MDPI stays neutral with regard to jurisdictional claims in published maps and institutional affiliations.