Featured Application
Authors are encouraged to provide a concise description of the specific application or a potential application of the work. This section is not mandatory.
Abstract
Purpose: To date, the qualitative and quantitative recording of biomechanical processes in dental implants represents one of the greatest challenges in modern dentistry. Modern, dynamic, 3D optical measurement techniques allow highly constant and highly accurate measurement of biomechanical processes and can be superior to conventional methods. This work serves to establish a new measurement method. Materials and Methods: A comparative analysis was undertaken for two different measurement systems, two conventional strain gauges versus the 3D optical two-camera measurement system ARAMIS (GOM GmbH, Braunschweig, Germany), as they detected surface changes on an artificial bone block under masticatory force application. Two implants (Straumann Standard Implants Regular Neck, Straumann GmbH, Freiburg, Germany) were placed in the bone block, and three different three-unit bridges were fabricated. Increasing masticatory forces, from 0 to 200 N, were applied to the bone block via each of these bridges and the inserted implants. Fifteen repetitions of the test were performed using a universal testing machine. The computer unit of the ARAMIS system was used to simultaneously integrate the surface changes recorded by the strain gauges and the ARAMIS system. The areas on the bone block examined by the dynamic 3D optical measurement method corresponded exactly to the locations and extent of the strain gauges. A statistical comparative analysis was carried out separately for the strain gauges and the corresponding optical measuring surface at the defined force magnitudes. The equivalence test and the intraclass correlation served as statistical means. Results: In the case of the intraclass correlation, a clear concordance of both measurement methods could be shown for all examined cases. For the equivalence test, no significance could be shown in individual cases. Conclusion: The accuracy of the modern, dynamic, 3D optical measurement method is comparable to that of conventional strain gauges. On this basis, versatile new research approaches in the field of biomechanics of dental implants can be pursued by establishing this method.
1. Introduction
Understanding and controlling biomechanical influences are essential factors for the long-term success of dental implants [1]. In this context, it is well known that the mechanical stress acting at the junction between implant and bone influences osseointegration [2,3,4]. Furthermore, the force transmission from the implant to the peri-implant bone depends on the design of the junction, the direction of the force (axial or non-axial), the length and diameter of the implant, the implant design, and the quality of the bone [5,6,7,8]. Currently, research in the literature has examined the transmission of forces from the superstructure to the bone via the implant; however, the resulting conclusions remain limited [2,9,10].
Highly complex methods are required to measure the mechanics that occur in a system consisting of the bony implant site, implant, and superstructure (possibly with abutment and screw) [9,10].
Two previously established conventional methods are currently available for this purpose.
One method is the virtual and computer-based finite element method (FEM), which is used for deformation simulation. Complex geometric shapes are broken down into simpler bodies (finite elements) such as cuboids, tetrahedra, or cubes and represented within software. The deformation behavior of the original structures can be calculated approximately in the software model on the basis of these shapes and the resulting simplified mathematical relationships [11].
In this way, solid bodies such as bones or implants, but also soft tissue, can be examined in dentistry. The advantages of the FEM are its 3D representation of the simulated processes and its relatively simple implementation feasibility [12,13,14]. However, a disadvantage is that the FEM is only a simulation and a simplification and, therefore, its transfer to actual biomechanical processes in the human organism is difficult [15,16].
The second established method is the use of strain gauges. This is used in dentistry, for example, in the detection of deformations of dental prostheses [17,18] or of the peri-implant bone [19]. Strain gauges are electrical sensors in the form of meander-shaped conductors connected to a current source and placed at each of the measuring points to be examined. Their specific resistances and electrical voltages change according to changes in their lengths and cross sections due to a change in the shape of the measuring point location [20]. This corresponds to the deformation at the measuring point when used correctly [21]. The exact calculation of the change in length is based on the change in resistance and thus the change in stress, accounting for a material-specific proportionality constant. The calculation is assisted by a signal amplifier and software. This conversion must be performed individually for each measured value and is synchronized with the corresponding force value that caused the deformation [20,22]. Strain gauges are an established method for measuring surface deformations in dental research, and they are currently the only adequate measurement method [6,23,24,25,26].
A disadvantage of using strain gauges is the high technique sensitivity of the method. Thus, bonding at the measurement site is very costly—especially in the context of in vivo investigations. In addition, only 1D measurements are possible with linear strain gauges. Therefore, not only is the exact positioning on the measuring point of great importance, but also the spatial alignment is important for correctly recording the direction of a shape change [27,28,29,30]. Sufficient temperature control is also necessary for quantifying the measurement results, since even small temperature changes can lead to changes in the shape of the strain gauges due to their very fine structure. Thus, strain gauges are prone to falsified, temperature-related measured values [30]. Even when used in accordance with the process, inherent errors, such as hysteresis and nonlinearity, have been described when using strain gauges [31].
In view of these technological disadvantages, there is a need for a new, 3D, robust, and reproducible measurement method that provides measured values directly and can integrate these measurements with various parameters, such as an applied force and the direction of the force [32]. These conditions can be met by the ARAMIS system (GOM GmbH, Braunschweig, Germany), which—based on triangulation and photogrammetry—enables the dynamic measurement of surfaces in three dimensions, digitally and in real time. This system has already been introduced as a standard in connection with material testing and mechanical testing in the automotive and aerospace industries [33]. It is a two-camera system that provides noninvasive optical acquisition. This allows measurements to be made within specific limits for both in vitro and in vivo situations [34,35]. As a limitation, it should be noted that only structures that are accessible to light optics can be investigated and that no phase boundaries, for example between air and water, may exist in the light path. Of scientific interest in materials science, the integration of various parameters, such as force magnitudes and time, are implemented in real time and fully digitally via the ARAMIS Professional software.
The aim of this study is to show the comparability between the established method of strain gauges and the ARAMIS system and thus to introduce this optical, fully digital measurement method in the field of dental biomechanics as a new area of application.
2. Materials and Methods
First, two implants (Straumann Standard Implants Regular Neck, length 14 mm, diameter 4.1 mm, made of Roxolid with SLA surface, Straumann GmbH, Basel, Switzerland) were placed perpendicularly and parallel to each other at a separation of 12 mm in a cuboid made of polyurethane, with dimensions of 6.5 × 4 × 2 cm. This cuboid of polyurethane (Sawbones Europe AB, Malmö, Sweden) had a density of 0.2 g/[cm3] and a modulus of elasticity of 12.4 MPa, as it was intended to simulate the compacta of human jawbone.
Next, three three-unit bridges, with an intermediate pontic that was not in contact with the surface of the bone block, were fabricated for these two implants after impressions were taken. One bridge was made of oxide ceramic, one was made of non-precious metal alloy (npm), and one was made of polyetheretherketone (PEEK).
The bone block was then primed with special white paint, and after an appropriate drying time, black spray paint was applied to create a speckled, so-called stochastic pattern. This pattern was essential for the functionality of the ARAMIS system.
To simulate the introduction of a masticatory force, a universal testing device was used that consisted of a universal testing machine (Inspect mini, Hegewald and Peschke Meß- und Prüftechnik GmbH, Nossen, Germany) and a precision force transducer (type KAP-S, AST Group, Wolznach, Germany). The testing machine was controllable by means of the testing software “LabMaster” (Hegewald and Peschke Meß- und Prüftechnik GmbH, Nossen, Germany), which enabled a predefined force progression.
For this purpose, a piston transmitted the force axially under direct contact to the respective bridge structure. The force variable was always transferred in real time to a special computer unit designed for the ARAMIS system and coupled to the unit via an analog 5/10 V signal.
Furthermore, two strain gauges were attached perpendicularly to each other on the surface of the bone block. This was performed by a physicist experienced in this method. Strain gauge 1 was attached vertically in the transverse plane below the implants and thus was oriented axially starting from the implants. Strain gauge 2 was attached at the top of the bone block in the horizontal plane and was oriented parallel to the line connecting the implants. Both strain gauges were connected via a cable link to a measurement amplifier (Hottinger Brüel and Kjaer GmbH, Darmstadt, Germany), which transferred the changes in strain of the measurement sensors—corresponding to the signals of the universal testing machine—in the form of an analog 5/10 V signal to a computer unit. More precisely, quarter-bridge circuits were used, each consisting of a full bridge with three passive resistors and an active strain gauge. Based on this signal, the change in length at the locations of the strain gauges could be calculated. This was done automatically through software and in real time within the ARAMIS Professional program, and the output could be displayed in tabular form for both measuring sensors.
2.1. Calculation of the Strain ɛ for the Quarter-Bridge Circuit
Here, an experimentally determined material constant k corresponds to the “k-factor” of the strain gauges and has a value of 1.98 for the strain gauge used, type 1-LY11-3/350 (Hottinger Brüel and Kjaer GmbH, Darmstadt, Germany). U_E corresponds to the bridge supply voltage (V), U_A corresponds to the bridge output voltage (mV), and the quotient U_A/U_E of the two voltage values corresponds to the so-called “bridge detuning” (mV/V).
Strain ɛ = 4/k∙U_A/U_E
For the calibration of the measuring amplifier, the so-called bridge detuning, a calibration signal of 1 mV/V was applied, and the gain was adjusted so that the output voltage of the measuring amplifier was 10 V.
Calibration of the Measuring Amplifier:
10 V ⟼1 mV/V
1 mV ⟼1∙ [10−7] mV/V
If the calibration of the measuring amplifier is inserted into Equation (1), a signal of the measuring amplifier of 100 mV corresponds to a strain ɛ of 20.2 μm/m. Based on this, a conversion factor of 202 was set in the ARAMIS Professional software so that the analog signals of the measuring amplifier fed into the software could be converted directly into technical strain values.
The core of the test setup was the computer unit of the ARAMIS system, which had integrated within it the length changes of the strain gauges, the optical signals of the camera system, and the applied axial force of the universal testing machine.
The camera system of the ARAMIS system was directly connected to the computer unit and was based on a photometric principle. For this purpose, two high-resolution cameras of the ARAMIS system, arranged at an angle of 25° to each other, were directed at the strain gauges.
The synchronous recording of the measurement object by both cameras enabled a 3D calculation of the surface at any time during the test series.
An exact distance of 350 mm between the lenses of the cameras and the bone block had to be maintained, as the camera system had a defined, unchanging focus used to perform the automatic triangular calculations. Figure 1 shows the test setup in the long view and the individual bridges on the implants placed in the bone block.
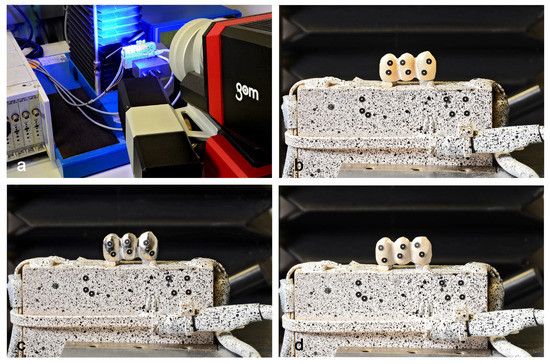
Figure 1.
Experimental setup in long shot (a), artificial bone block with stochastic pattern and strain gauges as well as inserted implants and superstructure made of ceramics (zirconia) (b), artificial bone block with stochastic pattern and strain gauges as well as inserted implants and superstructure made of npm (c), artificial bone block with stochastic pattern and strain gauges as well as inserted implants and superstructure made of PEEK (d).
The deformation of the surface could be calculated by the stochastic pattern applied in advance, which followed the deformation of the surface. The software was able to identify square image sections within the pattern by their respective gray value levels and track changes in their distances from each other in the image sequence. The centers of these squares were first converted by the software into 2D coordinate networks for each camera, which were then merged into a 3D coordinate system. Thus, the distance between all areas of the stochastic pattern could be traced at any time with reference to the applied axial force and synchronously with the change in length of the strain gauges. The calculation of surface deformations was performed virtually in the ARAMIS Professional software after the tests were performed. Prior to each series of measurements, the ARAMIS system was calibrated according to the manufacturer’s specifications to ensure maximum measurement accuracy and consistency.
Individual test series were performed for each of the three bridge materials. Each series consisted of 15 individual tests. A continuously increasing force was introduced from the universal testing machine via the bridge constructions and the implants into the artificial bone block, assuming a magnitude of 0–200 N. The shape changes were calculated for force magnitudes 50, 100, 150, and 200 N. Before each test series, the superstructures on the implants were tightened by hand using a ratchet with a force of 35 N/cm.
For the optical measurement, two 2D measurement areas were subsequently constructed in the image recordings of the individual tests, each corresponding to the base areas of the strain gauges. These measurement areas were defined once for each test series and transferred to the assigned test recordings. To enable the correct calculation and evaluation of these measurement surfaces, a coordinate system was previously defined in the ARAMIS Professional software for each of the image series. The respective superstructure was defined as a rigid body, which in turn compensated for its movement during loading by calculation. This guaranteed that only the strain of the artificial bone block was measured. For the sake of comparability, the test configuration was not changed between the 15 individual tests in a test series. Figure 2 shows strain gauge 1 with a view to the frontal plane of the bone block and the corresponding virtual measuring surface of the ARAMIS system directly above under increasing force application. Figure 3 shows strain gauge 2 looking at the horizontal plane of the bone block and the corresponding virtual measuring surface of the ARAMIS system directly above it, also under increasing force application.
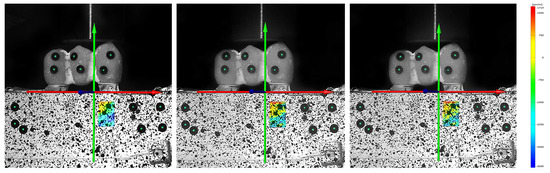
Figure 2.
Experimental setup showing the frontal surface with superstructure as well as the optical measuring surface above strain gauge 1 at increasing mastocatory forces from left to right.
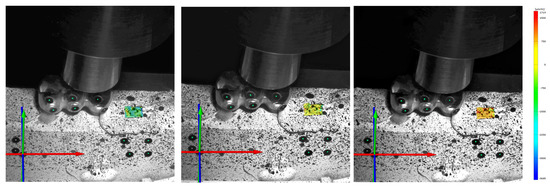
Figure 3.
Experimental setup showing the upper horizontal surface with superstructure as well as the optical measuring surface above strain gauge 2 at increasing mastocatory forces from left to right.
Using the ARAMIS Professional software, the changes in length of the strain gauges and the virtual measurement surfaces were transferred to Excel as a function of the applied force.
These data formed the basis for the statistical analysis, which was performed using the program R ver. 3.6.3 (R Core Team (2019), R Foundation for Statistical Computing, Vienna, Austria). Here, the equivalence of the two measurement methods was analyzed using equivalency tests (two one-tailed t-tests: TOST) with a tolerance of 100 μm/m (50 μm/m). In addition, intraclass correlation coefficients (ICC) were calculated and used to determine the concordance between the two measurement methods. These results are presented in the form of Bland–Altman plots. To achieve a differentiated observation, measured values at force applications of 50, 100, 150, and 200 N were statistically evaluated for both strain gauges.
2.2. Results
The corresponding pairs of strain gauge and optical digital measurements showed statistically clear concordances for each case in the intraclass correlation. The smallest relative difference in mean values between the measurement methods was found for the case of strain gauge 1 when measuring the bone surface at an applied force of 100 N across the bridge made of PEEK. There was a difference of 0.043% and 0.3 μm/m, respectively. For strain gauge 2, this was also the case at an applied force of 100 N and the bridge made of PEEK. The deviation in this case was 0.09% or 0.4 μm/m.
The largest relative mean deviation in relation to strain gauge 1 occurred at a force of 100 N with the bridge made of non-precious metal alloy. This amounted to 4.3% or 28.7 μm/m, respectively. In the case of strain gauge 2, the largest relative mean deviation was found to be 2.52% and 23.5 μm/m for the combination of a force of 150 N and the bridge made of ceramic.
In Table 1, the results of the measurements related to strain gauges 1 and 2 are summarized descriptively. The p-values of the equivalence tests and the results of the intraclass correlation (ICC) are shown in Table 2 and Table 3.

Table 1.
Mean values, minima, maxima, and standard deviation (SD) of the individual series of measurements for the optical measuring method and strain gauges (SG) 1 and 2, for ceramic, non-precious metal (npm), and PEEK, respectively. All values are displayed in µm/m.
Table 2.
p-values of the equivalence tests and intraclass correlation coefficients (ICC) for the optical measurement method and strain gauge 1.
Table 3.
p-values of the equivalence tests and intraclass correlation coefficients (ICC) for the optical measurement method and strain gauge 2.
The measured value distributions are presented in the form of box plots for both strain gauges 1 and 2 for ceramic in Figure 4, for non-precious metal in Figure 5, and for PEEK bridges in Figure 6, respectively.
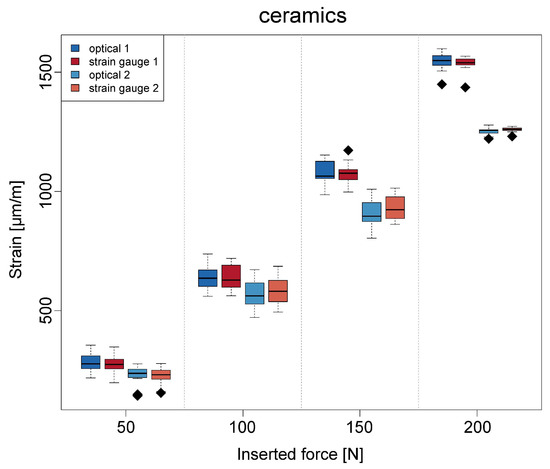
Figure 4.
Boxplots regarding the strain at different inserted forces and in the case of the ceramic (zirconia) superstructure.
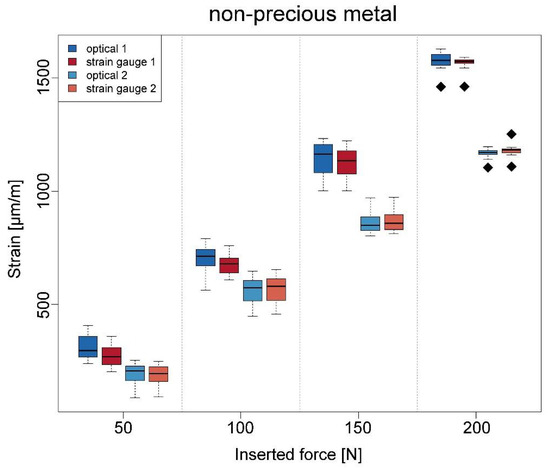
Figure 5.
Boxplots regarding the strain at different inserted forces and in the case of the superstructure made of non-precious metal.
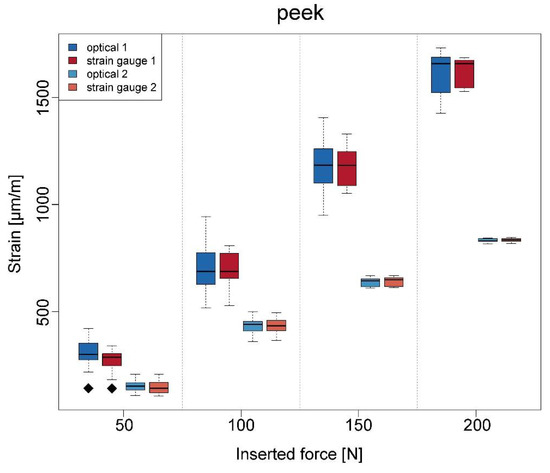
Figure 6.
Boxplots regarding the strain at different inserted forces and in the case of the superstructure made of PEEK.
3. Discussion
The use of the ARAMIS system is well established in dental science but has not been used as presented here in prior years. Earlier work by Göllner et al. showed good repeatability and stable results for measuring micromovements of teeth [36,37]. To date, one investigation of elongation behavior has been identified in connection with restorative composites [38]. Thus, in order to obtain as much information as possible, the present study evaluated strains as a function of different materials and forces. The current study is based on widely used and modern materials in dentistry: a non-precious metal alloy, ceramics (zirconia), and PEEK [39,40,41].
For comparison of the optical digital method with an already established method, the measurements performed by the ARAMIS system were compared with measurements from strain gauges taken in parallel. Strain gauges were selected because they made possible the integration with collected measured values. This comparison was not possible with the finite element method, as finite element simulations are based on geometrically simplified components [11].
Strain gauges are very technique sensitive in their use. For example, they must be bonded very carefully, and errors can occur [42,43]. In addition, the changes in stress detected by the strain gauges are modified by a measurement amplifier, and they are then transferred to a computer unit for quantification of the change in length [22]. Strain gauge measurements of changes in length are made indirectly. The measured change in stress is first mathematically converted into a change in length per specific length by a given formula and then into an absolute change in length [42,44]. Each of these aspects signifies a potential source of error, and it is necessary to account for sensor-related error sources of hysteresis and nonlinearity [31].
Moreover, regardless of measurement inaccuracy, measurements using linear strain gauges are fundamentally limited to one dimension. As a result, errors can add up in the combination of measurements when evaluating multidimensional processes [45].
In contrast, optical measurement technology has two disadvantages. First, only directly visible areas of a measured object can be examined using an optical method. Transfers to in vivo experiments require complex adaptations to the set-up, but are in principle possible and will be presented in the future. Second, the surface to be measured must be prepared to allow the detection of surface changes by applying a stochastic pattern or GOM reference points [42,43,46]. Both methods have in common that only the surface of a test object can be examined. This leads to limitations of this measurement method, since no direct conclusions can be drawn about processes inside the test specimens.
The computer-aided nature of the ARAMIS system allows for the investigation of different virtual measurement areas. In this study, a comparison of the measurement accuracies of the optical digital measurement system versus strain gauges was investigated using two virtual measurement areas corresponding to their respective contours. The positioning and extension of the measurement area correspond with high accuracy to those of the corresponding strain gauge. This eliminated errors due to different measurement ranges. Despite the limitation that the optical technique measures the surface of the strain gauges, the exact adaptation of the measurement ranges could have contributed to the statistically significant concordance between the two methods.
In the present study, the materials used for the three superstructures were an oxide ceramic, a non-precious metal alloy, and PEEK. Overall, no significant difference in the elongation of the bone, both horizontally (DMS1) and vertical-axially (DMS2) to the implant, was observed between the non-precious metal alloy and the ceramic with either measurement method. Only PEEK tended to result in less elongation of the bone at each load in both measurement ranges and equally with both measurement methods. Of the three materials, PEEK exhibited the highest elasticity, with a modulus of elasticity of 3.84 GPa [47]. This property, by damping the axially applied forces, may have contributed to a reduction in stress at the bone–implant interface and consequently to less elongation of the bone [48].
The concordance between the two measurement methods was investigated using intraclass correlation, thus testing both measurement methods for reliability. For the comparison with strain gauge 1, concordance between the two measurement methods could be determined for all measurement data. More precisely, according to Koo and Li, the intraclass correlation coefficients (ICC) determined here indicate excellent (ICC > 0.9) or good (ICC = 0.75–0.9) concordance between the two measurement methods for most of the measurement data (with regard to Table 2) [49]. Only when the superstructure made of PEEK is loaded with a force of 50 N (ICC = 0.72) and that made of the non-precious alloy is loaded with 50 N (ICC = 0.591) and 100 N (ICC = 0.597) is moderate concordance shown, according to Koo and Li [49].
With respect to strain gauge 2, concordance between the two measurement methods was also determined for all measured values. More precisely, the determined ICCs also suggest excellent (ICC > 0.9) or good (ICC = 0.75–0.9) concordance between the two measurement methods for most of the measurement data (with regard to Table 3), according to Koo and Li [49]. Only for ceramic at loads of 150 and 200 N do the measurement data agree moderately, and for non-precious metal at a load of 200 N, the concordance is poor [49].
Overall, therefore, the optical digital measurement method using the ARAMIS system appears to be comparable to the use of strain gauges. In addition, this method offers various advantages. For example, direct 3D measurements are possible in real time, which can be flexibly used to construct the measuring range. External measured values, for example, force variables and time, can also be integrated, recorded, and stored simultaneously and automatically in these measurements. In addition, all image components recorded in the focus of the camera system can be subsequently remeasured without the need to repeat the experiment. In addition, the future use of the optical measurement system could enable highly complex biomechanical experimental setups in which, among other things, a large number of external measurement values could be integrated and evaluated simultaneously.
4. Conclusions
The accuracy of the optical digital measurement method using the ARAMIS system is comparable to the established strain gauge method. Thus, the optical digital measurement system represents an adequate alternative to conventional measurement methods and widens the spectrum of new study designs and questions that can be examined in the field of biomechanics of implants. The conclusions of this study are limited by the complex transfer of the set-up to in vivo experiments and the operator sensitivity. In addition, no direct conclusions can be drawn about processes within the test specimens.
Author Contributions
R.E.M., project director and the developer of the three-dimensional examination method, wrote part of the manuscript and also helped to interpret the three-dimensional results. He also made constant corrections to the manuscript; K.R., conducting the experiments, and has also contributed in writing of the article. H.T., Bonding of the straingauge and the technical assistance in the measurement with Straingaug; W.A., is our statistician. He performed all statistical tests and wrote the part of the statistics for the results; S.E., wrote a part of the introduction and contributes to the understanding of dental biomechanics; M.W., is the head of the prosthetic department in Erlangen. He supervised the study over the ten years and was present at the first examination appointments. His experience and knowledge in the field of prosthetics and science as well as the constant corrections helped the authors in the design of the manuscript; C.M. contributed significantly to the preparation of the manuscript as well as to the literature research. He compared the results from the current literature with the results obtained in our study. All authors have read and agreed to the published version of the manuscript.
Funding
This research received no external funding.
Institutional Review Board Statement
Not applicable.
Informed Consent Statement
Not applicable.
Data Availability Statement
Not applicable.
Acknowledgments
This study was based, in part, on the results from the doctoral thesis of Katharina Riegger. Furthermore, the authors would also like to thank the GOM company with Dipl.-Ing. Gunter Sanow for the metrological support. The authors would also like to thank Straumann for their support in providing the implants.
Conflicts of Interest
The authors declare no conflict of interest.
References
- Cehreli, M.C.; Iplikcioglu, H.; Bilir, O.G. The influence of the location of load transfer on strains around implants supporting four unit cement-retained fixed prostheses: In vitro evaluation of axial versus off-set loading. J. Oral Rehabil. 2002, 29, 394–400. [Google Scholar] [CrossRef]
- Frost, H.M. Wolff’s Law and bone’s structural adaptations to mechanical usage: An overview for clinicians. Angle Orthod. 1994, 64, 175–188. [Google Scholar] [PubMed]
- Wiskott, H.W.; Belser, U.C. Lack of integration of smooth titanium surfaces: A working hypothesis based on strains generated in the surrounding bone. Clin. Oral Implant. Res. 1999, 10, 429–444. [Google Scholar] [CrossRef]
- Frost, H.M. A 2003 update of bone physiology and Wolff’s Law for clinicians. Angle Orthod. 2004, 74, 3–15. [Google Scholar]
- de Vasconcellos, L.; G.Nishioka, R.S.; de Vasconcellos, L.M.; Balducci, I.; Kojima, A.N. Microstrain around dental implants supporting fixed partial prostheses under axial and non-axial loading conditions, in vitro strain gauge analysis. J. Craniofac. Surg. 2013, 24, e546–e551. [Google Scholar] [CrossRef] [PubMed]
- Nishioka, L.N.; Abreu, C.W.; de Vasconcellos, L.G.; Balducci, I. Machined and plastic copings in three-element prostheses with different types of implant-abutment joints: A strain gauge comparative analysis. J. Appl. Oral Sci. 2010, 18, 225–230. [Google Scholar] [CrossRef] [PubMed]
- Kheiralla, L.S.; Younis, J.F. Peri-implant biomechanical responses to standard. short-wide. and mini implants supporting single crowns under axial and off-axial loading (an in vitro study). J. Oral Implantol. 2014, 40, 42–52. [Google Scholar] [CrossRef]
- Lee, J.H.; Frias, V.; Lee, K.W.; Wright, R.F. Effect of implant size and shape on implant success rates: A literature review. J. Prosthet. Dent. 2005, 94, 377–381. [Google Scholar] [CrossRef]
- Peixoto, H.E.; Bordin, D.; Del Bel Cury, A.A.; da Silva, W.J.; Faot, F. The role of prosthetic abutment material on the stress distribution in a maxillary single implant-supported fixed prosthesis. Mater. Sci. Eng. C Mater. Biol. Appl. 2016, 65, 90–96. [Google Scholar] [CrossRef]
- Takahashi, J.M.; Dayrell, A.C.; Consani, R.L.; de Arruda Nóbilo, M.A.; Henriques, G.E.; Mesquita, M.F. Stress evaluation of implant-abutment connections under different loading conditions: A 3D finite element study. J. Oral Implantol. 2015, 41, 133–137. [Google Scholar] [CrossRef] [PubMed]
- Srirekha, A.; Bashetty, K. Infinite to finite: An overview of finite element analysis. Indian J. Dent. Res. 2010, 21, 425–432. [Google Scholar] [CrossRef] [PubMed]
- Geng, J.P.; Tan, K.B.; Liu, G.R. Application of finite element analysis in implant dentistry: A review of the literature. J. Prosthet. Dent. 2001, 85, 585–598. [Google Scholar] [CrossRef] [PubMed]
- Reddy, M.S.; Sundram, R.; Abdemagyd, H.A.E. Application of Finite Element Model in Implant Dentistry: A Systematic Review. J. Pharm. Bioallied Sci. 2019, 11 (Suppl. 2), S85–S91. [Google Scholar] [CrossRef] [PubMed]
- Pesqueira, A.A.; Goiato, M.C.; Filho, H.G.; Monteiro, D.R.; Santos, D.M.; Haddad, M.F.; Pellizzer, E.P. Use of stress analysis methods to evaluate the biomechanics of oral rehabilitation with implants. J. Oral Implantol. 2014, 40, 217–228. [Google Scholar] [CrossRef] [PubMed]
- Omori, M.; Sato, Y.; Kitagawa, N.; Shimura, Y.; Ito, M. A biomechanical investigation of mandibular molar implants: Reproducibility and validity of a finite element analysis model. Int. J. Implant. Dent. 2015, 1, 10. [Google Scholar] [CrossRef]
- Wakabayashi, N.; Ona, M.; Suzuki, T.; Igarashi, Y. Nonlinear finite element analyses: Advances and challenges in dental applications. J. Dent. 2008, 36, 463–471. [Google Scholar] [CrossRef]
- Ishikawa, Y.; Komada, W.; Inagaki, T.; Nemoto, R.; Omori, S.; Miura, H. The effects of post and core material combination on the surface strain of the 4-unit zirconia fixed partial denture margins. Dent. Mater. J. 2017, 36, 798–808. [Google Scholar] [CrossRef][Green Version]
- Karl, M.; Wichmann, M.G.; Winter, W.; Graef, F.; Taylor, T.D.; Heckmann, S.M. Influence of fixation mode and superstructure span upon strain development of implant fixed partial dentures. J. Prosthodont. 2008, 17, 3–8. [Google Scholar] [CrossRef]
- Shimura, Y.; Sato, Y.; Kitagawa, N.; Omori, M. Biomechanical effects of offset placement of dental implants in the edentulous posterior mandible. Int. J. Implant. Dent. 2016, 2, 17. [Google Scholar] [CrossRef]
- Grassi, L.; Isaksson, H. Extracting accurate strain measurements in bone mechanics: A critical review of current methods. J. Mech. Behav. Biomed. Mater. 2015, 50, 43–54. [Google Scholar] [CrossRef]
- Clelland, N.L.; Gilat, A.; McGlumphy, E.A.; Brantley, W.A. A photoelastic and strain gauge analysis of angled abutments for an implant system. Int. J. Oral Maxillofac. Implants 1993, 8, 541–548. [Google Scholar] [PubMed]
- Duyck, J.; Van Oosterwyck, H.; De Cooman, M.; Puers, R.; Vander Sloten, J.; Naert, I. Three-dimensional force measurements on oral implants: A methodological study. J. Oral Rehabil. 2000, 27, 744–753. [Google Scholar] [CrossRef] [PubMed]
- Nishioka, R.S.; de Vasconcellos, L.G.; de Melo Nishioka, G.N. Comparative strain gauge analysis of external and internal hexagon. Morse taper. and influence of straight and offset implant configuration. Implant Dent. 2011, 20, e24–e32. [Google Scholar] [CrossRef]
- Epprecht, A.; Zeltner, M.; Benic, G.; Özcan, M. A strain gauge analysis comparing 4-unit veneered zirconium dioxide implant-borne fixed dental prosthesis on engaging and non-engaging abutments before and after torque application. Clin. Exp. Dent. Res. 2018, 4, 13–18. [Google Scholar] [CrossRef]
- Karl, M.; Wichmann, M.G.; Heckmann, S.M.; Krafft, T. Strain development in 3-unit implant-supported CAD/CAM restorations. Int. J. Oral Maxillofac. Implants. 2008, 23, 648–652. [Google Scholar]
- Karl, M.; Holst, S. Strain development of screw-retained implant-supported fixed restorations: Procera implant bridge versus conventionally cast restorations. Int. J. Prosthodont. 2012, 25, 166–169. [Google Scholar]
- Asvanund, P. A strain gauge analysis comparing external and internal implant-abutment connections. Implant Dent. 2014, 23, 206–211. [Google Scholar] [CrossRef] [PubMed]
- Cozzolino, F.; Apicella, D.; Wang, G.; Apicella, A.; Sorrentino, R. Implant-to-bone force transmission: A pilot study for in vivo strain gauge measurement technique. J. Mech. Behav. Biomed. Mater. 2019, 90, 173–181. [Google Scholar] [CrossRef]
- Crawshaw, A.H.; Hastings, G.W.; Dove, J. The implanted electrical resistance strain gauge: In vitro studies on data integrity. J. Med. Eng. Technol. 1991, 15, 72–77. [Google Scholar] [CrossRef]
- Wang, W.; Liu, H.; Huang, R.; Zhao, Y.; Huang, C.; Guo, S.; Shan, Y.; Li, L. Thermal Expansion and Magnetostriction Measurements at Cryogenic Temperature Using the Strain Gauge Method. Front. Chem. 2018, 6, 72. [Google Scholar] [CrossRef]
- Chengqun, G.; Legtenberg, R.; Tilmans, H.A.C.; Fluitman, J.H.J.; Elwenspoek, M. Nonlinearity and hysteresis of resonant strain gauges. J. Microelectromechan. Syst. 1998, 7, 122–127. [Google Scholar] [CrossRef]
- Sztefek, P.; Vanleene, M.; Olsson, R.; Collinson, R.; Pitsillides, A.A.; Shefelbine, S. Using digital image correlation to determine bone surface strains during loading and after adaptation of the mouse tibia. J. Biomech. 2010, 43, 599–605. [Google Scholar] [CrossRef] [PubMed]
- Peterka, J.; Buranský, I. Using Aramis for Measurement of Deformation of Thin-Walled Parts during Milling; Research Papers; Faculty of Materials Science and Technology Slovak University of Technology: Trnava, Slovakia, 2011; Volume 18, pp. 45–50. [Google Scholar]
- Sojic, L.T.; Milic Lemic, A.; Tanasic, I.; Mitrovic, N.; Milosevic, M.; Petrovic, A. Compressive strains and displacement in a partially dentate lower jaw rehabilitated with two different treatment modalities. Gerodontology 2012, 29, e851–e857. [Google Scholar] [CrossRef] [PubMed]
- Bol, M.; Leichsenring, K.; Weichert, C.; Sturmat, M.; Schenk, P.; Blickhan, R.; Siebert, T. Three-dimensional surface geometries of the rabbit soleus muscle during contraction: Input for biomechanical modelling and its validation. Biomech. Model Mechanobiol. 2013, 12, 1205–1220. [Google Scholar] [CrossRef]
- Goellner, M.; Berthold, C.; Holst, S.; Petschelt, A.; Wichmann, M.; Schmitt, J. Influence of attachment and bone loss on the mobility of incisors and canine teeth. Acta. Odontol. Scand. 2013, 71, 656–663. [Google Scholar] [CrossRef]
- Goellner, M.; Berthold, C.; Holst, S.; Wichmann, M.; Schmitt, J. Correlations between photogrammetric measurements of tooth mobility and the Periotest method. Acta Odontol. Scand. 2012, 70, 27–35. [Google Scholar] [CrossRef]
- Miletic, V.; Peric, D.; Milosevic, M.; Manojlovic, D.; Mitrovic, N. Local deformation fields and marginal integrity of sculptable bulk-fill. low-shrinkage and conventional composites. Dent. Mater. 2016, 32, 1441–1451. [Google Scholar] [CrossRef] [PubMed]
- Minesaki, Y.; Murahara, S.; Kajihara, Y.; Takenouchi, Y.; Tanaka, T.; Suzuki, S.; Minami, H. Effect of metal conditioner on bonding of porcelain to cobalt-chromium alloy. J. Adv. Prosthodont. 2016, 8, 1–8. [Google Scholar] [CrossRef] [PubMed]
- Skirbutis, G.; Dzingutė, A.; Masiliūnaitė, V.; Šulcaitė, G.; Žilinskas, J. PEEK polymer’s properties and its use in prosthodontics. A review. Stomatologija 2018, 20, 54–58. [Google Scholar] [PubMed]
- Zhang, Y.; Kelly, J.R. Dental Ceramics for Restoration and Metal Veneering. Dent. Clin. N. Am. 2017, 61, 797–819. [Google Scholar] [CrossRef]
- Huang, L.; Korhonen, R.K.; Turunen, M.J.; Finnilä, M.A.J. Experimental mechanical strain measurement of tissues. PeerJ 2019, 7, e6545. [Google Scholar] [CrossRef] [PubMed]
- Wang, Y.; Liu, H.; Huang, R.; Zhao, Y.; Huang, C.; Guo, S.; Shan, Y.; Li, L. Whole Field Strain Measurement on Complex Surfaces by Digital Speckle Pattern Interferometry. Mater. Eval. 2008, 66, 507–512. [Google Scholar] [PubMed]
- Abreu, C.W.; Nishioka, R.S.; Balducci, I.; Consani, R.L. Straight and offset implant placement under axial and nonaxial loads in implant-supported prostheses: Strain gauge analysis. J. Prosthodont. 2012, 21, 535–539. [Google Scholar] [CrossRef]
- Asundi, A.; Kishen, A. A strain gauge and photoelastic analysis of in vivo strain and in vitro stress distribution in human dental supporting structures. Arch. Oral Biol. 2000, 45, 543–550. [Google Scholar] [CrossRef]
- Zhang, D.; Arola, D.D. Applications of digital image correlation to biological tissues. J. Biomed. Opt. 2004, 9, 691–699. [Google Scholar] [CrossRef]
- Heary, R.F.; Parvathreddy, N.; Sampath, S.; Agarwal, N. Elastic modulus in the selection of interbody implants. J. Spine Surg. 2017, 3, 163–167. [Google Scholar] [CrossRef]
- Skalak, R. Biomechanical considerations in osseointegrated prostheses. J. Prosthet. Dent. 1983, 49, 843–848. [Google Scholar] [CrossRef]
- Koo, T.K.; Li, M.Y. A Guideline of Selecting and Reporting Intraclass Correlation Coefficients for Reliability Research. J. Chiropr. Med. 2016, 15, 155–163. [Google Scholar] [CrossRef] [PubMed]


Publisher’s Note: MDPI stays neutral with regard to jurisdictional claims in published maps and institutional affiliations. |
© 2021 by the authors. Licensee MDPI, Basel, Switzerland. This article is an open access article distributed under the terms and conditions of the Creative Commons Attribution (CC BY) license (https://creativecommons.org/licenses/by/4.0/).