Abstract
Periprosthetic osteolysis is a common complication following total ankle arthroplasty (TAA). However, understanding of osteolysis volume and distribution is still evolving, undermining efforts to reduce the incidence of osteolysis via bone remodeling. We obtained data on the characteristics of osteolysis developing within the distal tibia and talus after TAA. Three-dimensional computed tomography (3D-CT) reconstructions of 12 patients who underwent HINTEGRA TAA were performed. We identified 27 volumes of interest (VOIs) in the tibia and talus and used statistical methods to identify the characteristics of osteolysis in the VOIs. The osteolysis volume was significantly larger in the talus than in the tibia (162.1 ± 13.6 and 54.9 ± 6.1 mm3, respectively, p = 0.00). The extent of osteolysis within the peri-prosthetic region was greater than within other regions (p < 0.05). Particularly, in the talus, the region around the talar pegs exhibited 24.2 ± 4.5% more osteolysis than any other talar region (p = 0.00). Our results may suggest that extensive osteolysis within the peri-prosthetic region reflects changes in stress flow and distribution, which vary according to the design and placement of the fixation components. This is the first study to report 3D osteolysis patterns after TAA. Careful planning of TAA design improvements may reduce the incidence of osteolysis. Our results will facilitate the further development of TAA systems.
1. Introduction
Ankle arthritis involves joint damage or severely worn cartilage [1]. End-stage ankle arthritis is characterized by bone-on-bone grinding of the joint surface after progressive wear of articular cartilage. This causes pain, loss of function and mobility, and severe limitation of daily activities [2,3]. If conservative care (nonsteroidal anti-inflammatory drugs (NSAIDs) or other oral therapies, corticosteroid injections, or bracing) and alternative methods of pain control and management fail, there are two possible surgical treatments: ankle arthrodesis (AA) and total ankle arthroplasty (TAA) [4]. Approximately 80.5 to 91.6% of patients with end-stage arthritis underwent AA in the 2000s; the rate fell to 54.6 through 70.7% in the 2010s. The respective rates for TAA were 9.0 to 19.5% and 29.3 to 45.4% [5,6]. The rates of AA and TAA have fallen and increased, respectively, as people have sought to maintain a high quality of life against a background of lengthening lifespans [2,5,6].
However, the risk of implant complications remains higher after TAA than other lower limb arthroplasties, including total knee arthroplasty (TKA) and total hip arthroplasty (THA). The survival rate of TKA is 96.4 to 98.0% at 5 years and 89.3 to 92.9% at 15 years. For THA, the respective rates are 96.8 to 97.9% and 86.7 to 91.0% [7,8,9]. The TAA survival rate is similar to that of TKA and THA at 5 years (range, 90.4–96.0%), but lower at 15 years (range, 63.6–73.0%) [10,11,12]. Although various causes of revision were reported, such as malalignment, infection, bone stress fracture, polyethylene (PE) insert subluxation, deep infection, syndesmotic nonunion, and impingement [11,12] a major cause of low survival is thought to be aseptic loosening caused by periprosthetic osteolysis [13,14]. It is generally thought that periprosthetic osteolysis is caused by particles of polyethylene, which, stimulating a biological cascade, in turn enhance osteoclast activity [15,16,17]. The stress shielding effect caused by differences in material properties (i.e., the elastic modulus) between bone and implant is also a major reason for osteolysis [18,19,20]. Third- and fourth-generation TAA methods have improved TAA procedures and implant coatings [11,21,22,23]. Gross et al. reported that rounding of the surfaces and anterior flanges of the talar components of fourth-generation TAA systems reduced the subsidence caused by osteolysis [11]. Tsai et al. reported that the mobile bearing incorporated into third- and fourth-generation TAA systems reduced strain at the implant/bone interface and may also reduce osteolysis [22]. Cracchiolo et al. reported that TAA, using a narrow PE insert, reduced edge loading and wear, which can cause osteolysis [23]. Gupta et al. reported that hydroxyapatite (HA) and porous coating of TAA components reinforced static interlocking and reduced the subsidence caused by osteolysis [21]. However, TAA still has various complications [11,24]. A study by Singh et al. indicated that the HA coating of TAA may cause extensive osteolysis [24]. Some studies reported the causative link between progression of degenerative lesions and postoperative deformity of the ankle joint, which includes alignment alternation and constrained inversion–eversion motion [25,26,27,28]. Therefore, TAA designs that reduce the risk of osteolysis are needed.
Many studies have aimed to improve TAA and reduce osteolysis [11,22,23], but few have considered the location and extent of osteolysis. As osteolysis is a progressive condition that needs early diagnosis, knowing the location and extent of osteolysis might be helpful [29]. Plus, bone remodeling theory suggests that the risk of osteolysis may be reduced if TAA applies sufficient stress to bone areas with low stress flow [18,30,31,32]. Two-dimensional (2D) radiography and three-dimensional (3D) computed tomography (CT) data are available on the location and extent of osteolysis [15,16,29,33,34,35,36]. However, even though they provide more insight into the location distribution and extent of osteolysis within the distal tibia and talus after TAA, 3D data are limited.
Therefore, our study aimed to quantify information regarding the 3D characteristics of the incidence of osteolysis developing within the distal tibia and talus after TAA.
2. Materials and Methods
2.1. Patients
CT data on six male (age, 68.5 ± 5.0 years; body mass index (BMI), 25.4 ± 2.6 kg/m2) and six female (age, 68.5 ± 3.8 years; BMI, 25.9 ± 4.5 kg/m2) patients who required revision TAA for primary TAA failure secondary to aseptic loosening were analyzed. Primary TAAs were performed between February 2006 and July 2015, and the average time to failure was 4.7 ± 2.3 years. The detailed patient descriptions are shown in Table 1. All patients underwent HINTEGRA total ankle replacement (Newdeal SA, Lyon, France); HINTEGRA is a 3-component, third-generation mobile-bearing system. Five patients required additional tibial screws to enhance initial fixation. The study was approved by the Institutional Review Board (IRB) of Chonnam National University Medical School and Hospital (approval no. CNU-2019-088).

Table 1.
Patient descriptions.
2.2. Computerized Tomography (CT) Scanning and Reconstruction
Helical CT was performed from the mid-foot to the distal tibia (slice thickness, 1.5 mm) prior to revision TAA surgery. We used a Discovery CT750 HD CT scanner (GE Healthcare, Chicago, IL, USA) or a SOMATOM Definition Flash (Siemens Healthcare, Erlangen, Germany). All patients were placed in the supine position. CT data were imported into Mimics software (ver. 17.0; Materialise, Leuven, Belgium), and 3D models of the ankle joints were reconstructed (Figure 1). Bone density ranged from 226 to 3071 Hounsfield units (HU); the density of metal TAA components was higher. To reduce metal artifacts, metal components were segmented by thresholding and trimmed based on comparison to actual metal components. In regions where the density was ~200 HU and sclerotic borders were present around the interface between the tibial component and distal tibia, and between the talar component and talus, osteolysis was considered present (Figure 2) because osteolysis is generally defined by well-demarcated, periprosthetic lucency without osseous trabeculae [37]. Cysts included in preoperative (before a primary TAA surgery) CT were all excluded when their extent and location had not been changed. Small cysts induced by sawing during TAA, vascular markings, and vague outlines were also excluded. All reconstructive processes were reviewed by a single senior surgeon.
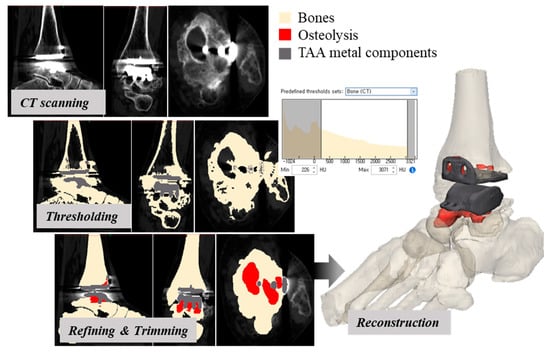
Figure 1.
A 3D-CT reconstruction of the post-TAA ankle joint (red, gray, and light yellow indicate osteolysis, TAA metal components, and bones, respectively).
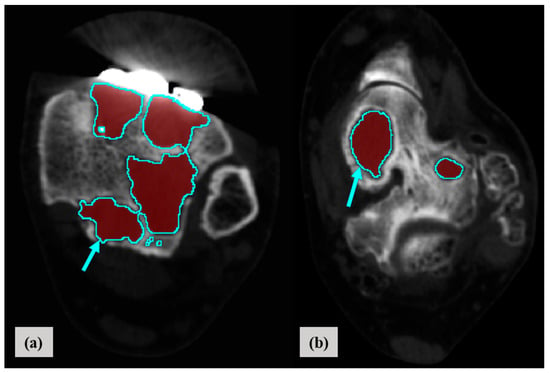
Figure 2.
Segmentation of osteolysis in the distal tibia (a) and talus (b) based on 3D-CT reconstruction (red and blue indicate osteolysis and the sclerotic border of osteolysis, respectively).
2.3. Measure of Location, Distribution, and Normalized Volume of Osteolysis
To determine the extent and location of osteolysis in the distal tibia and talus, nine regions were defined on each CT image, all of which included periprosthetic bone. The spikes of the metal tibial component and metal talar pegs served as landmarks. After 3D reconstruction of the ankle joints, 54 volumes of interest (VOIs; 1893.3 ± 1343.1 mm3) were generated, 27 in the distal tibia and 27 in the talus (Figure 3). VOIs were grouped according to anatomical direction: superior–inferior (closest peripheral (C_VOI), mid-peripheral (M_VOI), distant peripheral (D_VOI)), anterior (VOI 1–3)–posterior (VOI 7–9), and medial (VOI 1, 4, 7)–lateral (VOI 3, 6, 9). Particularly in the talus, VOIs that included peg of talar component (VOI 4–6) were grouped and compared with the other VOIs (VOI 1–3, 7–9). The location, distribution, and volume of osteolysis within each VOI were measured, and the volume was normalized by reference to the size of the ankle joint of each patient.
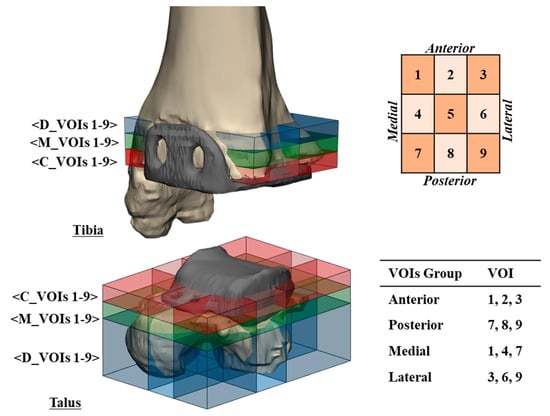
Figure 3.
Volumes of interest (VOIs) defined in the distal tibia and the proximal talus for measures of location, distribution, and volume of osteolysis. Blue, green, and red represent VOIs in distant-peripheral (D_VOIs 1–9), mid-peripheral (M_VOIs 1–9), and closest peripheral (C_VOIs 1–9) regions, respectively.
2.4. Statistical Analysis
Quantitative data are expressed as mean ± standard deviation. One-way analysis of variance (ANOVA) was performed, followed by Fisher’s least significant difference (LSD) post-hoc test for multiple comparisons, using SPSS (version 22.0, IBM Corp, Armonk, NY, USA). A p value < 0.05 was considered significant.
3. Results
There was no significant difference in the location, distribution, or volume of osteolysis according to sex, age, or BMI (p = 0.14, p = 0.60 and p = 0.97, respectively). The osteolysis volume was significantly larger in the talus than in the tibia (162.1 ± 13.6 and 54.9 ± 6.1 mm3, respectively, p = 0.00). The average osteolysis volumes in the tibia and talus are shown in Figure 4 and Figure 5, respectively.
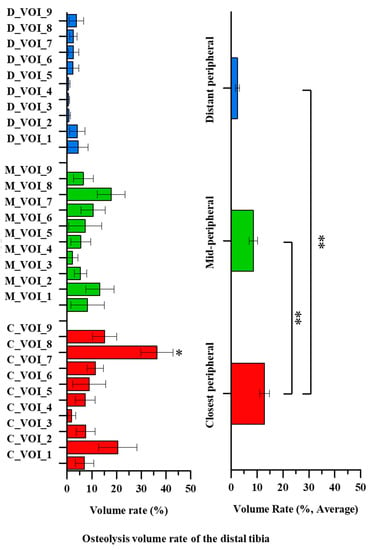
Figure 4.
The average distal tibial osteolysis volume of 12 patients. Significant differences are indicated by double asterisks (one-way ANOVA followed by Fisher’s LSD test, p < 0.05). Single asterisks indicate a significant difference compared to the center region (C_VOI_5, M_VOI_5 or D_VOI_5) (p < 0.05).
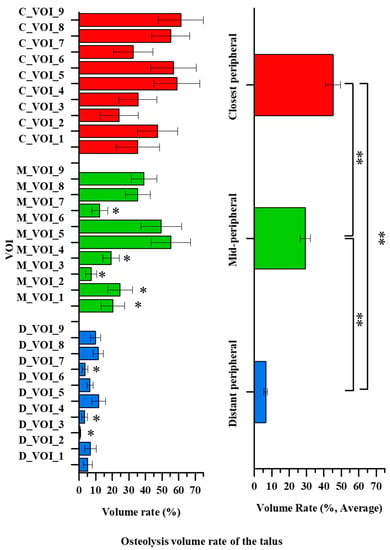
Figure 5.
The average talus osteolysis volume of the 12 patients. Significant differences are indicated by double asterisks (one-way ANOVA followed by Fisher’s LSD test, p < 0.05). Single asterisks indicate a significant difference compared to the center region (C_VOI_5, M_VOI_5 or D_VOI_5) (p < 0.05).
The osteolysis volumes in the closest peripheral and mid-peripheral tibial regions were 3.6–5.4-fold larger than in the distant peripheral region of the distal tibia (p = 0.00). The average osteolysis volume in the distant peripheral region was 2.4 ± 0.8% and did not differ significantly among the VOIs (D_VOIs 1–9) (p = 0.90). The average osteolysis volume in the mid-peripheral region was 8.5 ± 1.6% and also did not differ significant among the VOIs (M_VOIs 1–9) (p = 0.52). However, significant differences were apparent among the osteolysis volumes of the VOIs in the closest peripheral region (C_VOIs 1–9) (p = 0.00). The average osteolysis volume was 12.9 ± 1.9%. All closest peripheral VOIs differed significantly from those of the posterior region (C_VOI 8) (p < 0.05). The osteolysis volume increased in the order of the posterior (C_VOI 8), anterior (C_VOI 2), posterolateral (C_VOI 9), and posteromedial (C_VOI 7) regions. The maximum osteolysis volume was about 18-fold larger than the minimum one (36.3 ± 6.5% and 1.8 ± 1.6%, respectively, p = 0.00).
The osteolysis volume in the closest peripheral region of the talus was 1.6–6.9-fold larger than in the distant peripheral and mid-peripheral regions (p = 0.04). The average osteolysis volume in the closest peripheral region was 45.2 ± 4.2% and did not differ significantly among the VOIs (C_VOIs 1–9) (p = 0.32). However, in the mid-peripheral region, a significant difference in the osteolysis volumes was seen among the VOIs (M_VOIs 1–9) (p = 0.00). The average osteolysis volume in the mid-peripheral region was 29.3 ± 3.0%. The average volumes in the anteromedial region (M_VOI 1), anterior region (M_VOI 2), anterolateral region (M_VOI 3), medial region (M_VOI 4), and posteromedial region (M_VOI 7) were significantly smaller than those in the center (M_VOI 5) and lateral (M_VOI 6) regions (p < 0.05). The osteolysis volume was higher in the order of the center (M_VOI 5), lateral (M_VOI 6), posterolateral (M_VOI 9), and posterior (M_VOI 8) regions. The maximum osteolysis volume was about 8-fold larger than the minimum one (55.3 ± 11.3% and 7.3 ± 3.2%, respectively, p = 0.0). The osteolysis volume in the distant peripheral region differed significantly among the VOIs (D_VOIs 1–9) (p = 0.04). The average osteolysis volume was 6.6 ± 0.9%. The anterolateral (D_VOI 3), medial (D_VOI 4), and posteromedial (D_VOI 7) volumes were significantly lower than those of the center (D_VOI 5) and posterior (D_VOI 8) regions (p < 0.05). The osteolysis volume was generally higher in the order of the center (D_VOI 5), posterior (D_VOI 8), posterolateral (D_VOI 9), and anterior (D_VOI 2) regions. The maximum osteolysis volume was about 24-fold larger than the minimum one (11.6 ± 4.1% and 0.5 ± 0.3%, respectively, p = 0.00).
The osteolysis volume in the anterior–posterior region group of the tibia did not differ significantly (7.9 ± 1.6% and 11.9 ± 1.7%, respectively, p = 0.09). In the medial–lateral region group of the tibia, the osteolysis volume did not differ significantly (5.4 ± 1.2% and 6.4 ± 1.4%, respectively, p = 0.60). However, the osteolysis volume in the posterior region group of the talus was 1.5-fold larger than in the anterior region group of the talus (29.0 ± 3.3% and 19.1 ± 2.9%, respectively, p = 0.03). The osteolysis volume in the lateral region group of the talus was 1.5-fold larger than in the medial region group of the talus (28.3 ± 3.6% and 18.6 ± 2.8%, respectively, p = 0.04). Additionally, the osteolysis volume for near talar pegs region group was significantly higher than that of the other regions groups (45.9 ± 4.9% and 21.6 ± 2.0%, respectively, p =0.00).
4. Discussion
The osteolysis patterns in this study were similar to those reported previously for third-generation TAA systems [15,16,33,34]. Osteolysis was primarily confined to peri-prosthetic regions, such as the talus body, rather than the talus neck. However, previous studies lacked detailed quantitative data. Osteolysis caused by stress-shielding may develop within periprosthetic bone regions with a small load due to the difference in material properties between bone and the metallic implant [38]. The fixation configurations, and the stress flow and distribution, of TAA systems are modifiable, and may not currently be optimal in certain regions of the distal tibia and talus [19,26]. Dahr et al. found that osteolysis can develop if the stress flow and distribution in bone are suboptimal [18]. Low strain after TAA within periprosthetic bone, caused by changes in stress flow and distribution, may promote osteolysis [18]. The contribution of changes in stress flow and distribution to osteolysis (caused by stress-shielding) must be analyzed, because it may be possible to reduce the risk of osteolysis by inducing the appropriate stress within the distal tibia and talus. This study is the first to perform a 3D analysis of osteolysis characteristics in an attempt to improve TAA design.
Extensive osteolysis was generally confined to regions near the talar pegs. These regions (Talar VOIs 4–6) exhibited 24.2 ± 4.5% more osteolysis than other talar regions (Talar VOIs 1–3 and 7–9). Preyssas et al. radiographically evaluated several TAAs, including the SALTO (Tornier SA, Saint Ismier, France), HINTEGRA, AES (Biomet, Warsaw, IN, USA), COPPELIA (unknown manufacturer, France), STAR (Waldemar Link, Hamburg, Germany), RAMSES (Laboratoire Fournitures Hospitalières Industrie, Heimsbrunn, France), and AKILE (Lavender Medical Limited, Stevenage, UK) [36]. Bone cysts were more frequent in patients treated with the SALTO and AES, which have larger tibial stems. Most bone cysts developed at the bone-prosthesis interfaces and periphery of fixation components. Bonnin et al. reported that osteolysis was particularly common near the tibial keel of the SALTO prosthesis [16]. TAA fixation components, including the talar pegs and tibial stems, change stress flow and distribution, which can lead to osteolysis [39,40]. Terrier et al. reported high stress between the periphery of fixation components and bone, and low stress (~0–1.1 MPa) at bone–prosthesis interfaces [40] caused by changes in stress flow mediated by stress-shielding, in turn induced by differences between the bone and prosthesis. The stress induced by these differences is lower than the critical stress (0–1.46 MPa) in the periphery of fixation components. According to bone remodeling theory, there is a high risk of extensive osteolysis if the stress is below a critical stress [32,41]. However, stress flow and distribution can be altered by modifying the TAA fixation components to reduce osteolysis around the talar pegs. Thus, the osteolysis characteristics of the ankle joint after TAA may reflect the location and shape of TAA fixation components, which thus require modification.
We found that the extent of osteolysis within the peri-prosthetic region (C_VOIs) was greater than within other regions. Particularly, in the talus, osteolysis within the posterior region (VOIs 7–9) was 9.9 ± 4.4% more extensive than within the anterior region (VOIs 1–3), and osteolysis within the lateral region (VOIs 3, 6, and 9) was 9.7 ± 4.6% more extensive than within the medial region (VOIs 1, 4, and 7). Our results differed from those of previous studies reporting that osteolysis was more common in the anterior of the talus [29,35]. This may reflect the fact that screws were often placed in earlier studies, but infrequently in the current study. Insufficient stress was transferred to peripheral regions because the screws contributed to stress-shielding. Osteolysis was more common in the posterior talus than in the anterior talus when third-generation finned TAA (i.e., AES) components were placed in the posterior talus; the fins obviated the need for screws [34]. Thus, ankle joint osteolysis after TAA reflects changes in stress flow and distribution, which vary according to the design and placement of the fixation components. Thus, for TAAs with similar components, stress flow and distribution within the distal tibia and talus are also likely to be similar, as is the osteolysis pattern.
The main limitation of the current study was that we considered only one TAA system, namely the HINTEGRA. However, most of third-generation TAAs are similar in terms of stress flow and distribution because of the mobile bearings [42]. Thus, the osteolysis pattern may have similarity. Nevertheless, other systems, such as fixed bearing TAA systems and other mobile bearing TAA systems, should also be studied. Another limitation was that we focused on TAA designs, which is one of the mechanical factors, to feature osteolysis, but osteolysis can be induced by both biological and mechanical factors. A small group of patients and relatively short follow-up term could be a limitation of the current study. Nevertheless, to the best of our knowledge, this is the first study to quantify 3D periprosthetic bone characteristics in association with TAA design. The results could lead to improved TAA designs and survival rates.
In conclusion, to the best of our knowledge, this is the first study to report detailed osteolysis patterns after TAA. Aspects of TAA design, particularly fixation components, affect the incidence of osteolysis. As alluded to above, further study of both biological and mechanical factors is needed to clarify the relationship between the incidence of osteolysis and TAA design parameters.
Author Contributions
Conceptualization, H.-J.C., K.-B.L. and D.L.; investigation, S.K., J.J., J.-H.C., H.-M.Y., H.-J.C. and D.L.; validation, G.-W.L. and K.-B.L.; writing—original draft, S.K.; writing—review and editing, S.K., J.J., J.-H.C., H.-M.Y., H.-J.C., G.-W.L., K.-B.L. and D.L. All authors have read and agreed to the published version of the manuscript.
Funding
This work was supported by the the National Research Foundation of Korea (NRF) grant funded by the Korea government (MSIP) (NRF-2017M3A9E9073545) and the Korea Medical Device Development Fund grant funded by the Korea government (the Ministry of Science and ICT, the Ministry of Trade, Industry and Energy, the Ministry of Health & Welfare, the Ministry of Food and Drug Safety) (Project Number: 9991006711).
Institutional Review Board Statement
This study was approved by the Institutional Review Board (IRB) of Chonnam National University Medical School and Hospital (CNU-2019-088).
Informed Consent Statement
Informed consent was obtained from all subjects involved in the study.
Data Availability Statement
The data presented in this study are available in the article.
Conflicts of Interest
None of the authors declare competing financial interests.
References
- Pizzorno, J.E.; Murray, M.T.; Joiner-Bey, H. The Clinician’s Handbook of Natural Medicine E-Book; Elsevier Health Sciences: St. Louis, MI, USA, 2016. [Google Scholar]
- Wąsik, J.; Stołtny, T.; Pasek, J.; Szyluk, K.; Pyda, M.; Ostałowska, A.; Kasperczyk, S.; Koczy, B. Effect of Total Ankle Arthroplasty and Ankle Arthrodesis for Ankle Osteoarthritis: A Comparative Study. Med. Sci. Monit. Int. Med. J. Exp. Clin. Res. 2019, 25, 6797. [Google Scholar] [CrossRef]
- Jeyaseelan, L.; Park, S.S.-H.; Al-Rumaih, H.; Veljkovic, A.; Penner, M.J.; Wing, K.J.; Younger, A. Outcomes following total ankle arthroplasty: A review of the registry data and current literature. Orthop. Clin. 2019, 50, 539–548. [Google Scholar] [CrossRef]
- Tanaka, Y. Current Concepts in the Treatment of Osteoarthritis of the Ankle. In Sports Injuries of the Foot and Ankle; Springer: Berlin/Heidelberg, Germany, 2019; pp. 237–248. [Google Scholar] [CrossRef]
- Carender, C.N.; Glass, N.A.; Shamrock, A.G.; Amendola, A.; Duchman, K.R. Total Ankle Arthroplasty and Ankle Arthrodesis Use: An American Board of Orthopaedic Surgery Part II Database Study. J. Foot Ankle Surg. 2020, 59, 274–279. [Google Scholar] [CrossRef] [PubMed]
- Vakhshori, V.; Sabour, A.F.; Alluri, R.K.; Hatch, G.F., III; Tan, E.W. Patient and practice trends in total ankle replacement and tibiotalar arthrodesis in the United States from 2007 to 2013. JAAOS 2019, 27, e77–e84. [Google Scholar] [CrossRef] [PubMed]
- Bayliss, L.E.; Culliford, D.; Monk, A.P.; Glyn-Jones, S.; Prieto-Alhambra, D.; Judge, A.; Cooper, C.; Carr, A.J.; Arden, N.K.; Beard, D.J. The effect of patient age at intervention on risk of implant revision after total replacement of the hip or knee: A population-based cohort study. Lancet 2017, 389, 1424–1430. [Google Scholar] [CrossRef]
- Erivan, R.; Fadlallah, E.; Villatte, G.; Mulliez, A.; Descamps, S.; Boisgard, S. Fifteen-year survival of the Cedior™ total knee prosthesis. Eur. J. Orthop. Surg. Traumatol. 2019, 29, 1709–1717. [Google Scholar] [CrossRef]
- Panichkul, P.; McCalden, R.W.; MacDonald, S.J.; Somerville, L.E.; Naudie, D.N. Minimum 15-year results of a dual-offset uncemented femoral stem in total hip arthroplasty. J. Arthroplast. 2019, 34, 2992–2998. [Google Scholar] [CrossRef] [PubMed]
- Clough, T.; Bodo, K.; Majeed, H.; Davenport, J.; Karski, M. Survivorship and long-term outcome of a consecutive series of 200 Scandinavian Total Ankle Replacement (STAR) implants. Bone Jt. J. 2019, 101, 47–54. [Google Scholar] [CrossRef]
- Gross, C.E.; Palanca, A.A.; DeOrio, J.K. Design rationale for total ankle arthroplasty systems: An update. JAAOS 2018, 26, 353–359. [Google Scholar] [CrossRef] [PubMed]
- Koivu, H.; Kohonen, I.; Mattila, K.; Loyttyniemi, E.; Tiusanen, H. Medium to long-term results of 130 Ankle Evolutive System total ankle replacements—Inferior survival due to peri-implant osteolysis. Foot Ankle Surg. 2017, 23, 108–115. [Google Scholar] [CrossRef]
- Abu-Amer, Y.; Darwech, I.; Clohisy, J.C. Aseptic loosening of total joint replacements: Mechanisms underlying osteolysis and potential therapies. Arthritis Res. Ther. 2007, 9, S6. [Google Scholar] [CrossRef]
- McNeice, G.; Amstutz, H. “Modes of failure” of cemented stem-type femoral components: A radiographic analysis of loosening. Clin. Orthop. 1979, 141, 17–27. [Google Scholar] [CrossRef]
- Rodriguez, D.; Bevernage, B.D.; Maldague, P.; Deleu, P.-A.; Tribak, K.; Leemrijse, T. Medium term follow-up of the AES ankle prosthesis: High rate of asymptomatic osteolysis. Foot Ankle Surg. 2010, 16, 54–60. [Google Scholar] [CrossRef]
- Bonnin, M.; Gaudot, F.; Laurent, J.-R.; Ellis, S.; Colombier, J.-A.; Judet, T. The Salto total ankle arthroplasty: Survivorship and analysis of failures at 7 to 11 years. Clin. Orthop. Relat. Res.® 2011, 469, 225–236. [Google Scholar] [CrossRef] [PubMed]
- Lee, G.-W.; Seo, H.-Y.; Jung, D.-M.; Lee, K.-B. Comparison of Preoperative Bone Density in Patients With and Without Periprosthetic Osteolysis Following Total Ankle Arthroplasty. Foot Ankle Int. 2020, 42, 575–581. [Google Scholar] [CrossRef]
- Dhar, S.; Orth, F.E.; Sunderamoorthy, D.; Majeed, H. Cysts: Osteolysis and Stress Shielding: More Than Just Filling a Void; American Academy of Orthopaedic Surgeons: Rosemont, IL, USA, 2015. [Google Scholar]
- Espinosa, N.; Klammer, G.; Wirth, S.H. Osteolysis in total ankle replacement: How does it work? Foot Ankle Clin. 2017, 22, 267–275. [Google Scholar] [CrossRef] [PubMed]
- Kang, K.; Jang, Y.W.; Yoo, O.S.; Jung, D.; Lee, S.-J.; Lee, M.C.; Lim, D. Biomechanical characteristics of three baseplate rotational arrangement techniques in total knee arthroplasty. Biomed Res. Int. 2018, 2018. [Google Scholar] [CrossRef] [PubMed]
- Gupta, S.; Ellington, J.K.; Myerson, M.S. Management of Specific Complications After Revision Total Ankle Replacement. Semin. Arthroplast. 2010, 21, 310–319. [Google Scholar] [CrossRef]
- Tsai, J.; Pedowitz, D.I. Next-Generation, Minimal-Resection, Fixed-Bearing Total Ankle Replacement: Indications and Outcomes. Clin. Podiatr. Med. Surg. 2018, 35, 77–83. [Google Scholar] [CrossRef]
- Cracchiolo, A., III; DeOrio, J.K. Design features of current total ankle replacements: Implants and instrumentation. JAAOS 2008, 16, 530–540. [Google Scholar] [CrossRef]
- Singh, G.; Reichard, T.; Hameister, R.; Awiszus, F.; Schenk, K.; Feuerstein, B.; Roessner, A.; Lohmann, C. Ballooning osteolysis in 71 failed total ankle arthroplasties: Is hydroxyapatite a risk factor? Acta Orthop. 2016, 87, 401–405. [Google Scholar] [CrossRef]
- Hintermann, B.; Valderrabano, V. Total ankle replacement. Foot Ankle Clin. 2003, 8, 375–405. [Google Scholar] [CrossRef]
- Morasiewicz, P.; Dejnek, M.; Urbański, W.; Dragan, S.Ł.; Kulej, M.; Dragan, S.F. Radiological evaluation of ankle arthrodesis with Ilizarov fixation compared to internal fixation. Injury 2017, 48, 1678–1683. [Google Scholar] [CrossRef]
- Narain, F.; Van Zwieten, K.; Gervois, P.; Lippens, P.; Reyskens, A.; Colla, P.; Palmers, Y.; Schmidt, K.; Vandersteen, M.; Biesmans, S.; et al. Human foot inversion prior to toe-off: An analysis by means of functional morphology, and comparative anatomical observation. In Proceedings of the 9th International Conference BIOMDLORE, Białystok, Poland, 9–11 September 2009; Volume 11, pp. 530–535. [Google Scholar]
- Wang, Y.; Li, Z.; Wong, D.W.-C.; Cheng, C.-K.; Zhang, M. Finite element analysis of biomechanical effects of total ankle arthroplasty on the foot. J. Orthop. Transl. 2018, 12, 55–65. [Google Scholar] [CrossRef]
- Yoon, H.S.; Lee, J.; Choi, W.J.; Lee, J.W. Periprosthetic osteolysis after total ankle arthroplasty. Foot Ankle Int. 2014, 35, 14–21. [Google Scholar] [CrossRef]
- van Wijngaarden, R.; van der Plaat, L.; Weme, R.A.N.; Doets, H.C.; Westerga, J.; Haverkamp, D. Etiopathogenesis of osteolytic cysts associated with total ankle arthroplasty, a histological study. Foot Ankle Surg. 2015, 21, 132–136. [Google Scholar] [CrossRef] [PubMed]
- Goodman, S.B.; Gallo, J. Periprosthetic Osteolysis: Mechanisms, Prevention and Treatment. J. Clin. Med. 2019, 8, 2091. [Google Scholar] [CrossRef] [PubMed]
- Frost, H.M. Dynamics of bone remodeling. In Bone Biodynamics; Frost, H.M., Ed.; Little and Brown: Boston, MA, USA, 1964; pp. 315–334. [Google Scholar]
- y Hernandez, J.L.; Laffenêtre, O.; Toullec, E.; Darcel, V.; Chauveaux, D. AKILE™ total ankle arthroplasty: Clinical and CT scan analysis of periprosthetic cysts. Orthop. Traumatol. Surg. Res. 2014, 100, 907–915. [Google Scholar] [CrossRef] [PubMed][Green Version]
- Kohonen, I.; Koivu, H.; Pudas, T.; Tiusanen, H.; Vahlberg, T.; Mattila, K. Does computed tomography add information on radiographic analysis in detecting periprosthetic osteolysis after total ankle arthroplasty? Foot Ankle Int. 2013, 34, 180–188. [Google Scholar] [CrossRef]
- Deleu, P.-A.; Devos Bevernage, B.; Gombault, V.; Maldague, P.; Leemrijse, T. Intermediate-term results of mobile-bearing total ankle replacement. Foot Ankle Int. 2015, 36, 518–530. [Google Scholar] [CrossRef] [PubMed]
- Preyssas, P.; Toullec, E.; Henry, M.; Neron, J.-B.; Mabit, C.; Brilhault, J. Total ankle arthroplasty—Three-component total ankle arthroplasty in western France: A radiographic study. Orthop. Traumatol. Surg. Res. 2012, 98, S31–S40. [Google Scholar] [CrossRef] [PubMed][Green Version]
- Puri, L.; Wixson, R.L.; Stern, S.H.; Kohli, J.; Hendrix, R.W.; Stulberg, S.D. Use of helical computed tomography for the assessment of acetabular osteolysis after total hip arthroplasty. JBJS 2002, 84, 609–614. [Google Scholar] [CrossRef]
- Mondal, S.; Ghosh, R. Pre-clinical Analysis of Implanted Ankle Joint Using Finite Element Method. In Advances in Fluid Mechanics and Solid Mechanics; Springer Nature: Singapore, 2020; pp. 129–137. [Google Scholar] [CrossRef]
- Sopher, R.S.; Amis, A.A.; Calder, J.D.; Jeffers, J.R. Total ankle replacement design and positioning affect implant-bone micromotion and bone strains. Med. Eng. Phys. 2017, 42, 80–90. [Google Scholar] [CrossRef]
- Terrier, A.; Larrea, X.; Guerdat, J.; Crevoisier, X. Development and experimental validation of a finite element model of total ankle replacement. J. Biomech. 2014, 47, 742–745. [Google Scholar] [CrossRef]
- Martin, R. Toward a unifying theory of bone remodeling. Bone 2000, 26, 1–6. [Google Scholar] [CrossRef]
- Usuelli, F.G.; Maccario, C.; Indino, C.; Manzi, L.; Romano, F.; Gross, C.E. Evaluation of Hindfoot Alignment after Fixed-and Mobile-Bearing Total Ankle Prostheses. Foot Ankle Int. 2020, 41, 286–293. [Google Scholar] [CrossRef] [PubMed]
Publisher’s Note: MDPI stays neutral with regard to jurisdictional claims in published maps and institutional affiliations. |
© 2021 by the authors. Licensee MDPI, Basel, Switzerland. This article is an open access article distributed under the terms and conditions of the Creative Commons Attribution (CC BY) license (https://creativecommons.org/licenses/by/4.0/).